Sample Category Title
Bitcoin Price Falls Short of Record High, Drops Below $70k
The BTC/USD chart shows the following:
→ Bitcoin’s all-time high is around $73,750 per coin, set on March 14, 2024, amid peak investor interest after the SEC approved a Bitcoin ETF on January 11.
→ This autumn, Bitcoin’s price is exhibiting positive momentum, partly fueled by the potential for Donald Trump to win the U.S. presidential election (with results expected on November 6). At a July cryptocurrency conference in Nashville, Trump promised support for the industry, raising hopes among crypto investors that his victory could drive Bitcoin prices to $100,000 or higher. Standard Chartered’s analyst has predicted that BTC/USD could reach $125,000 if Trump wins.
→ This week, Bitcoin’s price approached its all-time high but turned downward (as indicated by the arrow) just shy of reaching it, and has since fallen below the psychological level of $70,000 per coin.
What’s next?
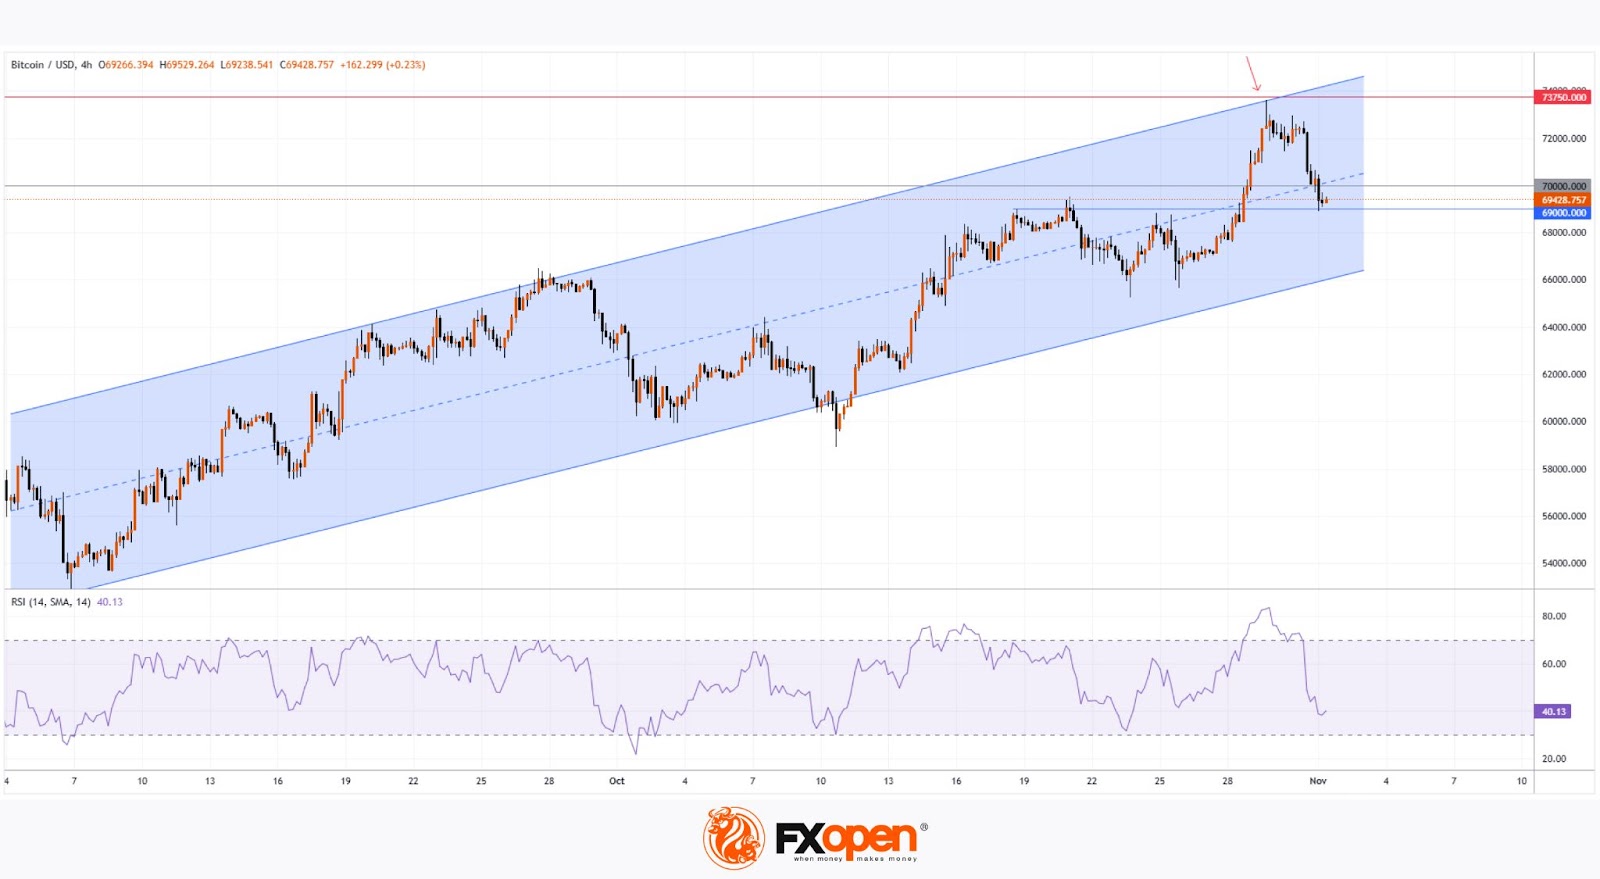
Today’s technical analysis of the BTC/USD chart suggests:
→ Bitcoin’s autumn price fluctuations are forming an upward channel (shown in blue), constructed using linear regression. Currently, BTC’s price is positioned in the channel’s lower half.
→ The $69k level, which previously acted as resistance, now serves as support, though it may be breached, in which case the price may move toward the channel’s lower boundary.
The Crypto Fear and Greed Index currently stands at 75, indicating a “Greed” sentiment. Given this high level of emotional volatility, it’s possible that:
→ The recent drop represents a short-term correction after the RSI indicator flagged the market as overbought in the lead-up to the election and the approach of the all-time high.
→ The overall uptrend may persist, potentially pushing Bitcoin toward a new record high.
FXOpen offers the world's most popular cryptocurrency CFDs*, including Bitcoin and Ethereum. Floating spreads, 1:2 leverage — at your service. Open your trading account now or learn more about crypto CFD trading with FXOpen.
*At FXOpen UK and FXOpen AU, Cryptocurrency CFDs are only available for trading by those clients categorised as Professional clients under FCA Rules and Professional clients under AFSL 412871 – ABN 61 143 678 719 respectively. They are not available for trading by Retail clients.
This article represents the opinion of the Companies operating under the FXOpen brand only. It is not to be construed as an offer, solicitation, or recommendation with respect to products and services provided by the Companies operating under the FXOpen brand, nor is it to be considered financial advice.
AUDUSD Holds Near August Lows: US Dollar Pressure Remains Strong
The AUD/USD pair fell to 0.6566 on Friday, marking its lowest since early August. The US dollar continued to strengthen last night, bolstered by signs of resilience in the US economy. Additionally, investors hold significant expectations for Donald Trump’s success in the upcoming presidential election next week.
Meanwhile, an unexpected improvement in Chinese manufacturing activity provided noticeable support for the Aussie. Given that China is Australia’s key trade and economic partner, the Australian dollar is highly responsive to developments in China.
Annual inflation in Australia eased to 3.5% in Q3 but remains above the Reserve Bank of Australia’s target range of 2.0-3.0%. Producer prices rose more than expected in the third quarter, while retail sales declined in September. These mixed signals are keeping the Aussie under pressure.
Baseline expectations suggest the Reserve Bank of Australia will leave the interest rate unchanged at 4.35% at its meeting next week.
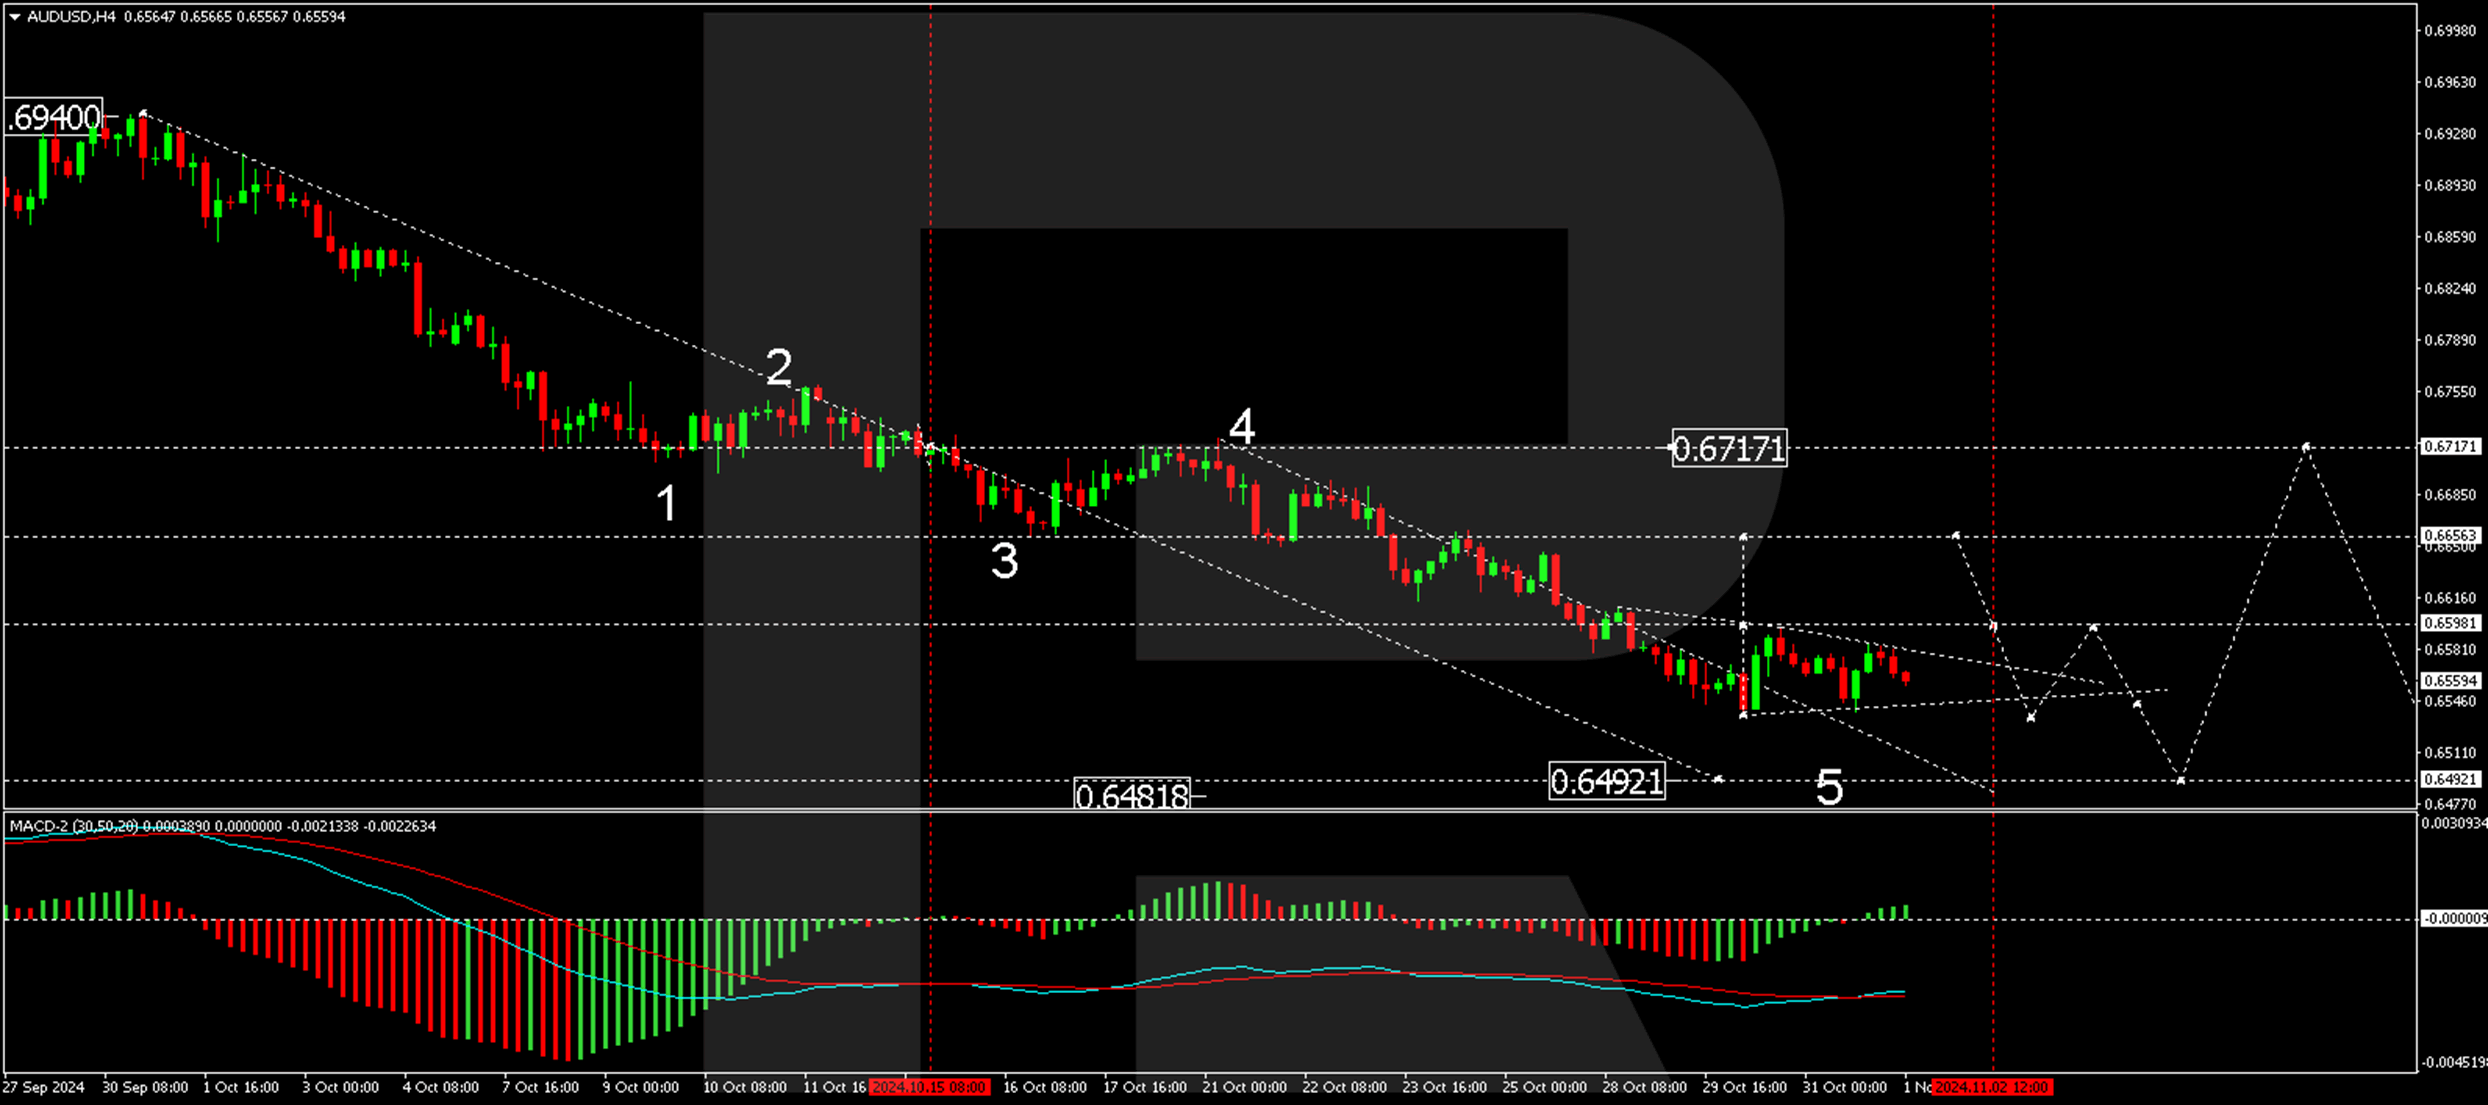
Technical analysis of AUD/USD
On the H4 chart, the AUD/USD market completed a wave of decline to 0.6536. Today, the market is forming a consolidation range above this level. An upward breakout would signal the development of a growth wave towards 0.6656, viewed as a correction to the previous downtrend. Once this correction is completed, we may see a new decline towards 0.6492. Technically, this scenario is supported by the MACD indicator, with its signal line below zero near the lows and preparing to turn upwards.
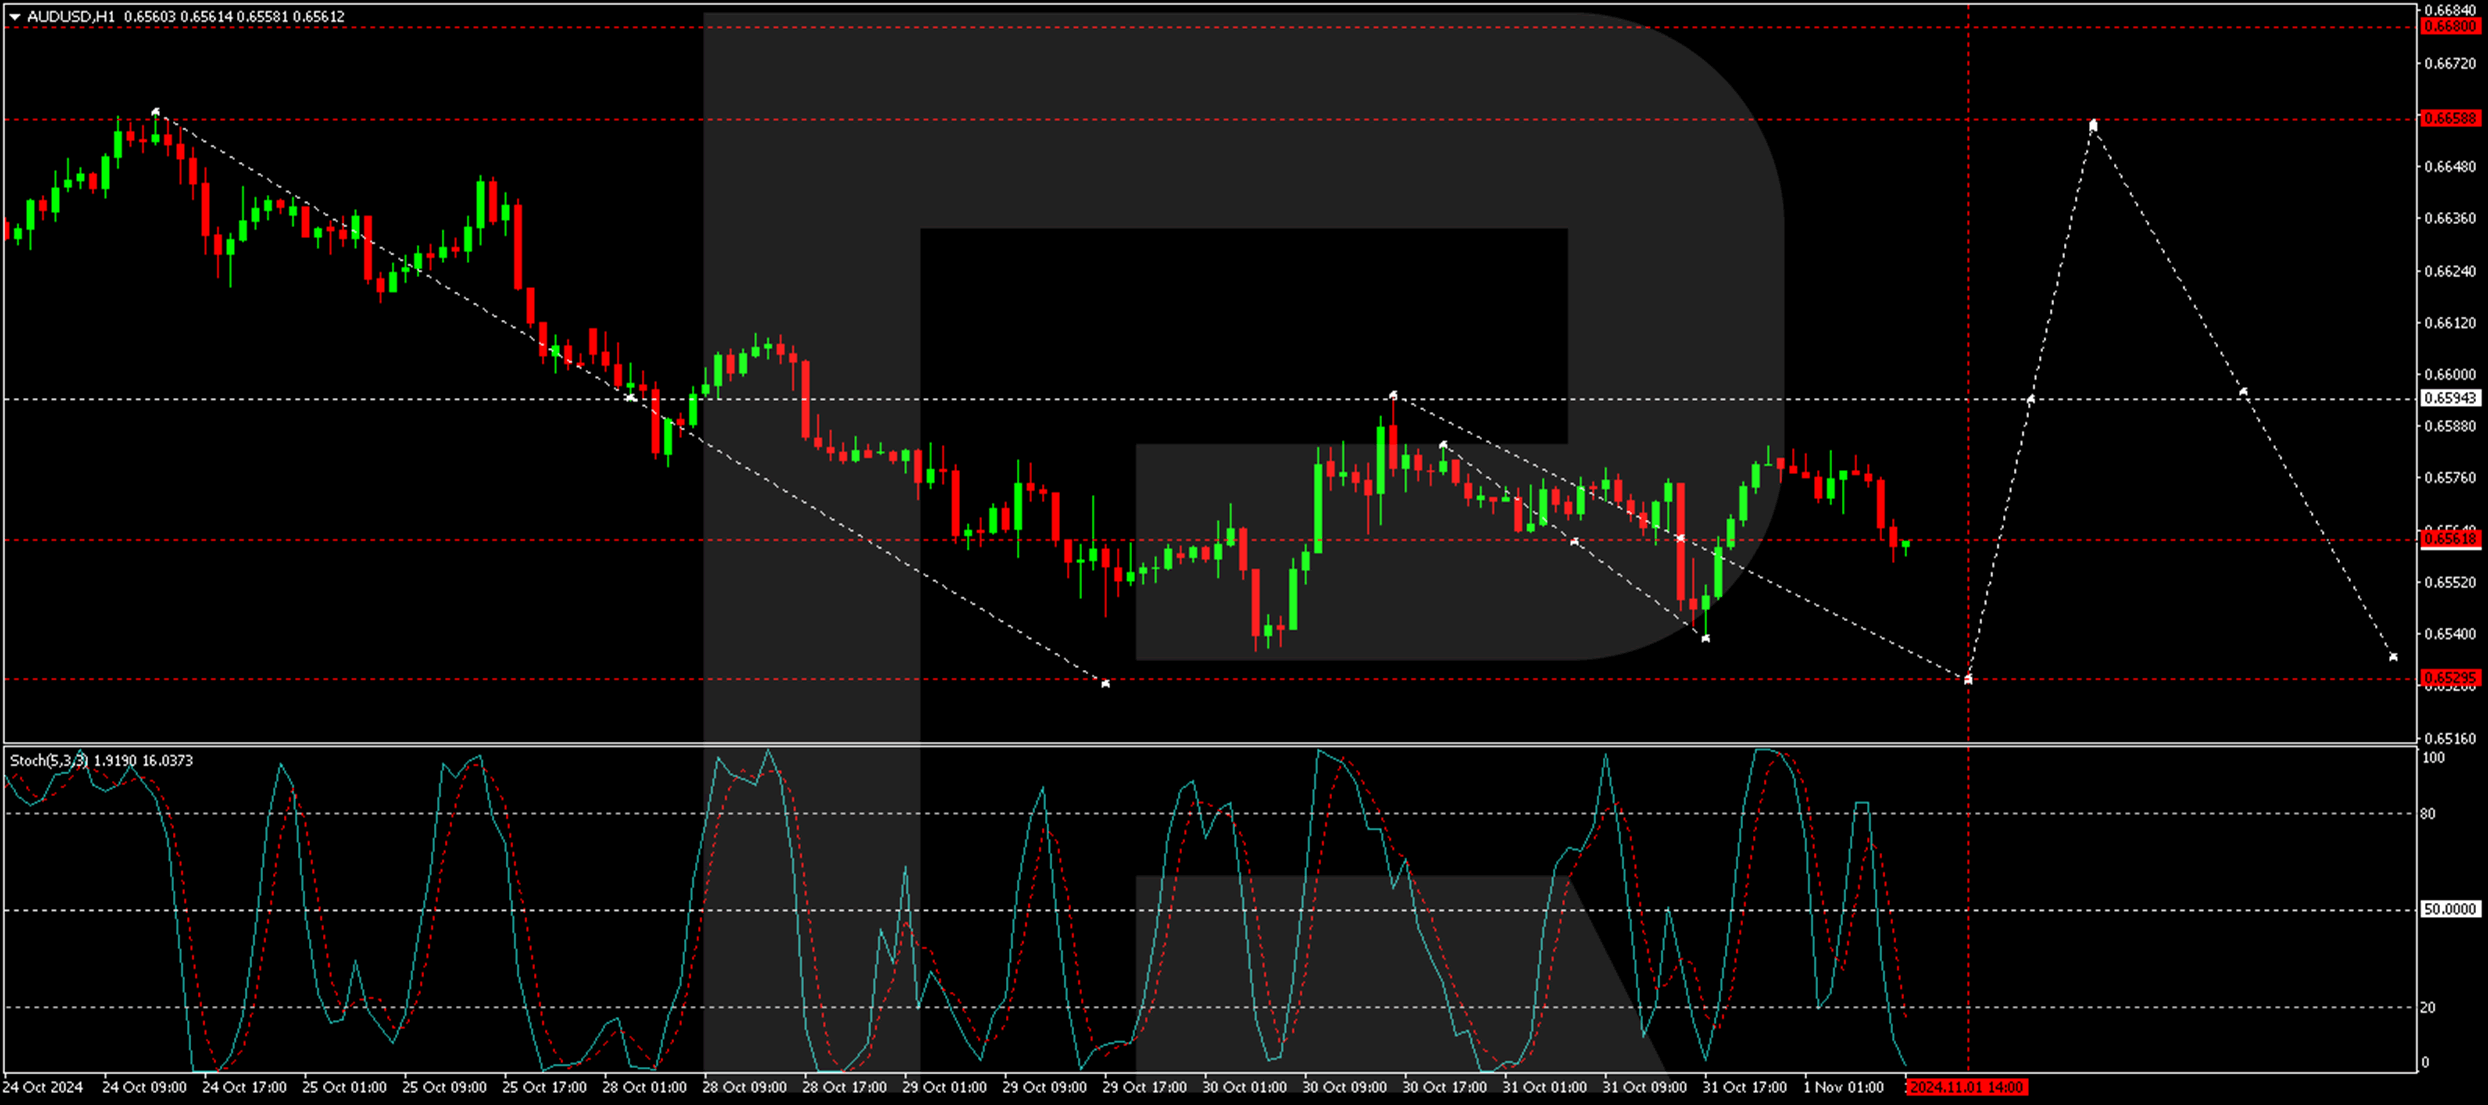
On the H1 chart, the AUD/USD market has formed a consolidation range around 0.6561, with a potential extension towards 0.6530. After this, we may see the beginning of an upward wave targeting 0.6655 as the first objective. This growth structure is expected to be part of a broader correction. Technically, this scenario is also confirmed by the Stochastic oscillator, with its signal line below the 20 mark and preparing to rise towards 80.
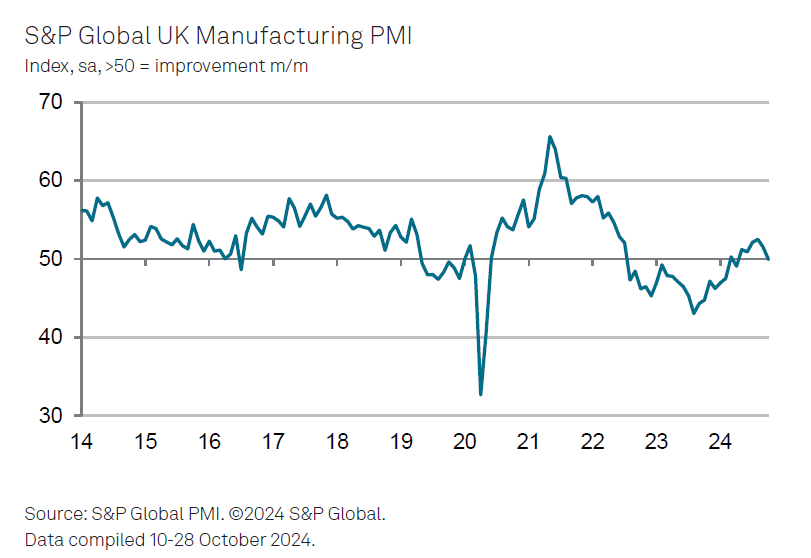
UK PMI manufacturing finalized at 49.9, wait-and-see ahead of budget
UK’s PMI Manufacturing was finalized at 49.9 for October, down from September's 51.5, marking the first contraction since April.
Rob Dobson, Director at S&P Global Market Intelligence, noted that the sector has entered Q4 on an "uncertain footing," as businesses adopt a wait-and-see approach amid policy speculation leading up to the recent Budget. This cautious stance has weighed on investment and spending, with business optimism hovering just above September’s nine-month low.
However, there was positive news on inflation. Input costs dropped to a 10-month low, with inflation easing significantly—one of the largest declines in the survey’s 33-year history. Selling price inflation also moderated, giving BoE additional flexibility to support growth should demand weaken further.
Looking forward, Dobson noted that November’s PMI release will be closely watched for signs of how the Budget impacts business conditions and confidence level.
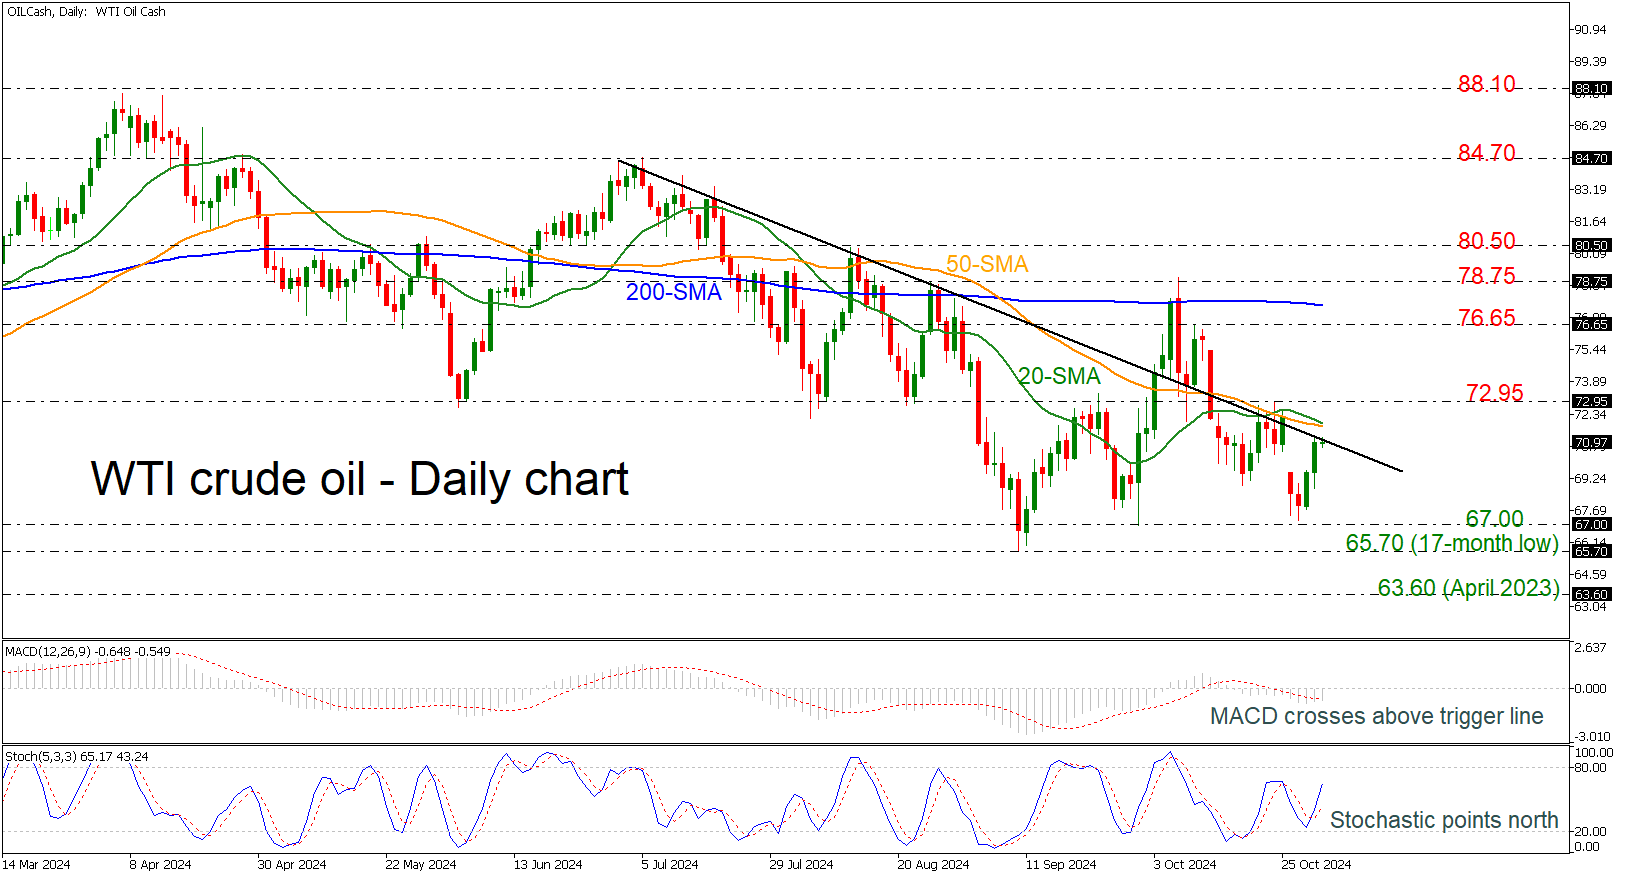
WTI Crude Oil Recoups Bearish Gap
- WTI crude oil runs to 71.00 critical level near downtrend line
- Momentum oscillators reflect positive bias
WTI crude oil prices recovered the bearish gap that was created in the preceding week and is currently testing the medium-term downtrend line near 71.00.
The price has added more than 6% over the last couple of days with the technical oscillators mirroring the latest upward wave. The MACD oscillator jumped above its trigger line beneath the zero area, while the stochastic is heading north after the bullish crossover within its %K and %D lines above the 20 zone.
An extension to the upside and above the 71.00 key level could meet the area between the 20- and the 50-day simple moving averages (SMAs) at 71.80. Further up, resistance could run towards the 72.95 bar, which is taken from the latest high. Steeper increases could also reach the 76.65 hurdle ahead of the significant flat 200-day SMA at 77.60.
On the other hand, if the commodity weakens, the 67.00 round number could provide immediate support ahead of the 17-month low of 65.70. Even lower, the April 2023 trough at 63.60 could attract a greater attention as any leg lower could worsen market’s bearish outlook.
Regarding the medium-term picture, given that bearish sentiment deteriorated after the downfall toward 65.70 only a move above 78.75 could now help the market return to neutrality.
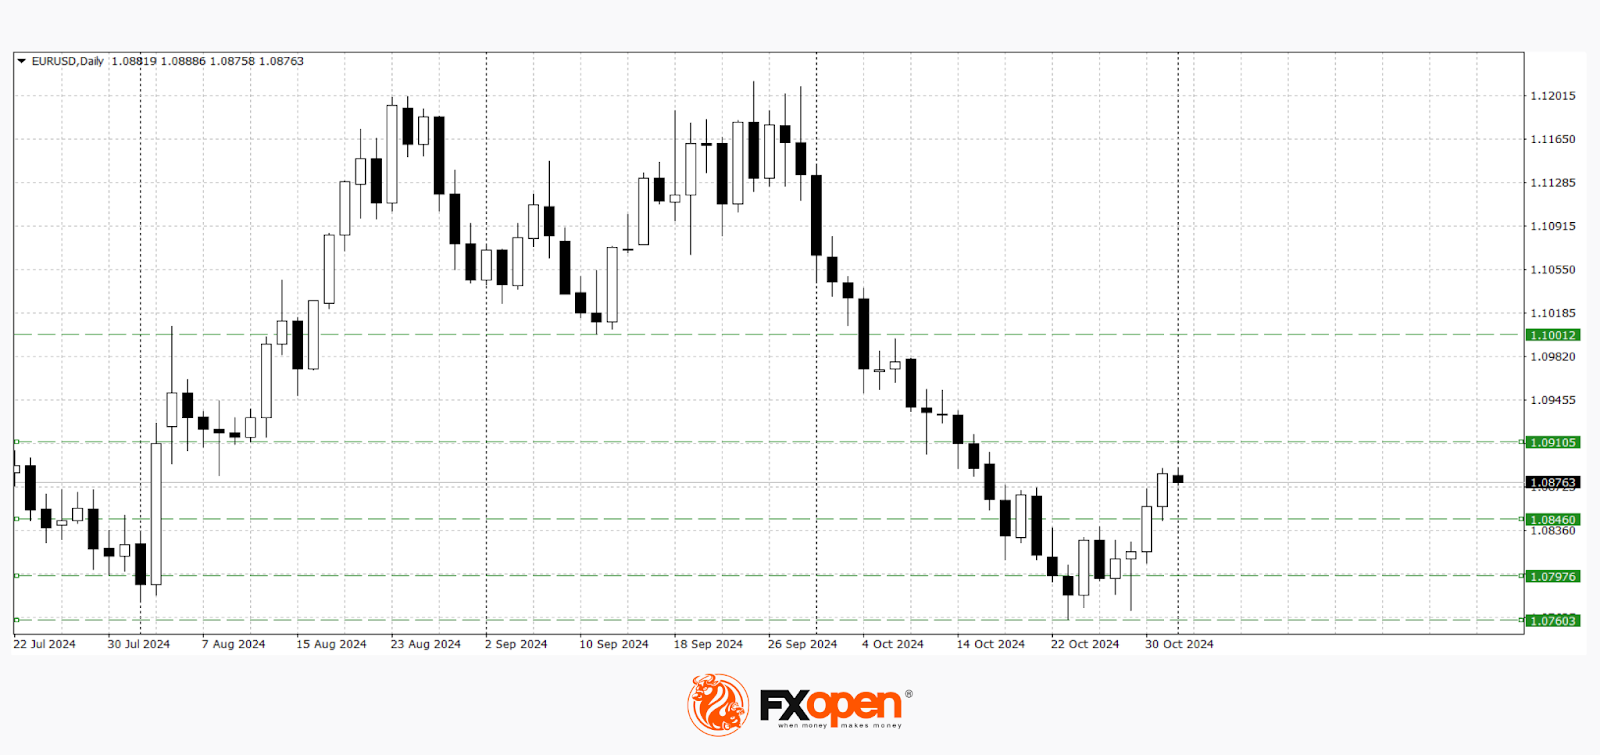
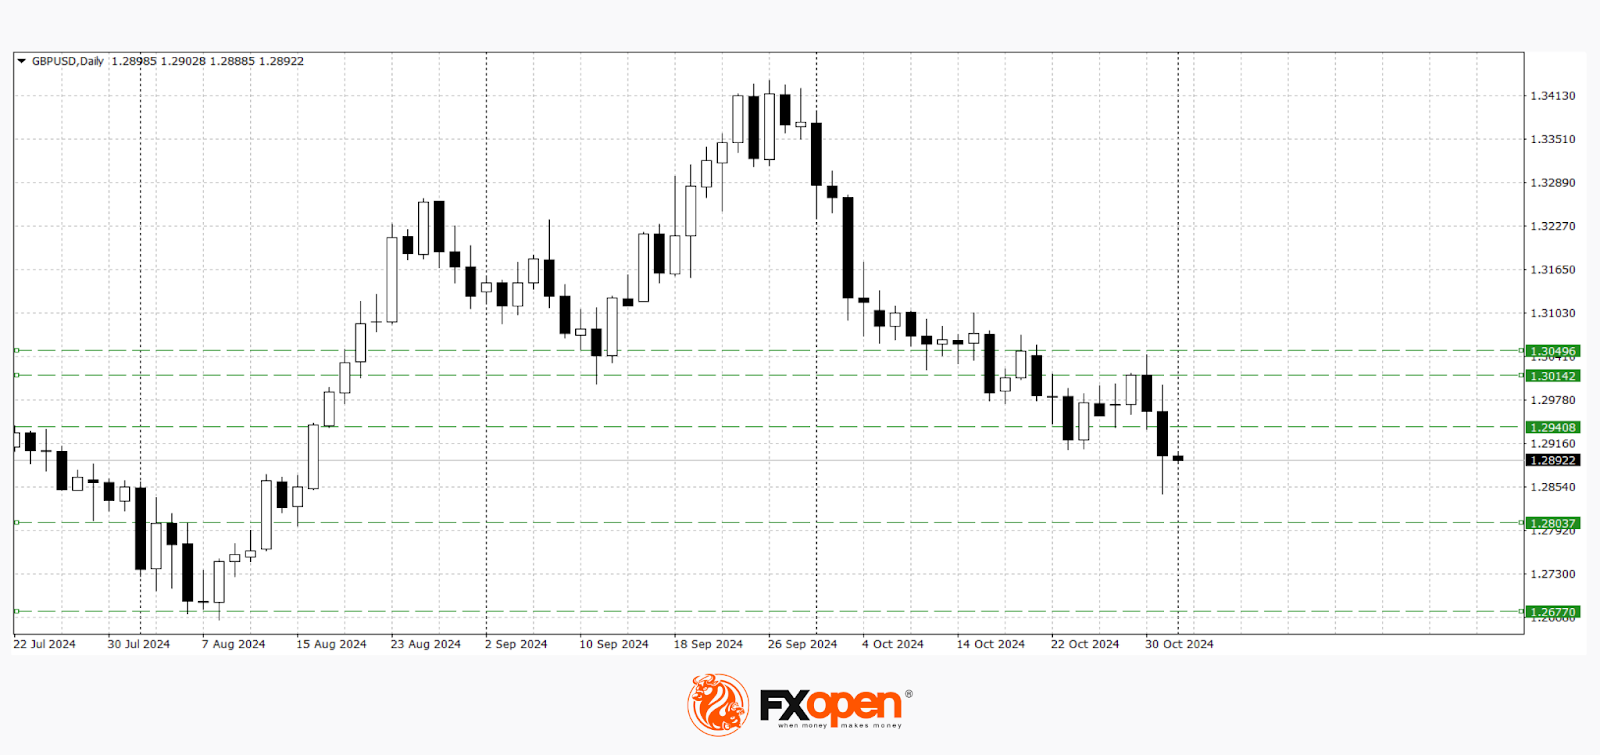
Euro Retreats from Recent Lows, Pound Plummets After Budget Data Release
In recent trading sessions, European currencies have shown mixed performance. The EUR/USD pair found support just below the 1.0800 level, while GBP/USD plunged below the critical 1.2900 support. Today, investors and market participants are awaiting U.S. labour market data, while next week’s U.S. election adds to the anticipation. This could lead to sharp increases in volatility for both pairs, with current trends potentially either intensifying or shifting dramatically.
EUR/USD
Recent macroeconomic data from the Eurozone has been relatively positive this week. For instance, Germany’s GDP for Q3, released on Wednesday, posted a 0.2% growth, beating the forecasted -0.1%. Similarly, the Eurozone’s GDP and the October Consumer Price Index (CPI) both showed positive trends.
Technical analysis of EUR/USD suggests the possibility of an upward movement, provided the price remains above 1.0800. If the U.S. Nonfarm Payrolls data proves positive, the pair could retest recent lows around the 1.0780-1.0760 range.
Key events for EUR/USD today:
- 15:30 (GMT +3:00) – U.S. ADP Non-Farm Employment Change;
- 15:30 (GMT +3:00) – U.S. Average Earnings data;
- 16:45 (GMT +3:00) – U.S. Manufacturing PMI for October.
GBP/USD
At the start of the current trading week, GBP/USD managed to strengthen to 1.3000. However, following the release of the UK’s Autumn Budget on Wednesday, the price saw a sharp decline, breaking through the crucial support level of 1.2900. Currently, the pair is testing this level as a resistance. A rejection at this point could push the downward trend towards 1.2800-1.2700. Conversely, a hold above 1.2900 could see the pair retest the 1.3000 level.
Trade over 50 forex markets 24 hours a day with FXOpen. Take advantage of low commissions, deep liquidity, and spreads from 0.0 pips. Open your FXOpen account now or learn more about trading forex with FXOpen.
This article represents the opinion of the Companies operating under the FXOpen brand only. It is not to be construed as an offer, solicitation, or recommendation with respect to products and services provided by the Companies operating under the FXOpen brand, nor is it to be considered financial advice.
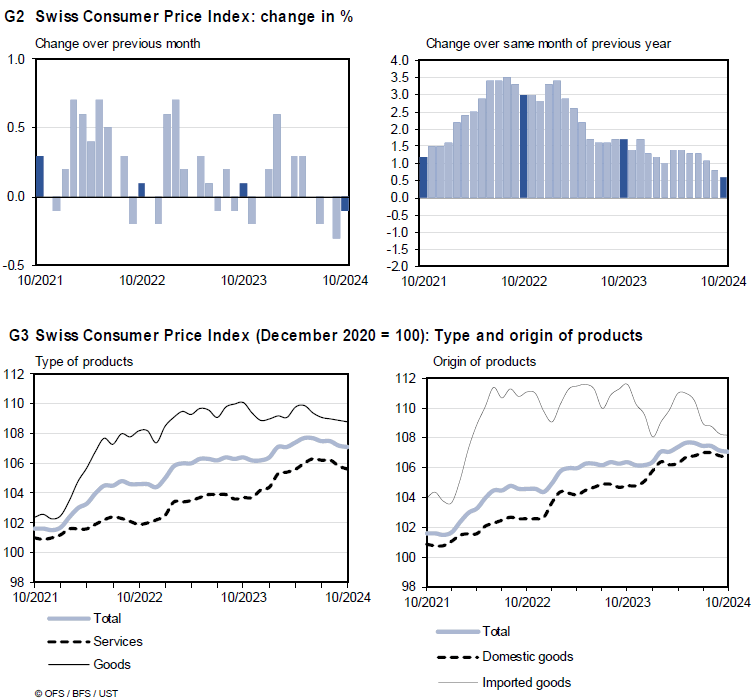
Swiss CPI down further to 0.6% yoy in Oct
Switzerland’s CPI decreased by -0.1% mom in October, missing expectations of flat growth. Core CPI, which excludes fresh and seasonal products, energy, and fuel, edged up by 0.1% mom. Prices for both domestic and imported products each declined by -0.1% month-over-month.
On an annual basis, headline CPI dropped to 0.6% yoy from 0.8% yoy, falling short of the anticipated 0.8% yoy increase. Core CPI similarly softened, slipping from 1.0% yoy to 0.8% yoy. Domestic product prices grew at a slower pace, declining from 2.0% yoy to 1.8% yoy, while imported product prices saw a deeper contraction, from -2.7% yoy to -3.1% yoy.
It is time for NFP
In focus today
In the US, focus will be on US October Jobs Report. We think non-farm payrolls growth slowed down to 130k (Sep: 254k) both due to weather-related distortions and less favourable seasonal adjustment. Average monthly earnings growth likely slowed down to 0.2% m/m s.a. and unemployment rate remained steady at 4.1%. Later, markets will also closely follow the ISM Manufacturing index for October, the flash PMIs pointed towards still stagnating growth in the manufacturing sector.
In Sweden, PMI for the manufacturing sector is due at 08:30 CET. The overall index has hovered above the 50 level for most of the year and at 51.3 in September. However, the very weak NIER survey alongside declining new orders and rising delivery times suggest that there could be a setback in PMI as well, possibly below the 50-threshold. If PMI drops, it will add another 'soft activity' argument for the Riksbank to cut by 50bp next week.
In Norway, we receive the unemployment rate for October. The Norwegian labour market remains relatively tight, with continued growth in employment and only a moderate rise in unemployment, even though growth has been weak for more than a year. This is resulting in productivity growth being weak, and partly negative. We expect that unemployment will continue to rise moderately beyond 2025 even if growth picks up as productivity picks up. We also believe that this tendency was visible in the October figures, but the unemployment rate was most likely unchanged at 2.1% s.a.
In Switzerland, inflation figures for October will be released at 08:30 CET. Consensus expects headline to remain unchanged at 0.8% in October (vs the SNB Q4 forecast at 1.0% y/y) and similarly for core to stay put at 1.0%.
Economic and market news
What happened overnight
In China, Caixin PMI rose to 50.3 in October (cons: 49.7, prior: 49.3) largely helped by stimulus measures helping pick up the economy. The manufacturing activity expanded for the first time since April, indicating signs of economic stabilization. This supports the picture painted by the official PMIs for October, which also suggested economic recovery.
What happened yesterday
In euro area, HICP inflation in October came in at 2.0% in October (cons: 1.9%, prior: 1.74%). The increase was driven by energy inflation and food prices while core inflation was unchanged at 2.68% y/y (cons: 2.6%, prior: 2.66%). The increase in core inflation of 0.20% m/m s.a. was mainly driven by service prices rising 0.3% m/m with goods prices unchanged at 0.0% m/m. The October release mimics the picture we saw in the recent months (except September) of underlying inflation slowly moving lower amid a still elevated services price pressure but clearly absent goods price inflation. It shows that the very soft data in September was only a "blip". As momentum in inflation is still heading in the right direction, but not as fast as the September data suggested, today's inflation data supports the case for a 25bp cut by the ECB in December against a "jumbo" cut.
The unemployment rate declined to an all-time low of 6.3% in September (cons: 6.4%, prior: 6.4%). However, the number of unemployed persons rose slightly by 13k indicating an overall stagnant labour market but at a historically strong level. The small increase in the number of unemployed persons was due to France while the number in Germany surprisingly fell in Eurostat's measure. The hard data on labour market remains strong also supporting the case for gradual cuts by the ECB.
In the US, the September PCE data came out close to expectations, with core PCE price index increasing by 0.3% m/m (cons: 0.3, prior: 0.1%). Core services PCE inflation picked up slightly from the previous month with 0.3% m/m s.a. (prior: 0.2%) but nothing dramatic. We also got the latest weekly jobless claims surprising to the strong side with 216k (prior: 227k) and the Q3 Employment Cost Index surprising to the downside (wages and salaries up +0.8% q/q, from +0.9%). Even if the decline in jobless claims could reflect fading weather-effects, the data overall supports the soft-landing story. Cost pressures are fading but broader labour market conditions remain solid.
In the UK, in response to UK budget concerns GBP was one of the big losers yesterday, with EUR/GBP breaking through the 0.84 mark, and UK yields continued climbing. We think that ultimately concerns will fade, and markets will calm with BoE meeting coming up on Thursday. However, we acknowledge that the expansionary budget, primarily funded through increased borrowing coupled with recent rise in borrowing costs makes the case for fiscal sustainability increasingly difficult. This may lead to a pull-back on certain measures from the Labour government.
In the Middle East, while there seems to be some optimism around a 60-day pause in fighting for Lebanon, Hamas announced yesterday that they will reject any offer that would not bring a permanent end to the war in Gaza. Meanwhile, in Iran, two top officials said that the country plans to respond to Israel's missile attack. Whether and how Iran would respond, remains unclear. Israel's recent attack severely damaged Iran's defence capabilities, and hence, it is now more vulnerable to any attacks coming from Israel. Anonymous government sources in Iran said that they are preparing a list of military targets in Israel but that the attack would very likely happen only after US election.
Equities: Global equities declined yesterday, marking the first significant drop in a while, with pronounced sector disparities and again not driven by macroeconomic factors. Although realized earnings data remains solid, this have not sufficed to meet the elevated outlook expectations, particularly for technology companies. The global technology sector experienced a 3% decrease yesterday, with the US suffering the most significant losses in the regional comparison. It is also noteworthy that the VIX index escalated to 23 and the MOVE index reached a new year-to-date high, despite yields being relatively flat yesterday. Given the massive influx of macro and micro news we are currently receiving, investors are evidently anxious, particularly with the impending 5 November US election, leading to derisking and event hedging. In the US yesterday, the Dow fell by 0.9%, the S&P 500 by 1.9%, Nasdaq by 2.8%, and the Russell 2000 by 1.6%. Asian markets are in the red this morning, led by Japan, which is down approximately 2.5%, while Chinese markets are bucking the trend. US and European futures are trading higher this morning, ahead of another eventful day.
FI: Yesterday's session was a bit volatile with 10Y US Treasuries rising 5bp early in the day, before falling back to the starting point yesterday at 4.30%. We saw almost the same picture in the European market, where government bond yields initially rose before declining in the afternoon. The Bund ASW-spread continues to grind tighter and as discussed in our weekly, a test of the 0bp-level seems reasonable.
FX: EUR/USD drifted to the upper end of the 1.08-1.09 range. USD/JPY declined following a BoJ hold with a slightly hawkish tone. EUR/GBP rose above 0.84, as GBP was among the big losers in yesterday's session, with UK budget concerns continuing to weigh on the currency. EUR/SEK remains around 11.60. October was an abysmal month for SEK, with losses close to 3% vs. EUR and over 5% vs. USD. EUR/NOK is approaching the 12.00 mark, trading just below.
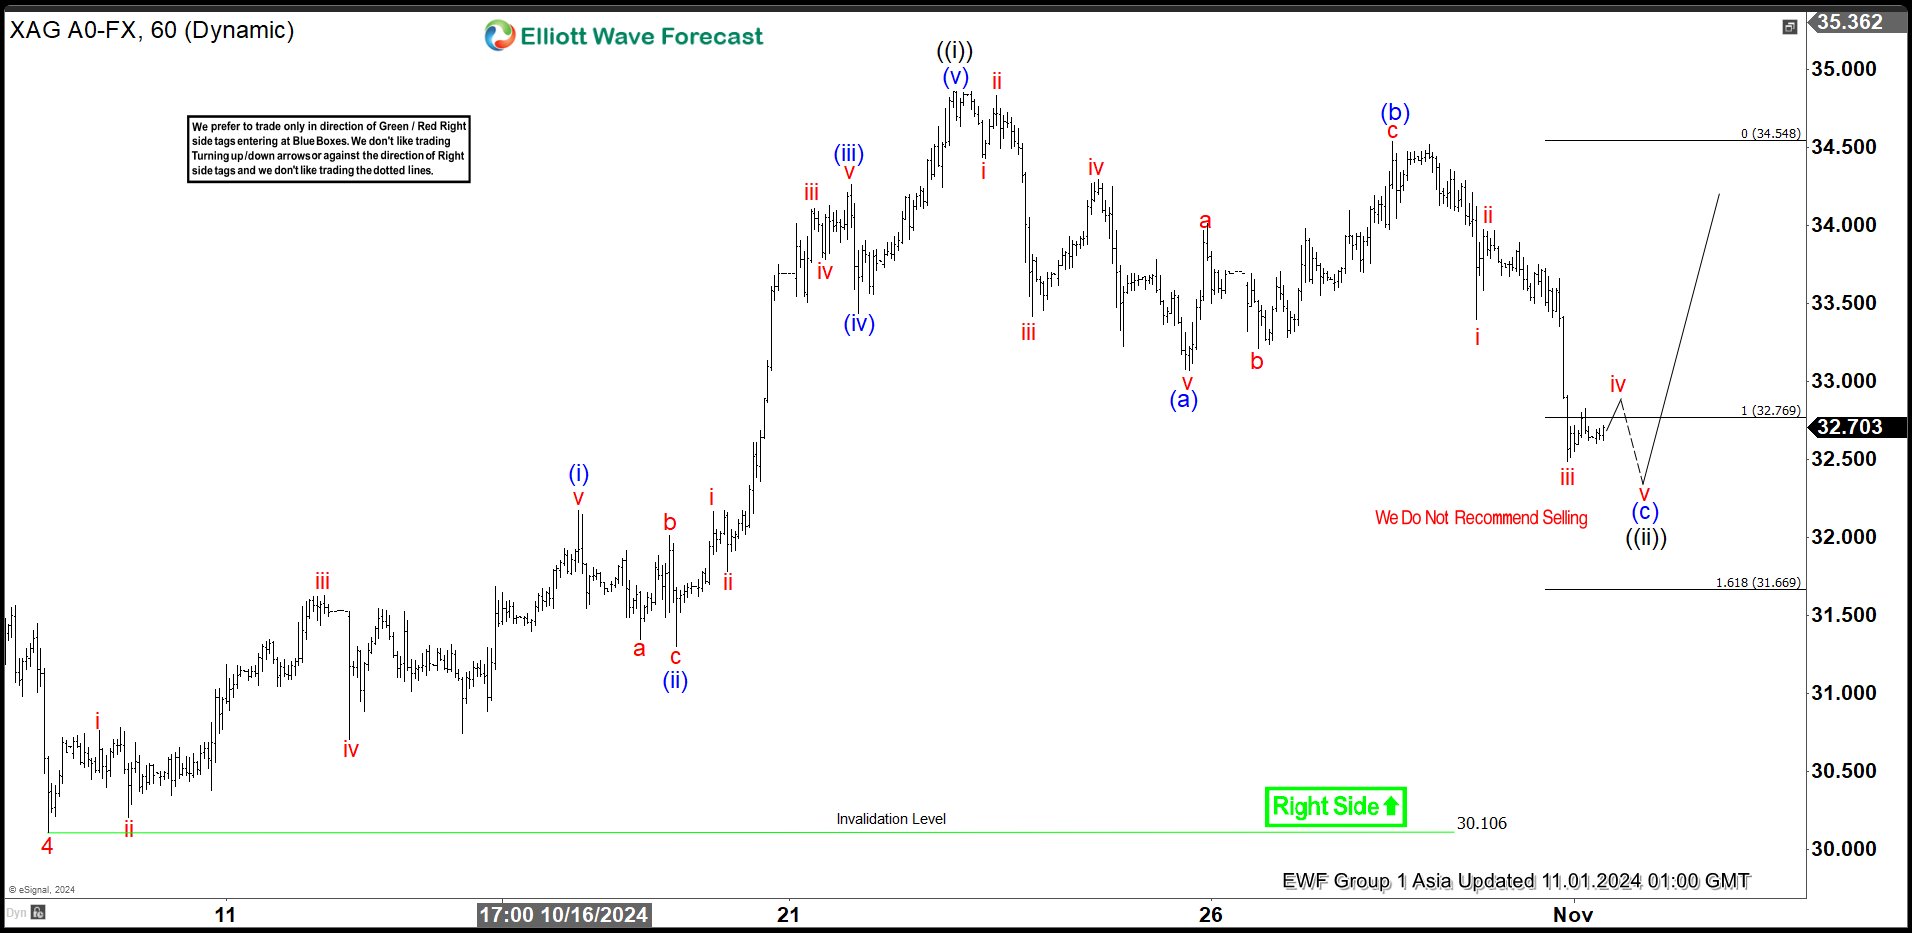
Short Term Elliott Wave in Silver (XAGUSD) Looking to Turn Higher
Short Term Elliott Wave View in Silver (XAGUSD) suggests cycle from 8.8.2024 low is in progress as a 5 waves impulse. Up from 8.8.2024 low, wave 1 ended at 30.18 and dips in wave 2 ended at 27.69. Wave 3 higher ended at 32.95 and pullback in wave 4 ended at 30.12. The metal extends higher in wave 5. Up from wave 4, wave (i) ended at 32.17 and wave (ii) pullback ended at 31.29. Wave (iii) higher ended at 34.26 and pullback in wave (iv) ended at 33.44. Final leg wave (v) ended at 34.86 which completed wave ((i)) of 5 in higher degree.
Wave ((ii)) pullback is in progress with internal subdivision as a zigzag Elliott Wave structure. Down from wave ((i)), wave i ended at 34.43 and wave ii ended at 34.83. Wave iii lower ended at 33.41 and wave iv ended at 34.29. Final wave v lower ended at 33.07 which completed wave (a). Bounce in wave (b) completed at 34.54 as a zigzag structure. Down from wave (b), wave i ended at 33.39 and wave ii ended at 33.97. Wave iii lower ended at 32.48. Expect wave iv rally and another marginal wave v lower to complete wave (c) of ((ii)) before the metal resumes higher. Near term, as far as pivot at 30.1 low stays intact, expect pullback to find support in 3, 7, 11 swing for more upside.
Silver (XAGUSD) 60Minutes Elliott Wave Chart
XAGUSD Elliott Wave Video
https://www.youtube.com/watch?v=hebx4dsAq0M
Amazon Beats, Focus on US Big Oil and Jobs Data
Equity selloff in Europe and US extended on Thursday. Technology stocks suffered the biggest losses after Microsoft and Meta – which represent nearly 10% of the S&P500 index – were hit by a 6% and a 4% decline respectively. The S&P500 closed 1.86% down – a touch above its 50-DMA - and Nasdaq 100 dived almost 2.50%. As such, the major US indices closed the month having scaled back all of their gains. And yesterday’s selloff was amplified by a higher-than-expected spending and core PCE number from the US. The Federal Reserve’s (Fed) favourite gauge of inflation showed yesterday that core inflation remained steady at 2.7% instead of a decline to 2.6%. The headline PCE index – that includes more volatile items like food and energy – eased to 2.1% - a spitting distance from the Fed’s 2% policy goal. But the fact that the core PCE rose the most on a monthly basis since April – along with strong spending and robust growth data released earlier this week – trimmed the Fed cut bets. The US 2-year yield rose to the highest levels since early August while the 10-year yield re-tested the 4.30% level to the upside.
The US futures are slightly in the positive this morning, as Amazon and Intel rallied in the afterhours trading after releasing better-than-expected Q3 results. Amazon posted a nearly 20% increase in both advertising and cloud computing revenue compared to the same time last year and the CEO sounded optimistic regarding the upcoming holidays season. (You bet he did, have you seen the US spending figures?). The stock price jumped 6% in the afterhours trading. While Intel jumped up to 15% after the results as the company surprised with a 17 cents earnings per share, while the expectation was a 2 cents loss. Last but not least, Apple also announced a better-than-expected revenue and a jump in iPhone sales – before the arrival of the AI tools on them. The earnings were hit by an EU fine of $10bn dollars – which is a one-off charge. But what really hurt investors’ feelings is the fact that they missed the Chinese sales estimates – its 3rd biggest market. The shares lost 1.86% in the afterhours trading.
Today, US’ Big Oil companies will go to the earnings confessional and will certainly post weak numbers due to weak oil and gas prices as did their European peers throughout this week. But, given that the expectations are quite low, beating them is easier. Shell announced yesterday a smaller than expected drop in its profit and said that it will buy another $3.5bn of shares in the next three months. Its shares rebounded more than 2% yesterday, also supported by an almost 2% rally in crude oil prices on suspicion that the Middle East tensions could be coming back.
Oil rebounds on renewed tensions
The latest news on the wire suggests that Iran is preparing a response to Israel’s latest attack. As such, US crude cleared the $70pb offers yesterday and could consolidate and extend gains above that level into the weekend. This being said, the geopolitical tensions have proved to be a temporary boost to oil bulls. The global economic outlook and supply / demand dynamics remain comfortably bearish for oil. As such, price rallies are seen as good opportunities for the bears to strengthen their short positions. The latter not only triggers important selloffs as soon as tensions ease, but also limits the oil’s upside potential. Minor resistance is seen at the 50-DMA, near $71.50 level, and the key resistance to the broader bearish trend sits at the $72.85 mark, which is the major 38.2% Fibonacci retracement on July to September selloff.
The Dollar will say the last word
Gilts and sterling gave a delayed reaction to Wednesday’s budget while the US dollar index eased and tested the 200-DMA to the downside despite the stronger-than-expected core PCE figures, the weakening dovish Fed expectations and the rising yields.
The yen strengthened after relatively hawkish comments from the Bank of Japan (BoJ) yesterday – which maintained its policy unchanged but warned that it could continue to increase the interest rates if the economic data aligns with their forecasts.
The EURUSD rallied past the 200-DMA and minor 23.6% resistance with the sight of a stronger than expected CPI update – that showed that the euro area’s CPI rebounded to the 2% in October and core CPI didn’t ease as anticipated. That, combined with encouraging growth data released earlier this week, gave the euro bulls the energy to test the 200-DMA offers. 7
However, US jobs data and the dollar will ultimately determine whether EURUSD closes the week above or below this level. The US economy is expected to have added around 100K new nonfarm jobs in October with a steady wages growth of around 4% on a yearly basis and a steady unemployment rate near 4.1%. The NFP expectations are weakened by the Boeing strike and the hurricanes, but Wednesday’s ADP report defied the weak expectations and printed a strong 233K private job additions. The game isn’t over yet for Fed doves, today’s report is the last major release before next week’s election and the FOMC decision – expected to bring a 25bp cut.
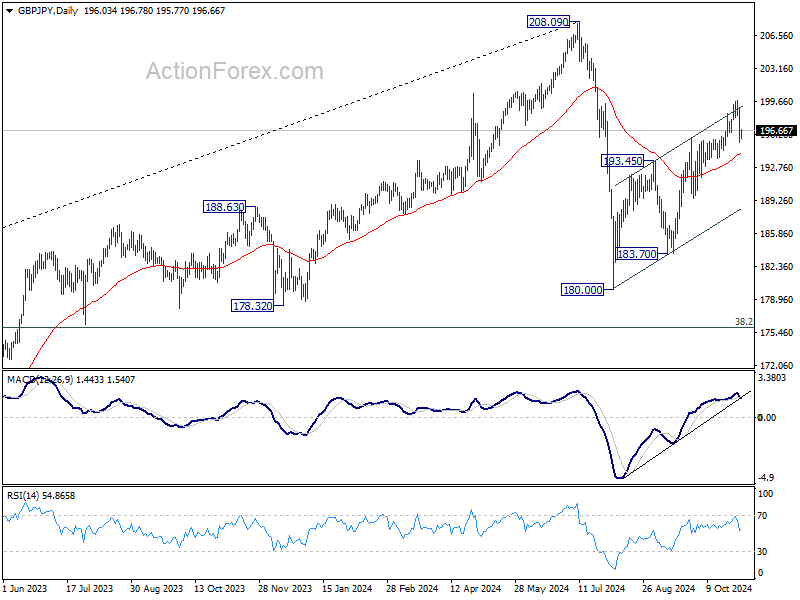
GBP/JPY Daily Outlook
Daily Pivots: (S1) 194.75; (P) 196.83; (R1) 198.22; More...
Intraday bias in GBP/JPY remains neutral for the moment. While pullback from 199.79 might extend lower, further rally would remain in favor as long as 55 D EMA (now at 194.22) holds. Above 199.79 will resume the rebound from 180.00 to retest 208.09 high. However, sustained break of 55 D EMA will argue that the corrective rise has completed already, and turn near term outlook bearish for 180.00/183.70 support zone.
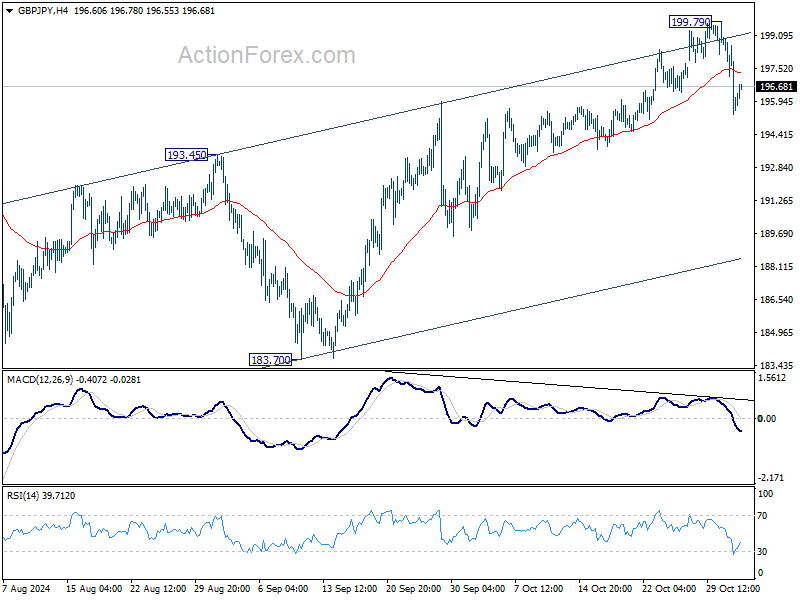
In the bigger picture, price actions from 208.09 are seen as a correction to whole rally from 123.94 (2020 low). The range of consolidation should be set between 38.2% retracement of 123.94 to 208.09 at 175.94 and 208.09. However, decisive break of 175.94 will argue that deeper correction is underway.