
Sample Category Title
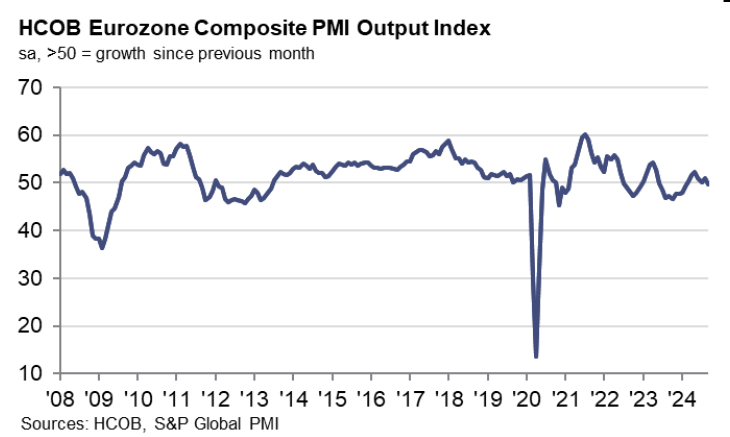
Eurozone PMI composite finalized at 49.6, all big three economies in contraction
Eurozone PMI Services was finalized at 51.4 in September, down from August’s 52.9. PMI Composite fell to 49.6 from 51.0, both hitting 7-month lows. This marks the first month since December 2023 that all of the big-three Eurozone economies showed signs of contraction.
Spain led with a Composite PMI of 56.3, a 4-month high. However, Italy recorded a 9-month low at 49.7, France fell to 48.6, a 6-month low, and Germany’s Composite PMI dropped to 47.5, a 7-month low.
Cyrus de la Rubia, Chief Economist at Hamburg Commercial Bank, pointed out that service sector growth has slowed across the Eurozone, especially in Germany, Italy, and France, where activity "almost hit a wall".
He added that the decline in new business is a worrying sign, indicating that the service sector will "continue to deteriorate," dragging overall economic growth. With the industry also in contraction, Q3 growth in the Eurozone is expected to be minimal.
On the positive side, service sector operating costs saw their slowest rise since early 2021, and inflation in selling prices is easing. This economic softness strengthens the case for ECB to cut interest rates in October, a possibility ECB President Christine Lagarde has recently hinted at.
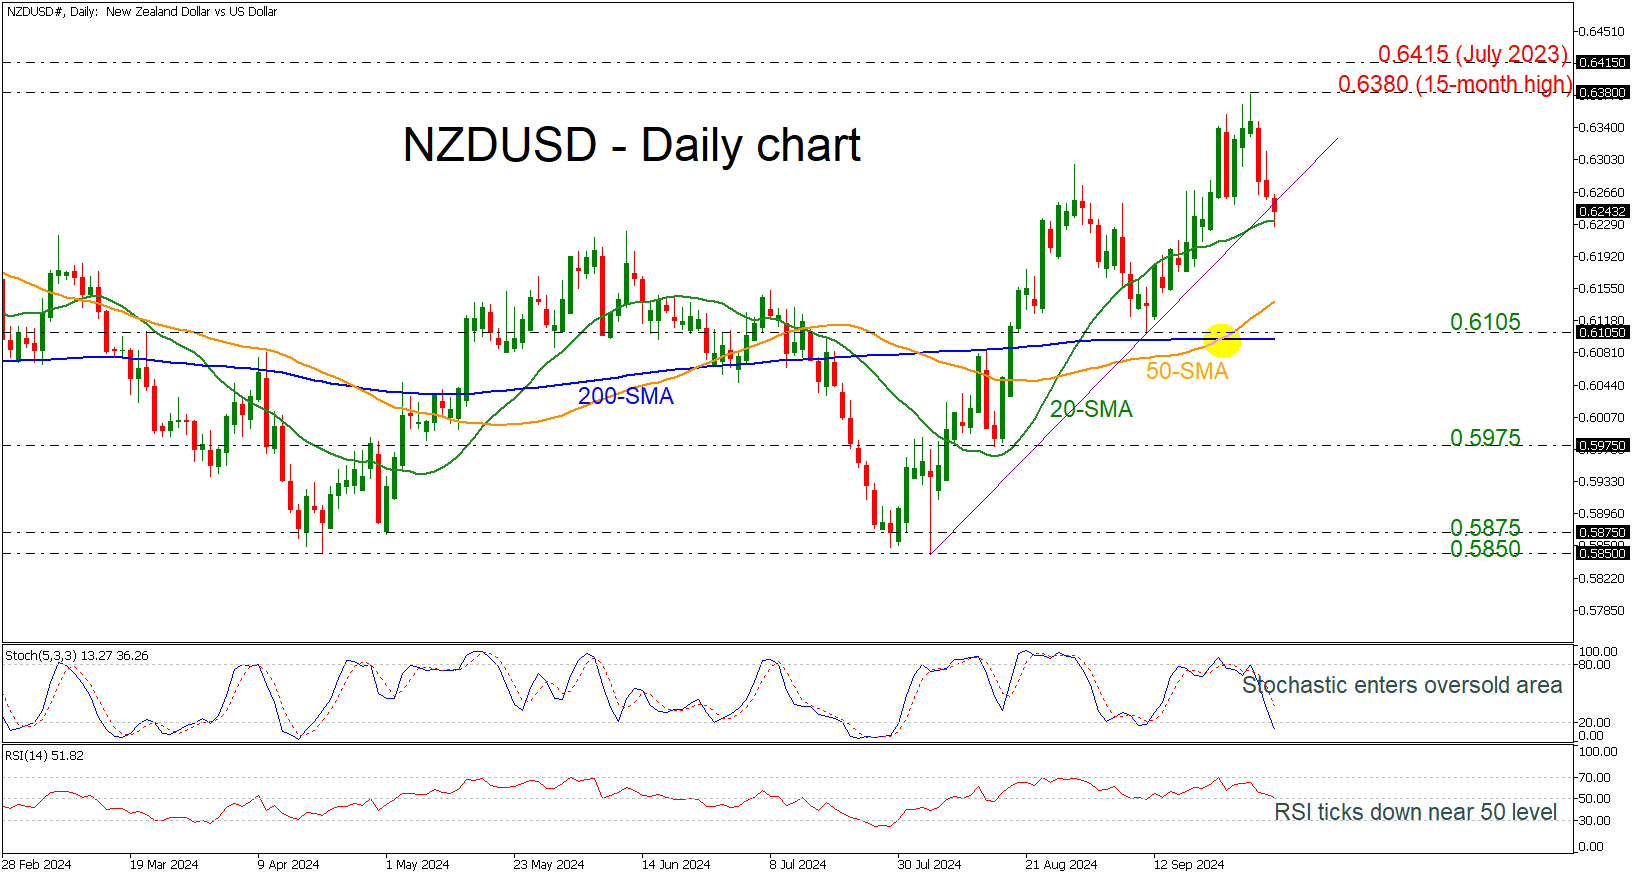
NZDUSD Retreats Below Short-Term Uptrend Line
- NZDUSD pulls back from its 15-month top
- Stochastic tumbles to oversold region
- RSI falls near 50 level
NZDUSD lost more than 2% following the pullback from the 15-month high of 0.6380, flirting with the short-term ascending trend line and the 20-day simple moving average (SMA).
In the previous days, the 50- and 200-day SMAs posted a bullish crossover, but the market is currently retreating, taking the technical oscillators lower. The stochastic dived towards the oversold region, while the RSI is trying to cross beneath the 50 level.
The 20-day SMA at 0.6230 could provide immediate support, ahead of the 50-day SMA at 0.6140. Below that, the 0.6105 bar may halt bearish action, which holds near the flat 200-day SMA.
On the flip side, if the market rises above the uptrend line, the next resistance could be the 15-month peak of 0.6380 and the July 2023 peak at 0.6415.
All in all, NZDUSD has been in a bearish correction over the last couple of days, but as long as it remains above the 200-day SMA, the broader outlook remains positive.
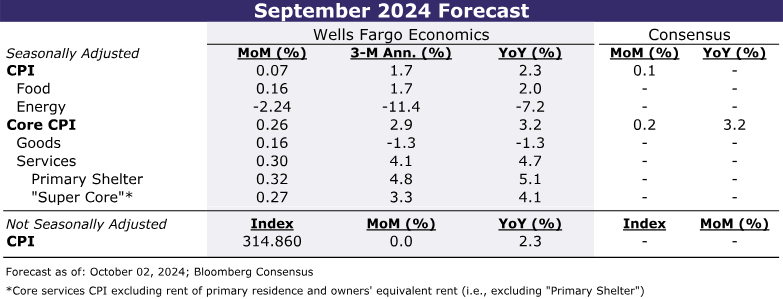
September CPI Preview: Sticky-Looking Core to Be Temporary
Summary
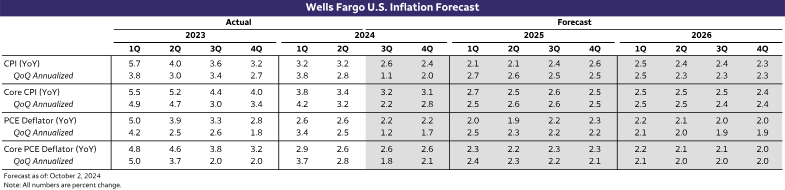
The overall progress in reining in decades-high inflation should be on display with the September CPI report. We look for the headline to advance 0.1%, which would bring the year-over-year rate down to 2.3% and point to headline PCE rising 2.0%—directly on the FOMC's target in what will be the last read on inflation before the Committee's November 7 meeting.
Reducing core inflation remains more of a grind. We estimate the CPI excluding food and energy will post another "low" 0.3% increase (0.26% unrounded) in September, which would lead the year-over-year rate to slip back to 3.2%. Although we expect a similarly-sized gain as in August, the drivers are likely to be different. Core goods prices look poised to take a temporary breather from the deflationary trend we believe is still underway, while core services inflation should moderate amid smaller gains in shelter and travel prices.
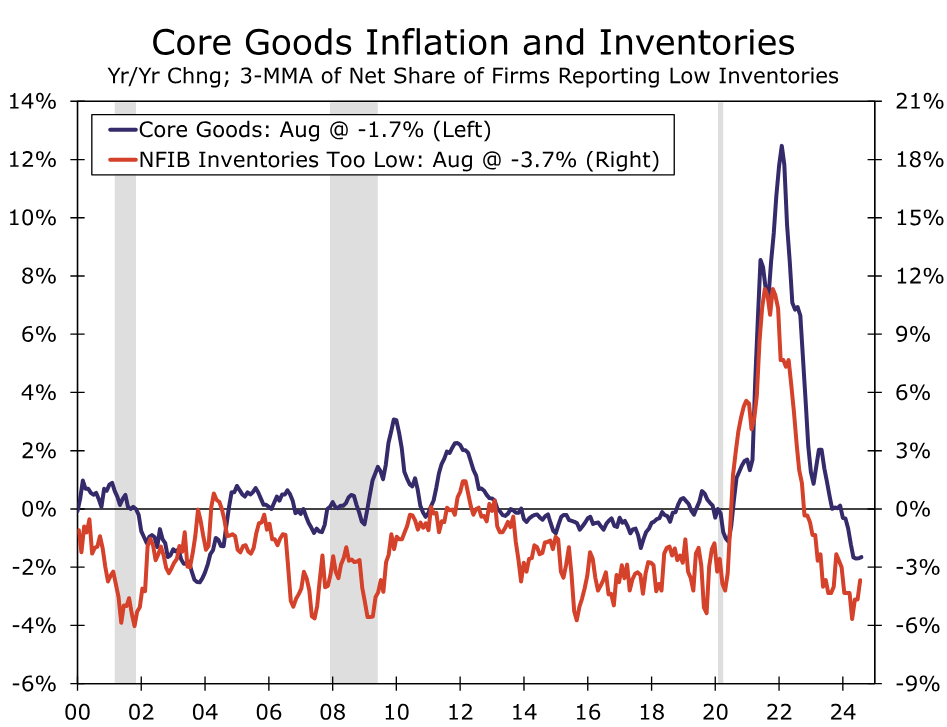
Looking ahead, the strike among East and Gulf Coast dockworkers presents a near-term upside risk to goods inflation. For now, however, we expect minimal effects on consumer goods prices due to the improved picture for retail inventories and softer demand environment compared to a few years ago. Services inflation should recede further in the months ahead as the cooler rental market feeds through to official measures of shelter inflation and the jobs market softens. We look for the monthly pace of core CPI to downshift to around 0.20% through the remaining months of the year and, of more focus for the FOMC, for the 12-month change in core PCE inflation to ease to around 2.25% by this time next year.
Headline CPI: Now That's More Like It
September's CPI report should indicate that inflation slowly continues to recede. The ongoing moderation in price growth should be most evident in a tame headline gain. We look for the Consumer Price Index to advance just 0.1%. If realized, that would drive the year-over-year rate down to 2.3% and point to headline PCE rising 2.0%—directly on the FOMC's target in what will be the last read on inflation before the Committee's November 7 meeting.
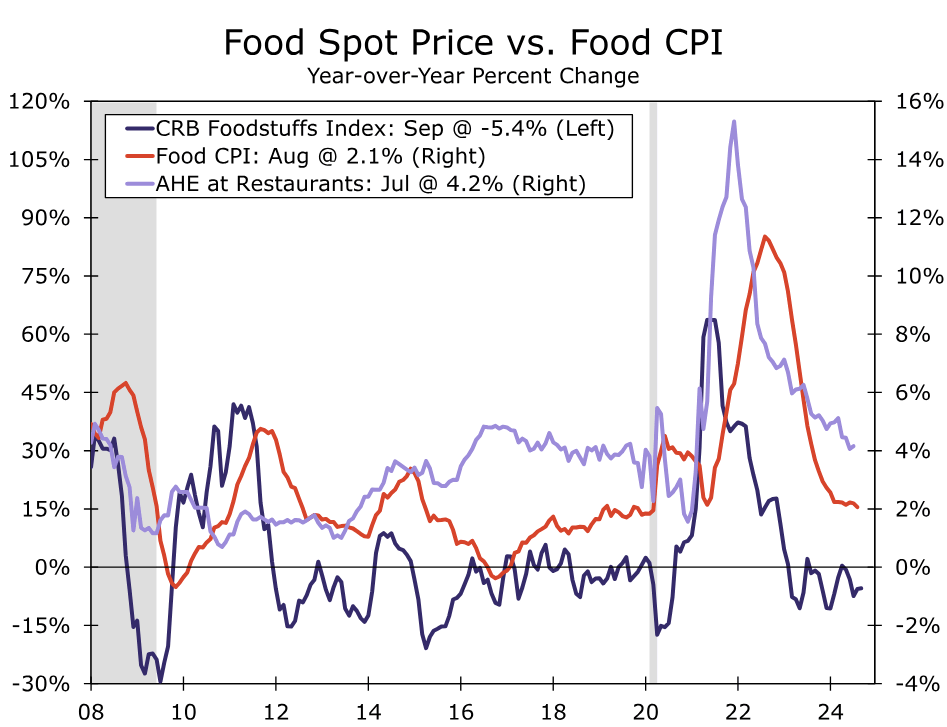
The pullback in gasoline prices over the past year has been one key factor in driving the headline lower. We estimate energy goods prices fell a little more than 4% in September and 15% since this time last year. Food inflation has also quieted down amid tamer commodity prices, more price-sensitive shoppers and slower wage growth at restaurants and grocery stores (Figure 1). We look for prices for food at home and away from home to have advanced 0.1% and 0.3%, respectively, in September, which would result in the year-over-year pace of the overall food index slipping to 2.0% from 3.7% last September and more than 11% at its recent peak.
Core CPI: Goods and Services Reverse Roles in September
Reducing core inflation, however, remains more of a grind. We expect another monthly increase in the core index that teeters on the edge of a 0.2% or 0.3% gain. While our unrounded estimate of 0.26% is little different from August's 0.28% increase, underneath the surface, we look for a different set of drivers (Figure 2). Specifically, we look for core goods prices to swing from a 0.2% monthly decline to a 0.2% monthly increase amid a pickup in used auto prices (+1.5%) and less favorable seasonal factors. These factors should be temporary, however, leading us to expect a resumption of goods deflation in the final months of this year.
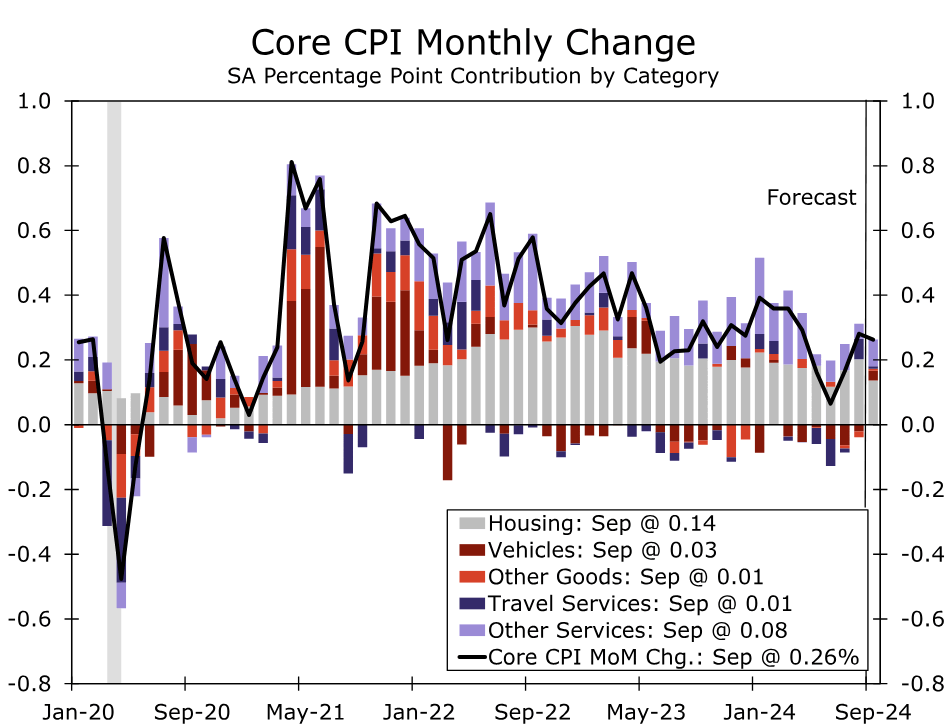
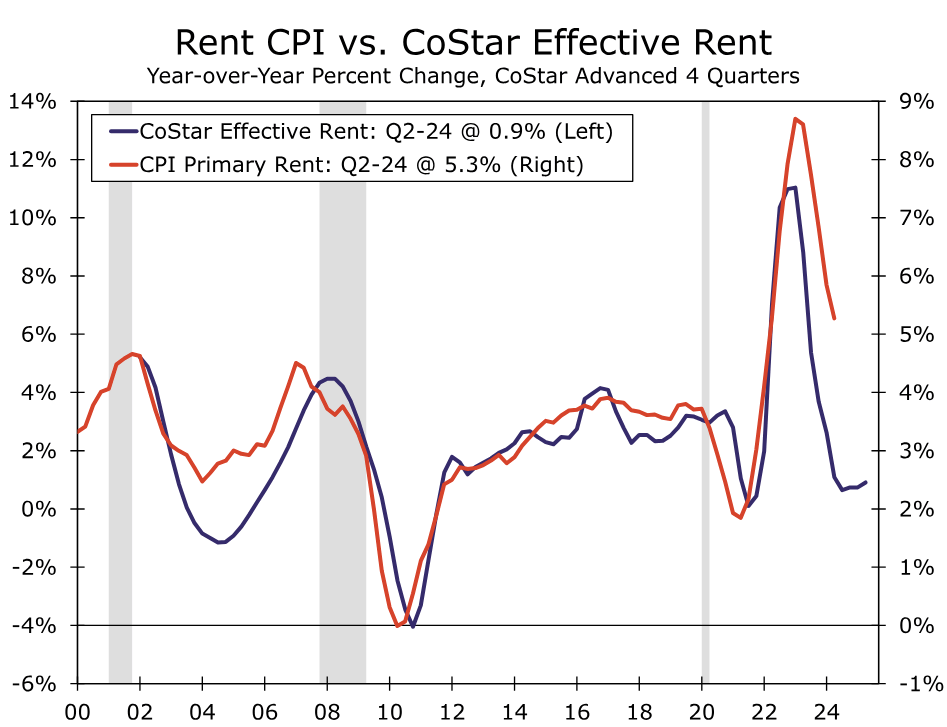
Core services, on the other hand, should quiet down a little in September; we estimate a 0.3% gain after a 0.4% increase in August. At the risk of seeming like Charlie Brown trying to kick Lucy's football, we still see signs that primary shelter inflation will slow further, and that the nearly 6% annualized monthly rate recorded in August is not reflective of the underlying trend. The apartment vacancy rate according to CoStar through Q2 has remained at its highest level since 2009, with apartment rent growth running below its pre-COVID pace according to a litany of measures (e.g., CoStar, Zillow and the BLS's New Tenant Rent Index, Figure 3). While low affordability in the purchase market is keeping single-family rent growth more or less in line with its 2018-2019 clip, the CPI for owners' equivalent rent, at 5.4% year-over-year, remains roughly two percentage points higher than its pre-pandemic pace. After increasing 0.5% in August, we estimate primary shelter rose 0.3% in September. Core services ex-housing is also likely to come in a little lighter in September, helped by a more modest gain in airfares and further easing in motor vehicle insurance inflation.
Upward Pressure on Prices Continues to Generally Ease
Despite the recent pace of core CPI having picked up since mid summer—we estimate a three-month annualized rate of 2.9% in September compared to 1.6% in July—the intact downward trend should be evident by the year-over-year rate edging back down to 3.2%. Moreover, as we look ahead, inflation pressures continue to generally dissipate. Admittedly, the East and Gulf Coast dockworkers strike presents a near-term challenge to furthering goods deflation. For now, we expect minimal effects on consumer goods prices due to the better inventory picture and softer demand environment compared to a few years ago, although a prolonged dispute would change our view (Figure 4). Services categories remain the laggard in terms of inflation settling back down, but we continue to expect a further moderation over the coming quarters. Not only does softer shelter inflation still seem to be just a matter of time, but service providers, such as insurers and airlines, should benefit from more stable/lower prices for goods inputs (e.g., vehicles and oil prices). Meantime, fewer quits as the job market cools and the pickup in productivity growth are reducing inflationary pressure from the jobs market—dynamics that will help limit goods and services inflation alike.
We look for the 12-month change in headline CPI to remain around 2.0-2.5% over the next year, which should translate into the PCE deflator hovering right around the Fed's 2% target (Figure 5). Excluding food and energy, price growth should continue to recede, as further services disinflation more than offsets less-dramatic goods deflation. We look for the year-over-year pace of core CPI inflation to slow to around 2.5% by the third quarter of next year, with the gap between the core CPI and core PCE narrowing near its historic 0.3 percentage point average.
Is China Circumventing U.S. Tariffs?
Summary
We have written extensively about the deterioration in the trade relationship between the U.S. and China, and how tensions between the two nations have rewired global trade patterns. Following the implementation of Trump-era tariffs, the U.S.-China trade relationship reached an inflection point, and as of the end of 2023, China's trade surplus with the United States was essentially half of what it was relative to before the trade war. However, a deeper dive into global trade flows suggests the overall U.S.-China trade relationship may not necessarily be weakening as much as data suggest. Evidence exists that China may be circumventing U.S. tariffs via proxy nations, and still benefiting from U.S. demand and the United States as a final export destination. In this report, we highlight how the composition of U.S. import partners has changed over time. We also reveal how China's export destinations have also changed, and the same countries the U.S. is importing more from, China is exporting more to.
Coincidence? Probably not.
China Is Paying Tariffs, But Also Working Around Them
Over the last few years, we have written extensively about the deterioration in the trade relationship between the U.S. and China. More recently, we explored how tensions between the two nations have spread and are upending trade relationships around the world and rewiring global trade patterns. U.S.-China relations have been tense for some time due to diverging strategic priorities and geopolitical differences; however, we can pinpoint the inflection point—at least for trade—as the implementation of Trump-era tariffs and the broader trade war that originated in 2018. To that point, China's trade surplus with the United States saw a meaningful dip when tariff rates ramped up over the course of 2019 (Figure 1). Successive years have seen China's trade surplus slip even further, and as of the end of 2023, China's trade surplus with the United States was essentially half of what it was relative to before the trade war—both in terms of U.S. and China GDP. We can point to many other metrics to indicate the U.S.-China trade linkage is not as robust as it once was; however, a deeper dive into global trade flows tells an interesting story. One that suggests the overall U.S.-China trade relationship may not necessarily be weakening as much as data suggest. The same global trade data also suggest that China may be circumventing U.S. tariffs, and still benefiting from U.S. demand and the United States as a final export destination.
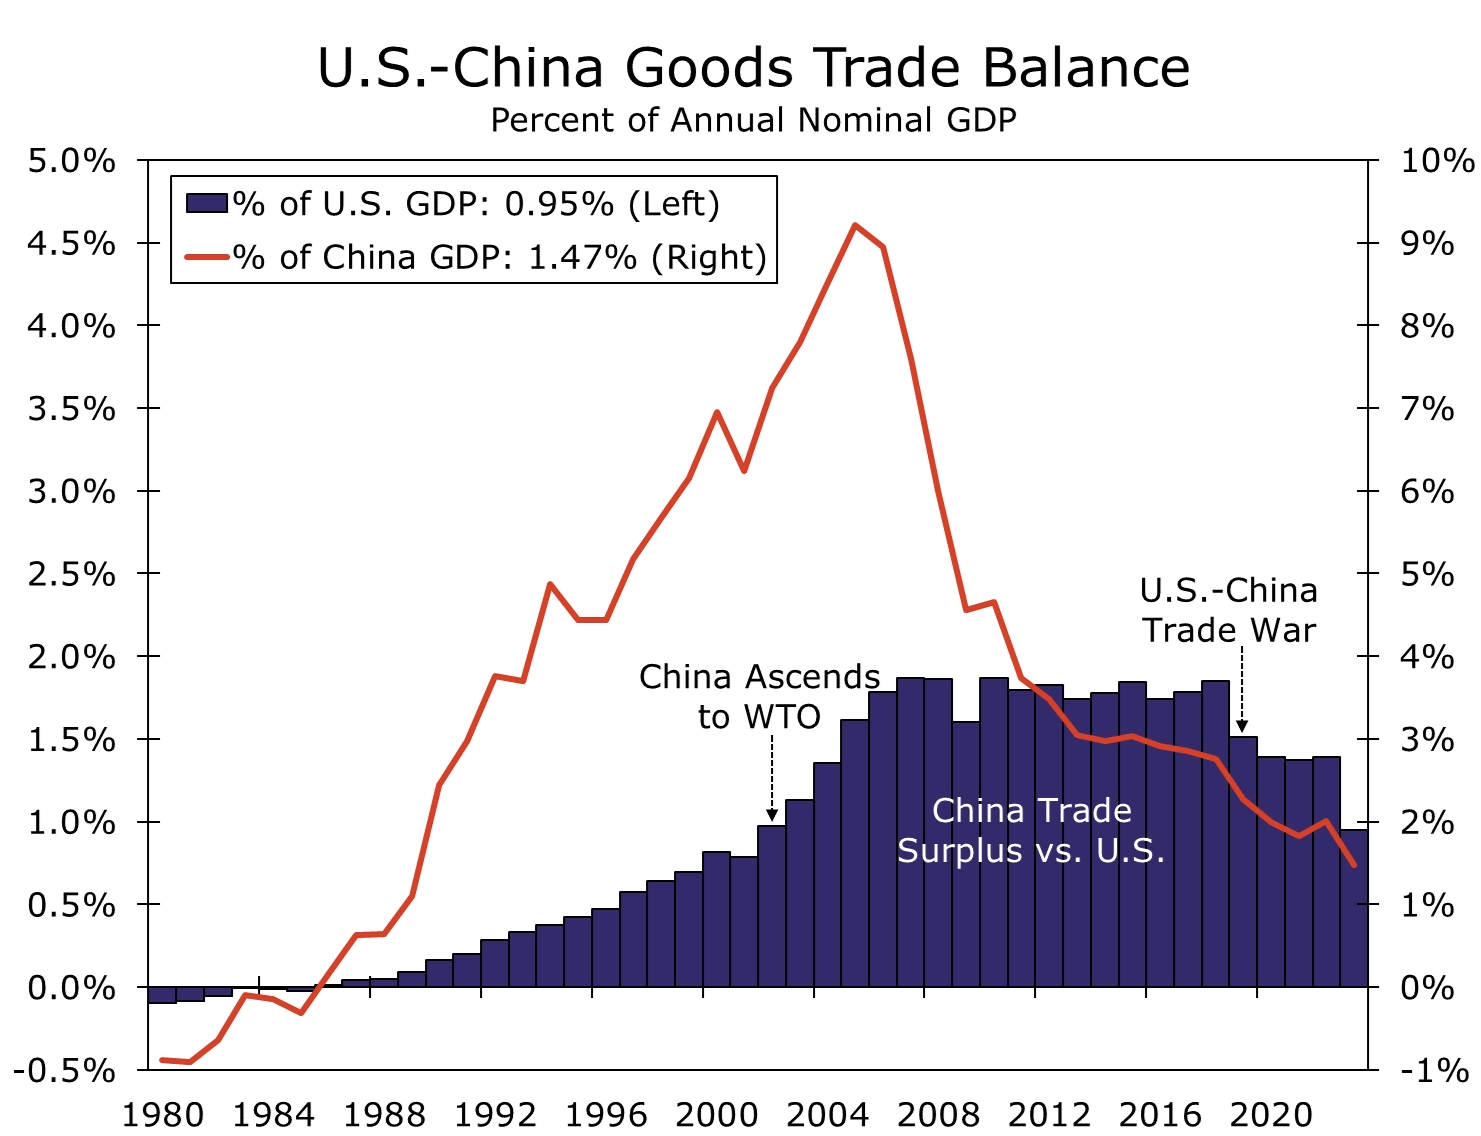
As background, President Trump first imposed tariffs directly on Chinese exports in 2018. Over the course of the next few years, tariffs were imposed on a majority of Chinese exports to the U.S., while the tariff rate being applied was ratcheted higher. China responded with retaliatory tariffs on all U.S. exports to China, and matched tariff threats emanating out of the United States. Eventually, the U.S. and China reached a “Phase 1” trade deal that saw future tariff hikes suspended and the tariff rate imposed on select goods lowered. For the time being, the “Phase 1" trade deal remains intact; however, the Biden administration has imposed additional tariffs—along with broader restrictions—on certain exports to China over the course of the last four years. While Chinese authorities have not responded with new tariffs, China has erected other forms of trade barriers with the U.S. that contribute to the complications surrounding the U.S.-China trade relationship. As far as tariff revenue, at least for the United States, the U.S. is collecting a sizable amount of revenue derived from the tariffs imposed on China. As of mid-2024, the trade-weighted average tariff rate (i.e. tariff revenue as a percent of the total value of U.S. imports from China) on China is ~9.5%, a notable step up from the tariff rate prior to the trade war (Figure 2). Excluding the distortion caused by COVID-19 in 2020, the average tariff rate on imports from China has slipped only modestly over the last few years. The moderate decline in this ratio is mostly a product of reduced U.S. demand for Chinese goods subject to tariffs, in particular.
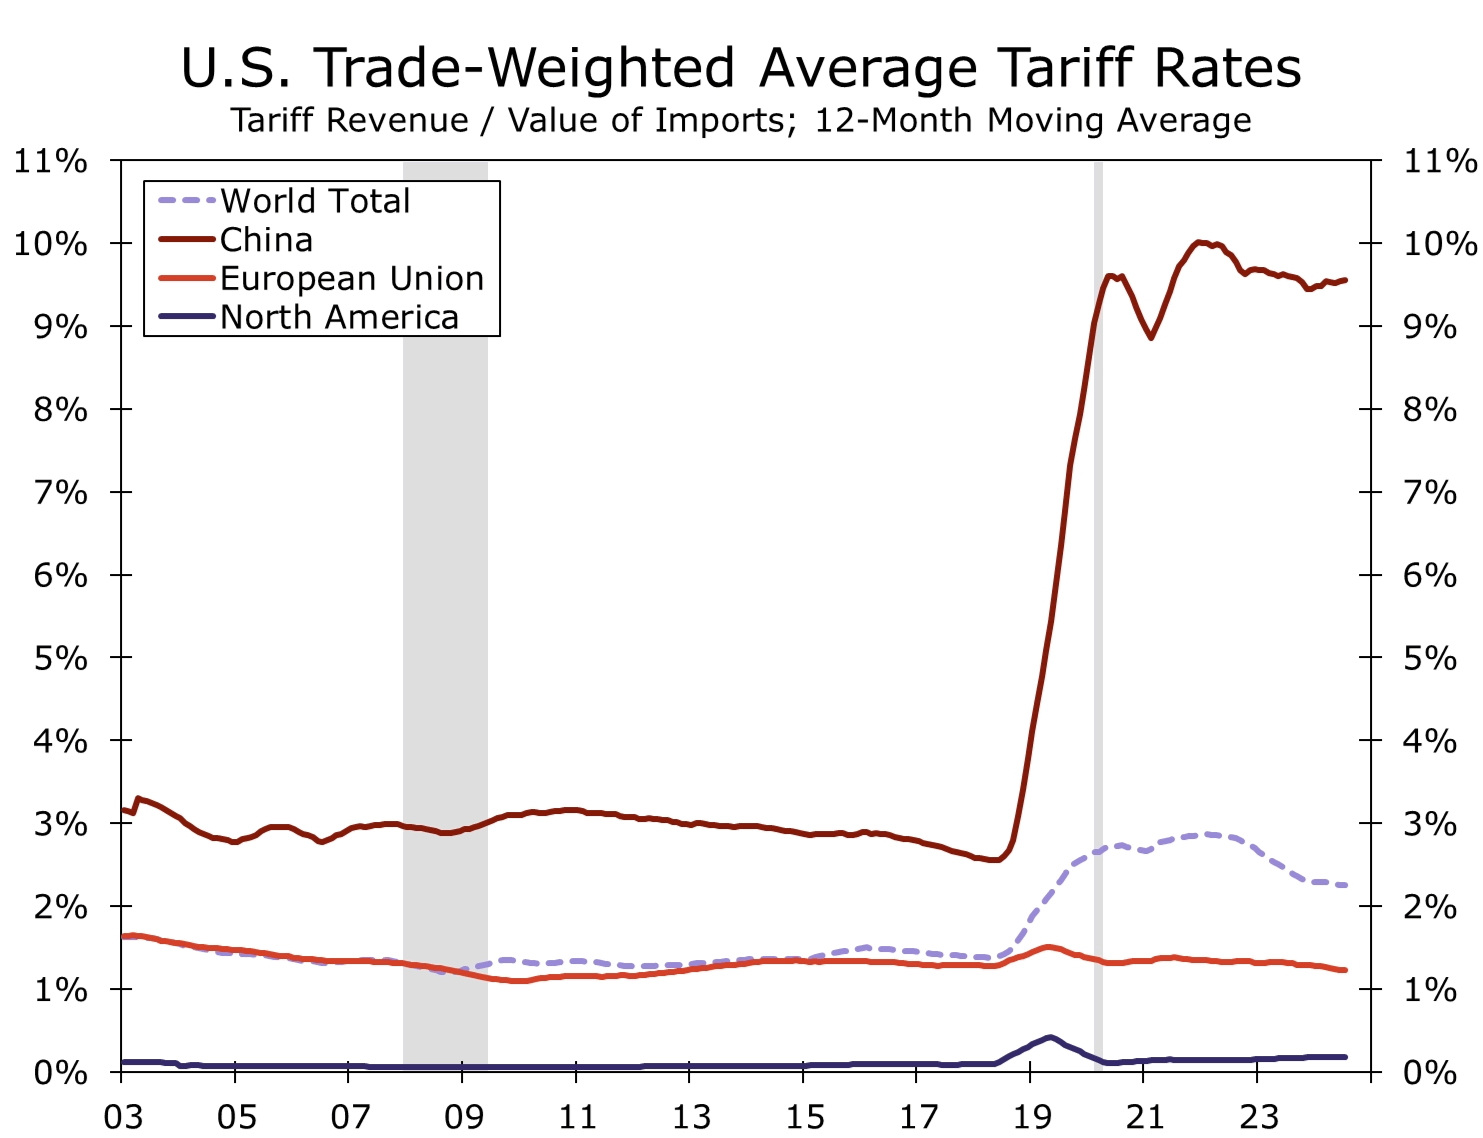
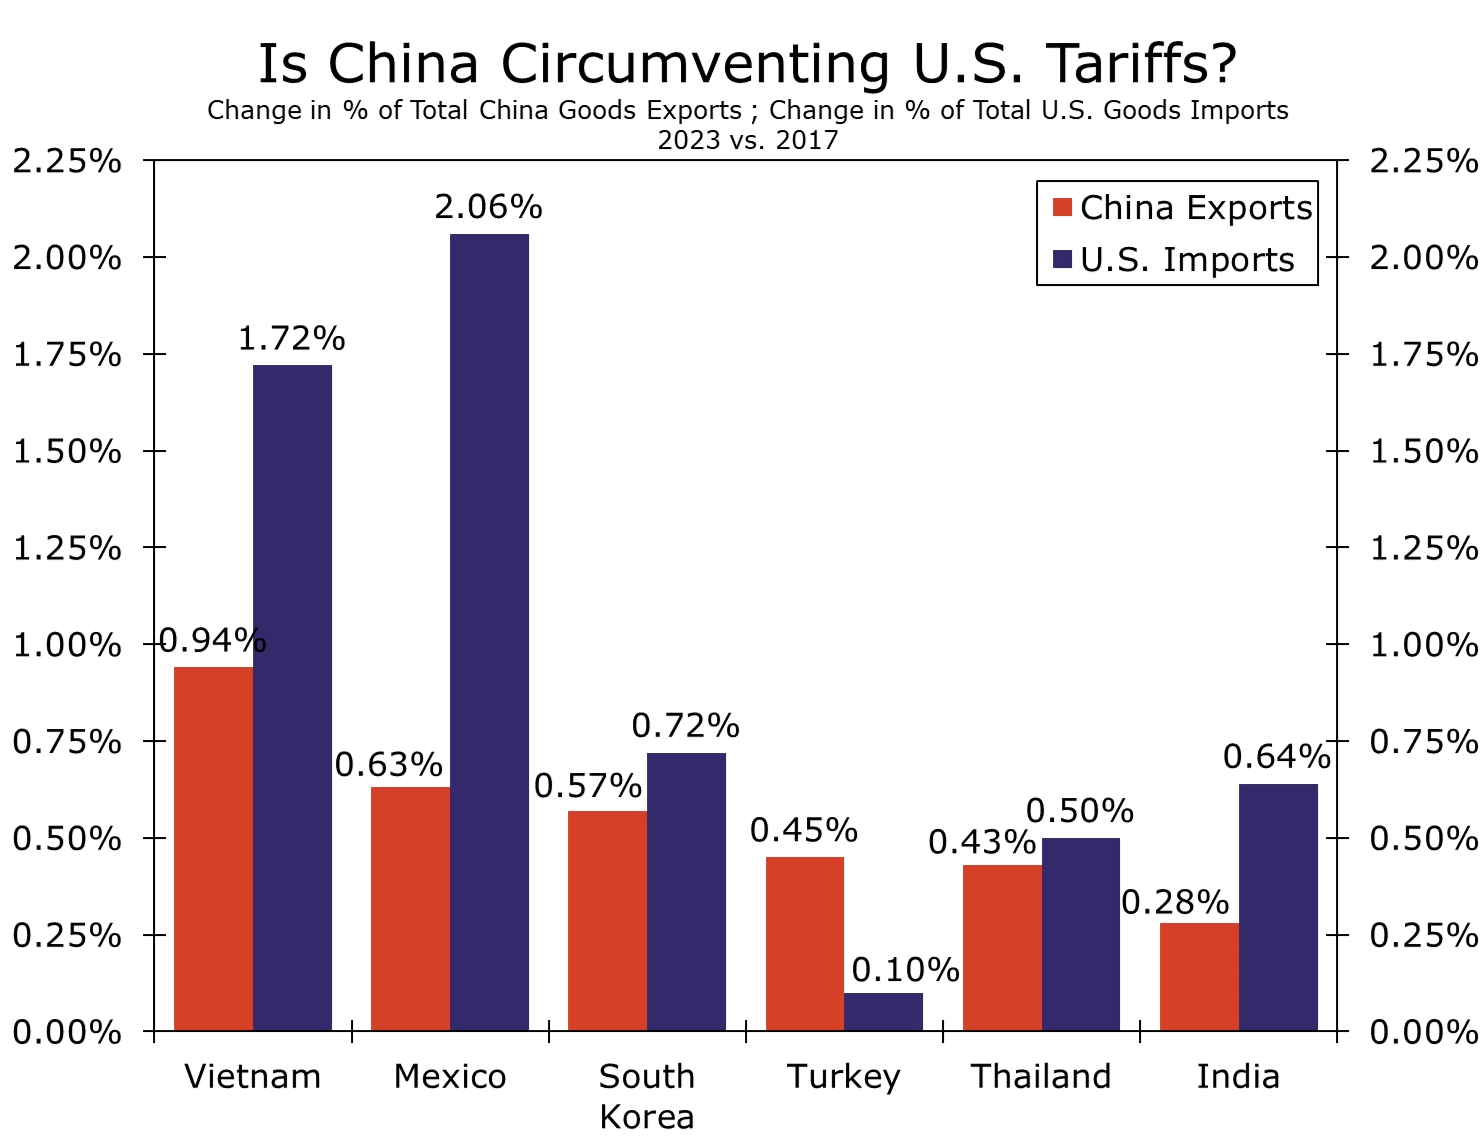
However, Figure 2 also shows an average U.S. trade-weighted tariff rate on imports from the entire world, which may be a more compelling data point as well as evidence that China may be circumventing U.S. tariffs. For clarity, when we say “circumventing U.S. tariffs”, we are referring to China using proxy nations as a way of avoiding U.S. import duties on goods produced in and sent directly from China. These “proxies”—either other low-cost economies in Southeast Asia, nations geographically or geopolitically close to the U.S. etc.—are used as intermediaries before Chinese manufactured products eventually reach U.S. soil. But as far as the world tariff rate and how that corresponds to China's use of proxy nations, the world tariff rate popped higher during the peak of the trade war, but has steadily fallen over the last few years. While the world tariff rate may be slightly diluted from the value of overall U.S. imports rising, the larger influence over the fall in the world tariff rate is less total tariff revenue collection in absolute dollar terms, given a compositional shift in U.S import partners. As reflected in the narrowing China trade surplus chart, the U.S. is importing less from China, the United States' main source of tariff revenue. Instead, the U.S. is sourcing an increased amount of goods from other nations in Asia as well as across Latin America and Europe. Relative to 2017, the U.S. is importing significantly more goods from countries such as Vietnam, Mexico, South Korea, Turkey, Thailand and India (Figure 3). Essentially, countries not subject to China-style tariffs. At the same time, global trade data reveal that China has also boosted trade relations with those same nations. As of the end of 2023, and relative to before the trade war started, China is exporting more goods to those very same countries.
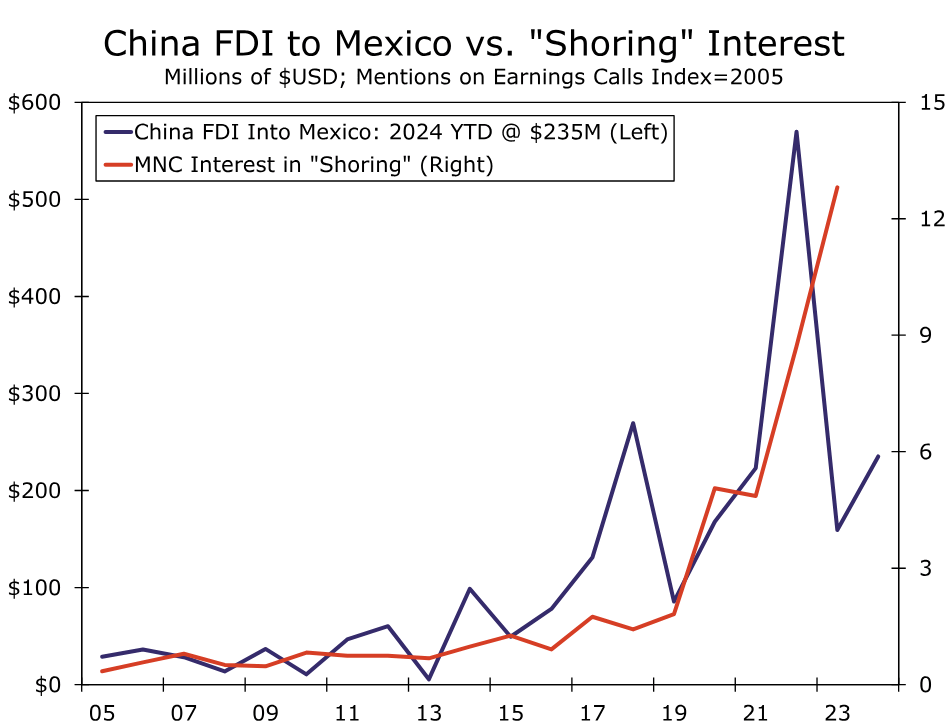
Coincidence? Probably not. Take Mexico for example. Mexico is widely considered to be one of the top nearshoring destinations for U.S. corporations looking to shift critical supply chain links out of China. As U.S. multinational corporation interest in nearshoring picked up after tariffs were imposed and surged again after COVID-19, so has Chinese foreign direct investment (FDI) into Mexico (Figure 4). Without knowing for certain, there is a high likelihood China is actively putting infrastructure on the ground in Mexico as an intermediary to accept Chinese made goods before ultimately sending on to the United States. Indeed, given the shifting composition of trade flows and China's increased foreign direct investment activity, we would argue the evidence strongly suggests that a perceptible portion of China-U.S. trade flows are being re-routed via proxy countries. The Biden administration indeed took notice of these tactics, and recently applied tariffs to certain Chinese goods making their way into the U.S. via Mexico. China using proxy nations as means to avoid U.S. tariffs will likely retain the attention of the current administration and a potential Democratic administration post-elections, but could also be at the core of former President Trump's proposed “global tariff.” Should a tariff on all exports to the United States apply to all nations, the ability for China to completely circumvent export duties would be diminished. While a U.S. global tariff would place downward pressure on global growth and upward pressure on global inflation, as well as potentially damage relations between the U.S. and most trading partners, the genesis of former President Trump's global tariff proposal could still be aimed at disrupting China's rise. Combined with Trump's proposed 60% tariff on exports to the U.S. directly from China, China's ability to tap U.S. consumer demand could be at risk should U.S. trade policy turn more protectionist in the near future. With exports propping up China's economy for the time being, a global tariff alongside tariffs imposed directly on China could have a more severe impact on China's economy relative to existing tariffs. While we are not assuming any new tariffs or changes in U.S. trade policy in our global economic forecasts, we do feel comfortable saying that U.S.-China tensions will persist for an extended and ongoing period of time, even in a scenario without new tariffs. We also feel comfortable sharing our view that U.S.-China decoupling that has been underway for a period of time, as well as the fragmenting of the global economy to align with either the U.S. or China, is likely to continue for the foreseeable future.
China – Lift to GDP Forecast After Leaders Draw Line in the Sand
- Following the big stimulus and clear growth message from Chinese leaders, we revise up our China growth forecast in 2025 from 4.8% to 5.2%. For 2024 we keep our 4.8% forecast.
- The stimulus is the strongest coordinated push to lift the economy since the global financial crisis in 2008. We expect China to follow up with fiscal stimulus measures on the other side of the National Day holiday.
- The key to turning the Chinese slump is to put a stop to the housing crisis, which we see as the epicentre of current challenges. We now look for a gradual improvement in housing over the next year but not a fast rebound.
- China is set to change from a disinflationary force to a more neutral force. Since we look for the recovery to be gradual we do not expect China to become an inflationary force within the next 6-12 months.
EURUSD & GBPUSD Breakdown
The US Dollar (USD) continued to strengthen against other major currencies on Tuesday, reaching its highest level in nearly two weeks, climbing above 101.00. Investors are keeping an eye on important data, such as the European unemployment rate and US employment numbers from ADP, along with speeches from key Federal Reserve officials.
The USD got a boost on Tuesday after the US reported an increase in job openings for August. However, the manufacturing sector remained weak, as shown by the ISM Manufacturing PMI data, which missed expectations. Concerns over rising geopolitical tensions in the Middle East are also influencing markets. Iran reportedly launched around 200 missiles at Israel, prompting threats of retaliation, which has added uncertainty to the global outlook.
In response, the stock market dipped slightly, while the Euro and British Pound both dropped against the Dollar. Gold prices briefly rose due to the heightened geopolitical risk but are struggling to keep momentum, hovering near $2,650 on Wednesday.
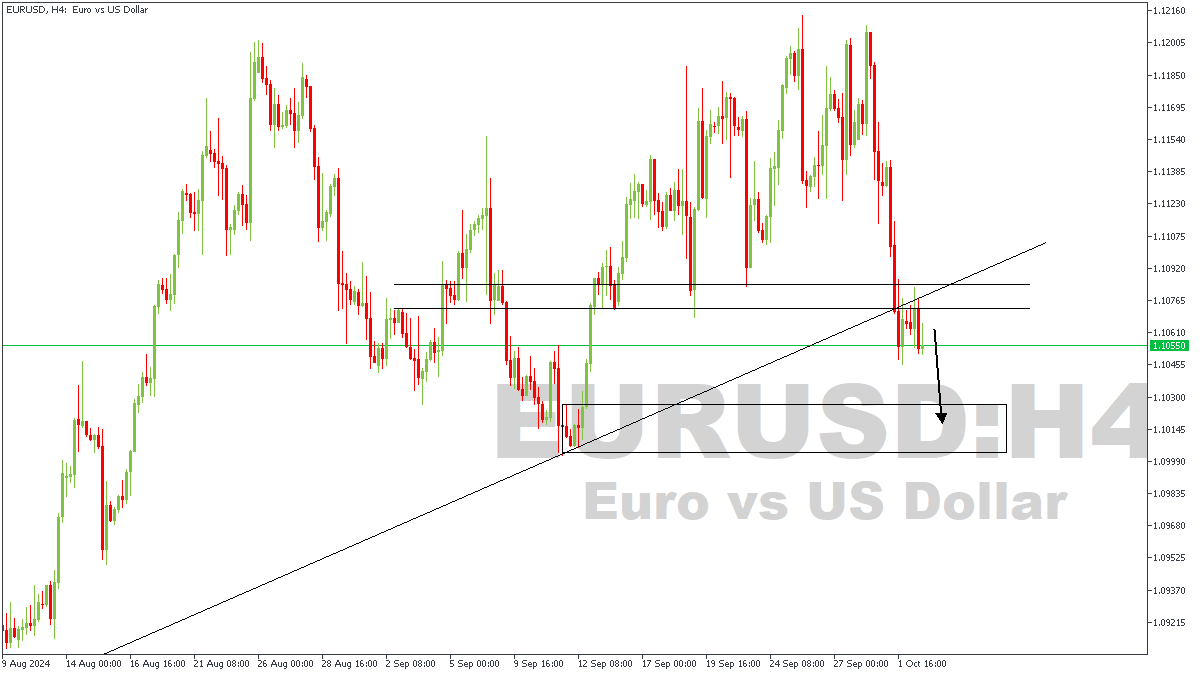
EURUSD – RECAP
On Monday, 30th of September, during the livestream with the VIP community, we took a look at the price action on EURUSD and predicted a drop from the daily timeframe pivot. At this moment, price has completed a 155-pip drop and seems to still have some more to go.
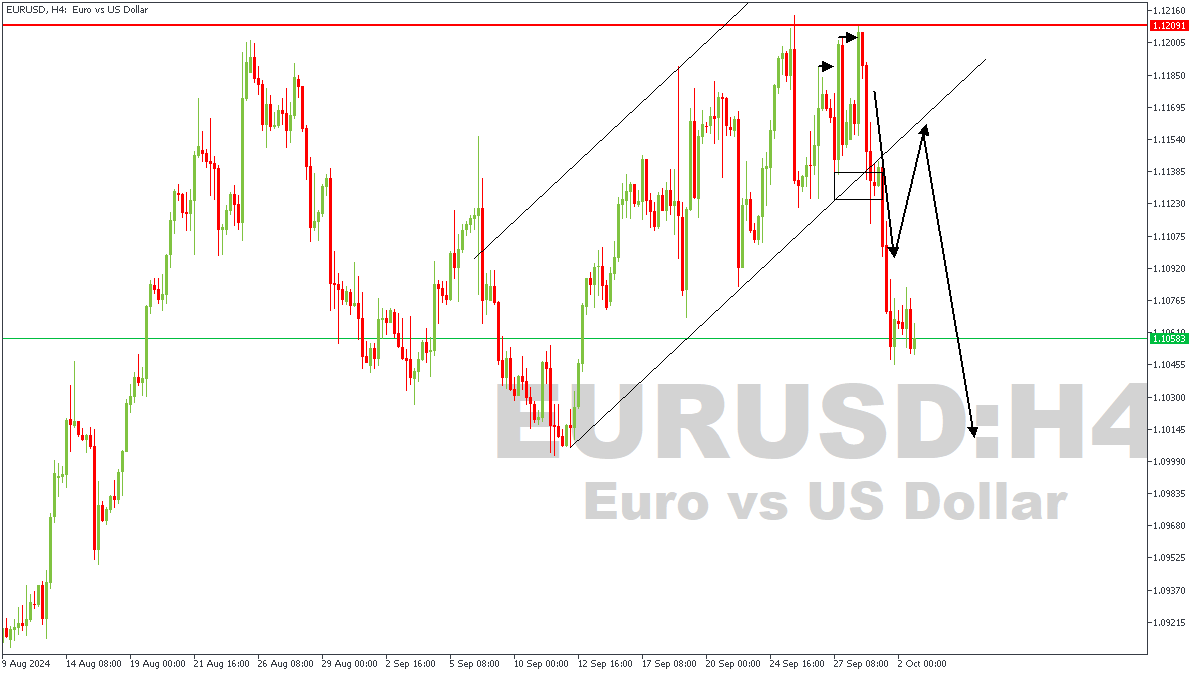
EURUSD – H4 Timeframe
The 4-hour timeframe of EURUSD at the moment indicates price has recently broken below, and retested a pivot region on the 4-hour timeframe. A trendline support was also broken with a retest; the conclusion here, therefore is that price intends to remain bearish.
Analyst’s Expectations:
- Direction: Bearish
- Target: 1.10257
- Invalidation: 1.10828
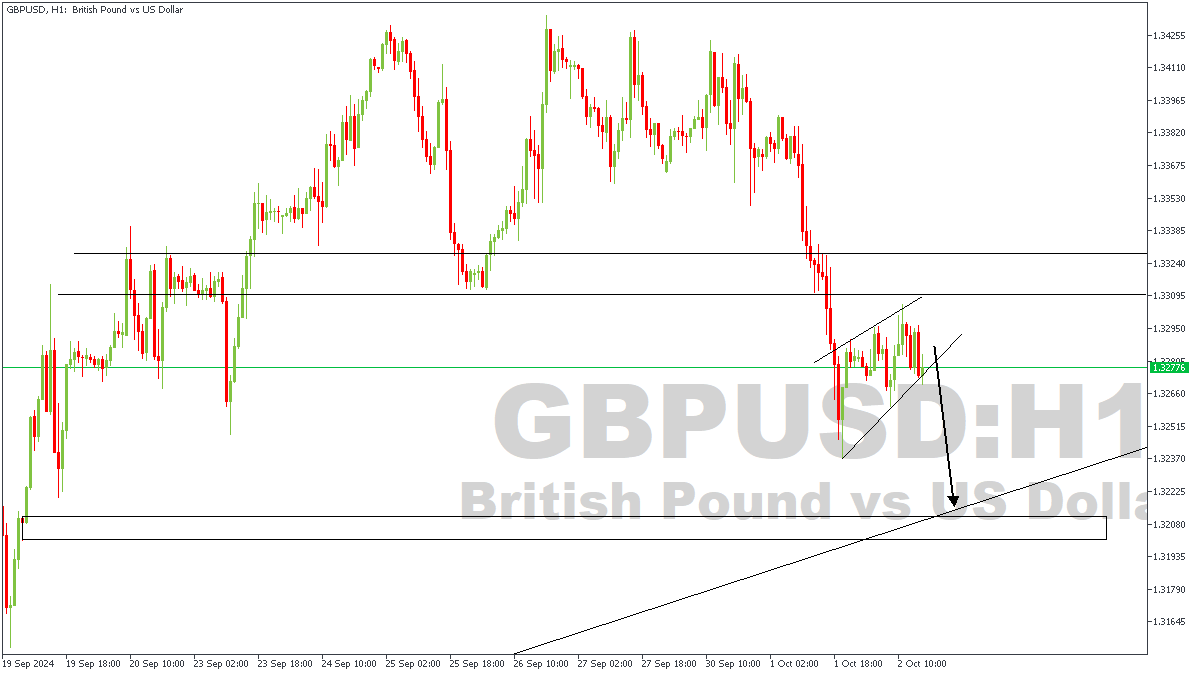
GBPUSD – RECAP
GBPUSD was not left out of the analysis during the Monday Market Review in the VIP community – with Gold going on to drop over 180pips afterwards.
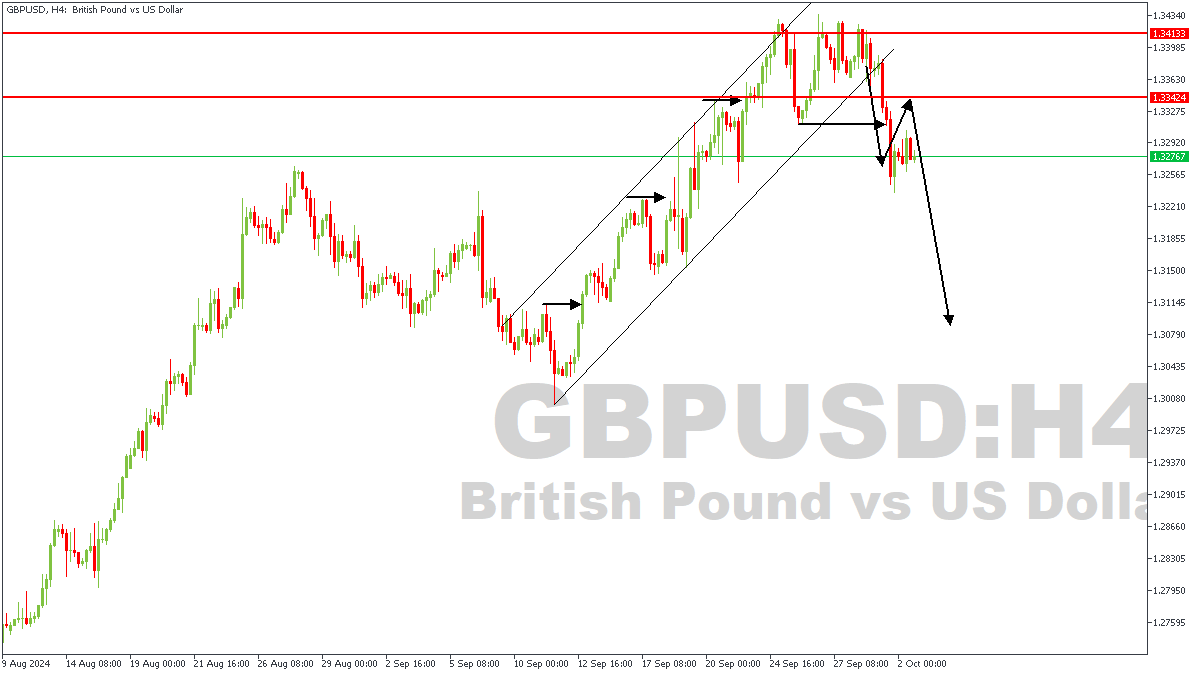
GBPUSD – H1 Timeframe
At the moment on the 1-hour timeframe chart of GBPUSD, price has formed a rising wedge as it approached the recently broken 4-hour timeframe pivot zone. In line with this, I expect to see the bearish momentum continue until it reaches the highlighted area of demand on the chart.
Analyst’s Expectations:
- Direction: Bearish
- Target: 1.32127
- Invalidation: 1.32975
BoE’s Bailey signals potential for “activist” rate cuts as inflation pressures fade
In an interview with The Guardian, BoE Governor Andrew Bailey highlighted that cost of living pressures have not been as persistent as the Bank previously feared, which could open the door for more proactive rate cuts.
He noted that if positive inflation data continues, the BoE may adopt a "more activist" stance on reducing interest rates, which currently stand at 5%.
However, Bailey also pointed to geopolitical risks, particularly in the Middle East, as a threat. "Geopolitical concerns are very serious," he said, acknowledging that ongoing conflicts could add strain to already "stretched markets."
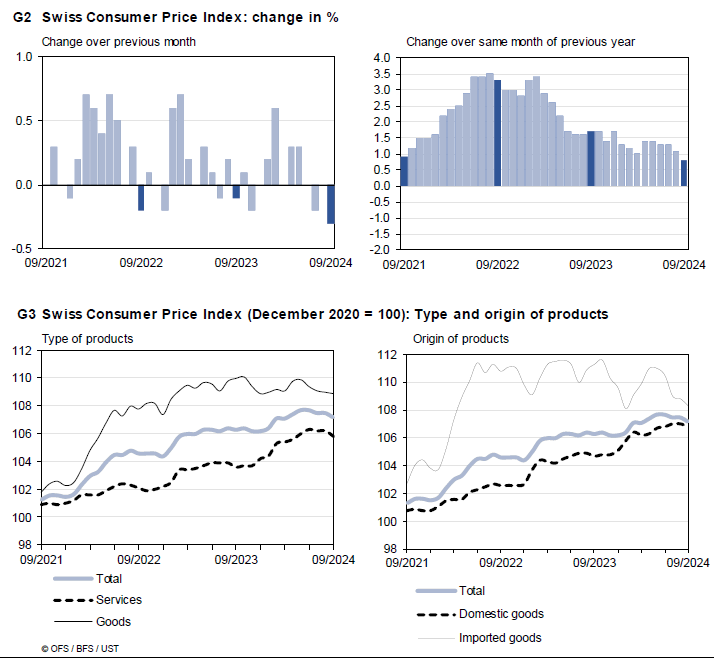
Swiss CPI slows to 0.8% yoy in Sep, import product prices plunge -2.7% yoy
Swiss CPI dropped by -0.3% mom in September, falling short of the expected -0.1% mom decline. Core CPI, which excludes fresh and seasonal products as well as energy and fuel, also declined by -0.2% mom. Prices for domestic products fell by -0.2% mom, while prices for imported goods saw a steeper decline of -0.5% mom.
On an annual basis, Swiss CPI growth slowed to 0.8% yoy, down from 1.1% and below expectations of 1.1% yoy. Core inflation eased to 1.0% from 1.1%. Notably, prices for imported goods dropped by -2.7% yoy, down from -1.9% yoy. Domestic product prices remained steady at 2.0% yoy.
The sharper-than-expected slowdown in inflation adds pressure on SNB to consider additional rate cuts. With core inflation and imported goods prices continuing to decline, SNB may need to act to prevent deflationary risks from taking hold in the coming months.
Sterling Loses Ground Following BoE Bailey’s Interview by Guardian
Markets
Core bonds reversed the safe-haven triggered gains of Tuesday. US yields rose by 3.7 bps (2-yr) to 5.8 bps (30-yr) while German yields rose by 1.9 bps (2-yr) to 5.5 bps (30-yr). The US underperformance at the front end of the curve was linked to a decent ADP employment report (143k from 103k vs 125k expected) which tilted the odds again somewhat more in favour of a 25 bps Fed November rate cut. EUR/USD slid from the 1.1075 area to currently 1.1025. Comments by ECB Schnabel – “we cannot ignore the headwinds to growth” – further bolster the case of a 25 bps rate cut by the ECB in October. US weekly jobless claims and services ISM are today’s sources of volatility. JPY remains in the defensive following political calls (new PM Ishiba) at the address of the BoJ to keep policy rates stable. The jury is out whether this will have any impact (independent central bank?!) or whether this is more of a window-dressing operation to polish his market-friendly image. USD/JPY moved from 143.50 yesterday morning to currently 146.50. The BoJ meets next on October 31.
Sterling loses ground this morning following the release of an interview by Bank of England governor Bailey with the Guardian. He said that the UK economy proved more resilient than feared over the past two years, so there’s a base there to develop. The BoE governor is also encouraged by the fact that cost of living pressures had not been as persistent as thought. If news on inflation (2.2% Y/Y in August) continues to be good, he argues in favour of becoming a bit more activist in the approach to cutting policy rates. So far, the BoE only sliced rates once by 25 bps in August (5-4 vote) and kept them stable in September (8-1 vote). UK money markets discount a second 25 bps rate cut at the November meeting, when the BoE publishes its quarterly Monetary Policy Report, but only attach a 50% probability to more action in December. The bottom of the expected rate path in the UK next year (>3.5%) is also significantly higher still than for example in Europe (1.5%-1.75%) or the US (<3%). That leaves quite some room for repositioning should the BoE effectively start a more aggressive normalization campaign and makes sterling vulnerable in the process. EUR/GBP rises in Asian trading from 0.8325 to 0.8370 in a move which we expect to continue. Regaining EUR/GBP 0.84 would turn the short term picture neutral again for the currency pair. GBP/USD failed to move above 1.34 earlier this week as USD profited from some safe haven flows. GBP weakness now takes over with cable losing a big figure from 1.3275 to 1.3175 this morning.
News & Views
The IMF in concluding its annual (Article IV) review said Australia’s “last mile” in taming inflation back to target is proving particularly difficult. Keeping the policy rate at 4.35% even when the rest of the advanced world started easing was therefore appropriate. The IMF said the central bank may even need to raise them again if inflation – still almost 4% in Q2 - stopped falling. Washington urged for the government to play their part with tighter fiscal policy as well. It welcomed two consecutive federal government surpluses (A$15.8 in 2023-2024) but Australia’s Treasury back in May forecasted the budget would return to deficit over the forecast horizon out to 2027-2028. This (fiscal) year’s deficit is projected at A$28.3bn, which the IMF said is delivering a “positive fiscal impulse” at a time where inflation is still hovering above the central bank’s 2-3% target. The Reserve Bank of Australia’s next policy meeting is on November 5. Money markets expect virtually nothing though. A first 25 bps cut isn’t fully priced in before February of next year. The Australian dollar meanwhile hovers near YtD highs of AUD/USD 0.69.
OPEC+ is sticking with plans to gradually scale back oil production curbs. In yesterday’s meeting, the Saudi led oil cartel reaffirmed its intention to revive output with 180k barrels a day starting from December. That was already two months later than originally scheduled due to a steep drop in oil prices in recent weeks/months over global demand concerns. After briefly dropping below $70 (Brent) for the first time since end 2021 early September, prices have rebounded a bit. Partly in response to the series of Chinese stimulus measures announced over the last two weeks but mostly on fears for a disruption in supply as the conflict in the Middle East escalated. After trading as high as $76, prices yesterday pulled back intraday after the US unexpectedly posted a weekly inventory build-up. One barrel is currently changing hands for $74.8.
Graphs
GE 10y yield
The ECB cut policy rates by 25 bps in June and in September. Stubborn inflation (core, services) makes a follow-up move less evident in October, but very weak PMI’s and soft Lagarde comments hang in the balance. Disappointing US and unconvincing-to-outright-weak EMU activity data dragged the long end of the curve down with the 2023 low at 1.89% as key support.
US 10y yield
The Fed kicked off its easing cycle with a 50 bps move. It is headed towards a neutral stance now that inflation and employment risks are in balance. Conservative SEP unemployment forecasts risk being caught up by reality and with it the dot plot (50 bps more cuts in 2024). We hold our call for two more 50 bps cuts this year. Pressure on the front of the curve and weakening eco data keeps the long end in the defensive for now as well.
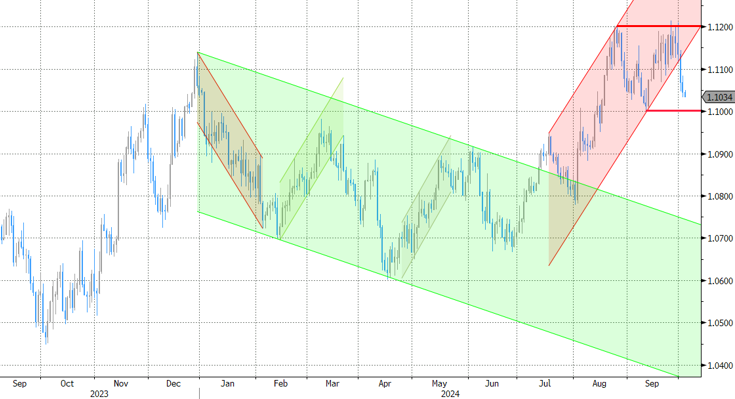
EUR/USD
EUR/USD moved above the 1.09 resistance area as the dollar lost interest rate support at stealth pace. US recession risks and bets on fast and large rate cuts trumped traditional safe haven flows into USD. An ailing euro(pean economy) only briefly offset some of the general USD weakness. EUR/USD’s dollar-driven bumped into 1.12 resistance.
EUR/GBP
The BoE delivered a hawkish cut in August. Policy restrictiveness will be further unwound gradually on a pace determined by a broad range of data. The strategy similar to the ECB’s balances out EUR/GBP in a monetary perspective. But the economic picture is increasingly diverging to the benefit of sterling, pulling EUR/GBP below 0.84 support. Dovish comments by BoE Bailey ended by default GBP-strength.
Oil Struggles to Break Above Key Medium-Term Resistance
The geopolitical situation in the Middle East gets tenser, and the Federal Reserve (Fed) doves get worried with the sight of better-than-expected jolts and ADP report announced earlier in the week.
Yesterday’s ADP report showed that the US economy added around 142K new private jobs last month, comfortably higher than the 124K pencilled in by analysts. Last month’s figure was revised higher. The numbers are not near 200-300K job additions of the post-pandemic months – far from that – but we are not seeing the kind of numbers that would keep the expectation of another jumbo rate cut from the Fed in November either. The US 2-year yield is pushing gently above the 3.60% level, having bottomed near the 3.50% last week when the 50bp cut expectations for November have surfaced, the 10-year yield recovered to 3.80% and the US dollar broke above its negative trend top building since summer and is preparing to test the 50-DMA. The last test for the US dollar bulls is tomorrow’s official jobs data. If the data continues to show that the US jobs market is slowing but not collapsing, we shall see the US dollar recover further.
The broadly stronger US dollar, combined with a slide in the euro area inflation below the European Central Bank’s (ECB) 2% inflation target justifies a further selloff in the EURUSD. The pair took out the 50-DMA support and is now preparing to test the next, and the important psychological support of $1.10 level. Below that, at 1.0980, stands the major 38.2% Fibonacci retracement on June to September rebound, and should distinguish between the positive trend building since summer and a medium-term bearish reversal.
And of course, the sharp yen selloff in the Japanese yen is giving an additional support to the US dollar following the new PM Ishiba’s comments that the Japanese economy is ‘not ready yet for further rate hikes’ and hopes that the ‘economy will make progress n a sustainable manner toward the end of deflation with monetary easing trend in place’. The USDJPY was sent immediately above the 146 level. We can forget a sustainable fall to and below the 140 mark. There is a greater chance that we see the pair return and stabilize near the 148/150 level.
Now, a better-than-expected set of US jobs data is positive for the US dollar bulls and negative for the US treasuries, but it is not outright positive or negative for sentiment in the stock markets. Yes, the Fed cuts are supportive of valuations and the 50bp cut has provided a lot of joy to stock investors, but a collapsing jobs market is fundamentally bad news for the economy. So the impact of a possibly stronger-than-expected jobs data on Friday is difficult to tell. In one hand, a good set of data would confirm that the US economy is doing well enough to keep the S&P500’s profit expectations strong and give a further support to stock valuations near ATH levels. On the other hand, a too strong set of data would crash the expectations of further and aggressive rate cuts from the Fed and that’s mathematically unfavourable for the stock valuations. Investors’ opinions diverge. Many think that the 6000 for the S&P500 is not only within reach but is too easy to reach, while a few others – like Apollo’s CEO - think that the Fed has no reason to keep cutting rates and that its aggressive U-turn could backfire. After all, the US ports went on a strike this week, oil bulls give signs of life as a result of a widening war in the Middle East and the Fed may have declared victory on inflation earlier than ideal, and probably louder than reasonable.
Oil topside remain limited at key technical resistance
Oil prices rose yesterday as Israel promised to retaliate against Iran and the G7 leaders announced that they are preparing to impose fresh sanctions on Iran. But the topside in US crude rally remained capped near the $72.85pb level, the major Fibonacci retracement on July to September retreat, and that should, in theory, distinguish between the actual bearish trend and a medium-term bullish reversal. I know I insist but I find the US crude’s inability to clear this technical resistance interesting and informing. It tells me that the geopolitical tensions do attract tactical longs, but the conviction for reversing a medium-term trend is still not strong enough. Look, we saw yesterday’s gains rapidly given back after the EIA data showed a 3.9-mio barrel build in US oil inventories last week.
Now, note that some bullish voices are emerging, putting the $100 per barrel target back on the table. But I believe that we will hardly see the barrel of US crude go past the $88-90pb range in case of badly deteriorating situation in the Middle East, because OPEC is preparing to call the end of its production restrictions by the end of the year as Saudi is moving toward a strategy where it will try to increase its market share rather than supporting oil prices. And second, around half to two-thirds of the Iranian oil goes mainly to China – which is not concerned by the sanctions. The only thing that could materially extend crude oil’s topside is if the US-backed Israel attacked the Iranian oil facilities. That’s the biggest risk to the global oil supply and that’s – to me – the only scenario which would justify a rise in crude prices to $100pb or more. And even then, imagine what would happen to the Fed – and other major central banks’ – inflation expectations and loosening policies. A significant rally in energy costs would simply stop and reverse them – which in return would boost the global recession expectations and limit oil’s upside potential. What I am trying to say is that, the geopolitical tensions could be interesting tactical opportunities for the oil bulls, but the medium-term picture remains comfortably bearish.