
Sample Category Title
Australian Dollar Reaches 19-Month High Boosted by Chinese Economic Stimulus and Weaker US Dollar
The AUD/USD pair climbed to 0.6922 on Monday, marking its highest point since February 2023. This surge was primarily triggered by China’s announcement of economic stimulus measures, which is significant given China’s status as Australia’s largest trading partner. Such support for the Chinese economy will likely increase demand for commodities and bolster major currencies tied to trade with China.
Additionally, the Australian dollar has benefited from the recent weakness in the US dollar, spurred by disappointing economic data from the US. This has heightened market expectations that the Federal Reserve will persist with rapid interest rate cuts.
At its September meeting, the Reserve Bank of Australia (RBA) opted to maintain its interest rate at 4.35% per annum, suggesting that the current monetary policy might remain unchanged for some time. The RBA’s cautious approach reflects its strategy of closely monitoring inflation and employment trends without immediate concern about aligning its pace with other global central banks.
This week is set to be significant for the Australian dollar. Australia is scheduled to release data on retail sales, construction, and various trade indicators, which could influence the currency’s trajectory.
Technical analysis of AUD/USD
The AUD/USD market is extending the fifth wave of growth, with a consolidation range forming around the 0.6925 level. There is potential for an upward break targeting 0.6983. After reaching this level, a corrective movement to retest 0.6925 may occur. If the bullish momentum continues, the next wave could reach 0.7033. The MACD indicator supports this bullish scenario, with its signal line well above zero and upwards.
On the hourly chart, the AUD/USD has achieved a growth wave up to 0.6926 and is now consolidating just below this level. If the pair exits this range downward, a correction to 0.6877 could be expected. Conversely, a breakout above could extend the uptrend towards 0.6982, potentially reaching 0.7033. The Stochastic oscillator, currently above 80 and trending downward, suggests a short-term pullback might occur before further advances.
USD/JPY Mid-Day Outlook
Daily Pivots: (S1) 140.66; (P) 143.58; (R1) 145.08; More...
Intraday bias in USD/JPY remains on the downside for the moment. Fall from 146.48 is in progress for retesting 139.578. Strong support could be seen again from 139.26 fibonacci level to bring rebound. However, firm break of 139.26 will carry larger bearish implications.
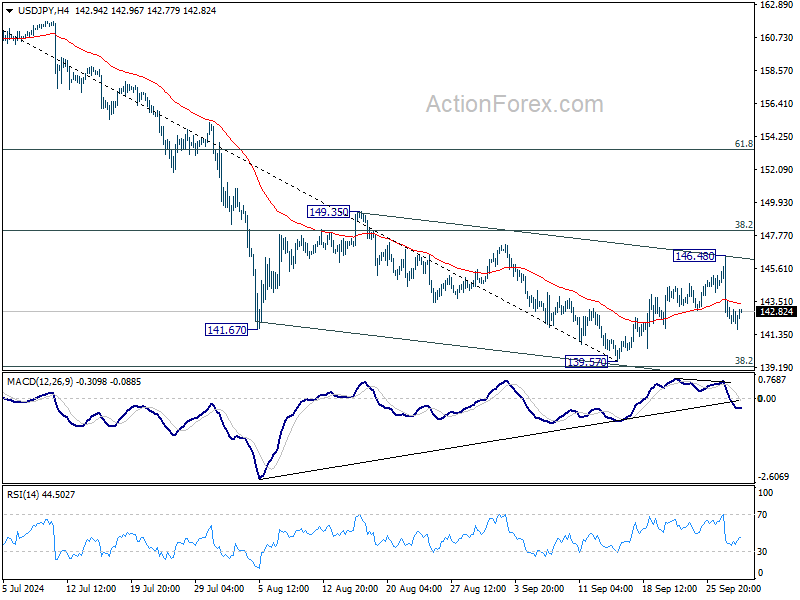
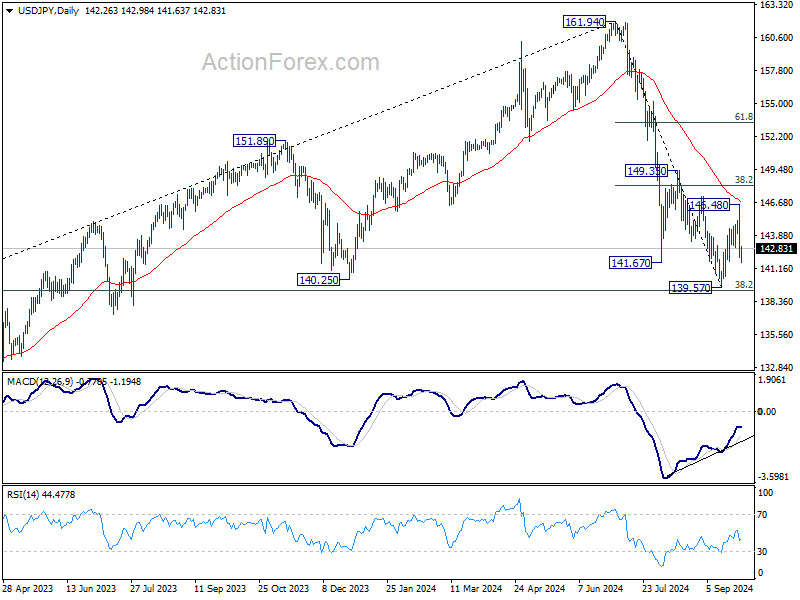
In the bigger picture, fall from 161.94 medium term top is seen as correcting whole up trend from 102.58 (2021 low). Strong support could be seen from 38.2% retracement of 102.58 to 161.94 at 139.26 to contain downside, at least on first attempt. But in any case, risk will stay on the downside as long as 149.35 resistance holds. Sustained break of 139.26 would open up deeper medium term decline to 61.8% retracement at 125.25.
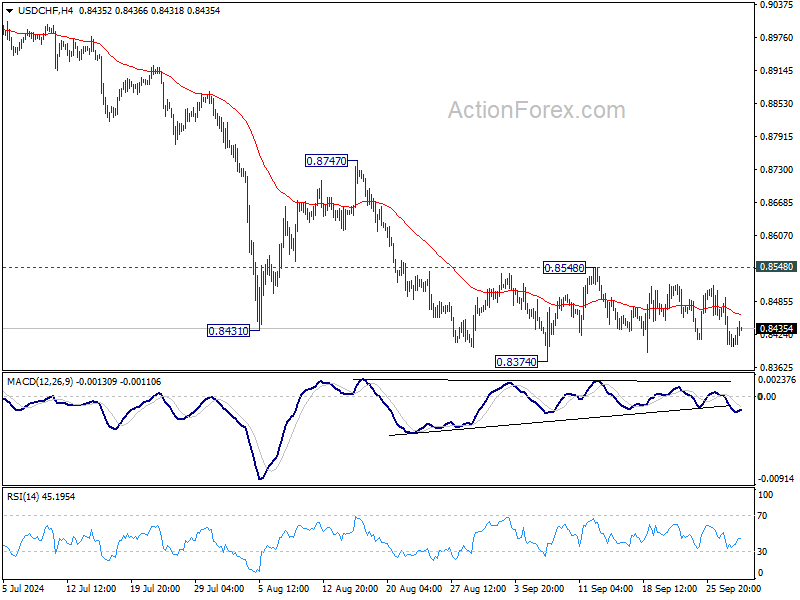
USD/CHF Mid-Day Outlook
Daily Pivots: (S1) 0.8374; (P) 0.8433; (R1) 0.8465; More…
USD/CHF is still bounded in sideway trading and intraday bias remains neutral. Further decline is in favor with 0.8548 resistance intact. On the downside, break of 0.8374 will resume the fall from 0.9223 to retest 0.8332 low. Decisive break there will indicate larger down trend resumption. Nevertheless, firm break of 0.8548 will turn bias back to the upside for stronger rebound to 0.8747 resistance instead.
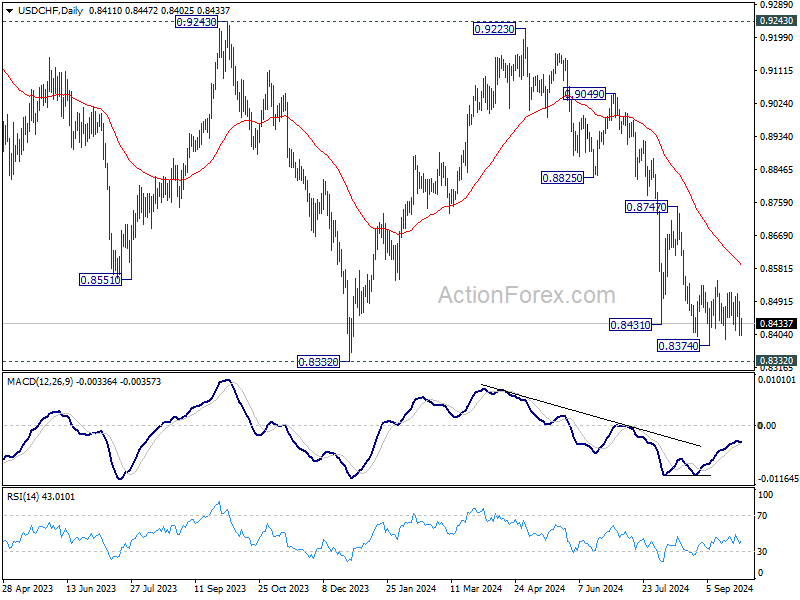
In the bigger picture, price actions from 0.8332 (2023 low) are currently seen as a medium term corrective pattern, with fall from 0.9223 as the second leg. Strong support could be seen from 0.8332 to bring rebound. Yet, overall outlook will continue to stay bearish as long as 0.9243 resistance holds. Firm break of 0.8332, however, will resume larger down trend from 1.0146 (2022 high).
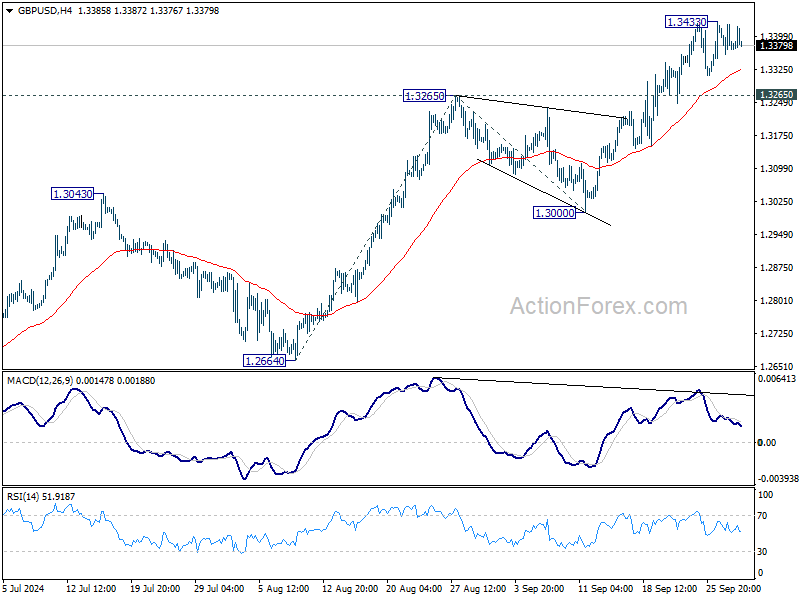
GBP/USD Mid-Day Outlook
Daily Pivots: (S1) 1.3346; (P) 1.3387; (R1) 1.3414; More...
GBP/USD is extending consolidation below 1.3433 temporary top and intraday bias remains neutral. Further rally is expected as long as 1.3265 resistance turned support holds. Above 1.3433 will resume larger rise to 100% projection of 1.2664 to 1.3265 from 1.3000 at 1.3601 next. Nevertheless, considering bearish divergence condition in 4H MACD, firm break of 1.3265 will indicate short term topping and turn bias back to the downside for 1.3000 support instead.
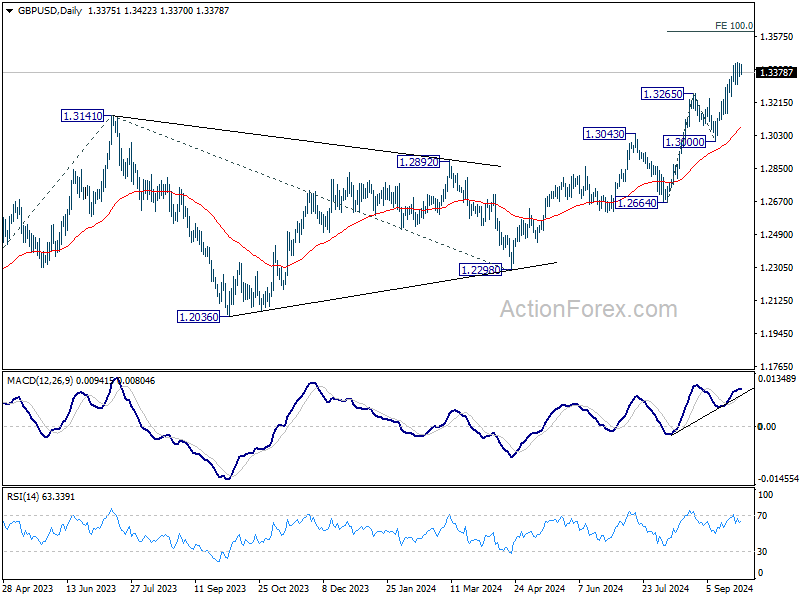
In the bigger picture, up trend from 1.0351 (2022 low) is in progress. Next target is 61.8% projection of 1.0351 to 1.3141 from 1.2298 at 1.4022. For now, outlook will stay bullish as long as 1.3000 support holds, even in case of deep pullback.
EUR/USD Mid-Day Outlook
Daily Pivots: (S1) 1.1124; (P) 1.1164; (R1) 1.1202; More....
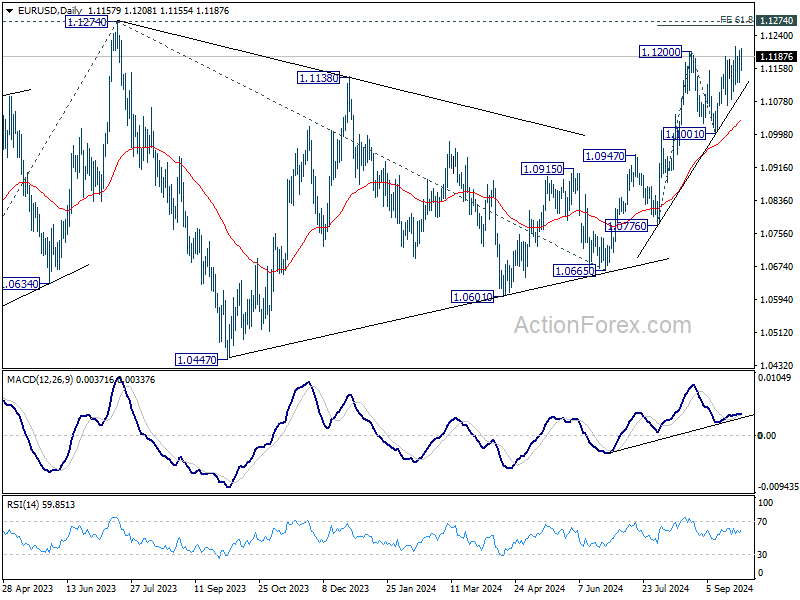
EUR/USD recovers mildly today but stays in range below 1.1213. Intraday bias remains neutral and more consolidations could still be seen. But further rally is expected as long as 1.1001 support holds. Above 1.1213 will resume the rise from 1.0665 to 1.1274 high. Firm break there will resume larger up trend. Next near term target will be 100% projection of 1.0776 to 1.1200 from 1.1001 at 1.1425.
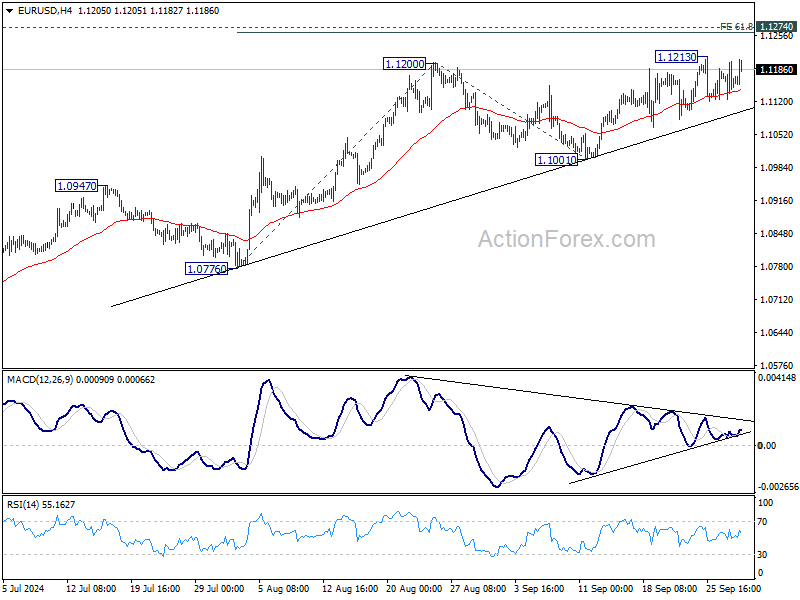
In the bigger picture, corrective pattern from 1.1274 should have completed at 1.0665 already. Decisive break of 1.1274 (2023 high) will confirm resumption of whole up trend from 0.9534 (2022 low). Next target will be 61.8% projection of 0.9534 to 1.1274 from 1.0665 at 1.1740. This will now be the favored case as long as 1.1001 support holds.
Euro Recovers Despite Soft German Inflation Data, AUD/JPY in Focus for Upcoming Session
Forex market activity was relatively subdued during European trading hours, with Euro recovering against both Sterling and Swiss Franc despite lower-than-expected inflation reading from Germany. However, the common currency continues to face resistance in breaking out of its range against Dollar. Markets will keep a close eye on ECB President Christine Lagarde, who is set to speak, though she is not expected to provide any new policy insights. Investors are likely to maintain their focus on Eurozone inflation data later in the week for further cues on ECB policy direction.
Meanwhile, Dollar is trading sluggishly with no high-impact economic data scheduled for release today. Federal Reserve Chair Jerome Powell and Governor Michelle Bowman are due to speak, with Powell expected to maintain a neutral stance, while Bowman is likely to express caution over further monetary easing. The market’s attention remains on key income data, with the ISM reports and non-farm payrolls later in the week being the most crucial indicators for Fed’s policy outlook.
In terms of currency performance, Australian Dollar is currently leading the market, followed by New Zealand Dollar and Euro. On the weaker side, Swiss Franc is the worst performer, followed by Japanese Yen and Canadian Dollar. US Dollar and British Pound are mixed, trading in the middle of the pack.
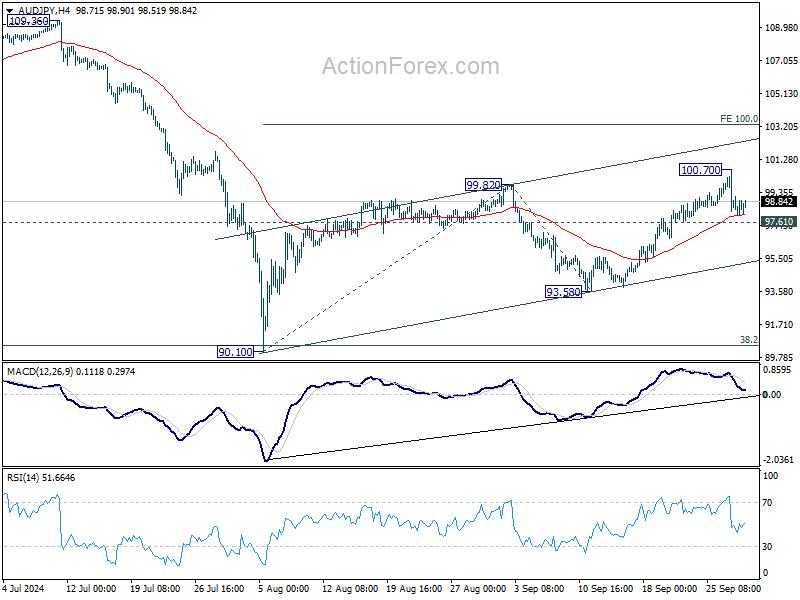
Looking ahead, AUD/JPY will be a key focus in the upcoming Asian session as BoJ releases its summary of opinions and the Tankan survey, while Australia is set to publish retail sales data. Technically, AUD/JPY's retreat from 100.70 is contained above 97.67 minor support so far. Further rally remains in favor and break of 100.70 will resume the corrective rise from 90.10 to 100% projection of 90.10 to 99.82 from 93.58 at 103.30. However, firm break of 97.61 will suggest that the corrective rise has completed and bring deeper fall back to 93.58 support first.
In Europe, at the time of writing, FTSE is down -0.63%. DAX is down -0.75%. CAC is down -1.69%. UK 10-year yield is up 0.0316 at 4.011. Germany 10-year yield is up 0.021 at 2.157. Earlier in Asia, Nikkei fell -4.80%. Hong Kong HSI rose 2.43%. China Shanghai SSE rose 8.06%. Singapore Strait Times rose 0.33%. Japan 10-year JGB yield rose 0.0496 to 0.857.
Swiss KOF rises to 105.5, economy slowly working out of trough
Swiss KOF Economic Barometer edged higher in September, rising from 105.0 to 105.5, surpassing market expectations of 102.0. This modest increase reflects a slow but steady recovery in the Swiss economy, with KOF noting that "the Swiss economy is slowly working its way out of the trough."
According to KOF, nearly all sectors show signs of a more favorable outlook. Manufacturing industry, in particular, has seen the most significant improvement, while financial and insurance services, construction, and other service sectors also show positive momentum.
Hospitality industry continues to maintain above-average prospects, with little change compared to prior months. On the demand side, consumer demand indicators remain stable and point to further growth. However, KOF highlighted that indicators for future foreign demand have weakened, suggesting potential challenges for Swiss exports going forward.
China’s PMI data points to continued manufacturing contraction and weakening services sector
China’s economic data for September painted a mixed picture, with manufacturing remaining in contraction and services sector losing steam.
Official NBS Manufacturing PMI edged up slightly from 49.1 in August to 49.7, above expectations of 49.5 but still below the 50-mark, signaling contraction for the fifth consecutive month. Export orders continued to weaken, with the new manufacturing export order subindex dropping from 48.7 to 47.5.
Meanwhile, NBS Non-Manufacturing PMI fell from 50.3 to 50.0, marking the end of 20 straight months of expansion. Within the non-manufacturing sectors, construction showed a marginal improvement, with its subindex rising to 50.7, but services dipped into contraction territory, falling from 50.2 to 49.9.
NBS PMI Composite rose modestly from 50.1 to 50.4. According to the NBS, extreme weather events like typhoons and the conclusion of the summer travel season significantly impacted transport, culture, and entertainment sectors.
Caixin Manufacturing PMI told a similar story, dropping from 50.4 to 49.3, the lowest reading since July 2023, while Caixin Services PMI also underperformed, falling from 51.6 to 50.3, a 12-month low. Caixin's Composite PMI slipped from 51.2 to 50.3, reflecting broad weakness in both manufacturing and services.
Wang Zhe, senior economist at Caixin Insight Group, noted, "market conditions in the manufacturing sector worsened in September, marked by a limited expansion in supply and a significant contraction in demand.” Business confidence also fell to its "lowest level in recent years".
NZ ANZ business confidence soars to 60.9, raising concerns of overreaction to RBNZ rate cuts
New Zealand’s ANZ Business Confidence Index saw a significant rise in September, jumping from 50.6 to 60.9, reflecting growing optimism in the business sector.
Key components of the survey also painted a positive picture. The own activity outlook rose from 37.1 to 45.3, while profit expectations surged from 8.0 to 22.2, suggesting a more upbeat economic environment.
Although cost expectations fell slightly from 68.3 to 66.8, wage expectations edged up from 75.1 to 76.4. Pricing intentions also increased from 41.0 to 42.8, while inflation expectations remained unchanged at 2.92%, marking the second consecutive month below 3%.
ANZ highlighted that this survey underscores " the risk that the economy’s response to lower interest rates could be more vigorous than is generally expected."
Inflation remains a concern. Firms are planning to raise prices by an average of 1.6% over the next three months, a notable increase from the June low of 1.2%. While wage growth has moderated from 4% in April to 3% now, and cost expectations have eased to 2.4%, inflationary pressures still require careful monitoring by RBNZ to ensure price stability.
EUR/USD Mid-Day Outlook
Daily Pivots: (S1) 1.1124; (P) 1.1164; (R1) 1.1202; More....
EUR/USD recovers mildly today but stays in range below 1.1213. Intraday bias remains neutral and more consolidations could still be seen. But further rally is expected as long as 1.1001 support holds. Above 1.1213 will resume the rise from 1.0665 to 1.1274 high. Firm break there will resume larger up trend. Next near term target will be 100% projection of 1.0776 to 1.1200 from 1.1001 at 1.1425.
In the bigger picture, corrective pattern from 1.1274 should have completed at 1.0665 already. Decisive break of 1.1274 (2023 high) will confirm resumption of whole up trend from 0.9534 (2022 low). Next target will be 61.8% projection of 0.9534 to 1.1274 from 1.0665 at 1.1740. This will now be the favored case as long as 1.1001 support holds.
Economic Indicators Update
| GMT | CCY | EVENTS | ACT | F/C | PP | REV |
|---|---|---|---|---|---|---|
| 23:50 | JPY | Industrial Production M/M Aug P | -3.30% | -0.50% | 3.10% | |
| 23:50 | JPY | Retail Trade Y/Y Aug | 2.80% | 2.60% | 2.60% | |
| 01:00 | NZD | ANZ Business Confidence Sep | 60.9 | 50.6 | ||
| 01:30 | AUD | Private Sector Credit M/M Aug | 0.50% | 0.50% | 0.50% | |
| 01:30 | CNY | NBS Manufacturing PMI Sep | 49.8 | 49.5 | 49.1 | |
| 01:30 | CNY | NBS Non-Manufacturing PMI Sep | 50 | 50.4 | 50.3 | |
| 01:45 | CNY | Caixin Manufacturing PMI Sep | 49.3 | 50.5 | 50.4 | |
| 01:45 | CNY | Caixin Services PMI Sep | 50.3 | 51.5 | 51.6 | |
| 05:00 | JPY | Housing Starts Y/Y Aug | -5.10% | -3.00% | -0.20% | |
| 06:00 | EUR | Germany Import Price Index M/M Aug | -0.40% | -0.30% | -0.40% | |
| 06:00 | GBP | GDP Q/Q Q2 F | 0.50% | 0.60% | 0.60% | |
| 07:00 | CHF | KOF Economic Barometer Sep | 105.5 | 102 | 101.6 | 105 |
| 08:30 | GBP | M4 Money Supply M/M Aug | -0.10% | 0.20% | 0.30% | |
| 08:30 | GBP | Mortgage Approvals Aug | 65K | 64K | 62K | |
| 12:00 | EUR | Germany CPI M/M Sep P | 0.00% | 0.10% | -0.10% | |
| 12:00 | EUR | Germany CPI Y/Y Sep P | 1.80% | 1.90% | 1.90% | |
| 13:45 | USD | Chicago PMI Sep | 46.5 | 46.1 |
Japanese Yen Soars on Japan’s Political Drama
The Japanese yen has steadied on Monday after posting huge gains on Friday. USD/JPY is trading at 142.43 in the European session, up 0.15%.
Incoming PM Ishiba says he’ll call snap election
The yen soared on Friday but it was in response to political rather than economic developments. The ruling Liberal Democratic Party (LDP) unexpectedly chose Shigeru Ishiba as its new leader and he will take over as Prime Minister on Tuesday. Ishiba’s win was a surprise as Economic Minister Sanae Takaichi was expected to win the LDP leadership race.
The financial markets reacted sharply – the Japanese yen soared 2.1% on Friday while the Japanese stock market is sharply lower today. Takaichi is a strong supporter of lower interest rates while Ishiba favors the Bank of Japan’s moves towards normalization. Ishiba said today that he will call a snap election on October 27, which he is almost certain to win. Ishiba’s election would be a green light for the BoJ to continue tightening policy which would make the yen more attractive to investors.
Overshadowed by the political drama was Monday’s Japanese data, which was a mix. Industrial production slid 3.3% m/m in August, after a 3.1% gain in July and well short of the market estimate of -0.9%. Yearly, industrial production declined 4.9%, compared to a 2.9% gain in July.
There was better news from retail sales, which rose 0.8% m/m in August, up from 0.2% in July and a three-month high. Yearly, retail sales climbed 2.8%, up from a revised 2.7% in July and above the market consensus of 2.3%.
US Core PCE drops to 0.1%
Inflation remains under control and this was reiterated on Friday by the US Core PCE Price Index, the Fed’s preferred inflation indicator. The index rose 0.1% m/m in August, a three-month low. This was down from 0.2% in July and below the market estimate of 0.2%. Yearly, Core PCE ticked up to 2.7%, after three consecutive months at 2.6% and in line with expectations.
USD/JPY Technical
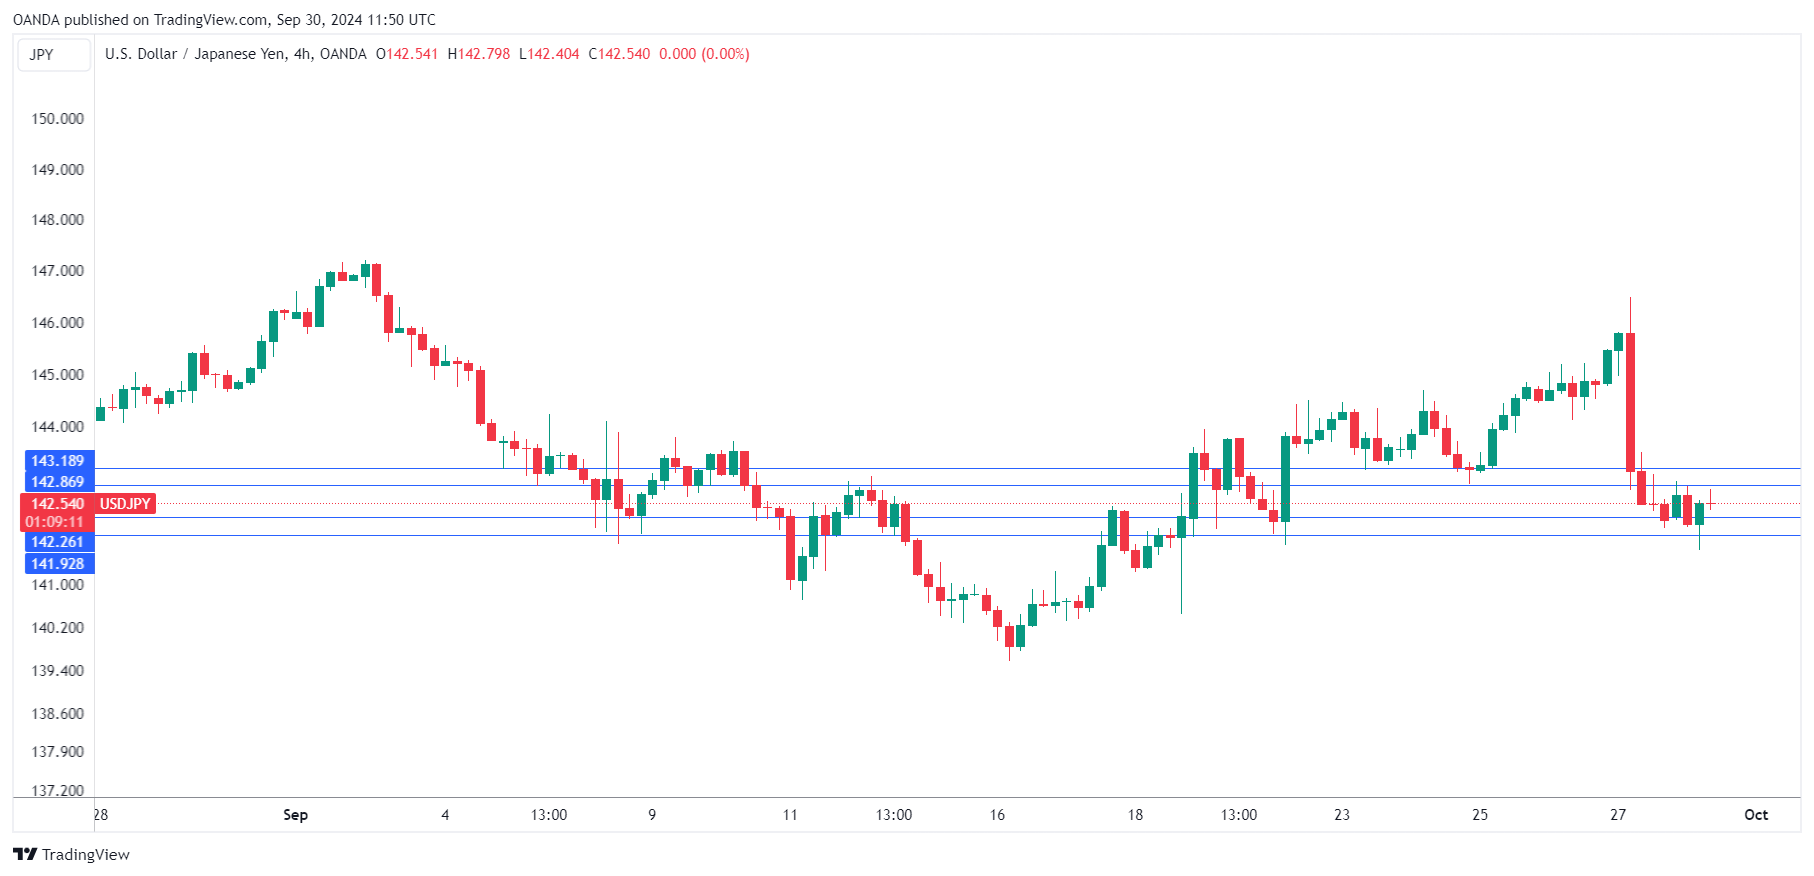
- USD/JPY tested resistance at 142.86 earlier. Above, there is resistance at 143.19
- There is support at 142.26 and 141.93
Hang Seng Index: Start of a Potential New Medium-Term Bullish Trend
- Aggressive interest rate cuts by PBoC coupled with potential expansionary fiscal policies that target consumer spending have stoked positive animal spirits.
- Market breadth has improved on China CSI 300 and Hong Kong Hang Seng Index.
- Watch the key medium-term support of 18,290 on the Hang Seng Index.
Since the start of last week, a change of fortunes has occurred in the China and Hong Kong stock markets due to a revival of positive animal spirits driven by a fresh aggressive monetary policy stance adopted by China’s central bank, PBoC together with hints of upcoming expansionary fiscal policies that target consumer spending.
CSI 300 and Hang Seng Index outperformed
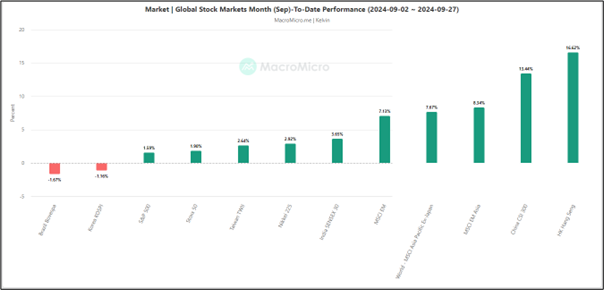
Fig 1: Monthly performance of global benchmark stock indices as of 27 Sep 2024 (Source: Macro Micro, click to enlarge chart)
Based on a month-to-date performance as of 27 September, the China CSI 300 (+13.44%) and Hang Seng Index (+16.62%) outperformed the regional stock markets excluding Japan (+7.67%), and other major benchmark stock indices such as US S&P 500 (+1.59%), and Japan Nikkei 225 (+2.92%) (see Fig 1).
A significant portion of the gains seen in the China and Hong Kong benchmark stock indices came from last week when the CSI 300 recorded a weekly return of 15.70% and the Hang Seng Index rose by 13%, notching their biggest weekly gains since November 2008 and 1998 respectively.
Desperate times call for more aggressive accommodating policies
Recent key economic data such as PMI (manufacturing and services), retail sales, industrial productions, consumer inflation, and producers’ prices have indicated persistent internal demand weakness in China that will be a challenge for China to hit its annual 2024 economic growth target of 5%.
In an attempt to halt the deflationary spiral in China, PBoC has announced a slew of simultaneous interest rate cuts on its key monetary policy tools this week; 50 basis points (bps) cut to banks’ reserve requirement ratio (with a possibility of an additional 25 bps to 50 bps in the near future), 20 bps cut on its seven-day repo rate to lower it to1.5%, reduced the one-year medium-term loan rate by 30 bps to 2%, and lowered housing mortgage rates.
In addition, PBoC has announced at least 500 billion yuan of liquidity support for stocks via a swap facility that allows securities, fund management, and insurance companies to tap the PBoC to buy stocks that include a stock stabilization fund.
Also to cushion the potential rising level of non-performing loans of Chinese commercial banks that are tied to the weak real estate market, China’s top policymakers are considering injecting up to 1 trillion yuan of capital into the biggest state banks to shore up their respective balance sheet to support the struggling economy.
Expansionary fiscal policies are needed to prevent a liquidity trap
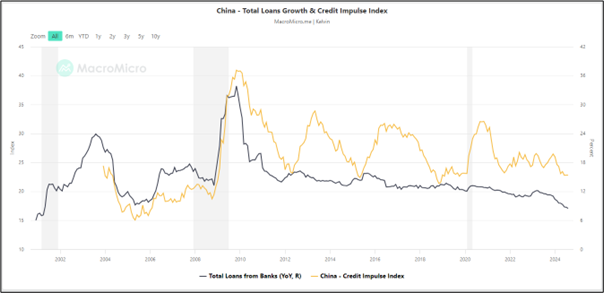
Fig 2: China’s total loans growth & Credit Impulse Index as of 30 Aug 2024 (Source: Macro Micro, click to enlarge chart)
Due to lacklustre consumer and business confidence in China, credit growth in China has declined significantly as seen in the total loans from banks that have plummeted from 12.5% y/y in April 2023 to 8.50% in August 2024. A similar downtrend can also be seen in the Credit Impulse Index (see Fig 2).
Hence, opening more of the liquidity floodgates via an aggressive accommodating monetary policy may not be able to have an additional positive impact on economic growth due to a liquidity trap issue that arises from a lack of credit demand from consumers and businesses.
To address the crux of reversing the deflationary spiral environment in China, expansionary fiscal policies need to be implemented alongside aggressive interest rate cuts.
After almost a year-long of piecemeal expansionary policies, China’s Politburo (the top leadership) concluded its monthly September last Thursday, 26 September with much more “forceful” tonality in the ex-post meeting statement such as a vow to make the real estate market “stop declining”.
Also, there is a potential issuance of 2 trillion yuan of special sovereign bonds to be allocated for fiscal spending where there is a possibility for the proceeds to be utilized to boost consumer spending as a rare one-off cash handout for needy Chinese residents was announced last Wednesday, 25 September.
The deployment of such one-time handouts within a short period has appeared to be a change in stance from China’s top policymakers who in the past eschewed consumer welfarism, prompting potentially more forceful expansionary fiscal policies to be enacted soon to stimulate consumer spending and confidence that have been dragged down by a persistent weak property market.
Market breadth has improved for China and Hong Kong
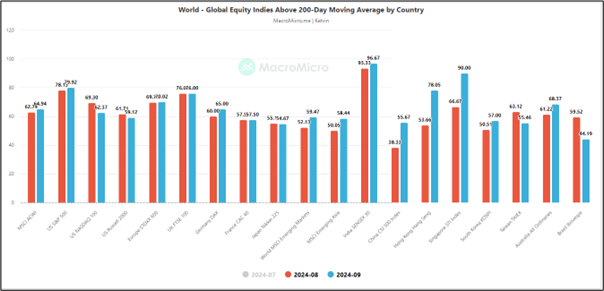
Fig 3: Month-on-month comparison on the percentage of stocks above 200-day MA for global benchmark stock indices as of 27 Sep 2024 (Source: Macro Micro, click to enlarge chart)
Several market breadth indicators have improved for the China and Hong Kong stock indices such as the percentage of component stocks that are trading above the key long-term 200-day moving average.
Measured on a month-on-month basis as of 27 September 2024, the percentage of stocks above their respective 200-day moving averages in the CSI 300 and Hang Seng Index have increased from 38% to 56% (+18 percentage points), and from 54% to 78% (+24 percentage points) respectively (see Fig 3).
The CSI 300, Hang Seng Index, together with the Singapore STI Index have seen the most significant improvement in the percentage of stocks above their respective 200-day moving averages versus other global major benchmark stock indices.
Weekly MACD trend indicator of the Hang Seng Index has turned bullish
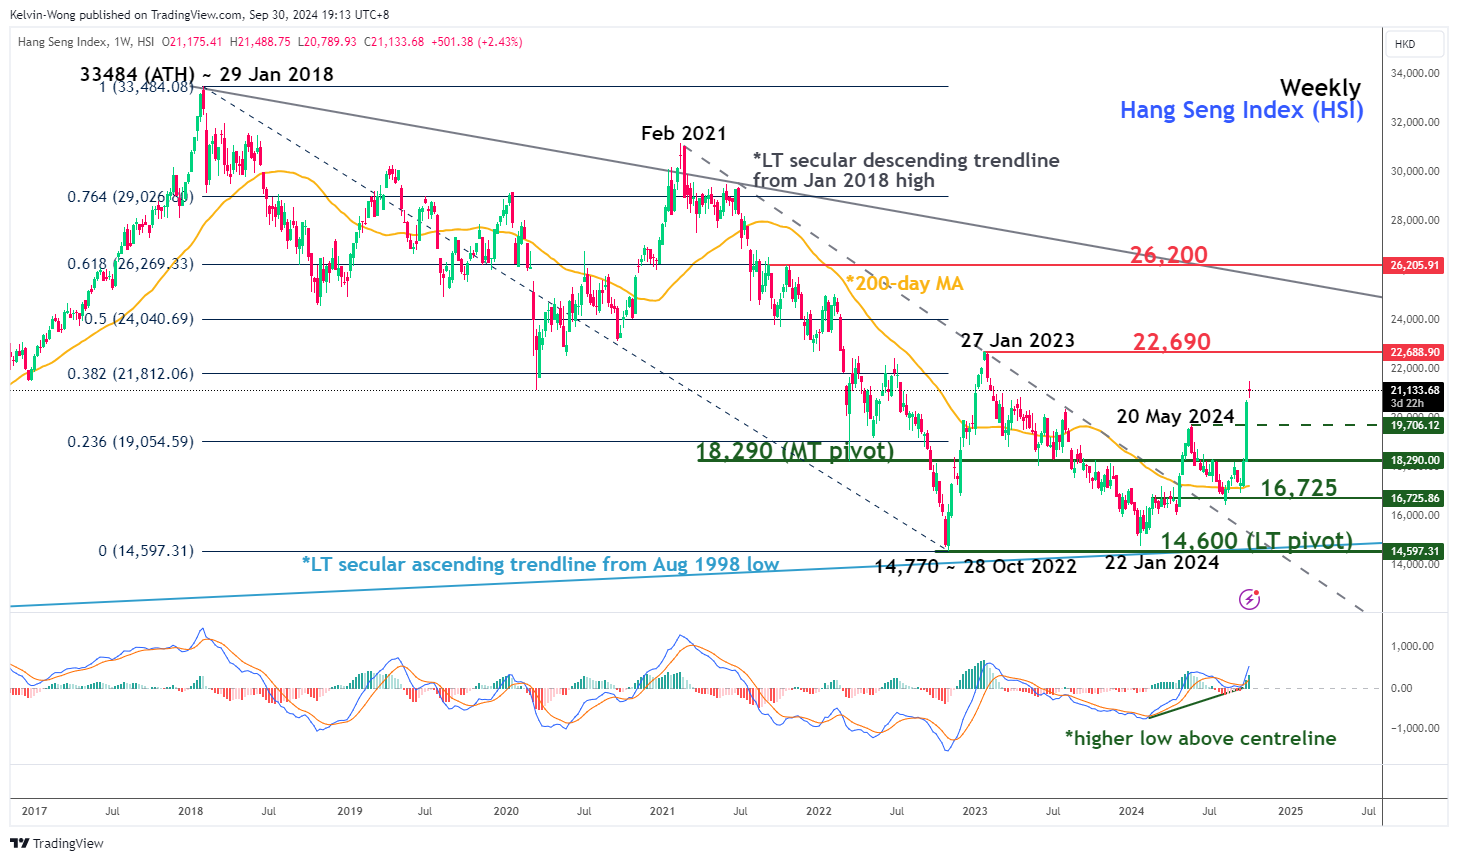
Fig 4: Hang Seng Index medium-term & major trends as of 30 Sep 2024 (Source: TradingView, click to enlarge chart)
The clearance of the 20 May 2024 swing high of 19,706 on the Hang Seng Index coupled with a higher low reading being flashed out on its weekly MACD trend indicator above its centreline suggests that the Index is likely undergoing a new medium-term (multi-week) uptrend phase.
Key medium-term pivotal support stands at 18,290 with next medium-term resistances coming in at 22,690 and 26,200 (also the long-term secular descending trendline from the January 2018 all-time high) (see Fig 4).
On the other hand, a break with a daily close below 18,290 invalidates the bullish scenario for another round of corrective decline to revisit the next medium-term support at 16,725 (also close to the 200-day moving average).
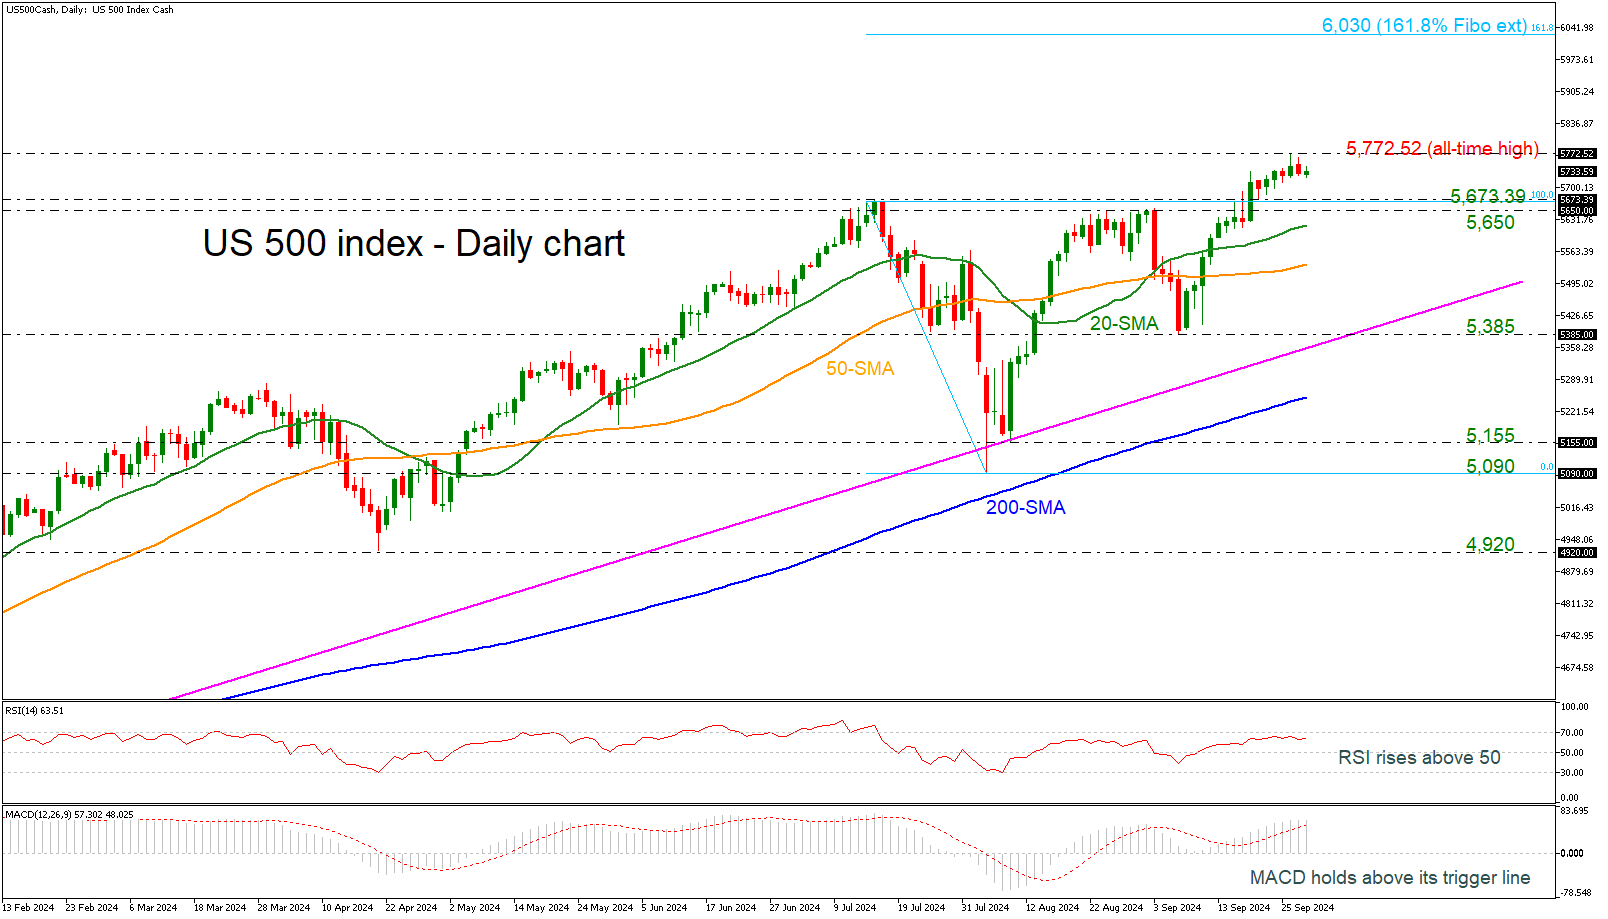
US 500 Calms Down After Hitting New Record High
- US 500 index climbed to new record highs last week
- But got rejected and has retreated a little since
- MACD and RSI look overbought
Following the bounce off the 5,385 support level, the US 500 (cash) index added more than 7%, reaching an all-time high of 5,772.52 last week. Technically, the index is sailing near overbought waters, according to the MACD oscillator. The RSI is also flagging a potential downfall, as it's losing impetus slightly below 70.
If buyers stay in play, the door will open for the next round numbers, such as 5,800 and 5,900, until the price moves up to the 161.8% Fibonacci extension level of the downward wave from 5,673.39 to 5,090 at 6,030.
If the bears press the price below 5,673.39-5,650, the 20- and 50-day simple moving averages (SMAs) may prevent a downfall towards the 5,385 support level. If the latter gives way, the decline could continue toward the 200-day SMA at 5,250.
In a nutshell, despite the latest exciting rebound in the US 500 index, the momentum oscillators are indicating a bearish correction in the short-term view.
USD/JPY Analysis: The Yen Strengthens by Over 2.8% in One Day
According to Reuters, it was announced on Friday that Shigeru Ishiba, known for his tough stance on interest rates, will become Japan's next Prime Minister.
This news caused a sharp intraday reversal in the USD/JPY exchange rate on Friday: while the price initially rose in the morning (as shown by the arrow), it was followed by a sharp downward impulse later in the day.
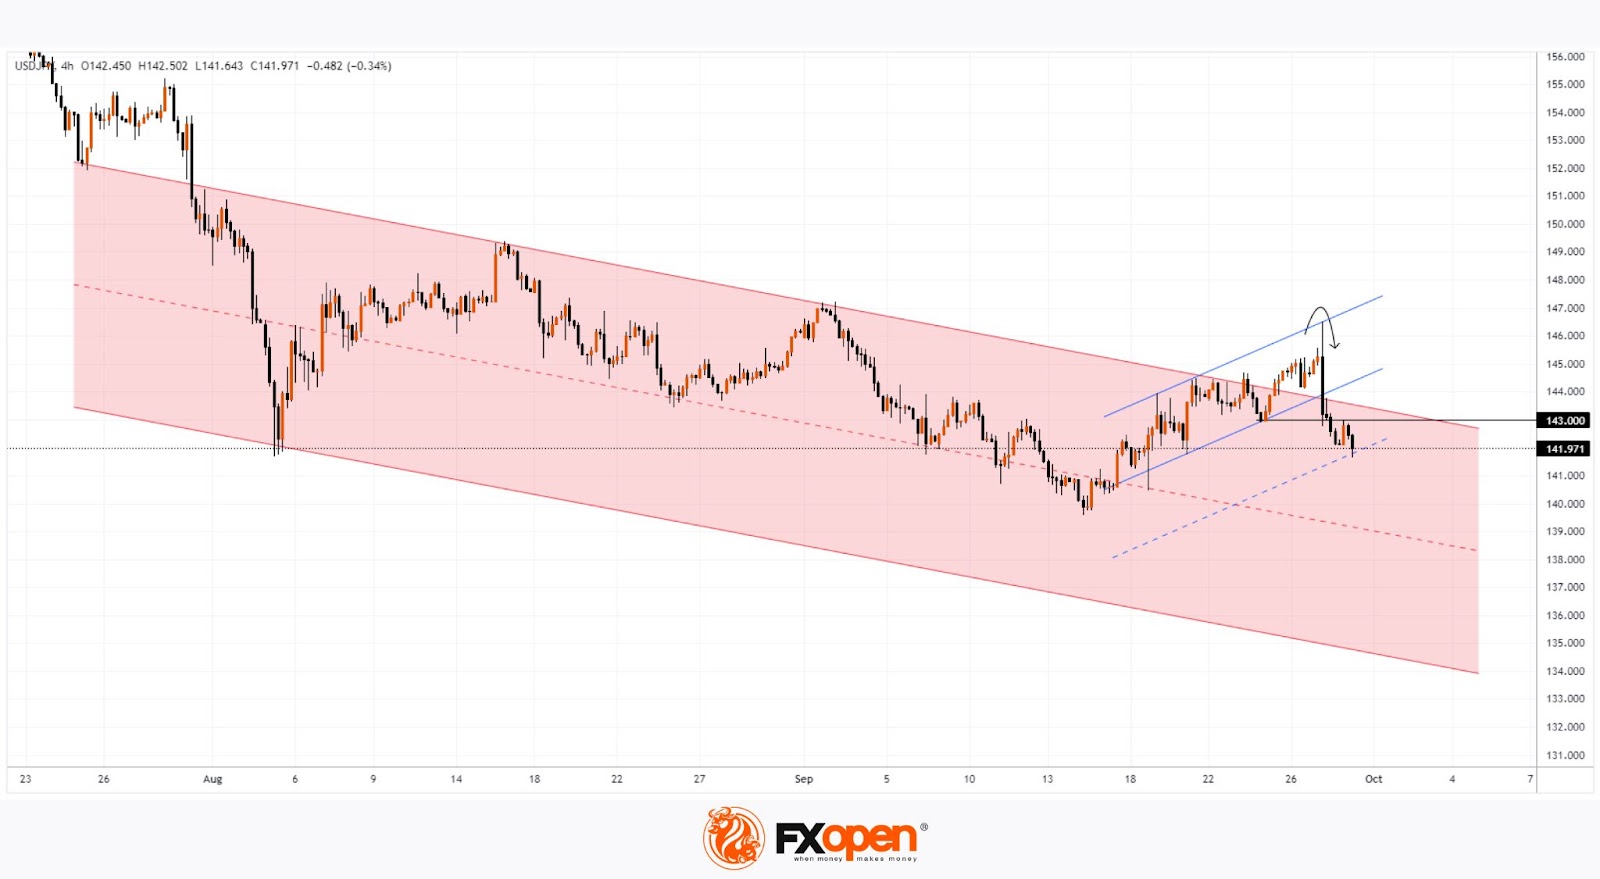
Technical analysis of the USD/JPY chart shows:
→ The price made a false bullish breakout of the upper boundary of the descending channel before retreating back inside it;
→ The price broke the upward trend (marked by blue lines);
→ The ¥143 level shifted from support to resistance;
→ The current support comes from a line drawn below the blue channel (shown by the dotted line).
This suggests that the bears may have taken control, and if their pressure intensifies, the USD/JPY pair could head lower towards the median line of the red channel.
Note: Around 21:00 GMT+3 today, Federal Reserve Chair Jerome Powell is scheduled to speak in Nashville at the annual meeting of the National Association for Business Economics. His remarks could trigger increased volatility in the USD/JPY exchange rate.
Trade over 50 forex markets 24 hours a day with FXOpen. Take advantage of low commissions, deep liquidity, and spreads from 0.0 pips. Open your FXOpen account now or learn more about trading forex with FXOpen.
This article represents the opinion of the Companies operating under the FXOpen brand only. It is not to be construed as an offer, solicitation, or recommendation with respect to products and services provided by the Companies operating under the FXOpen brand, nor is it to be considered financial advice.