Sample Category Title
EUR/USD Dips To Support, Can It Bounce Back?
Key Highlights
- EUR/USD started a downside correction from the 1.1200 zone.
- It traded below a key bullish trend line with support at 1.1125 on the 4-hour chart.
- GBP/USD is consolidating near the 1.3120 level and might correct lower.
- USD/JPY might aim for a fresh increase if it clears the 146.50 resistance.
EUR/USD Technical Analysis
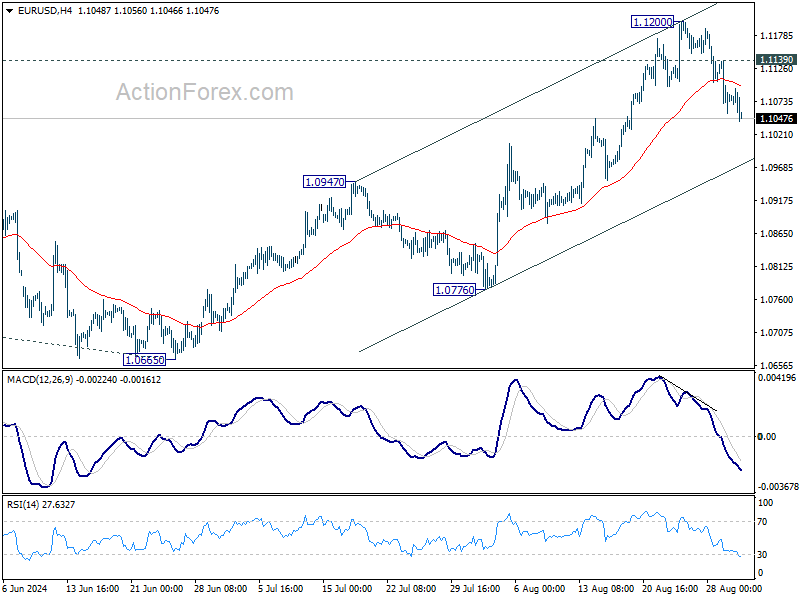
The Euro climbed higher and tested 1.1200 against the US Dollar. Recently, EUR/USD started a downside correction below 1.1150 and 1.1120 levels.
Looking at the 4-hour chart, the pair traded below a key bullish trend line with support at 1.1125. There was a move below the 23.6% Fib retracement of the upward move from the 1.0777 swing low to the 1.1200 high.
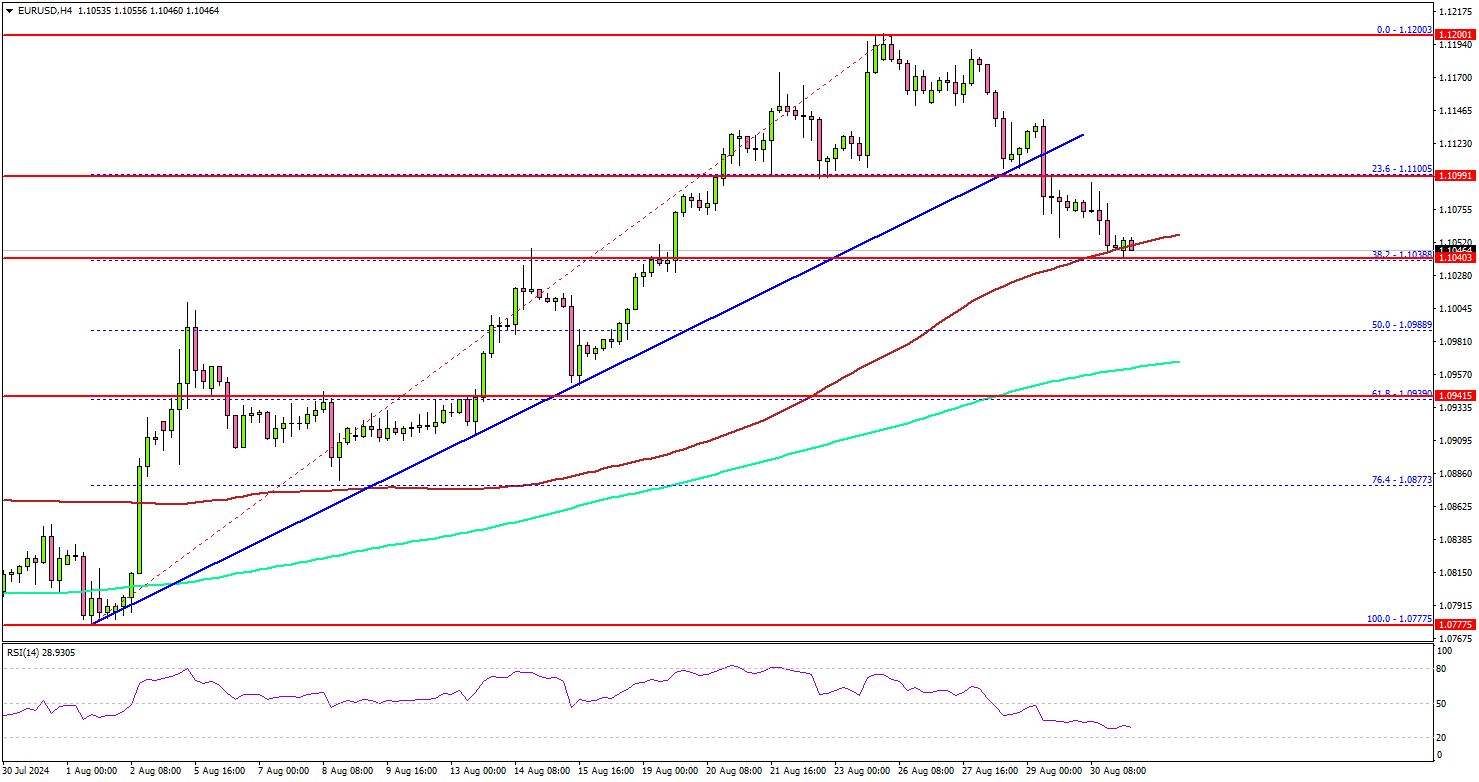
The pair is now trading near the 100 simple moving average (red, 4-hour) and testing the 38.2% Fib retracement of the upward move from the 1.0777 swing low to the 1.1200 high.
On the upside, the pair could face resistance near the 1.1075 level. The next key resistance sits near the 1.1120 level. A clear move above the 1.1120 level could set the pace for a move toward the 1.1150 level. Any more gains might call for a test of the 1.1200 zone.
On the downside, immediate support sits near the 1.1035 level. The next key support sits near the 1.0985 level. The main support is now forming near 1.0950 and the 200 simple moving average (green, 4-hour).
A downside break below the 1.0950 level could set the pace for a larger decline. The next major support is near the 1.0900 level.
Looking at GBP/USD, the pair started a downside correction below 1.3180 and might even revisit the 1.3050 level.
Upcoming Economic Events:
- Germany’s Manufacturing PMI for August 2024 - Forecast 42.1, versus 42.1 previous.
- Euro Zone Manufacturing PMI for August 2024 – Forecast 45.6, versus 45.6 previous.
China’s Caxin PMI manufacturing rises to 50.4, modest return to expansion
China's Caixin PMI Manufacturing rose slightly in August, reaching 50.4 from July's 49.8, signaling a modest return to expansion. The improvement reflects faster output growth and stabilization in employment after an 11-month decline. Meanwhile, average selling prices and input costs continued to decline, indicating ongoing deflationary pressures within the sector.
Wang Zhe, Senior Economist at Caixin Insight Group, noted that while PMI manufacturing returned to expansionary territory, the growth remains "limited". He highlighted the significant challenges China faces in stabilizing its economic growth, particularly given the government's ambitious annual targets. Key issues include weak domestic demand, uncertainties in external demand, and low market optimism, all of which could hinder sustained growth.
In contrast, the official NBS data released over the weekend painted a more subdued picture. NBS PMI Manufacturing fell from 49.5 to 49.1 in August, indicating a deeper contraction in the sector. While PMI Non-Manufacturing ticked up slightly from 50.1 to 50.3, the PMI Composite dropped for the fifth consecutive month, landing at 50.1—the lowest since December 2022.
NBS statistician Zhao Qinghe attributed the decline in manufacturing to several factors, including extreme weather, off-season production in certain industries, insufficient demand, and fluctuations in commodity prices.
Japan’s PMI manufacturing finalized at 49.8, close to stabilization amid rising cost burdens
Japan’s Manufacturing PMI for August was finalized at 49.8, showing a slight improvement from July’s 49.1, but still indicating a marginal contraction. S&P Global noted that the sector is moving closer to stabilization, with a renewed rise in production. This marks the first increase in purchasing activity in two years.
According to Usamah Bhatti at S&P Global Market Intelligence, the latest figures paint a "mixed picture" as the sector hovers near stabilization. The renewed rise in production and a softer decline in new orders have encouraged firms to increase staffing levels, while the pace of destocking has slowed. Additionally, there have been signs of improved supplier performance, particularly in the availability of inputs like electrical components.
However, the data also pointed to significant cost pressures, with the strongest rise in input costs since April 2023. Despite this, companies have been reluctant to pass these higher costs onto customers fully, leading to the slowest rate of charge inflation since mid-2021.
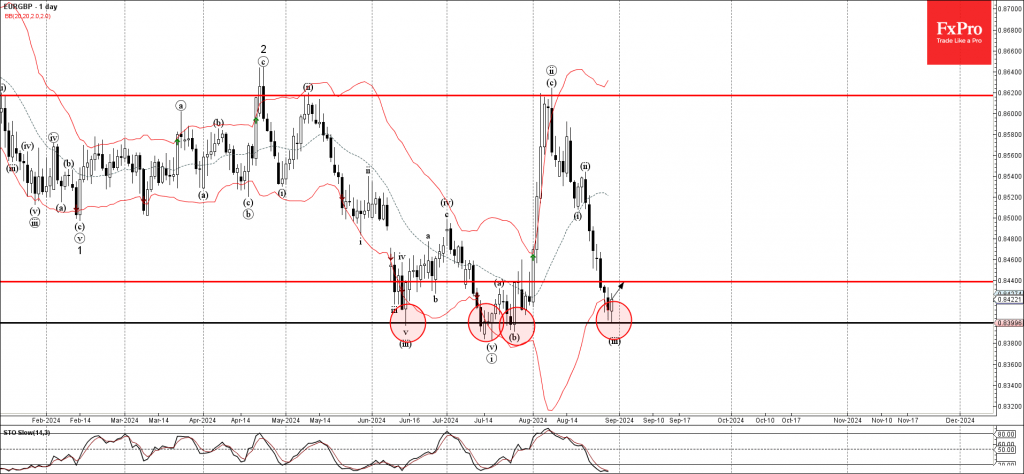
EURGBP Wave Analysis
- EURGBP reversed from strong support level 0.8400
- Likely to rise to resistance level 0.8440
EURGBP currency pair today reversed up from the strong support level 0.8400 (which has been steadily reversing the price from the middle of June) standing near the lower daily Bollinger Band.
The upward reversal from the support level 0.8400 created the daily Japanese candlesticks reversal pattern Bullish Engulfing.
Given the oversold daily Stochastic and the strength of the support level 0.8400, EURGBP currency pair can then be expected to rise to the next resistance level 0.8440.
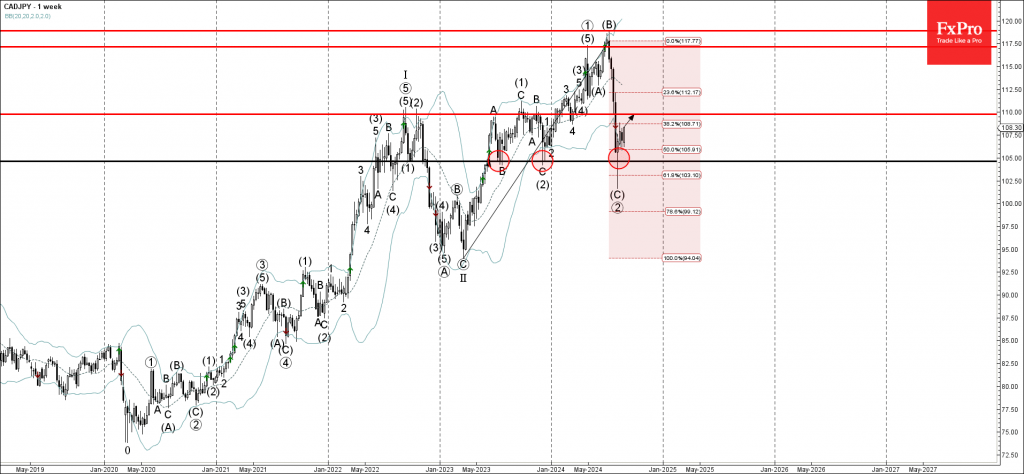
CADJPY Wave Analysis
- CADJPY reversed from key support level 105.00
- Likely to rise to resistance level 110.00
CADJPY currency pair recently reversed up with the weekly Hammer from the key support level 105.00 (which has been reversing the price from the middle of 2023).
The support level 105.00 was strengthened by the lower weekly Bollinger Band and by the 50% Fibonacci correction of the upward impulse from the start of May.
Given the overriding weekly uptrend and the strongly bearish yen sentiment, CADJPY currency pair can then be expected to rise to the next resistance level 110.00.
Rate Cut Hopes Eclipse Recession Concerns, Dollar Tracks Rising Yields
In the final week of August, financial markets delivered unexpected developments that caught many by surprise. Investor sentiment decisively shifted towards a risk-on approach, propelling major indices like DOW and DAX to new record highs. This optimism was largely driven by expectations of forthcoming monetary easing from key central banks, including Fed and ECB. Despite growing recession concerns in the US and Germany, the focus remained on rate cuts, leading to a significant outflow from treasuries, especially at the longer end, which in turn pushed yields higher.
In stark contrast to the strength of the DAX, Euro ended the week as the weakest performer. Growing speculation that ECB might implement more aggressive rate cuts weighed heavily on Euro. Yen followed closely behind, struggling under the pressure of rising US benchmark yields, while British Pound also underperformed, rounding out the bottom three currencies.
On the flip side, New Zealand Dollar was the standout performer, unexpectedly emerging as the strongest currency of the week. Kiwi's resilience, even after RBNZ's surprise rate cut earlier in the month, reflected a shift in market sentiment. Canadian Dollar also posted strong gains, finishing as the second-best performer, while the greenback took third place, buoyed by its sensitivity to rising yields rather than the prevailing risk-on sentiment. Meanwhile, Swiss Franc and Australian Dollar found themselves in the middle of the pack.
Market Euphoria Meets Recession Warnings as Fed Easing Looms
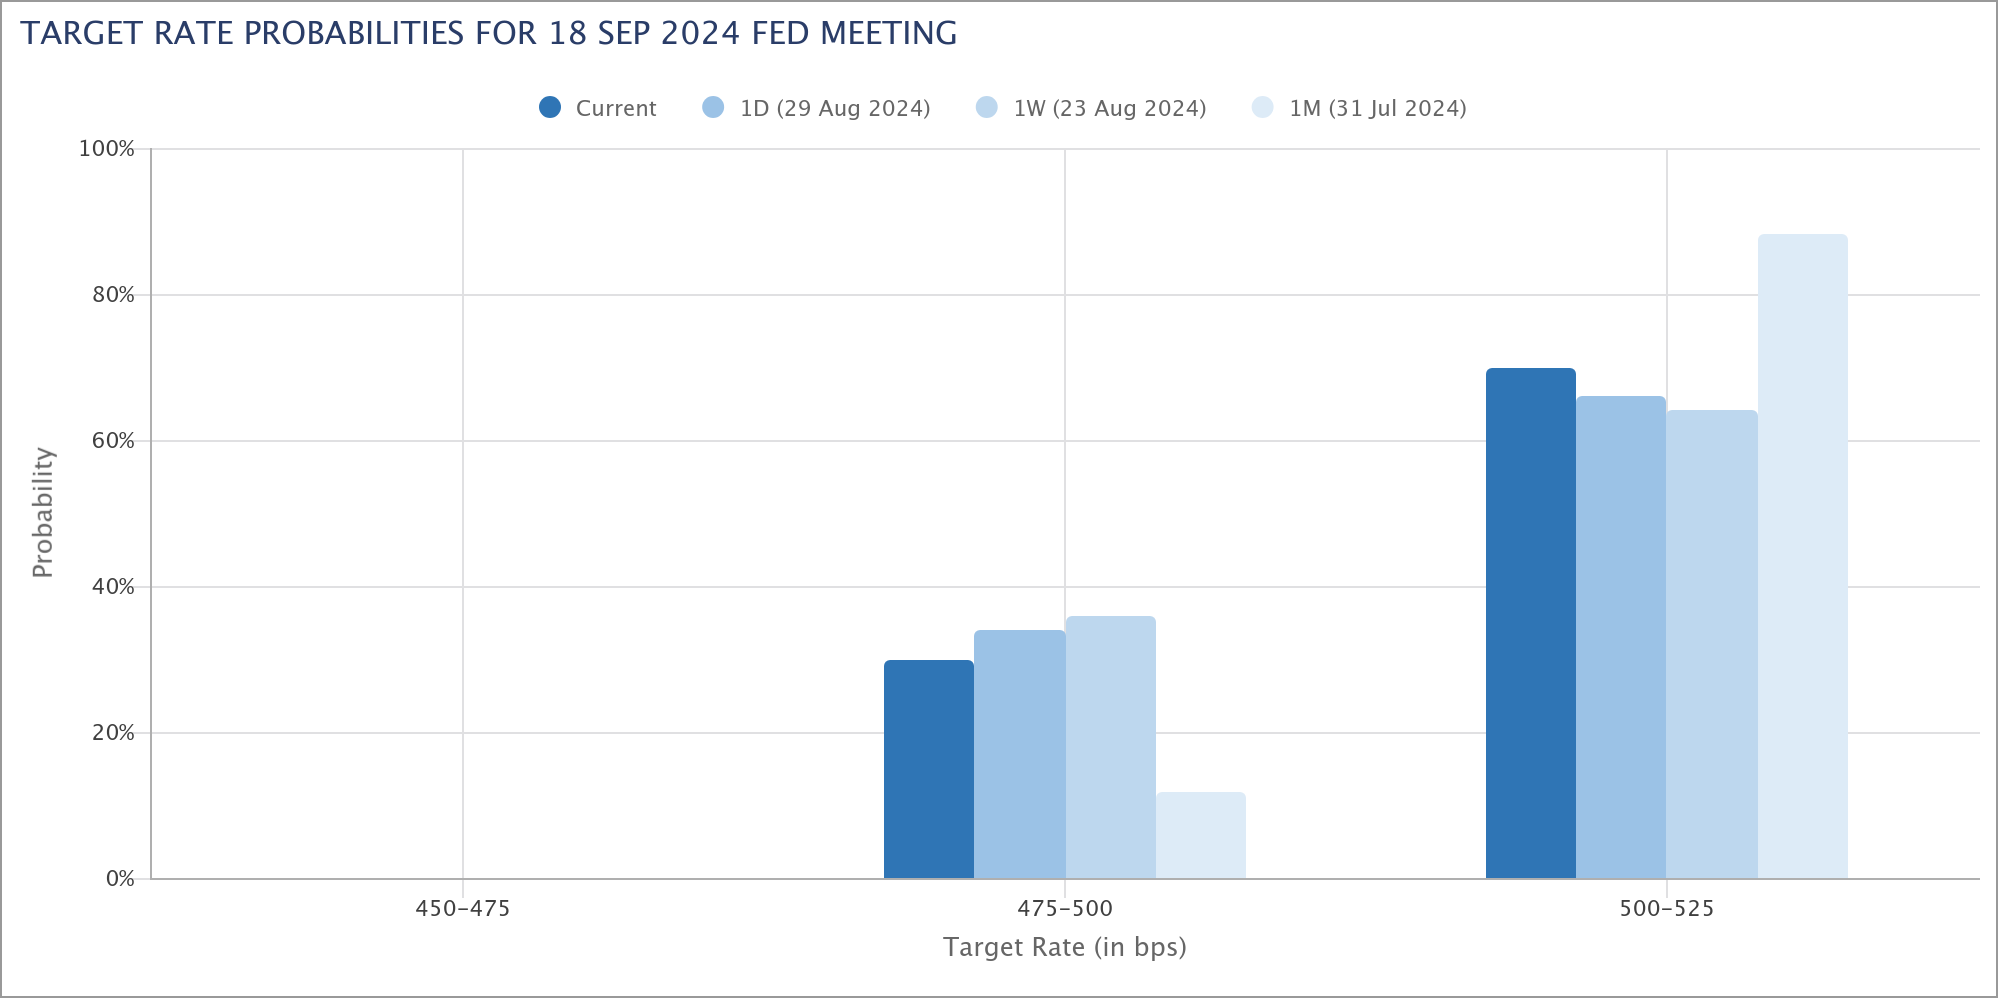
Last week presented a perplexing mix of optimistic and cautionary signals in the financial markets. Investor sentiment appeared buoyant as DOW surged to a new record high, and S&P 500 achieved its fourth consecutive winning month. This enthusiasm was largely fueled by expectations of Fed initiating a policy easing cycle in September. Yet, while market sentiment embraced a more accommodative Fed, expectations for a bold 50bps rate cut have indeed slightly tapered off.
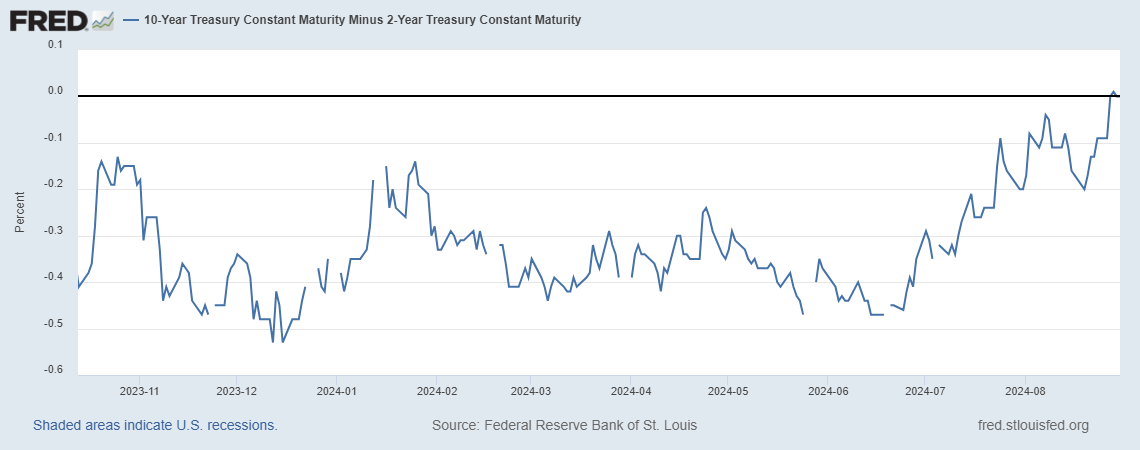
This shift in sentiment comes as key recessionary signals, like the normalization of the US yield curve, are largely being overlooked. The 10-year yield's late rebound hints at potential further upside, raising concerns of widening yield spread. Historically, this has often been a precursor to a looming US recession, indicating that the economy may be inching closer to a downturn.
Regarding the Fed's policy path, a 25bps rate cut in September is already fully baked into market expectations for some time. Fed fund futures now pricing a 30% chance of such a 50bps, down from 36% the previous week. Yet, the Sahm Rule—which links rising unemployment to recessions—could quickly re-enter the narrative with one weak jobs report in the coming Friday. Should such a scenario unfold, it might boost the odds of a more aggressive cut, though the market's reaction to such a development remains highly uncertain.
Technically DOW's firm break of 41376.00 resistance confirms resumption of whole rise from 28660.94 (2022 low). For the near term, outlook will stay bullish as long as 40584.47 support holds. Next target is 61.8% projection of 32327.20 to 39889.05 from 38000.96 at 42674.18.
In the bigger picture, DOW's rise from 28660.94 is still in healthy state, staying well above rising 55 W EMA. W MACD's cross above the signal line suggests there could be medium term acceleration ahead. Next target is tentatively 100% projection of 18213.65 (2020 low) to 36952.65 (2022 high) from 28660.94 at 43799.94.
S&P 500 will have its eye on 5669.67 resistance in the near term. Decisive break there will resume whole rally from 3491.58 (2022 low). That would also serves as confirmation of underlying strong risk-on sentiment in the markets. Next target will be 61.8% projection of 4103.78 to 5669.67 from 5119.26 at 6086.98.
10-year yield's late rally is raising the chance that retreat from 4.022 has completed, and stronger rally is in favor in the near term. While there is chance that rebound from 3.669 is ready to resume, 4% handle would remain a tough psychological level to overcome. Nevertheless, firm break of 4.022 would possibly push TNX through 55 D EMA (now at 4.059) to 100% projection of 3.669 to 4.022 from 3.763 at 4.115.
It should be emphasized that the 2-10 yield curve inversion has just completely normalized. Indeed, 10-year minor 2-year spread has briefly turned positive on Thursday. Further rally in 10-year yield would probably steepen the yield curve further. And historically, yield curve normalizations have preceded recession in the US every time since the 90s.
The rebound in 10-year yield is helping Dollar Index too, which has also benefited from Euro's weakness. While a short term bottom is likely in place at 100.51, after DXY drew support from 100.61, it's still early to confirm reversal. Another fall would remain in favor as long as 102.16 support turned resistance holds. Break of 100.51 would extend the fall from 106.13 to retest 99.57 (2023 low). However, firm break of 102.16 will open up stronger rebound to 55 D EMA (now at 103.24), even as a corrective move.
DAX Surges to Record Despite Rising Recession Risks in Germany
In Europe, expectations for another ECB rate cut in September are solidifying with recent data showing a decline in wage pressures and a notable drop in headline inflation. Even core inflation, although decreasing at a slower pace, is trending downwards. However, these positive signs are overshadowed by growing concerns of a recession in Germany, highlighted by disappointing PMI readings, declining Ifo business confidence, and weak Gfk consumer sentiment. Despite these economic warning signs, DAX surged to a new record high, reflecting investor optimism that ECB easing might bolster the economy, even if the pace of rate cuts accelerates due to worsening conditions.
DAX's powerful rally from 17024.83 continued last week with break of 18892.92 resistance. Outlook will now stay bullish as long as 55 D EMA (now at 18304.90) holds. Next target is 61.8% projection of 14630.21 to 18892.92 from 17024.82 at 19659.17.
In the bigger picture, the rise from 11862.84 (2022 low) is also healthy, with strong support seen from rising 55 W EMA. Next target is 100% projection of 8255.65 (2020 ow) to 16290.19 (2021 high) from 18862.82 at 19897.38. Given that both both projection levels are near to 20k psychological level, strong resistance could seen there to limit up side, at least for the first attempt.
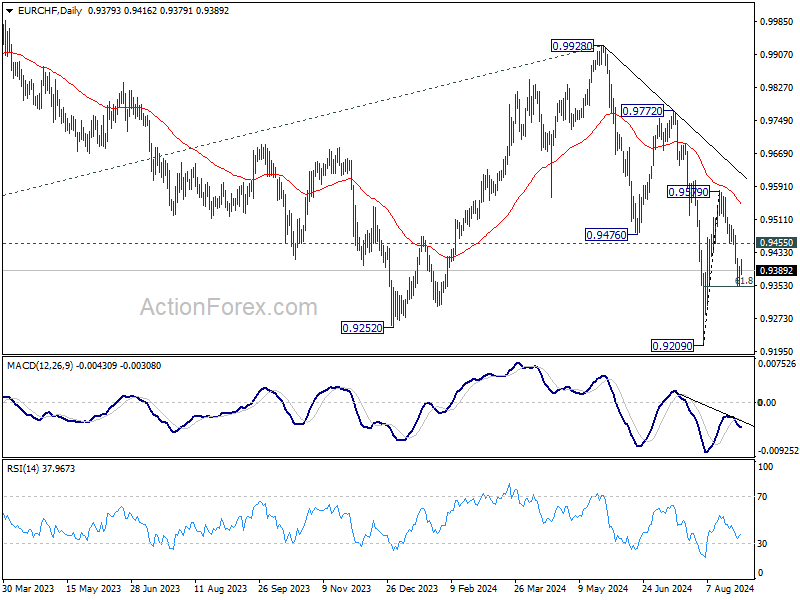
EUR/CHF's fall from 0.9579 accelerated lower last week and closed down -1%. While the rebound from 0.9209 was strong, it's capped well by falling 55 D EMA, and thus keeping outlook bearish. Sustained break of 61.8% retracement of 0.9209 to 0.9579 at 0.9350 will pave the way back to retest 0.9209 low. Firm break there will resume the decline from 0.9928, as well as the long term down trend. Nevertheless, strong bounce from current level, follow by break of 0.9455 resistance will neutralize the immediate bearish momentum first.
Kiwi Tops August Performance, Defies Impact of RBNZ's Surprise Rate Cut
New Zealand Dollar ended the week as the strongest currency, and was surprisingly the best performer in August despite RBNZ's unexpected rate cut earlier in the month and subsequent volatility. This rate cut, while marking the beginning of a monetary easing cycle, is now viewed as a well-timed strategic move that came just as market sentiment was shifting. This preemptive action by RBNZ is expected to provide the economy with a significant boost, reducing the need for prolonged or more aggressive policy easing in the future.
Kiwi's strength was bolstered by the latest ANZ Business Outlook survey, which revealed a sharp rise in business confidence. Although firms remain cautious about current activity levels, the survey showed that headline confidence surged to a decade-high. Additionally, firms' expectations for their future activity reached their most optimistic level since 2017.
Notably, this surge in optimism was already evident before the RBNZ's rate cut, suggesting that confidence may continue to build as the effects of the rate cut take hold.
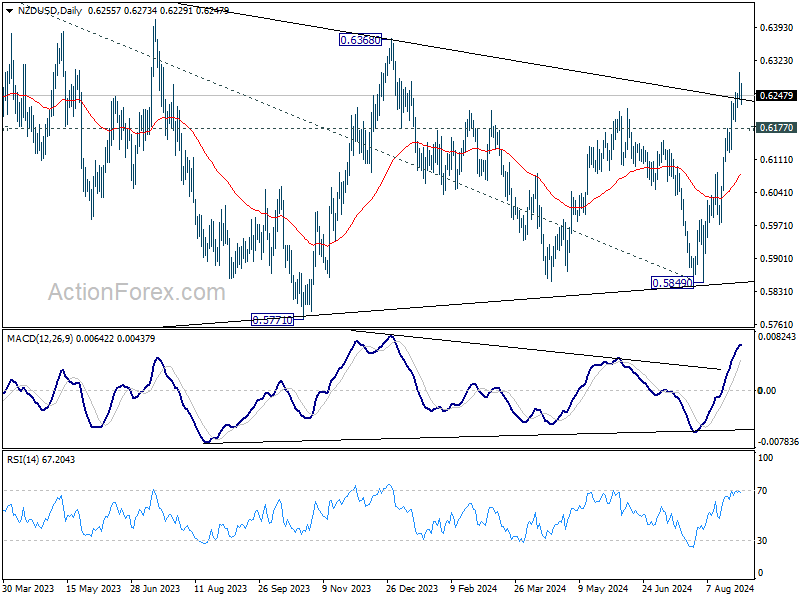
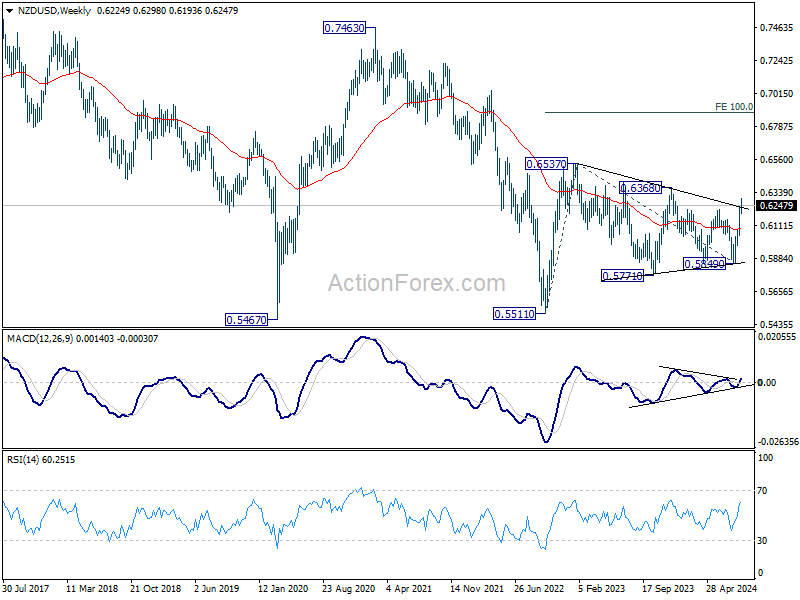
NZD/USD was the top mover of the month, gaining 5.01%. The break of the medium term falling trend line resistance suggests that corrective pattern from 0.6537 has completed with three waves to 0.5849 already. Further rally is now expected in the near term as long as 0.6177 support holds. Firm break of 0.6368 resistance would solidify this bullish case and target 0.6537 resistance next.
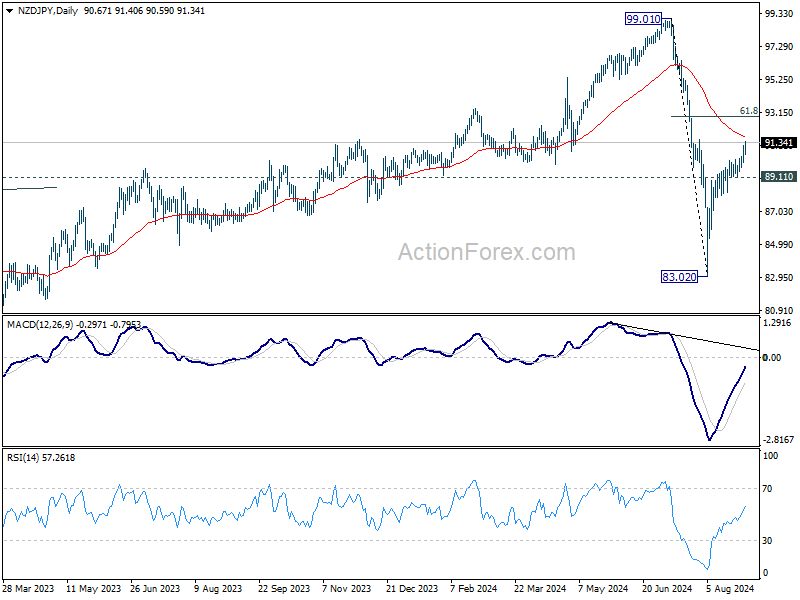
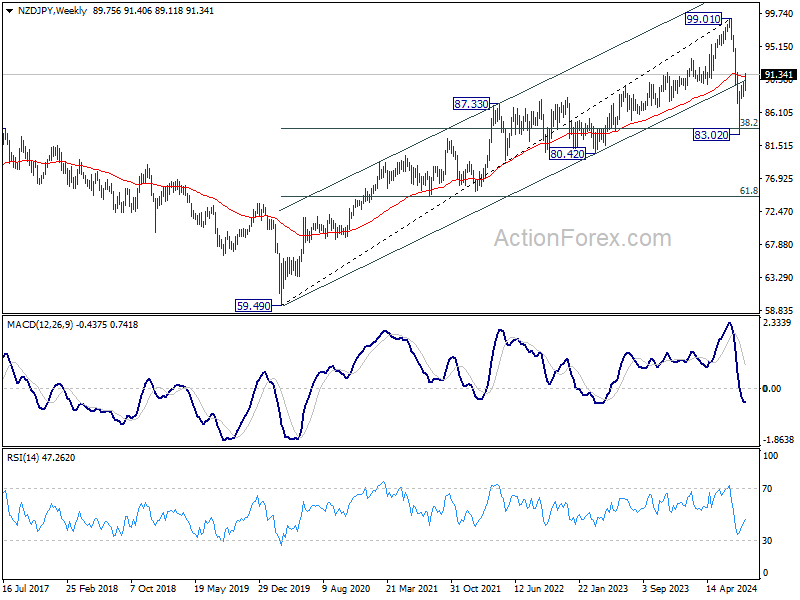
NZD/JPY also extended the strong rebound from 83.02. Further rise should be seen as long as 89.11 support holds. Next targets are 55 D EMA (now at 91.69), and then 61.8% retracement of 99.01 to 83.02 at 92.90.
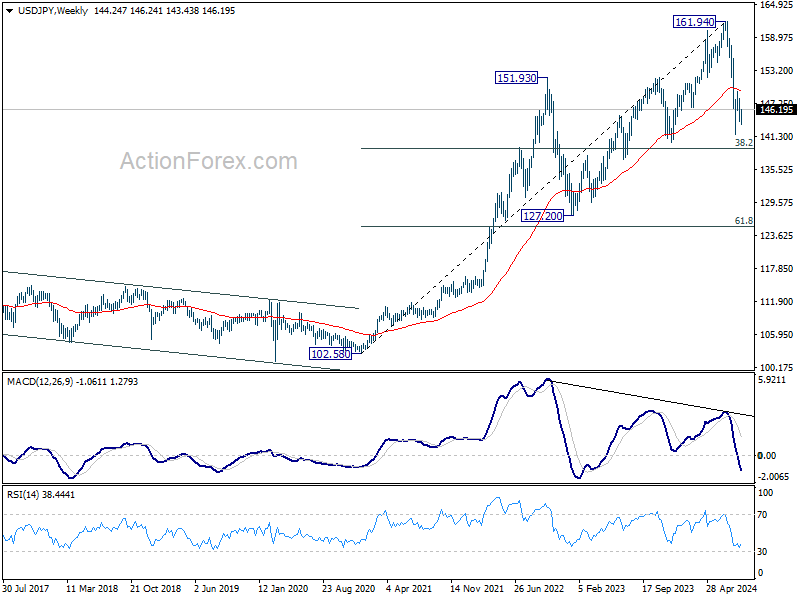
USD/JPY Weekly Outlook
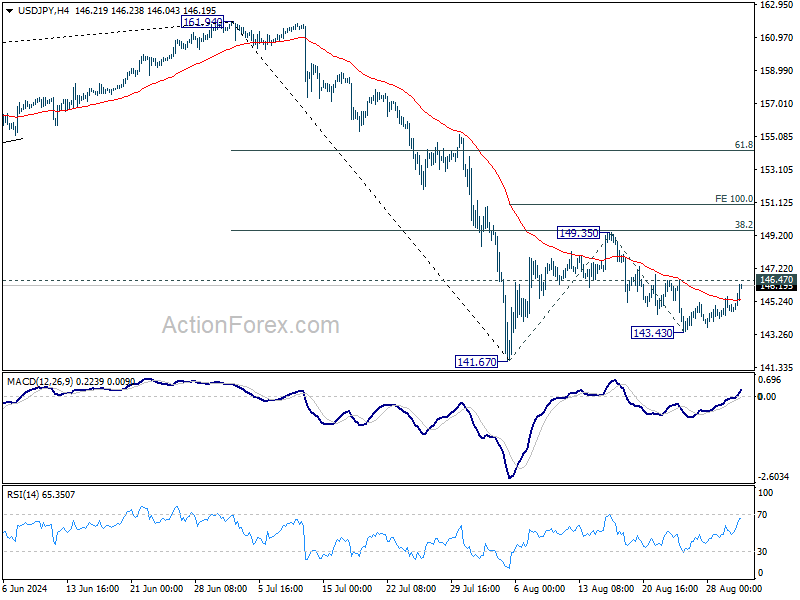
USD/JPY edged lower to 143.43 last week recovered notably. Initial bias remains neutral this week first. On the upside, break of 146.47 resistance will argue that pull back from 149.35 has completed, and rebound from 141.67 is going to resume. Intraday bias will be back on the upside for 149.35 first and then 100% projection of 141.67 to 149.35 from 143.43 at 151.11. On the downside, below 143.43 will target 141.67 low instead.
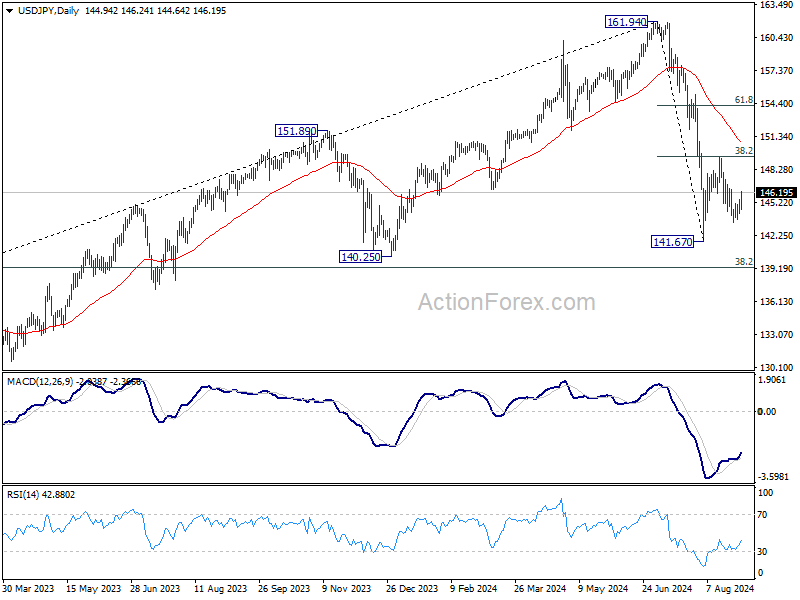
In the bigger picture, fall from 161.94 medium term top is seen as correcting whole up trend from 102.58 (2021 low). Deeper decline could be seen to 38.2% retracement of 102.58 to 161.94 at 139.26, which is close to 140.25 support. In any case, risk will stay on the downside as long as 55 W EMA (now at 149.47) holds. Nevertheless, firm break of 55 W EMA will suggest that the range for medium term corrective pattern is already set.
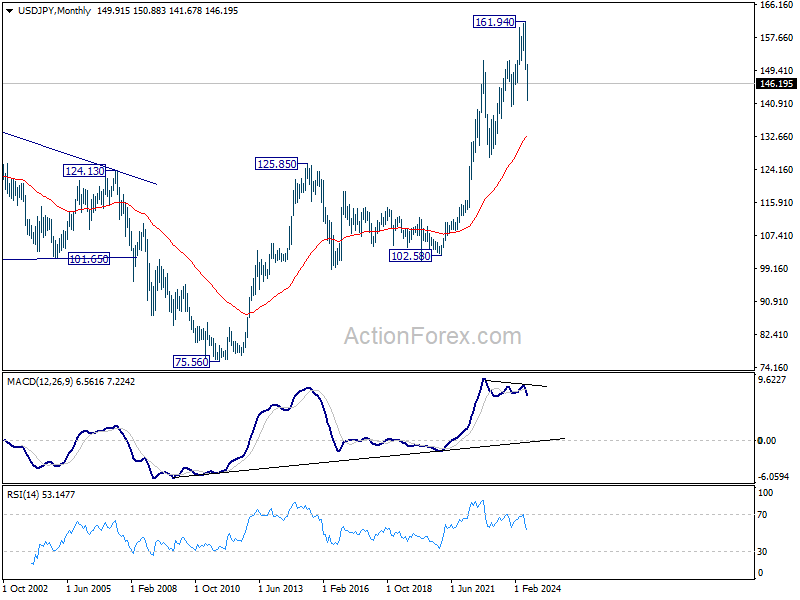
In the long term picture, it's still early to conclude that up trend from 75.56 (2011 low) has completed. However, a medium term corrective phase should have commenced, with risk of deep correction towards 55 M EMA (now at 132.73).
EUR/USD Weekly Outlook
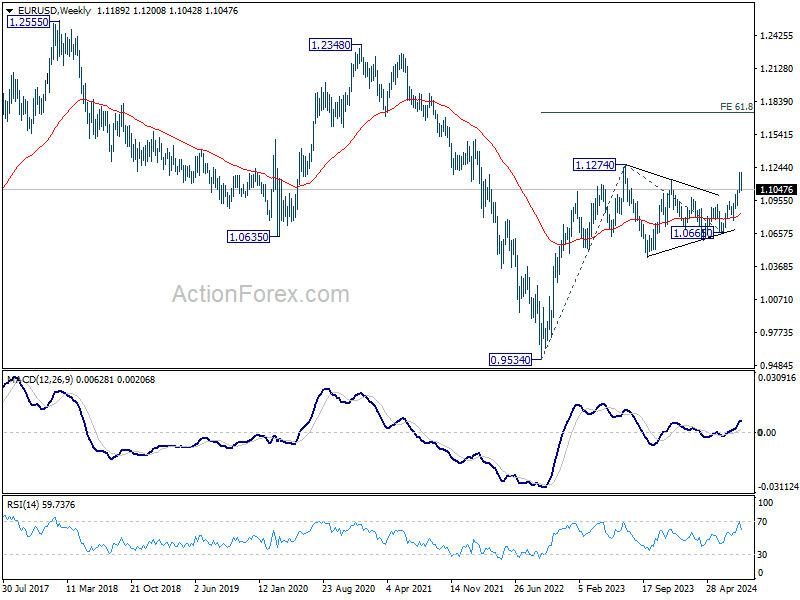
EUR/USD's pull back from 1.1200 extend lower last week. Initial bias stays neutral this week with risk of deeper decline. But still, rally from 1.0665 is in favor to continue as long as 1.0947 resistance turned support holds. Above 1.1139 minor resistance will bring retest of 1.1200 first. Break there will target 1.1274 high next.
In the bigger picture, prior break of 1.1138 resistance indicates that corrective pattern from 1.1274 has completed at 1.0665 already. Decisive break of 1.1274 (2023 high) will confirm whole up trend from 0.9534 (2022 low). Next target will be 61.8% projection of 0.9534 to 1.1274 from 1.0665 at 1.1740. This will now be the favored case as long as 1.0947 resistance turned support holds.
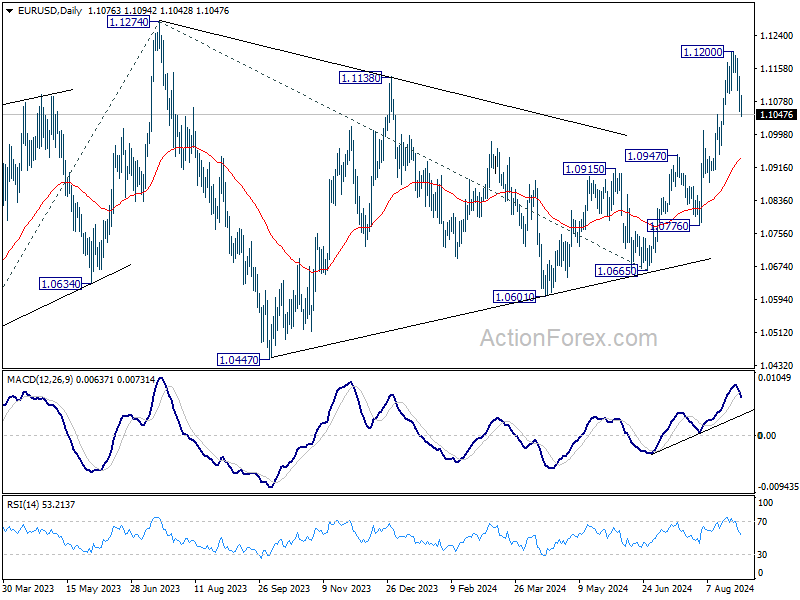
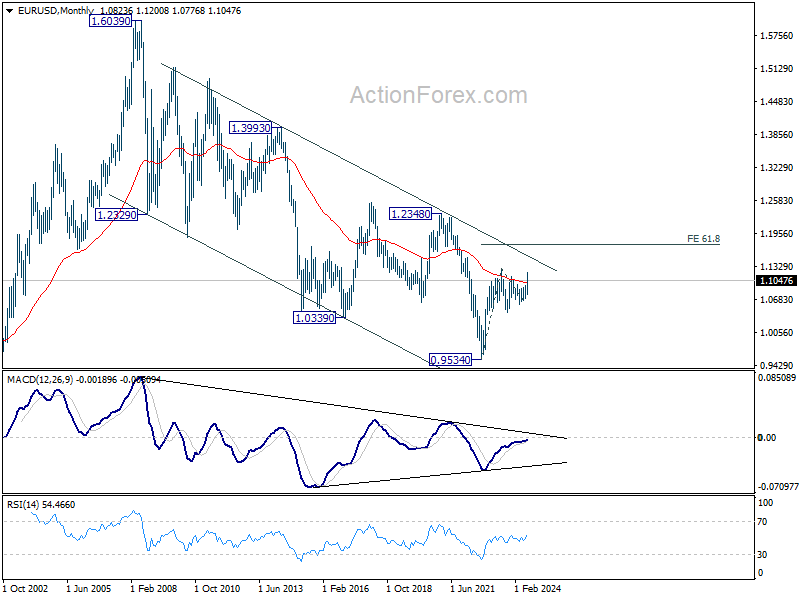
In the long term picture, a long term bottom is in place at 0.9534 (2022 low). The strong break of 55 M EMA (now at 1.1018) is taken as the first sign of bullish trend reversal. But still, firm break of 1.2348 structural resistance is needed to confirm. Otherwise, price actions from 0.9534 could still develop into a consolidation pattern.
USD/JPY Weekly Outlook
USD/JPY edged lower to 143.43 last week recovered notably. Initial bias remains neutral this week first. On the upside, break of 146.47 resistance will argue that pull back from 149.35 has completed, and rebound from 141.67 is going to resume. Intraday bias will be back on the upside for 149.35 first and then 100% projection of 141.67 to 149.35 from 143.43 at 151.11. On the downside, below 143.43 will target 141.67 low instead.
In the bigger picture, fall from 161.94 medium term top is seen as correcting whole up trend from 102.58 (2021 low). Deeper decline could be seen to 38.2% retracement of 102.58 to 161.94 at 139.26, which is close to 140.25 support. In any case, risk will stay on the downside as long as 55 W EMA (now at 149.47) holds. Nevertheless, firm break of 55 W EMA will suggest that the range for medium term corrective pattern is already set.
In the long term picture, it's still early to conclude that up trend from 75.56 (2011 low) has completed. However, a medium term corrective phase should have commenced, with risk of deep correction towards 55 M EMA (now at 132.73).
GBP/USD Weekly Outlook
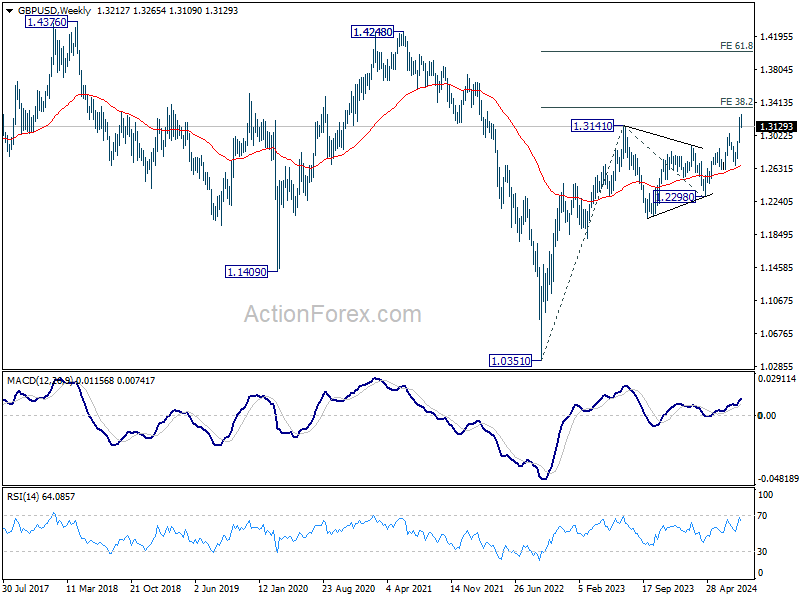
GBP/USD edged higher to 1.3265 last week but retreated since then. Initial bias remains neutral this week for more consolidations first. Further rally is expected as long as 1.3043 resistance turned support holds. Break of 1.3265 will resume larger up trend to 100% projection of 1.2298 to 1.3043 from 1.2664 at 1.3409.
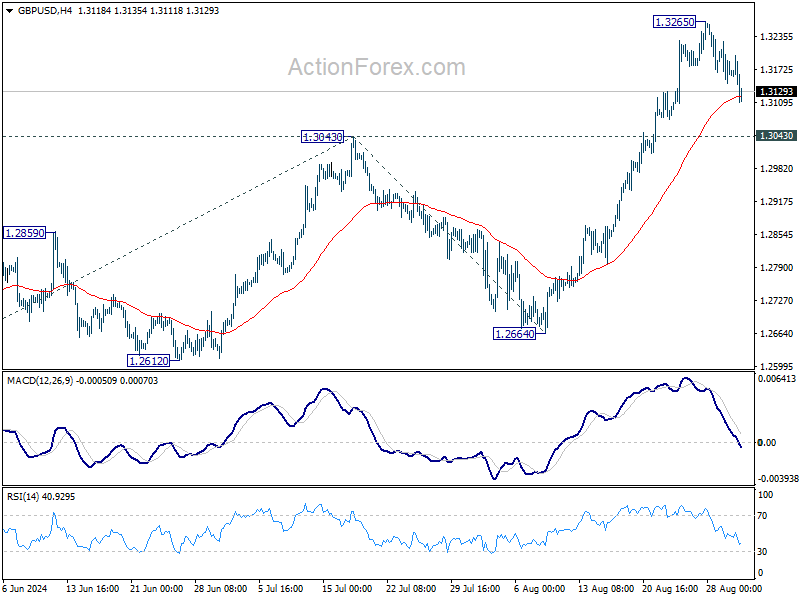
In the bigger picture, up trend from 1.0351 (2022 low) is in progress. Next target is 38.2% projection of 1.0351 to 1.3141 from 1.2298 at 1.3364. For now, outlook will stay bullish as long as 1.2664 support holds, even in case of deep pullback.

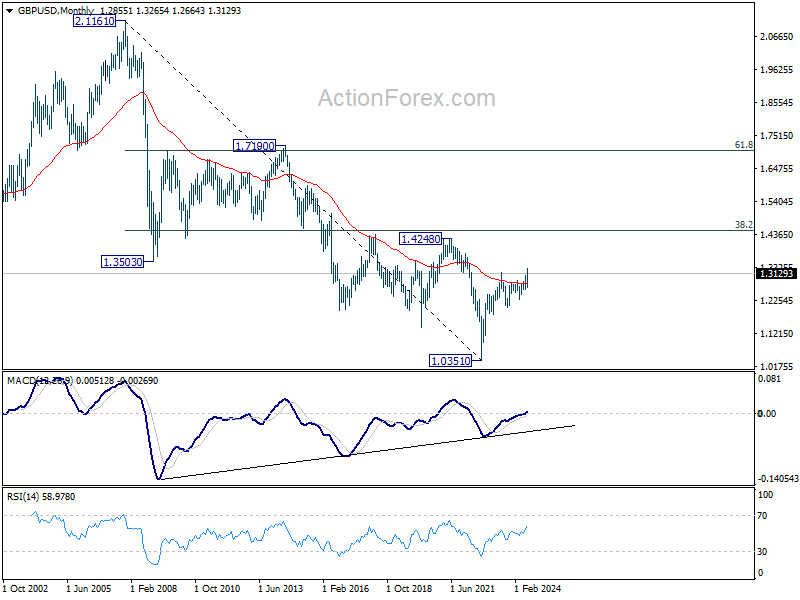
In the long term picture, as long as 1.2298 support holds, rise from 1.0351 long term bottom is expected to continue. The strong break of 55 M EMA (now at 1.2814) is a sign of bullish trend reversal. Yet, break of 1.4248 structural resistance is needed confirm. Otherwise, price actions from 1.0351 could just be part of a consolidation pattern.