
Sample Category Title
Three Key Charts to Watch After Jackson Hole That May Impact US Stock Market
- Fed Chair Powell’s speech in the Jackson Hole symposium has cemented the expectations of a Fed funds rate cut in the upcoming September FOMC meeting.
- The uncertainty element is the magnitude and the pace of the upcoming Fed funds rate cut cycle.
- Upcoming key US growth data such as ISM manufacturing, and services PMIs (including their sub-components) as well as labour market data will be heavily scrutinized.
- An ideal soft-landing scenario in the US economy coupled with a further bull steepening US Treasury yield curve scenario is likely to spur a potential outperformance of the current laggards; value-oriented stocks, Dow Jones Industrial Average, and Russell 2000.
- A Fed dovish pivot coupled with the US economy that is already in the motion of a recession may be detrimental to the US stock market.
The annual Jackson Hole symposium has been done and dusted. US Federal Reserve Chairman Jerome Powell has given the clearest hint that the Fed may kickstart its interest rate cut cycle at the upcoming 18th September FOMC meeting after holding the Fed funds rate at a two-decade high of 5.25%-5.50%.
He stated, “The time has come for policy to adjust. The direction of travel is clear, and the timing and pace of rate cuts will depend on incoming data, the evolving outlook, and the balance of risks”.
Fed funds interest rate futures market according to calculations compiled by the CME FedWatch tool has already priced in such a dovish stance as a high probability of 63% of a 25 basis point (bps) cut on the Fed funds interest rate has been assigned to the September FOMC meeting followed by a 50 bps cut (77% chance) on 7 November FOMC and another 25 bps (77% chance) on 18 December FOMC; overall a possible 100 bps cut in the Fed funds rate before 2024 ends at this time of the writing.
Right now, market participants are likely to focus on the state of the US economy in line with the Fed’s interest rate cut cycle on whether the Fed is late in the game of enacting its interest rate cuts and the potential impact on risk assets such as equities and broad-based benchmark stock indices.
Bad economic data is now considered as bad “news”
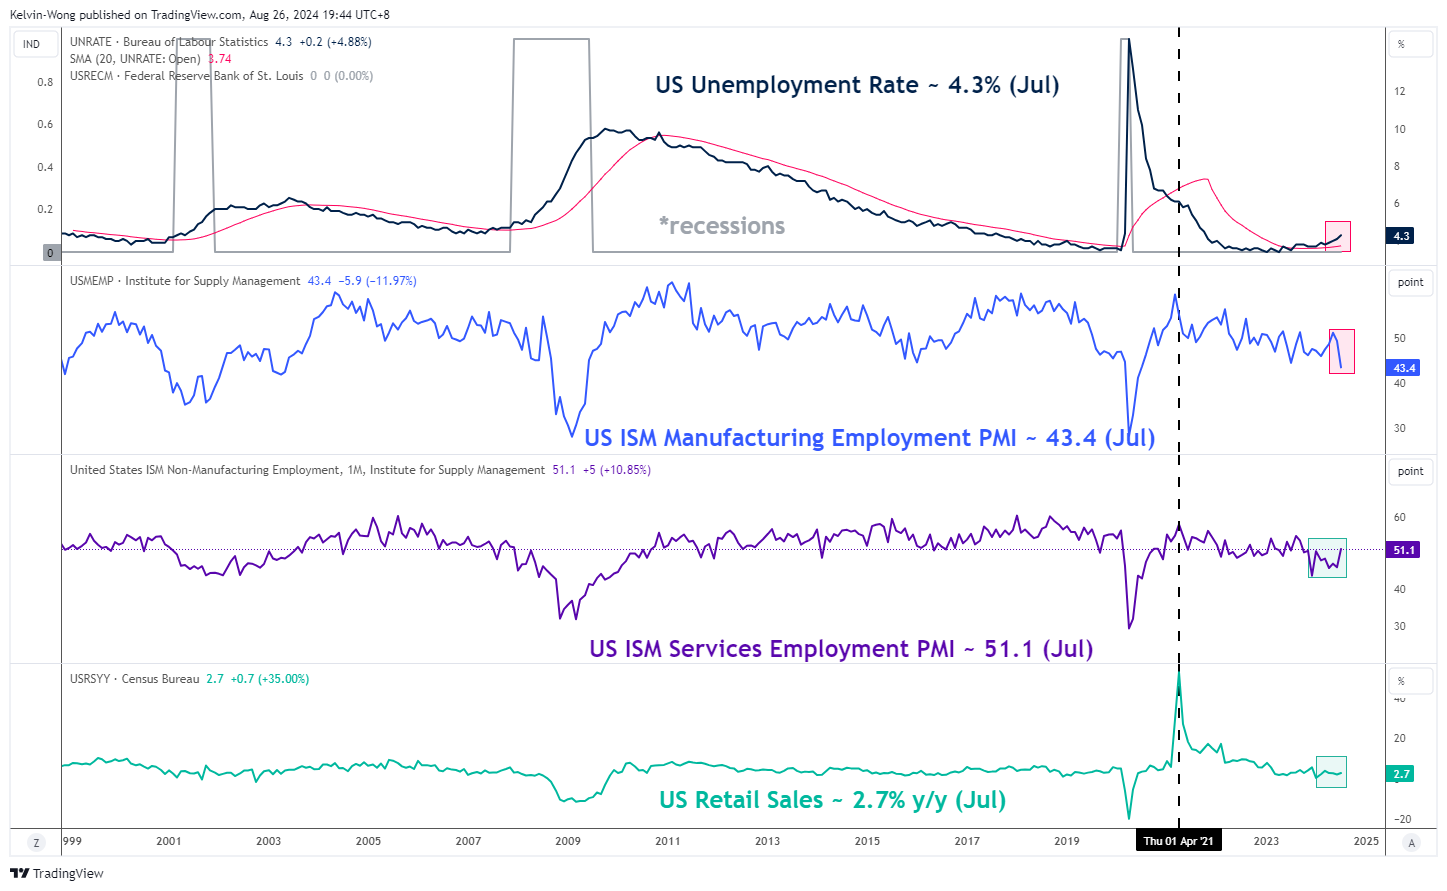
Fig 1: US Unemployment Rate, ISM Manufacturing/Services Employment PMI & Retail Sales trends (Source: Trading View, click to enlarge chart)
Fed Chair Powell has reiterated in his speech during last Friday’s Jackson Hole symposium that the upside risks to inflation have diminished but the downside risks to employment have increased.
Hence, any leading economic data and labour market conditions such as ISM services, manufacturing PMIs, its employment sub-components, non-farm payrolls, unemployment rate, and retail sales that indicate a deterioration in growth and employment may trigger another similar risk-off episode that took place recently in late July to early August that saw synchronized losses in the global stock indices (see Fig 1).
If such a scenario occurs, the Fed may be forced to embark on larger interest rate cuts to negate the adverse effects of a recession that is already in motion which in turn creates a potential cascading negative feedback loop into the major US stock indices such as the S&P 500 and Nasdaq 100.
A dovish Fed pivot may not be good for risk assets
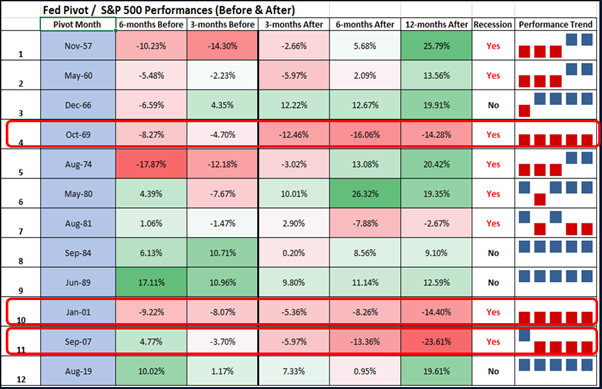
Fig 2: Impact of Fed dovish pivots on past performances of S&P 500 during recessions (Source: Trading View, click to enlarge chart)
In addition, based on data since 1957, when the Fed pivoted to kickstart an interest rate cut cycle when the US economy was already in recession, the three-month, six-month, and twelve-month returns of the S&P 500 after the implementation of respective first-interest rate cut was detrimental on the average.
The S&P 500 fared the worst during the Fed pivots of October 1969, January 2001 and September 2007 (see Fig 2).
A soft land scenario in the US may benefit the laggards
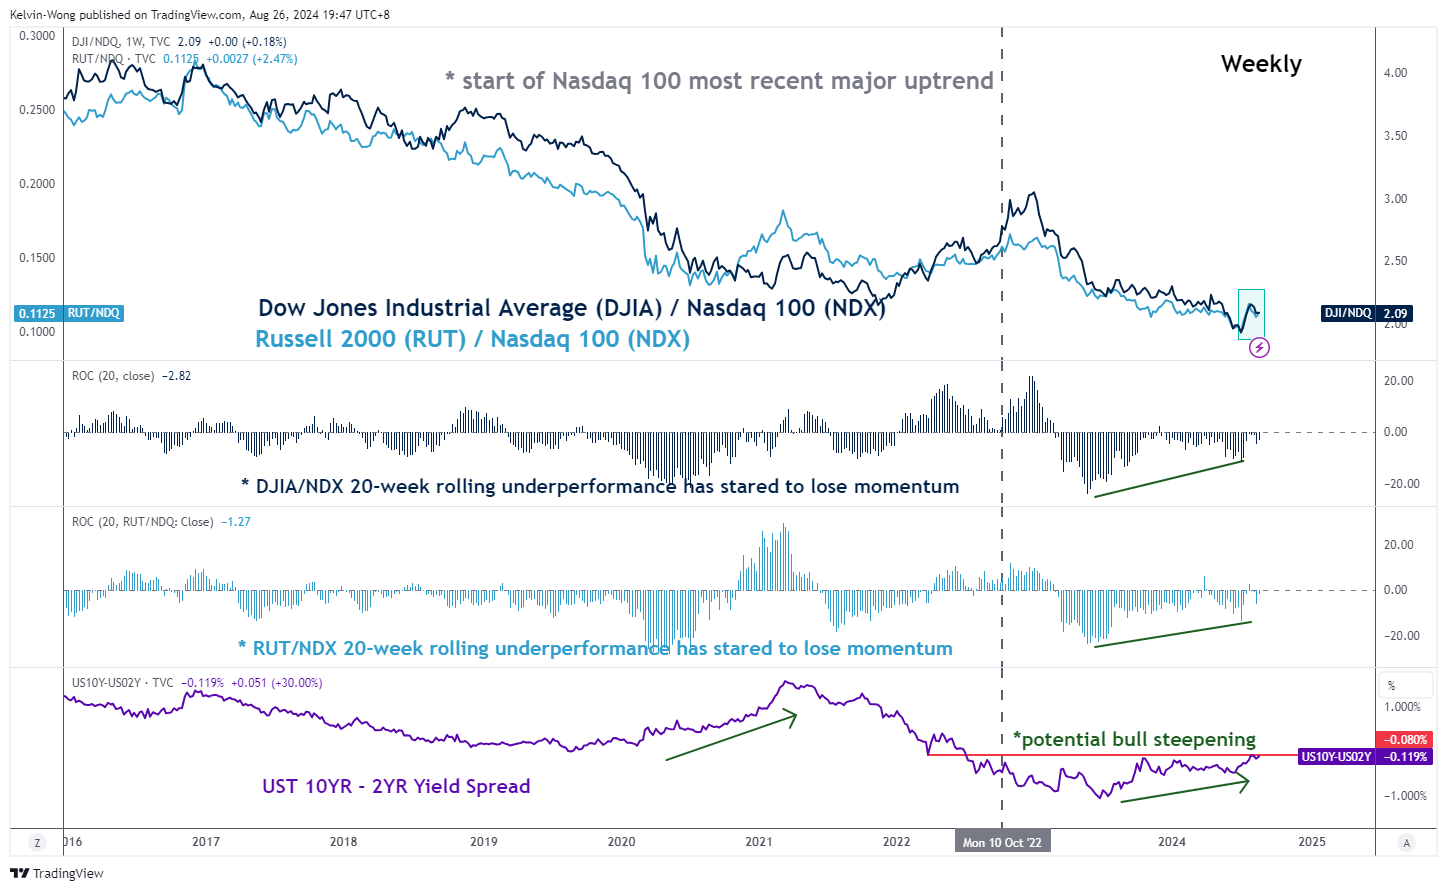
Fig 3: US Treasury yield curve & DJIA, Russell 2000 relative performances over Nasdaq 100 trends as of 23 Aug 2024 (Source: Trading View, click to enlarge chart)
The current state of affairs in the global markets is playing out a potential bull steepening of the US Treasury yield curve, taking into account the difference between the 10-year and 2-year US Treasury yields.
The 2-year US Treasury yield which is more sensitive to the Fed’s monetary policy stance has been falling at a faster pace than the 10-year US Treasury yield (a proxy of US economic growth conditions). Last week, the 2-year has declined by 13 bps versus a loss of 8 bps seen in the 10-year.
Even on a month-to-date performance as of 26 August, the 2-year Treasury yield has declined at a higher magnitude over the 10-year (-35 bps versus -22 bps).
A further potential bull steepening the US Treasury yield curve indicates the pricing of a soft-landing scenario (provided no adverse surprise shock from deterioration in growth and labour market data) in the US economy while the Fed neutralizes its prior hawkish monetary policy which in turn may benefit the laggards such value-oriented US equities, the Dow Jones Industrial Average and Russell 2000 (see Fig 3).
The potential outperformance of these laggards over the current heavily concentrated mega-cap technology stocks and Nasdaq 100 which has outperformed the broad market since March 2020 indicates a healthy rotation that may extend the ongoing 15-year long-term secular bullish trend of the US stock market in place since March 2009.
A Chance for Dollar to Bounce Back
Current situation
The Dollar Index closed last week at 100.55, its lowest level since July 2023. It has not been consistently below this level since April 2022.
Technical analysis
Although the change of monetary regime in the US is of fundamental importance, the bulls may launch a counterattack in the short term. On a weekly basis, the Dollar’s RSI has moved back into oversold territory, which was last seen 13 months ago, marking a turning point. In 2020, the entry into oversold territory did not lead to an immediate reversal, but the downside momentum was largely exhausted.
Just as importantly, this exhaustion occurred on the move towards the key 200-week moving average, the approach of which in early 2022 revived dollar buying momentum.
Fundamental analysis
From a fundamental perspective, the currency market has unnecessarily sold off the dollar. Interest rate futures are now realistically pricing in a 25-point (66%) rate cut in September, in stark contrast to the 50-point confidence in a cut recorded on 5 August.
By moving expectations towards a normal (25-point) hike, the Fed will sound more hawkish than the market has priced in, favouring a dollar rally in the coming weeks.
Forecast
The only way a potential short-term dollar bounce has a chance of becoming a rally is if there are negative shocks to financial markets. In the absence of such shocks, the dollar’s recovery may stall in the 101.7-102.5 area.
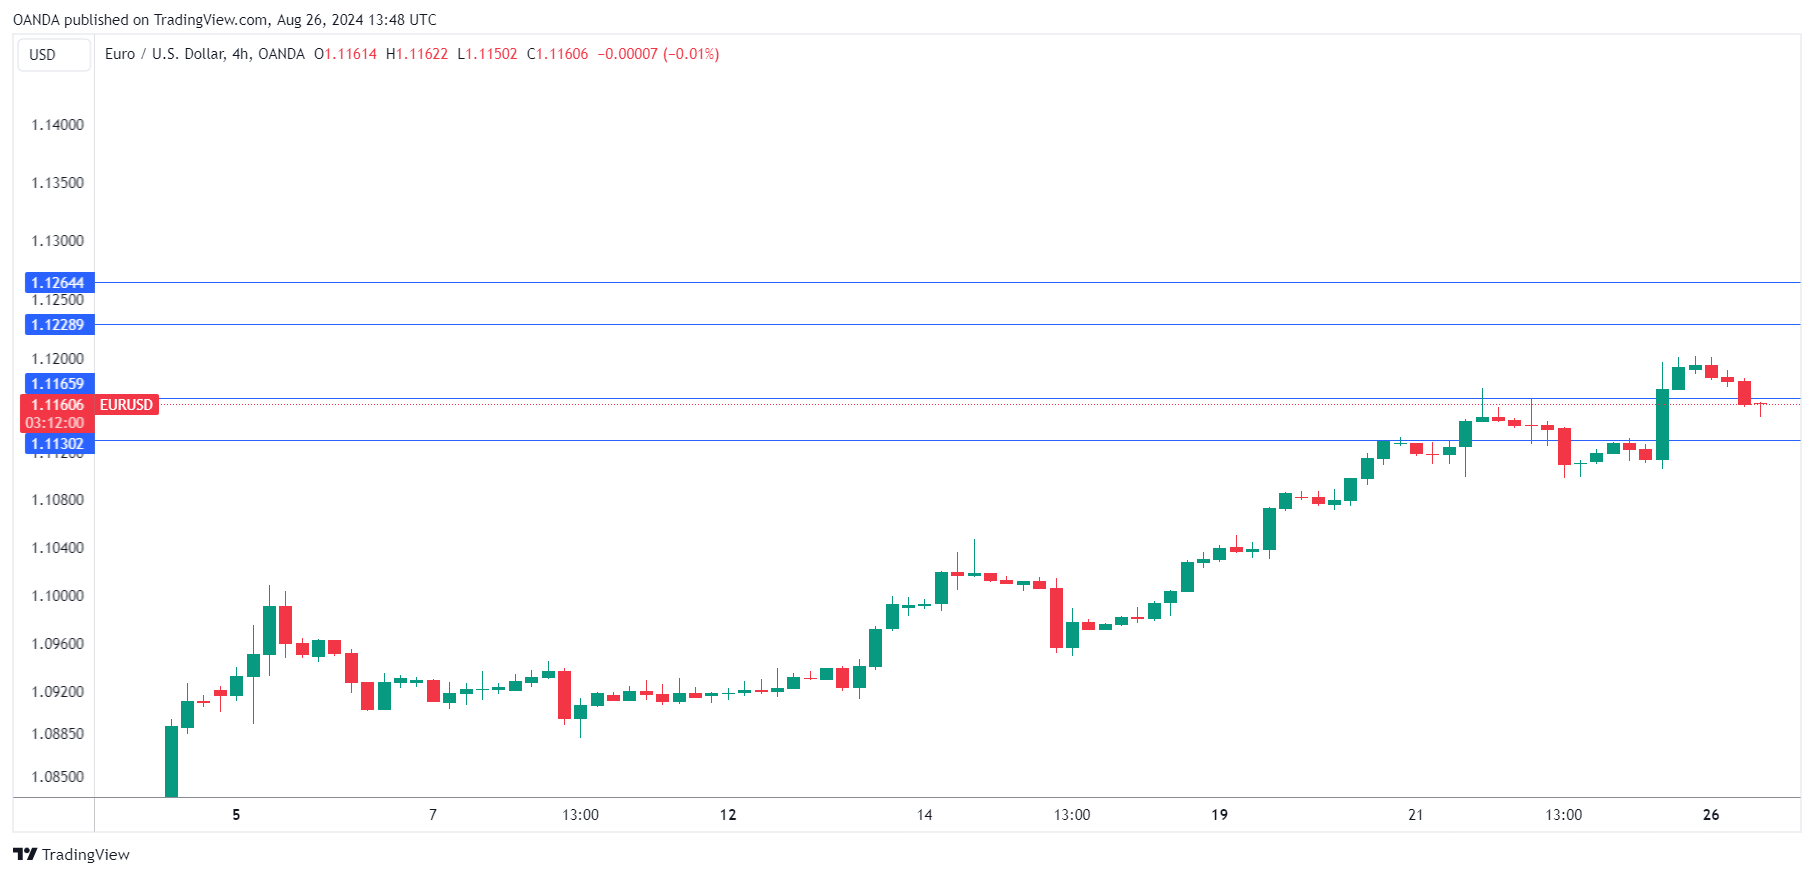
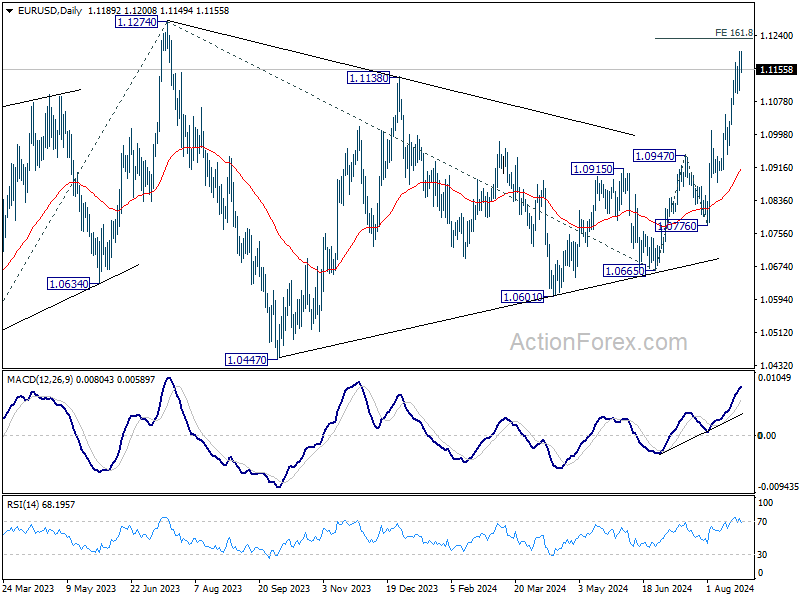
EUR/USD Dips as German Business Climate Falls
The euro is in negative territory on Monday. In the European session, EUR/USD is trading at 1.1156 at the time of writing, down 0.32% on the day. The euro posted strong gains on Friday, rising 0.73% and breaking above 1.12 for the first time since July 17.
Dollar slides after Powell says Fed ready to cut
The markets got what they were looking for from Federal Reserve Chair Powell on Friday – an endorsement for a rate cut. Powell didn’t specify when the Fed would cut but said that the “time has come for policy to adjust”. Investors are ready for the Fed’s first rate cut in over four years at the Sept. 18 meeting. What is still up in the air is the size of the cut.
Just one month ago, the odds of a 25-basis point cut stood at 88% and 12% for a cut of 50 bps, according to the CME’s FedWatch. Since then, the US economy has posted some weaker-than-expected data and the probability of a 25-bps reduction has fallen to 63.5% for a 25-bps cut vs. 36.5% for a 50 bps move.
One key factor in the Fed’s decision will be the August jobs report on Sept. 6. A very weak report for July panicked investors that the US economy was hurtling towards a recession and financial markets were routed before bouncing back. Another weak jobs report could rattle investors and push the Fed to respond with a 50-bps cut. The expected September cut will mark the start of a new rate cycle for the Fed, which has maintained rates at 5.25%-5.50% for over a year. The Fed is expected to lower rates at least one more time this year and continue trimming into 2025.
Germany’s Ifo Institute business climate sentiment index declined in August for a fourth consecutive time as the German economy continues to struggle. The index eased to 86.6, down from 87.0 but above the market estimate of 86.0. The survey’s manufacturing component dropped sharply and the services component also fell.
EUR/USD Technical
- EUR/USD is testing support at 1.1165. Below, there is support at 1.1130
- 1.1229 and 1.1264 are the next resistance lines
Sunset Market Commentary
Markets
The dust settled somewhat after Fed chair Powell’s “the time has come” speech in Jackson Hole prompted an almost 9 bps decline in US yields last Friday. The front end of the curve outperformed, drawing comfort from Powell implicitly leaving all options open, including supersized (eg. 50 bps) rate reductions in September or later. But with more than 100 bps of cuts currently priced in for the remainder of 2024, there’s little spare room for US money markets to add to an already pretty aggressive positioning for the time being. US yields gapped lower in an Asian reactionary move. Their attempt to recover during European dealings was then hindered a bit by the release of US July durable goods orders. They came in double the 5% estimate for headline sales (Boeing aircraft orders) but that beat was offset by both a miss for the current and a downward revision for the previous month’s reading in several core gauges. Current changes vary between -0.2 (2-yr) and +1.5 (30-yr) bps, preserving the recent support levels (August lows, ex. August 5). German yields painted a similar intraday picture where opening losses were swapped for gains ranging between +2.5 and 3.4 bps across the curve. Germany’s August Ifo business confidence covered the European eco calendar but its impact was negligible. Aligning with last week’s PMI’s, the release suggested an ongoing loss of economic momentum, be it less than feared. The headline index retreated from 87 to 86.6 with both the current assessment (86.5) and the expectations component (86.8) printing a further marginal decline from the July edition. The economic malaise unsurprisingly was the worst in manufacturing but the business climate in the services sector deteriorated too. Trade sentiment improved slightly while the construction index was unchanged.
Oil prices displayed some of the biggest moves in other markets today. Brent rallied for a third day straight on supply/geopolitical concerns. A barrel currently sells for $81.3 compared to last week’s recent lows around $76. Sticking on the commodity market, gold is on track for the highest close on record ($2 526 per ounce). Equity markets shifted into lower gear with looming record highs in the US (eg. S&P 500) all but erasing any memories to the brutal but short-lived sell-off early August. The Japanese yen is one of the better performers on currency markets today. USD/JPY eased towards the 144 big figure, EUR/JPY is trading around 160.77. EUR/USD’s inability to push beyond 1.12 triggered some minor return action back to 1.116 in technically insignificant trading. We take sterling’s pretty sharp intraday swings with a pinch of salt against the backdrop of UK markets being closed for a summer bank holiday (EUR/GBP around +0.845).
News & Views
Belgian business confidence deteriorated slightly in August, dipping from -12.3 to -12.6 (vs -12.7 expected), the lowest level since February. The overall synthetic smoothed curve, which reflects the underlying economic trend, reached a turning point and dipped slightly for the first time in seven months. A new weakening of the manufacturing industry (-16.5 from -14.9) was mainly due to a sharp deterioration in employment expectations and, to a lesser extent, demand expectations. Trade industry confidence rose significantly (-22.2 to -16.6) because of a clear upward revision in demand expectations and even more so in intentions of placing orders with suppliers. Business-related services confidence stabilized (0.4 from 0) while building industry confidence improved from -9.6 to -7.5. On a downbeat note, business leaders expect demand to ease in the coming three months just like in the services sector. General conditions for access to bank credit eased for the third quarter in a row, according to the July 2024 quarterly survey on firms’ perception of lending conditions.
Minutes of the previous Swedish Riksbank meeting reveal that the central bank discussed a larger (50 bps) rate cut at last week’s meeting. The support for a second 25 bps rate cut was fairly balanced together with updated guidance of 2 to 3 additional rate cuts this year. Governor Thedeen openly stated that he’s willing to err on the side of making policy less restrictive at all three remaining meetings. That scenario is currently discounted in Swedish money markets with some even positioning for a 50 bps rate cut at one of the meetings. The Swedish krone weakened marginally from EUR/SEK 11.38 to 11.43.
Graphs
US 2-yr yield continues to struggle. Recent (August) lows hold for the time being though
Brent oil ($/barrel) extends recent rebound on supply/geopolitical concerns
GBP/USD: that’s what you call a “triangle break”
EUR/SEK: Swedish crown loses some territory after Riksbank min
EUR/USD Mid-Day Outlook
Daily Pivots: (S1) 1.1130; (P) 1.1165; (R1) 1.1229; More....
Intraday bias in EUR/USD Is turned neutral first with current retreat and some consolidations would be seen. Downside of retreat should be contained above 1.0007 resistance turned support to bring another rally. Above 1.1200 will resume recent rally to 161.8% projection of 1.0665 to 1.0947 from 1.0776 at 1.1232, and then 1.1274 high.
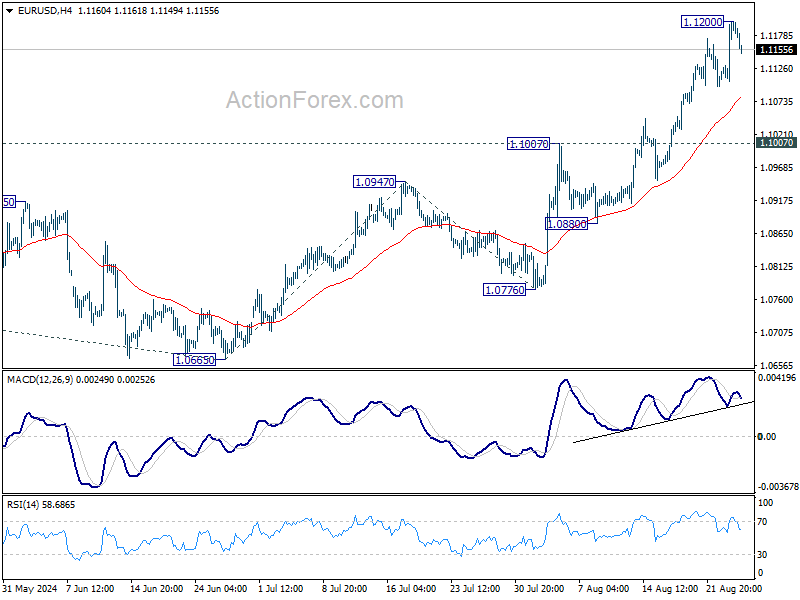
In the bigger picture, break of 1.1138 resistance indicates that corrective pattern from 1.1274 has completed at 1.0665 already. Decisive break of 1.1274 (2023 high) will confirm whole up trend from 0.9534 (2022 low). Next target will be 61.8% projection of 0.9534 to 1.1274 from 1.0665 at 1.1740. This will now be the favored case as long as 1.0947 resistance turned support holds.
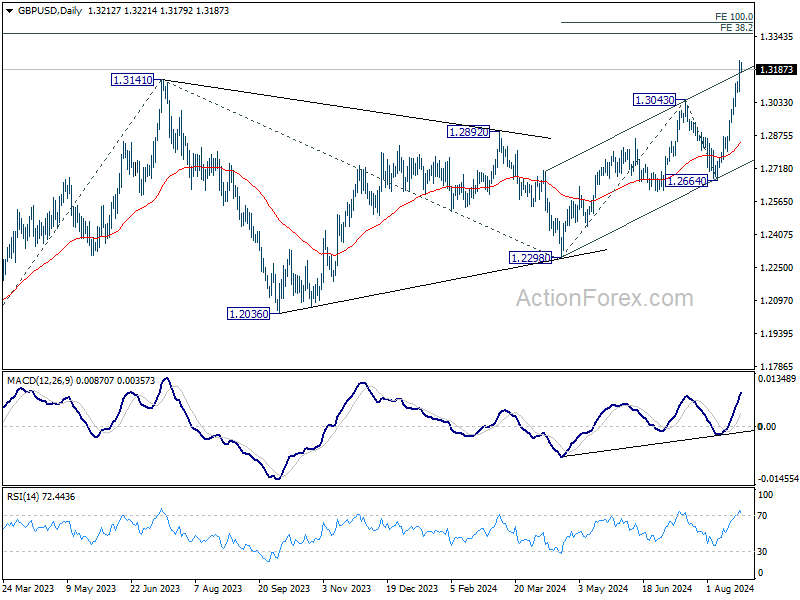
GBP/USD Mid-Day Outlook
Daily Pivots: (S1) 1.3116; (P) 1.3174; (R1) 1.3276; More...
GBP/USD's rally is still in progress and intraday bias stays on the upside. Current up trend should target 100% projection of 1.2298 to 1.3043 from 1.2664 at 1.3409. On the downside, below 1.3075 minor support will turn intraday bias neutral and bring consolidations, before staging another rally.
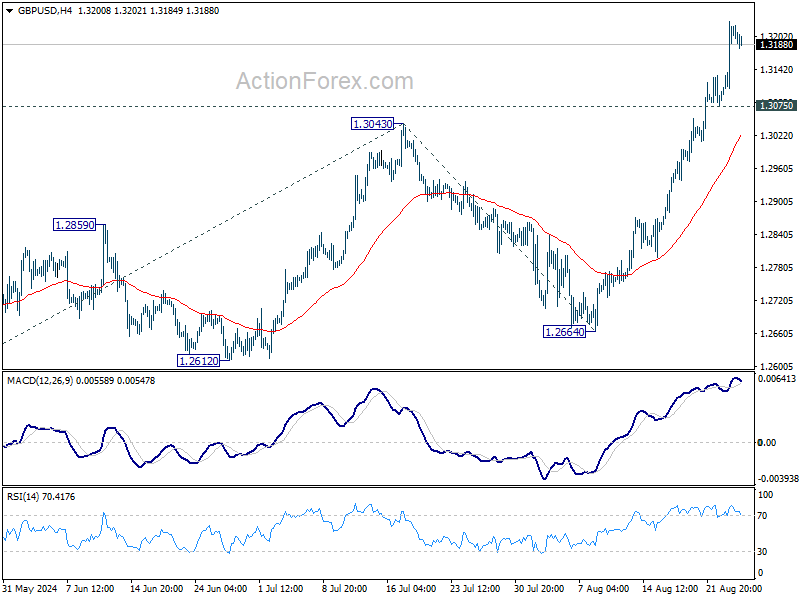
In the bigger picture, up trend from 1.0351 (2022 low) is resuming. Next target is 38.2% projection of 1.0351 to 1.3141 from 1.2298 at 1.3364. For now, outlook will stay bullish as long as 1.2664 support holds, even in case of deep pullback.
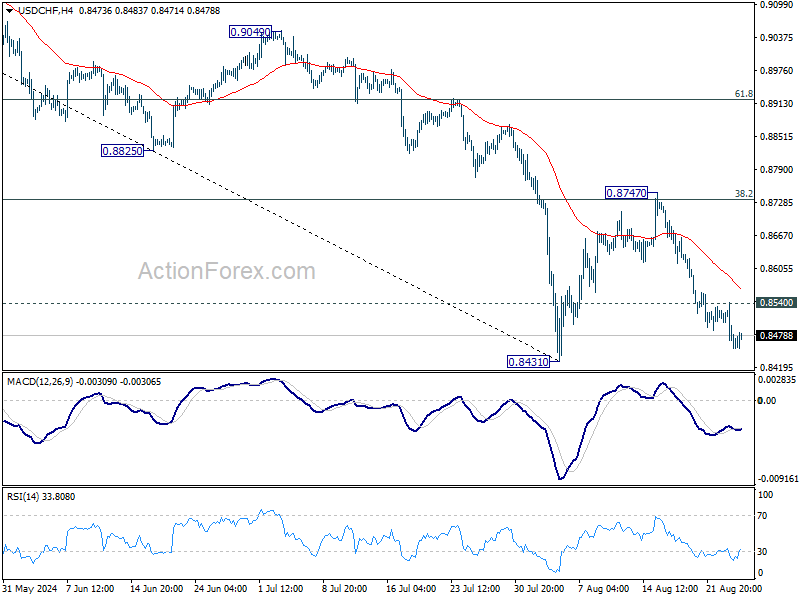
USD/CHF Mid-Day Outlook
Daily Pivots: (S1) 0.8451; (P) 0.8497; (R1) 0.8522; More…..
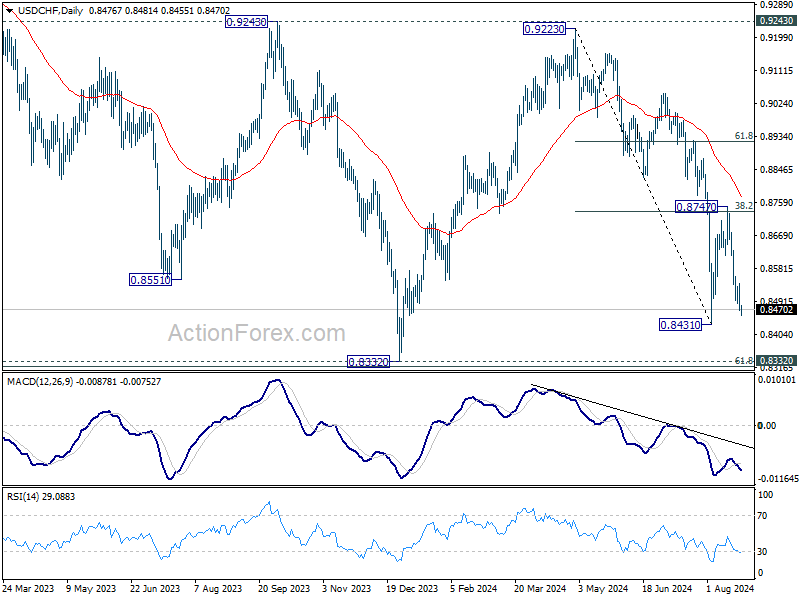
USD/CHF's fall from 0.8747 is in progress and intraday bias stays on the downside for retesting 0.8431 support. Firm break there will resume whole decline from 0.9223 towards 0.8332 low. On the upside, above 0.8540 minor resistance will turn intraday bias neutral. But risk will stay on the downside as long as 0.8747 resistance holds, in case of recovery.
In the bigger picture, price actions from 0.8332 (2023 low) are currently seen as a medium term corrective pattern, with fall from 0.9223 as the second leg. Strong support could be seen from 0.8332 to bring rebound. Yet, overall outlook will continue to stay bearish as long as 0.9243 resistance holds. Firm break of 0.8332, however, will resume larger down trend from 1.0146 (2022 high).
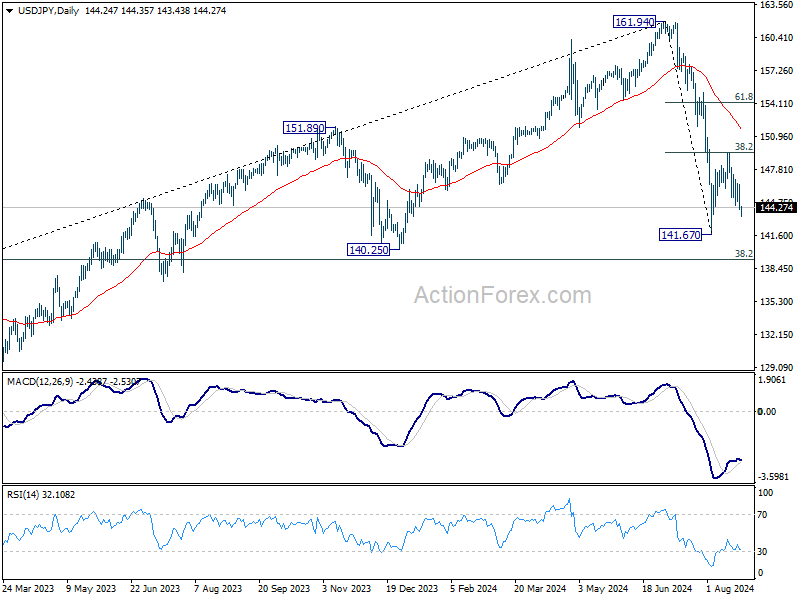
USD/JPY Mid-Day Outlook
Daily Pivots: (S1) 143.37; (P) 144.93; (R1) 145.81; More...
Intraday bias in USD/JPY remains mildly on the downside as fall from 149.35 is in progress for retesting 141.67 low. Firm break there will resume the whole fall from 161.94 to 140.25 support next. On the upside, above 146.47 minor resistance will turn intraday bias neutral first. But, risk will stay on the downside as long as 149.35 resistance holds, in case of recovery.
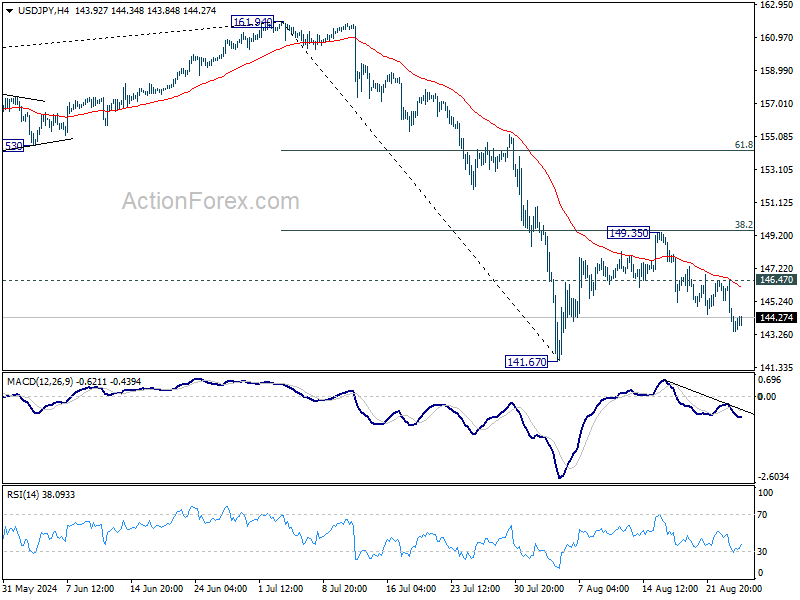
In the bigger picture, fall from 161.94 medium term top is seen as correcting whole up trend from 102.58 (2021 low). Deeper decline could be seen to 38.2% retracement of 102.58 to 161.94 at 139.26, which is close to 140.25 support. In any case, risk will stay on the downside as long as 55 W EMA (now at 149.38) holds. Nevertheless, firm break of 55 W EMA will suggest that the range for medium term corrective pattern is already set.
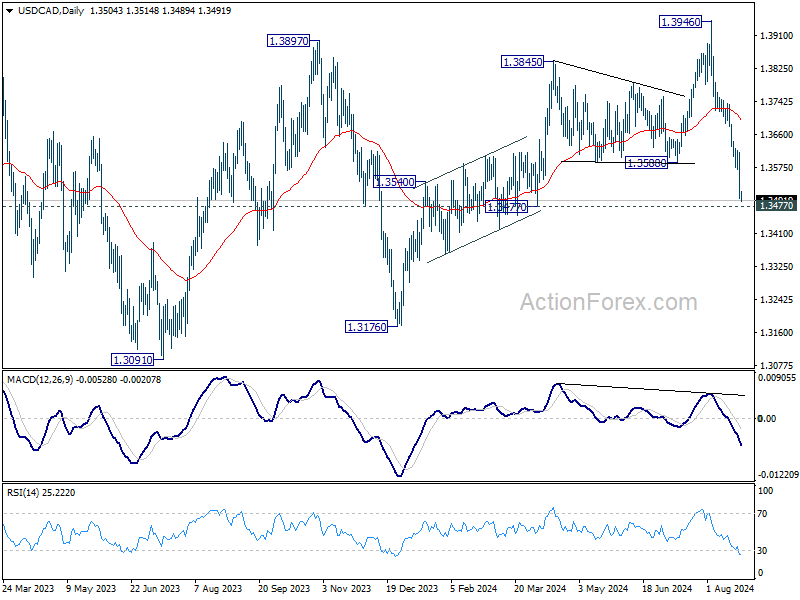
USD/CAD Mid-Day Outlook
Daily Pivots: (S1) 1.3465; (P) 1.3542; (R1) 1.3586; More...
USD/CAD's fall from 1.3946 continues today and intraday bias stays on the downside for 1.3477 support. Firm break there will target 1.3091/3176 support zone. On the upside, above 1.3570 support turned resistance will turn intraday bias neutral and bring consolidations first, before staging another decline.
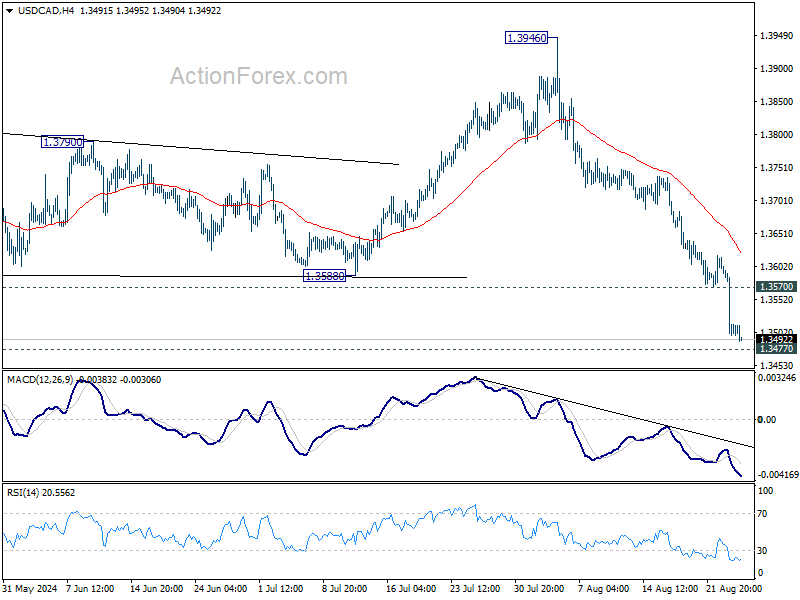
In the bigger picture, current development suggests that corrective pattern from 1.3976 (2022 high) is extending with another falling leg. While deeper decline could be seen, strong support should emerge above 1.2947 resistance turned support to bring rebound. Rise from 1.2005 (2021 low) is still in favor to resume at a later stage.
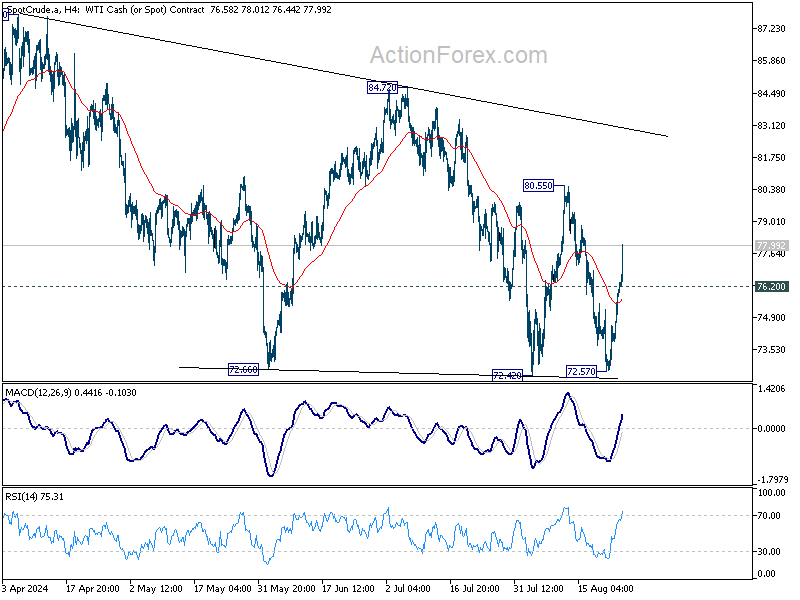
Libya and Middle East Tensions Drive Oil Surge
Geopolitical events dominate market movements today amid a sparse economic calendar. Oil prices have surged following an announcement from Libya’s eastern government in Benghazi that oil production and exports would be halted. This move stems from a dispute with the internationally recognized western government in Tripoli over central bank leadership.
Additionally, markets are reacting to news of Israel launching a major airstrike campaign in Lebanon on Sunday. The operation, described by Israel as a preemptive measure against Hezbollah, has escalated tensions, with Hezbollah responding by launching hundreds of missiles at Israel in retaliation for the death of one of its senior commanders in July.
In the currency markets, Yen is currently leading as the strongest performer, although buying momentum remains subdued. Canadian Dollar is gaining strength as well, bolstered by rising oil prices, while Dollar follows, supported by strong durable goods orders data.
Conversely, New Zealand Dollar is the weakest, trailed by Australian Dollar. Euro is also under pressure after Germany’s Ifo institute warned of a deepening economic crisis. Sterling and the Swiss Franc are positioned in the middle of the performance chart.
Technically, WTI's strong rally today suggests that fall from 80.55 has completed at 72.57, after defending 71.42 support. Further rise is now expected as long as 76.20 support holds, towards 80.55 resistance next. Firm break there will raise the chance that whole consolidation from 87.84 has completed and target 84.72 resistance and above.
In Europe, at the time of writing, FTSE is up 0.48%. DAX is down -0.08%. CAC is up 0.25%. UK 10-year yield is flat at 3.916. Germany 10-year yield is up 0.018 at 2.251. Earlier in Asia, Nikkei fell -0.66%. Hong Kong HSI rose 1.06%. China Shanghai SSE rose 0.04%. Singapore Strait Times rose 0.24%. Japan 10-year JGB yield fell -0.0107 to 0.885.
US durable goods orders jump 9.9% mom in Aug
US durable goods orders surged 9.9% mom to USD 289.6B, well above expectation of 4.0% mom. Ex-transport orders fell -0.2% mom to USD 187.4B, below expectation of 0.0% mom. Ex-defense orders jumped 10.4% mom to USD 271.9B.
Transportation equipment drove the overall growth, up 34.8% mom to USD 102.2B.
German Ifo business climate falls to 86.6, Ifo warns of worsening economic crisis
In August, Germany’s Ifo Business Climate Index dropped from 87.0 to 86.6, slightly surpassing expectations of 86.5 but still signaling growing economic concerns. Current Assessment Index also dipped from 87.1 to 86.5, aligning with forecasts, while Expectations Index marginally beat predictions at 86.8, although still reflecting a decline from 87.0
Sector-wise, manufacturing sector saw a significant decline from -14.2 to -17.8. Services sector turned negative, falling from 0.8 to -1.3. Trade sector showed a minor improvement from -27.9 tox -27.4, while construction remained stagnant at -26.4.
Ifo President Clemens Fuest issued a stark warning, stating, "The German economy is increasingly falling into crisis."
USD/CAD Mid-Day Outlook
Daily Pivots: (S1) 1.3465; (P) 1.3542; (R1) 1.3586; More...
USD/CAD's fall from 1.3946 continues today and intraday bias stays on the downside for 1.3477 support. Firm break there will target 1.3091/3176 support zone. On the upside, above 1.3570 support turned resistance will turn intraday bias neutral and bring consolidations first, before staging another decline.
In the bigger picture, current development suggests that corrective pattern from 1.3976 (2022 high) is extending with another falling leg. While deeper decline could be seen, strong support should emerge above 1.2947 resistance turned support to bring rebound. Rise from 1.2005 (2021 low) is still in favor to resume at a later stage.
Economic Indicators Update
| GMT | Ccy | Events | Actual | Forecast | Previous | Revised |
|---|---|---|---|---|---|---|
| 08:00 | EUR | Germany IFO Business Climate Aug | 86.6 | 86.5 | 87 | |
| 08:00 | EUR | Germany IFO Current Assessment Aug | 86.5 | 86.5 | 87.1 | |
| 08:00 | EUR | Germany IFO Expectations Aug | 86.8 | 86.5 | 86.9 | 87 |
| 12:30 | USD | Durable Goods Orders Jul | 9.90% | 4.00% | -6.70% | |
| 12:30 | USD | Durable Goods Orders ex Transport Jul | -0.20% | 0.00% | 0.40% |