
Sample Category Title
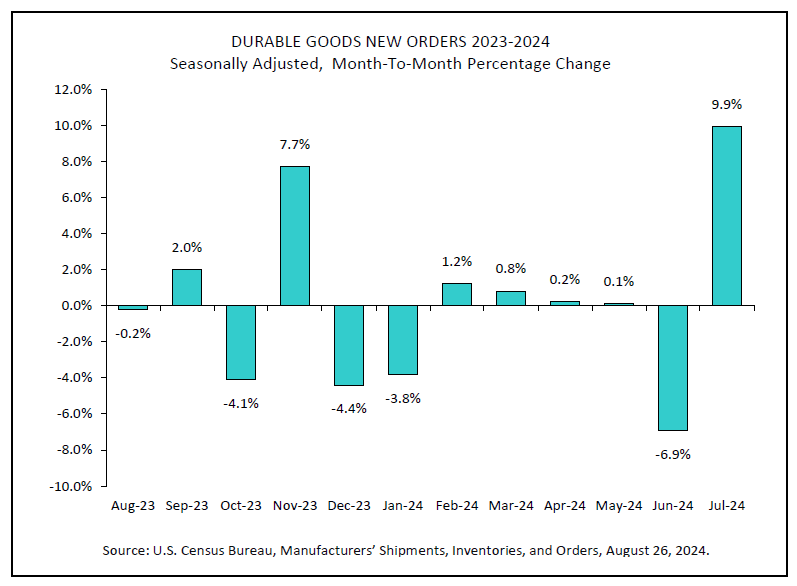
US durable goods orders jump 9.9% mom in Aug
US durable goods orders surged 9.9% mom to USD 289.6B, well above expectation of 4.0% mom. Ex-transport orders fell -0.2% mom to USD 187.4B, below expectation of 0.0% mom. Ex-defense orders jumped 10.4% mom to USD 271.9B.
Transportation equipment drove the overall growth, up 34.8% mom to USD 102.2B.
Yen Soars as Powell Signals Rate Cuts on the Way
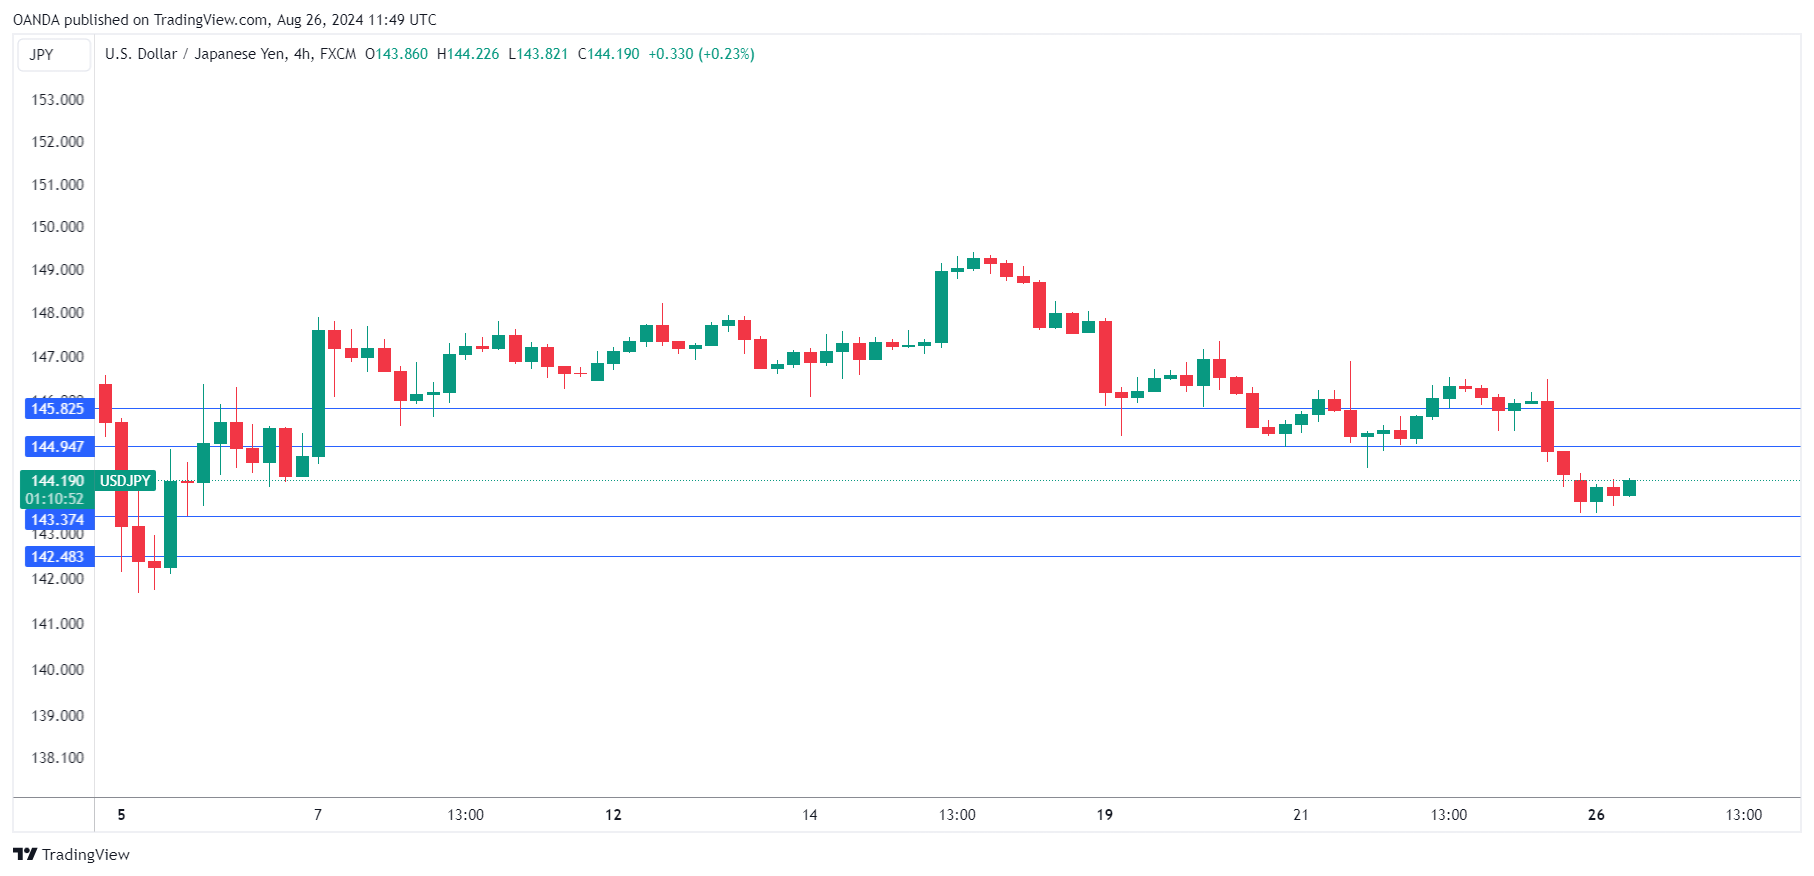
The Japanese yen has started the week with slight gains. In the European session, USD/JPY is trading at 144.15, down 0.16% on the day at the time of writing.
On Friday, the yen shot up 1.3%, as the US dollar was pummeled by the major currencies following Federal Chair Jerome Powell’s speech at the Jackson Hole Symposium.
Powell says Fed poised to cut rates
The markets eagerly awaited Jerome’s Powell’s speech at Jackson Hole and heard what they were looking for – an endorsement for a milestone rate cut. Powell said “the time has come for policy to adjust” but didn’t say when, noting that the timing and pace of rate cuts would depend on the economic outlook and the incoming data. Still, there’s little doubt that next month the Fed will deliver its first rate cut since March 2020, at the onset of the Covid pandemic. The market’s response to Powell’s remarks sent that US dollar sharply lower on Friday against the major currencies.
The markets have fully priced in a rate cut in September. Just one month ago, the odds of a 25-basis point cut stood at 88% and 12% for a cut of 50 bps, according to the CME’s FedWatch. Since then, the US economy has posted some weaker-than-expected data and the probability currently stands at 63.5% for a 25-bps cut vs. 36.5% for a 50 bps move.
The odds could move sharply once again after the US releases the employment report on Sept. 6, two weeks ahead of the Fed meeting. A weak jobs report could rattle investors and push the Fed to respond with a 50-bps cut.
In Japan, inflation will be in focus with the release of BoJ Core CPI for July. The index is expected to remain unchanged at 2.1%. Inflation has been moving higher in Japan, making the Bank of Japan an outlier among major central banks as it looks to normalize policy by raising interest rates.
USD/JPY Technical
- USD/JPY tested support at 143.37 earlier. Below, there is support at 142.49
- There is resistance at 144.93 and 145.81
Germany’s Weakening Business Climate Cooled But Unlikely to Turn Euro Around
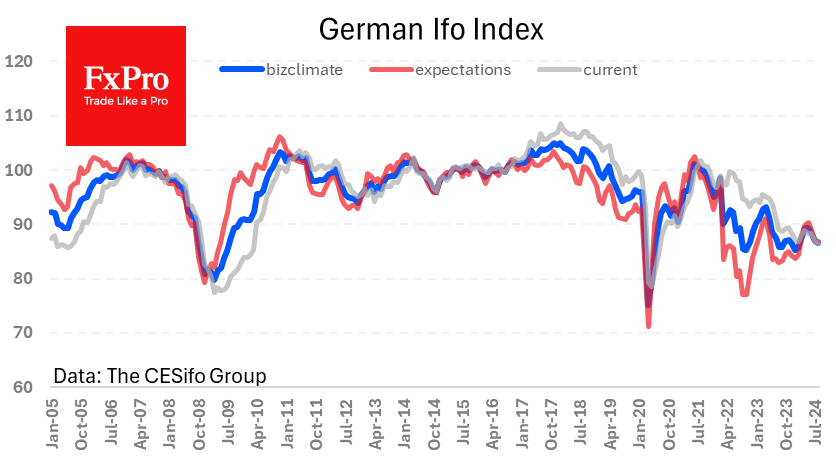
Germany’s business climate
Germany’s business climate deteriorated in August but was better than expected. The Ifo business climate indicator fell from 87.0 to 86.6, the fourth consecutive month of decline, but better than the forecast of 86.0. Both the expectations and components of the current conditions fell.
This is potentially negative news for the single currency, pointing to a deterioration in the macro-economy. However, markets have little doubt that the ECB will cut rates in September, so the short-term reaction has been limited. It is also worth remembering that the ECB does not target the labour market like the Fed but focuses solely on inflation. A slowdown in industry and services tends to keep prices in check, but this can be a rather long and indirect process. From this perspective, more attention will be paid to Thursday’s preliminary inflation estimate for August.
Nonetheless, any weakness in the macroeconomic data could trigger active profit-taking in the EURUSD, which climbed to 1.1120 at the start of Monday’s trading, a 13-month high.
EURUSD Technical Analysis
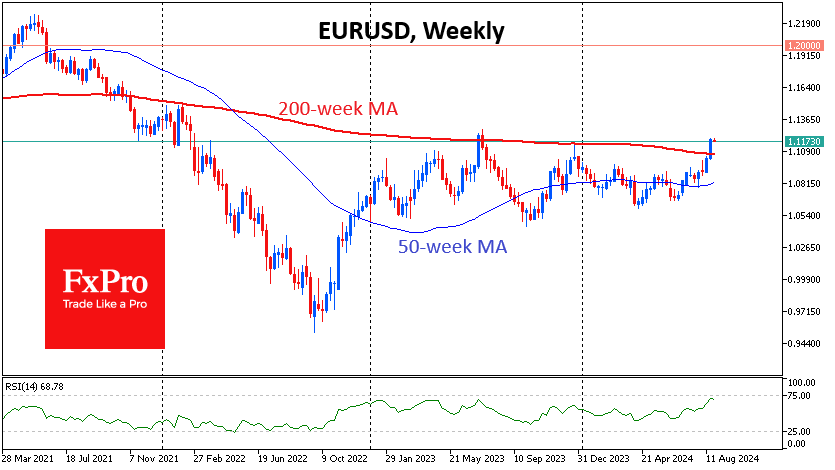
Last week, the EURUSD made an important technical breakout, trading above its 200-week moving average by more than 1%. Four years ago, this breakout was followed by a four-week rally in the pair, which lasted for almost six months and totalled more than 9%. A similar magnitude of growth was seen in 2017.
In the current environment, this suggests upside potential above 1.20, mainly due to a weaker dollar, while weakness in the economy and government finances remains the single currency’s Achilles’ heel.
News of the Week (August 26— August 30): EURUSD Analysis!
EURUSD presents enticing opportunities for all traders—keep watching!
The EURUSD pair, often referred to by traders as the "Fiber," is the most traded currency pair in the Forex market. It reflects the Euro's relative strength against the US Dollar, two of the world's most significant currencies. The US Dollar's value is heavily influenced by economic indicators such as GDP growth, employment data, and Federal Reserve monetary policy decisions. On the other hand, the Euro is impacted by economic developments across the Eurozone, particularly Germany and France, as well as by the European Central Bank's policy actions.
US gross domestic product (GDP) QoQ, Aug 29, 14:30 (GMT+2)
The US economy is currently displaying resilience with solid growth, though concerns about inflation and a potential slowdown persist. The upcoming US GDP report is forecasted to show a steady growth rate of 2.8% for the quarter. If the actual GDP exceeds this forecast, indicating stronger-than-expected economic expansion, it could lead to a significant appreciation of the US Dollar. A stronger Dollar would likely push the EURUSD pair lower. Conversely, if the GDP figure comes below expectations, suggesting that the US economy is slowing down, the Dollar could weaken. In this scenario, the EURUSD pair might rise as the market anticipates a more dovish stance from the Federal Reserve.
Last time, US GDP came in below expectations, which led to a noticeable rise in EURUSD during the day!
Eurozone consumer price index (CPI) YoY, Aug 30, 11:00 (GMT+2)
The Eurozone CPI is forecasted to remain at 2.6%, reflecting stable regional inflation. If the CPI comes in higher than expected, it would signal rising inflationary pressures within the Eurozone. This could lead to speculation that the European Central Bank will keep monetary policy at current levels. This move would likely strengthen the Euro, driving the EURUSD pair higher. On the other hand, if the CPI is lower than forecasted, it could indicate that inflationary pressures are weaker than anticipated. This might prompt the ECB to maintain or even loosen its accommodative monetary policies, weakening the Euro, and, as a result, the EURUSD pair could decline.
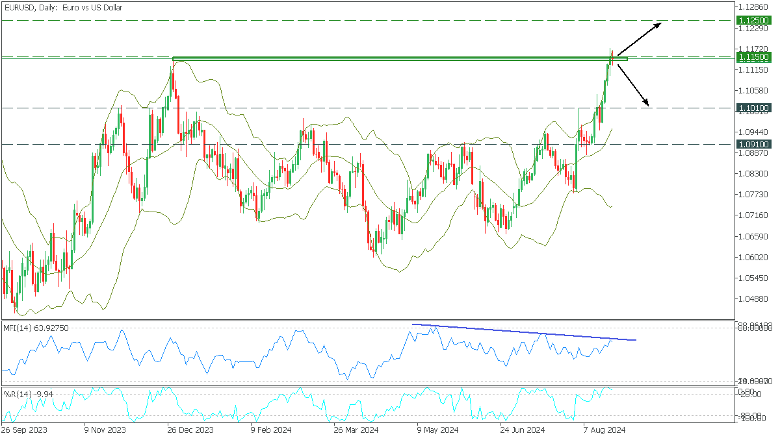
In the Daily timeframe, EURUSD, in a long-term bullish trend, reached a critical resistance level, testing the upper Bollinger line. Despite the solid bullish sentiment, a divergence has formed on the MFI, and the %R indicates overbought.
- If the price breaks above 1.1150 resistance, the target will be 1.1250, which is last year's high;
- A rebound from resistance will drop EURUSD to support at 1.1010;
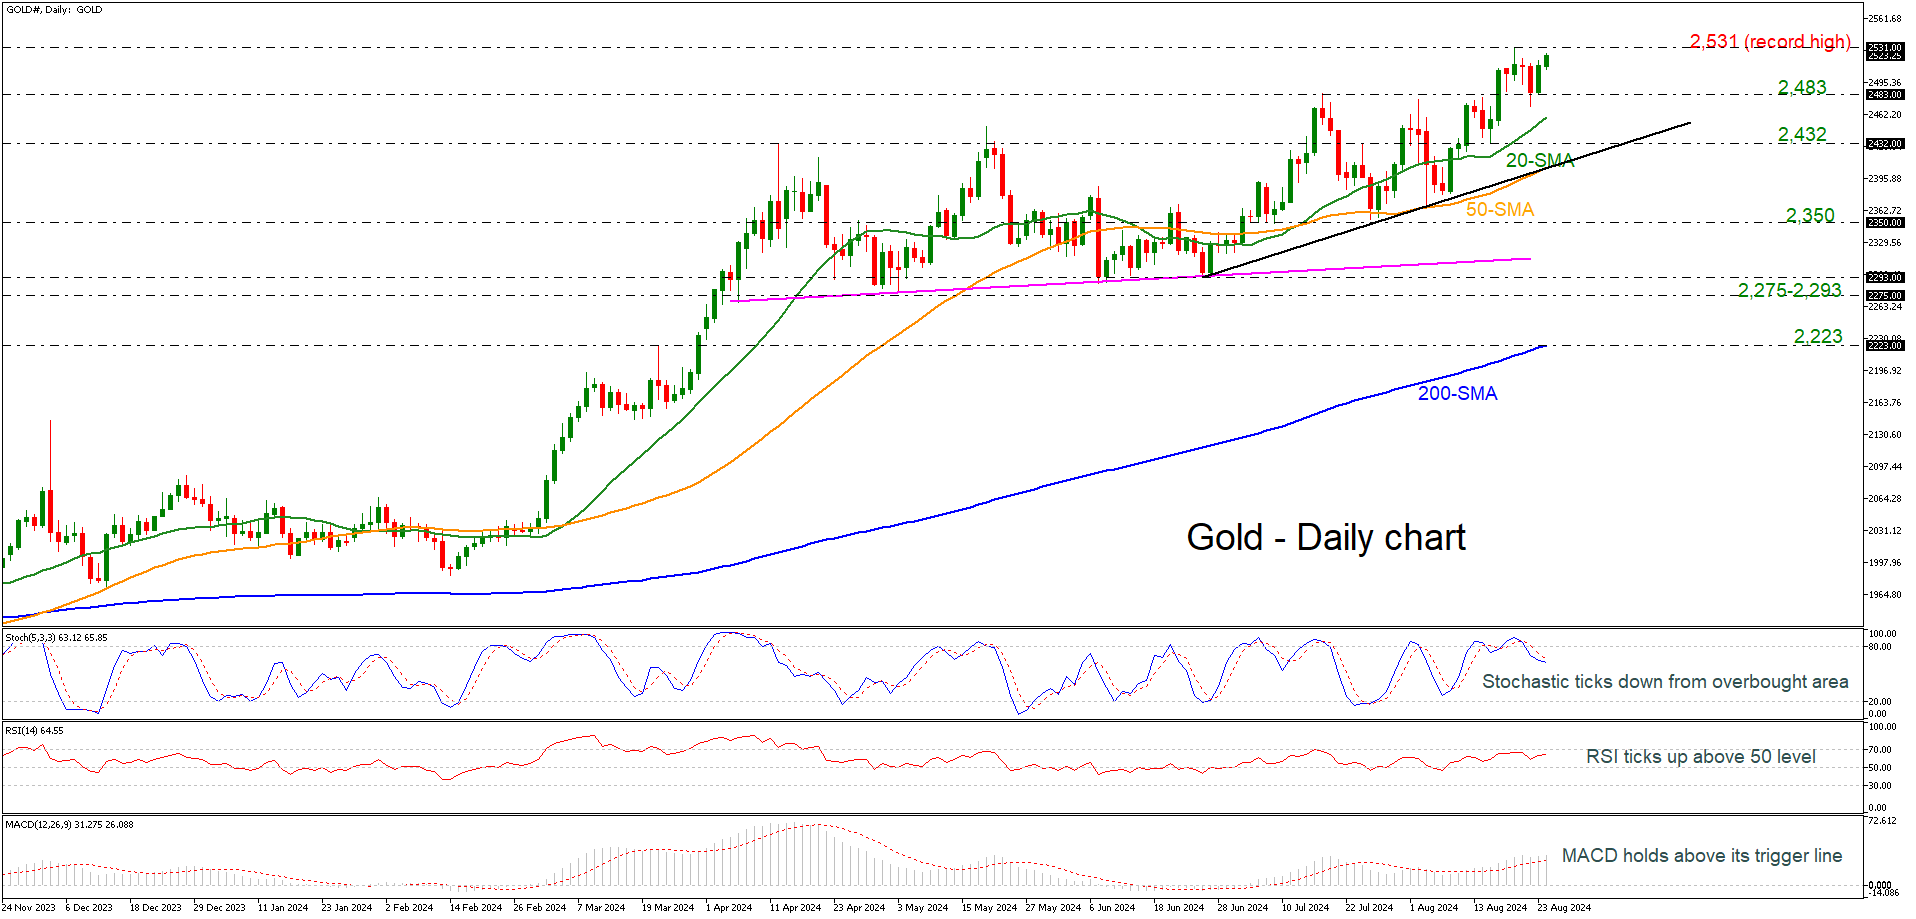
Gold Creates New Bullish Wave Near Record High
- Gold rises above short-term SMAs
- Stochastics turn down
- MACD and RSI still have positive momentum
Gold prices are rallying higher, with the prospect of reaching the record high of 2,531 again. More advances may find resistance at the next round numbers of 2,600 and 2,700.
However, the technical signals are mixed. The stochastic oscillator is heading south from the overbought region; however, the RSI is ticking higher, approaching the 70 level. Moreover, the MACD oscillator is holding above its trigger and zero lines. The 20- and 50-day simple moving averages (SMAs) are pointing higher, while the current market price is standing well above the 200-day SMA.
In the negative scenario, a drop beneath the previous high could lead the market towards the 20-day SMA at 2,460, ahead of the 2,432 support. Even lower, the 50-day SMA at 2,406, which coincides with the short-term uptrend line, may halt downside actions.
All in all, the yellow metal has had a strong bullish tendency in the long- and short-term timeframes, and only a decisive close below the 200-day SMA could change the current outlook.
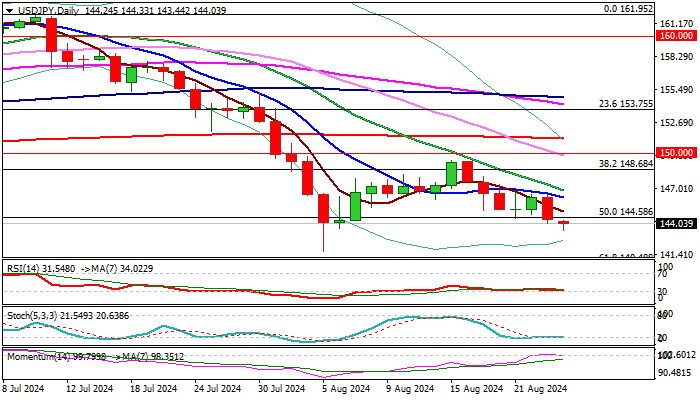
USD/JPY Outlook: Mal Fall Further After Completion of Corrective Phase
USD/JPY dips to three week low on Monday and hit Fibo 76.4% retracement of 141.68/149.40 corrective upleg, adding to signals that correction of larger downtrend is close to its end.
Strong drop last week (2.1%) completed a bearish engulfing pattern and registered weekly close below 100WMA (144.59), generating fresh bearish signal and setting scope for retest of 141.68 (August 4 low, the lowest since late December).
Bearish technical and fundamental studies contribute to growing signals that USDJPY may extend losses after completing correction.
Break of triggers at 141.68 and 140.48/25 (Fibo 61.8% of 127.22/161.95 / Dec 28 low) likely to spark fresh acceleration lower and dips below psychological 140 support.
Res: 144.58; 145.04; 146.27; 146.87.
Sup: 143.44; 142.58; 141.68; 140.48.
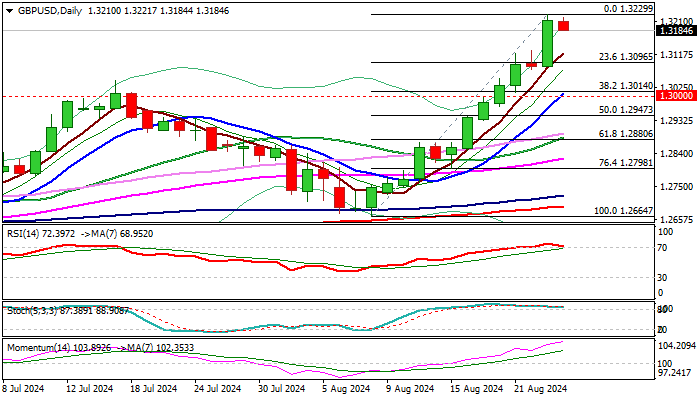
GBP/USD Outlook: Larger Bulls Likely to Take a Breather Before Resuming
Cable eases from new highest levels since March 2022 on Monday, suggesting that bulls may take breather after 3.6% advance in past two weeks and strong bullish acceleration last Friday (almost 1% daily gain).
Strongly overbought daily studies prompt traders to collect profit, though correction is likely to be limited as the uptrend is strong.
Higher base at 1.3080 marks initial support, while extended dips should be contained by solid supports at 1.3000 zone (38.2% of 1.2664/1.3229 / 10DMA / psychological) and mark a healthy correction, before fresh push higher and potential attack at 1.3328 (Fibo 76.4% of 1.4249/1.0348).
Res: 1.3229; 1.3279; 1.3300; 1.3328.
Sup: 1.3129; 1.3044; 1.3000; 1.2947.
Japanese Yen Gains as USD Weakens and BOJ Signals Possible Rate Hike
The Japanese yen has shown a notable strengthening, with the USD/JPY pair dropping to 143.99 on Monday, marking a three-week low. This movement is primarily driven by the weakness of the US dollar and significant remarks from the Bank of Japan (BOJ) and the US Federal Reserve.
Market dynamics and Central Bank signals
The recent hawkish comments from Kazuo Ueda, the Governor of the Bank of Japan, have garnered significant attention. Last Friday, Ueda hinted that the BOJ might adjust its monetary policy if economic forecasts align with current trends. The market interpreted this statement as a potential precursor to an interest rate hike, especially in light of Japan's core consumer price index rising for the third consecutive month to 2.7% in July, with overall inflation holding steady at 2.8%.
Conversely, Jerome Powell, Chair of the US Federal Reserve, adopted a more dovish stance, indicating that it might be time to revise US monetary policy due to increasing risks to the labour market. This suggests that the Fed could begin easing monetary policy as soon as September, a move that contrasts sharply with the potential tightening in Japan. These shifts in monetary policy outlooks have significantly shaped forex forecasts for the USD/JPY pair.
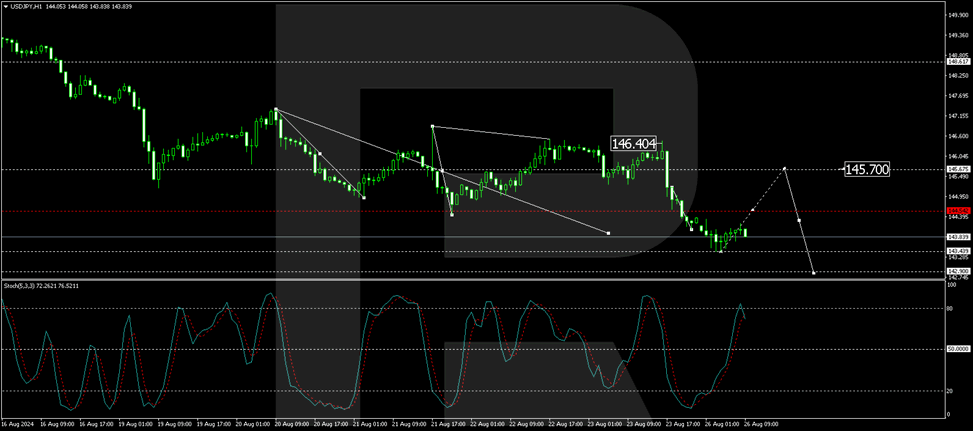
Technical analysis of USD/JPY
The USD/JPY formed a consolidation range around the 146.70 level before moving downward to 143.50. There may be a temporary rise to 144.55, but a further decline to 142.88 could follow. The MACD indicator supports this bearish outlook, with its signal line below zero and trending downward.
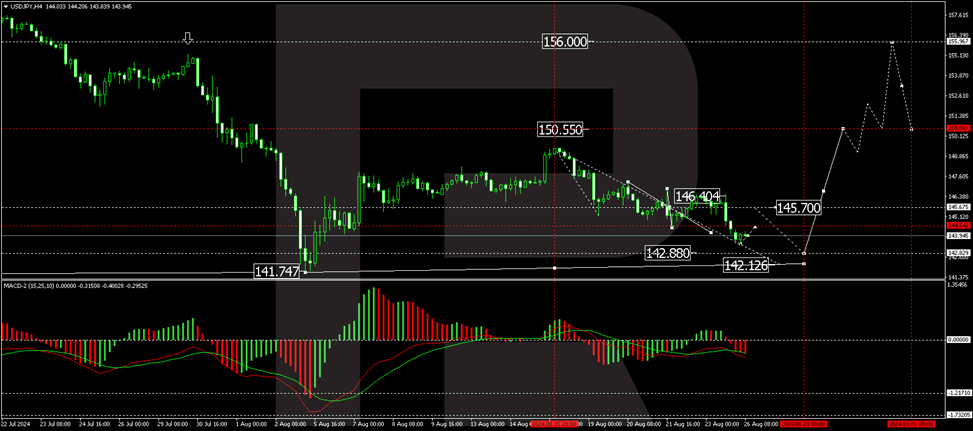
The pair has completed a downward structure to 143.44. A corrective move towards 144.55 is possible, potentially extending to 145.70 as a test from below. Following this, a decline to 142.88 might occur. The Stochastic oscillator, currently above 50, suggests a rise to 80 before the next downward phase.
Summary
The USD/JPY pair is experiencing downward pressure due to a combination of USD weakness and potential monetary policy adjustments from the BOJ. As market dynamics evolve with central bank policies and economic indicators, the yen could see further gains if the BOJ shifts towards a tighter monetary stance in response to rising inflation.
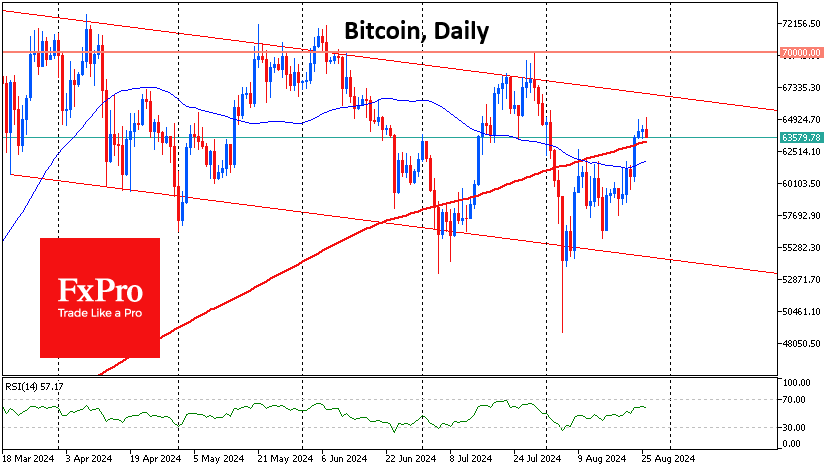
Light Greed of Crypto Market
Market picture
Since Friday, the crypto market has been in a mood of easy greed, as evidenced by the corresponding index, which reached 55 on Monday, close to levels at the beginning of the month. Market capitalisation has also returned to $2.25 trillion, the highest since August 2.
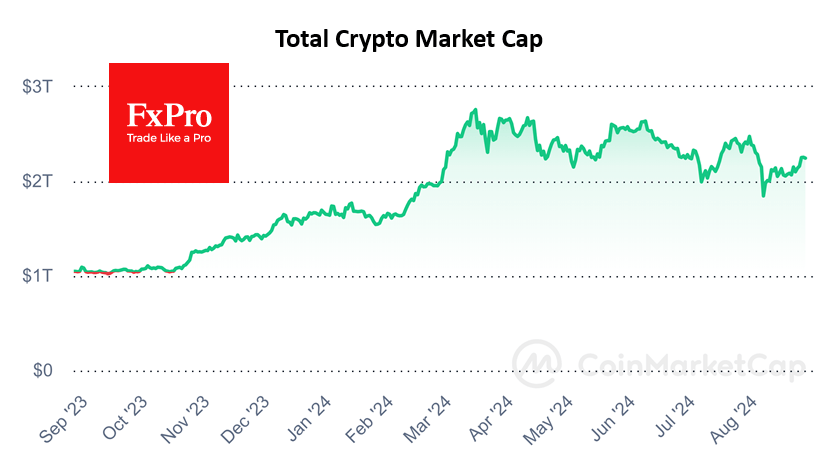
A decisive breakthrough came on Friday when Fed Chairman Powell supported optimism in global financial markets, tipping the scales in favour of the bulls. The cryptocurrency market has managed to overcome the local resistance of the past few weeks and is likely to head towards the upper end of the range, now nearing $2.35 trillion.
Bitcoin broke above both its 50- and 200-day moving averages on Friday and briefly touched the $65,000 level on Saturday and Monday morning. The bulls will need to confirm this breakout by holding above $63.0K on Monday.
Toncoin is stabilising at nearly $5.66 after losing more than 15% on the news of Pavel Durov’s arrest. Technically, the coin is consolidating near its 200-day moving average, which is acting as local support. In our view, there is a high probability of a deeper dive to the $4.3 (200-week) or even $2.5 (April 2022-February 2024 resistance area).
News background
Data from CryptoQuant and major options exchange Deribit signalled moderate optimism in the crypto market. Bitcoin reserves on centralised exchanges fell to multi-year lows in August.
According to SoSoValue data, total weekly inflows into Bitcoin-ETFs totalled $506.4 million, the highest in 4 weeks. Cumulative inflows since the BTC-ETF was approved in January rose to $17.88bn.
In contrast, the Ethereum-ETF has seen a negative trend, with outflows of $44.5 million for the week after outflows of $14.2 million previously. Net outflows since product approval have risen to $464.7 million.
According to Spot On Chain, the non-profit Ethereum Foundation moved 35,000 ETH ($94 million) to cryptocurrency exchange Kraken, the largest Ethereum Foundation transaction this year.
Ethereum’s Dencun update, activated in March, has led to an increase in bots’ activity and failed transactions on Layer 2 networks, according to Galaxy Digital.
EUR/USD Exchange Rate Has Risen to 1.12 Level
During his speech at Jackson Hole, as reported by Reuters, the Fed Chair unexpectedly focused heavily on the US labour market. Powell stated that weaker employment prospects are unacceptable. As a result of this emphasis, market expectations for a rate cut in September decreased, and the value of the US dollar increased:
→ On Monday morning, the dollar index is recovering from the year's lows, which were reached on Friday;
→ Accordingly, other currencies are depreciating against the USD.
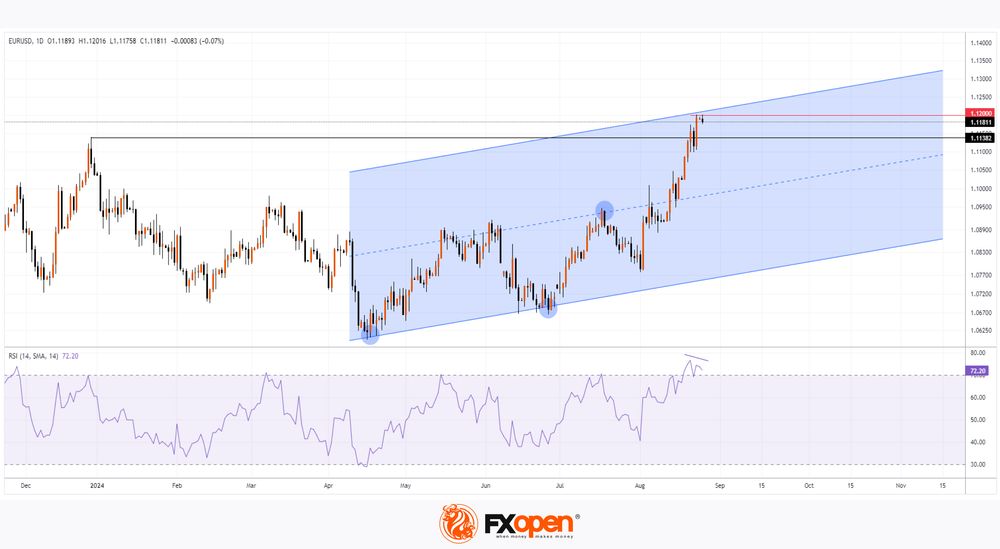
As shown by the technical analysis of the EUR/USD chart:
→ Since April, the exchange rate fluctuations have been forming an upward channel (marked in blue, with support points indicated by circles);
→ Within this channel, the price is near the upper boundary, from which resistance can be expected;
→ Additionally, the 1.12 level shows signs of resistance—the price slightly exceeded it before quickly falling back below. Signs of false bullish breakouts indicate weak demand.
The possible exhaustion of buyers seems plausible, considering that:
→ The EUR/USD exchange rate increased by approximately 3.7% in August, surpassing the December 2023 high of around 1.114;
→ The RSI indicator is in the overbought zone, forming a bearish divergence.
Therefore, traders should be prepared for the price to follow a scenario involving a pullback after the rally to the 1.12 level. Volatile movements may occur following this week’s news releases:
→ The US GDP data is scheduled for release at 15:30 GMT+3 on Thursday;
→ The Eurozone inflation data is scheduled for release at 12:00 GMT+3 on Friday.
Trade over 50 forex markets 24 hours a day with FXOpen. Take advantage of low commissions, deep liquidity, and spreads from 0.0 pips. Open your FXOpen account now or learn more about trading forex with FXOpen.
This article represents the opinion of the Companies operating under the FXOpen brand only. It is not to be construed as an offer, solicitation, or recommendation with respect to products and services provided by the Companies operating under the FXOpen brand, nor is it to be considered financial advice.