Sample Category Title
Alarming UK Labour Market Data
Unexpected weakness in the UK labour market could signal an important turnaround in the economy and raise the urgency of monetary easing. The short-term impact on the Pound has been relatively limited, but the currency market has now adopted a wait-and-see approach ahead of Wednesday’s US news.
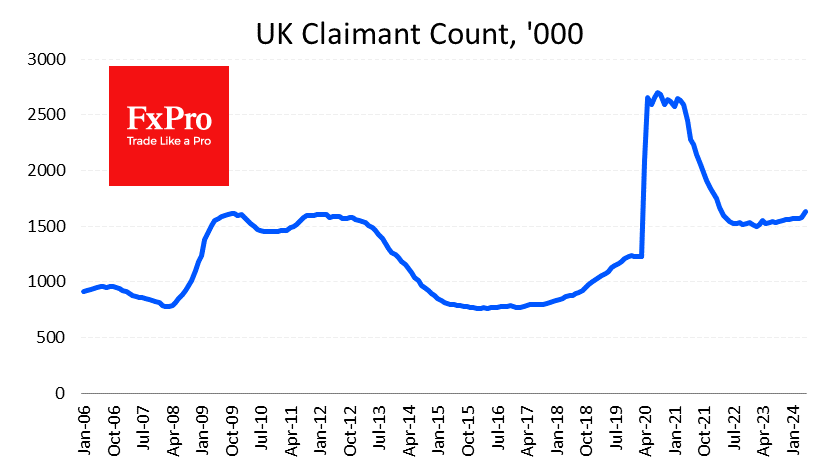
This morning’s batch of data from the UK saw a 50.4K jump in Claimant Count in May after 8.4K a month earlier. This is the biggest monthly increase since the first COVID lockdowns, and before that, the last time there was such a jump was in the depths of the 2009 recession. A frightening acceleration of the upward trend in the indicator has been seen since March last year.
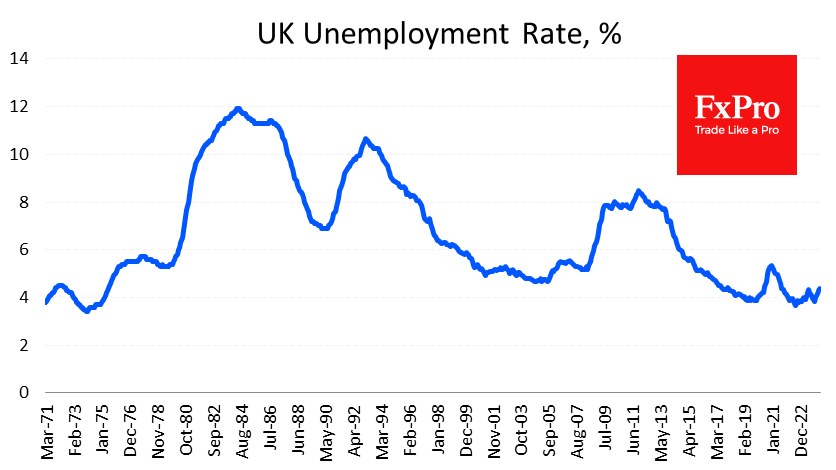
In a separate indicator, the Unemployment Rate for the February-April period climbed to 4.4%. This is still low by historical standards, but it is a three-year high and 0.6 percentage points above the one we saw in January last year. More actual Claimant claims are points to accelerate the unemployment growth.
Wage growth remained at an impressive 5.9% y/y, including bonuses (above the expected 5.7%). However, this is the typical acceleration in wages that we see in the early stages of mass layoffs when the lowest-paid employees are given the chop.
A fresh labour market report has every chance of shifting the Bank of England’s focus from fighting inflation to supporting the economy. This is even more so because, at this stage, reducing the tightness of monetary policy will only be necessary. If this process is delayed, the situation could easily lead to a repeat of the abnormal stimulus we saw in 2008/09 or 2020/21.
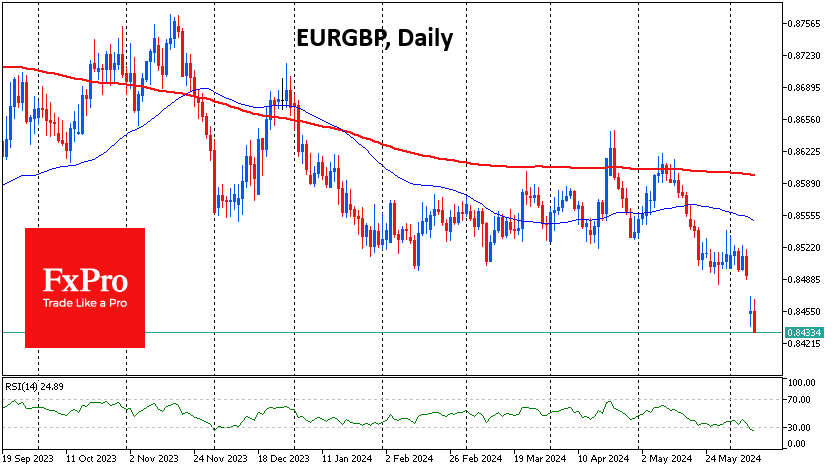
Reacting to the news, the GBP initially lost 0.15% against the USD and EUR but soon recovered almost completely. GBPUSD is dominated by a wait-and-see mood as all attention and volatility are deferred to inflation figures and monetary policy assessments from the FOMC on Wednesday. EURGBP remains under pressure due to the uncertainty surrounding the unexpected French elections and the disappointing (market-side) results of the European Parliament elections.
UK labour market data is already digging a hole for the Pound, and it remains a matter of days before it could fall into it.
Brent Crude Oil Stabilises Around 81.50 USD Amid Demand Optimism
Brent crude oil is holding steady at 81.50 USD per barrel on Tuesday, following a significant surge of over 2.5% the previous day. The price increase was driven by optimistic market expectations about fuel demand this coming summer and news that the US government is seizing the opportunity to replenish its strategic oil reserves at relatively low prices, with a particular focus on oil priced around 79 USD per barrel.
As the US Federal Reserve meeting commences today, market caution is expected. The recent robust employment data for May from the US suggests that the Fed might maintain a tight monetary policy longer than anticipated. This potential shift in policy could dampen US economic growth prospects and impact energy demand, making the Fed's forthcoming statements highly significant for the oil market.
Additionally, market participants eagerly await the release of the American Petroleum Institute (API) report on crude oil and petroleum product inventories today and the Department of Energy's similar report on Wednesday. These data releases, along with the monthly market reports from the Energy Information Administration (EIA), OPEC, and the International Energy Agency (IEA) later in the week, could further influence oil price dynamics.
Brent technical analysis
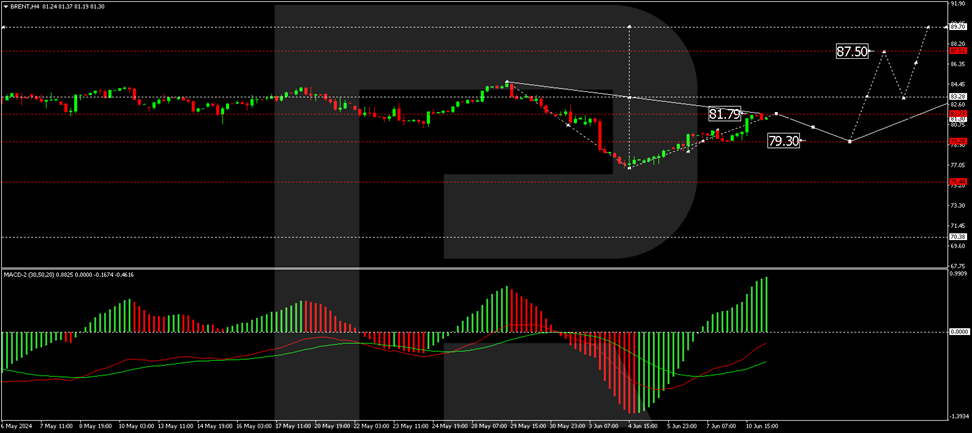
On the H4 chart, Brent has completed the initial wave of growth to 81.79. Currently, a consolidation range is expected to form below this level. Should there be a downward breakout, a correction towards 79.30 could occur, followed by a potential new wave of growth aiming for 83.30. Breaking this level could open the pathway to 87.50, the local target of the upward trend. The MACD indicator supports this bullish scenario, with its signal line below zero but directed sharply upwards.
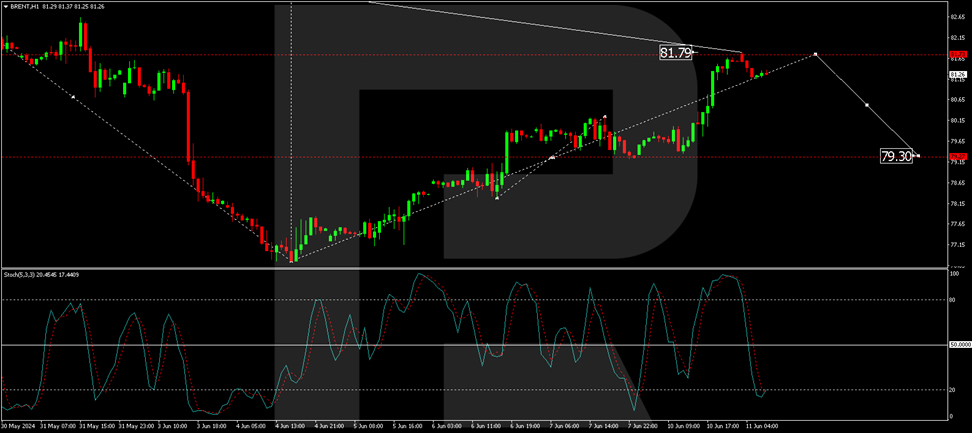
On the H1 chart, after reaching 81.79, Brent is forming a consolidation range beneath this level. A downward exit could initiate a decline to 80.50, and further breaking this level could extend the correction to 79.30. Upon reaching this level, an upward movement to 81.80 is anticipated, potentially leading to further growth towards 83.30. This scenario is technically supported by the Stochastic oscillator, indicating a potential upward movement, as its signal line is currently poised at 20.
Market outlook
As investors navigate a week packed with significant data releases and central bank meetings, Brent crude prices will likely exhibit volatility. The outcome of the US Federal Reserve's deliberations will be particularly pivotal, given its potential implications for economic activity and energy demand. Additionally, inventory data and global market reports from major energy agencies will provide further clues about supply and demand trends, which could either support the current price levels or drive further adjustments.
GBP/USD Shrugs as UK Unemployment Rises, GDP Next
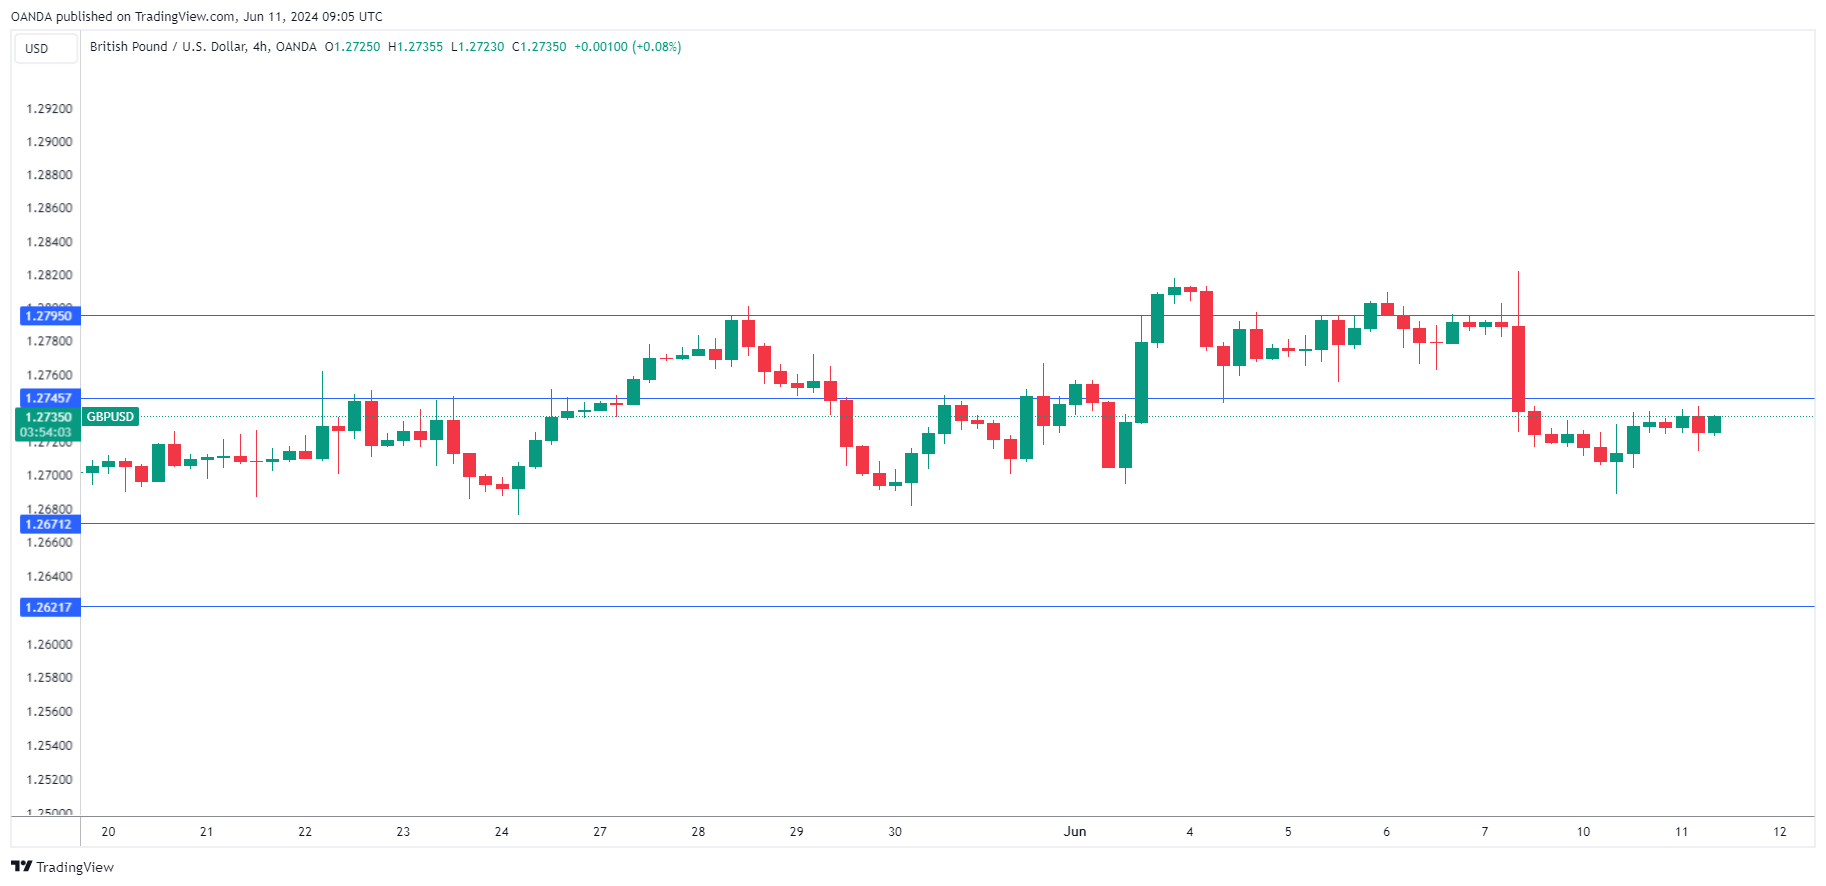
The British pound is drifting on Tuesday. GBP/USD is trading at 1.2720 in the European session at the time of writing, down 0.08% on the day. The UK released the May employment report earlier today. Next up is GDP on Wednesday, with a market estimate of 0% m/m for April, following a 0.4% gain in March.
UK labor market continues to cool down
Today’s UK employment report indicated that the labor market continues to cool down, with a notable rise in unemployment. Claimants for unemployment benefits jumped by 50.4 thousand in May, up sharply from a revised 8.4 thousand increase in April and higher than the market estimate of 10.2 thousand. The unemployment rate ticked up to 4.4% in the three months to April, up from 4.3% in the previous period and the market estimate of 4.3%.
Job growth continued to slow, falling by 139,000. Wage growth in the private sector, a key gauge for the central bank, fell to 5.8%, its lowest level since mid-2022. The drop in wage growth was impressive as the government hiked the minimum wage by 9.8% in April and there were concerns that sharp increase would send wage growth higher.
The job numbers will be a relief for the Bank of England, which needs to see a weaker labor market in order to start lowering rates. There won’t be a rate cut at the next meeting in June due to the national election on July 4th. The markets have fully priced a quarter-point cut by November and the employment report has raised the likelihood of a second cut before the end of the year to 40%, up from 20% on Monday, prior to the employment report.
During the election campaign, BoE policy makers have cancelled all speeches and public appearances, which means there won’t be any feedback from the BoE about today’s inflation report and other key data over the next several weeks.
GBP/USD Technical
- GBP/USD is putting pressure on resistance at 1.2745. Above, there is resistance at 1.2795
- 1.2671 and 1.2621 are providing support
Gold: Bears Taking a Breather ahead of US CPI Data – FOMC Policy Decision
Gold price edged lower in early trading on Tuesday, following Monday’s limited consolidation of nearly 4% drop on Friday.
Near-term outlook remains bearishly aligned after a massive loss last Friday, sparked by strong US jobs data and reports that China’s central bank paused gold purchases in May.
Markets shift focus towards this week’s key events, release of US inflation data and Fed rate decision, both due on Wednesday, with expectations that consumer prices would barely ease, although may cause increased volatility on Wednesday, in case May figure diverges from forecasted levels.
The US central bank does not have much space to maneuver, particularly after much higher May payrolls almost removed expectations for first rate cut in September from the table, with growing signals that the Fed would stay on hold until November.
This will be a negative scenario for gold and would further increase pressure on metal’s price in the near-term, allowing for deeper correction of $1984/$2450 bull-leg.
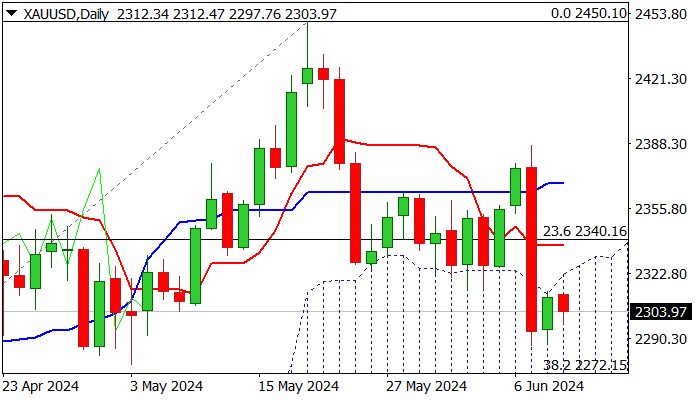
Technical picture on daily chart is weakening, with initial bearish signals generated on penetration and repeated close within thick daily cloud, negative momentum and MA’s (10/20/55) in bearish setup and forming bear-crosses.
However, oversold stochastic on daily chart may produce headwinds to bears, approaching pivotal Fibo support at $2272 (38.2% retracement of $1984/$2450).
Near-term action is likely to stay in extended consolidation and a quiet mode until Wednesday’s releases, ideally to be capped by daily cloud top ($2322) and not to exceed daily Tenkan-sen ($2337) to maintain bearish near-term bias.
Firm break of $2277/72 pivot, to further weaken near-term structure and expose targets at $2228/17 (daily cloud base / 50% retracement).
Conversely, violation of Tenkan-sen line ($2337) would ease bearish pressure, but sustained break above daily Kijun-sen ($2368) required to neutralize bears.
Res: 2322; 2337; 2359; 2368.
Sup: 2286; 2272; 2228; 2217.
Crypto Nosedive
Market Picture
The cryptocurrency market spent Monday in a very narrow range but started Tuesday with a violent sell-off, losing over 2.8% in 24 hours to $2.47 trillion. Bitcoin is retreating at the same pace as the market as a whole, while Ethereum is down 3.5%. Top altcoins are losing between 2% (Cardano) and 6.6% (BNB), and Tron is temporarily standing out from the crowd, adding 0.25%. This wariness of cryptocurrency traders may be a manifestation of the downturn in risk appetite in global markets, which may soon establish itself in the dynamics of equities and commodities.
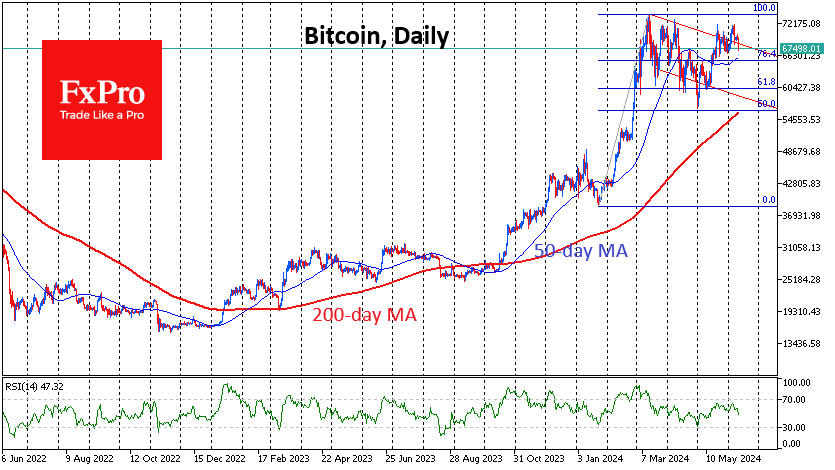
Bitcoin has pulled back to $67.6K, returning to the local lows at the beginning of the month. This decisive move downward indicates that a deeper correction is in store. We can see just how strong the bearish sentiment is by the first cryptocurrency’s momentum near $65K, an intermediate round level near where the 50-day moving average and 76.4% Fibonacci retracement level of the rally from the January lows lie. A quick dip below would force a search for support no sooner than $60K.
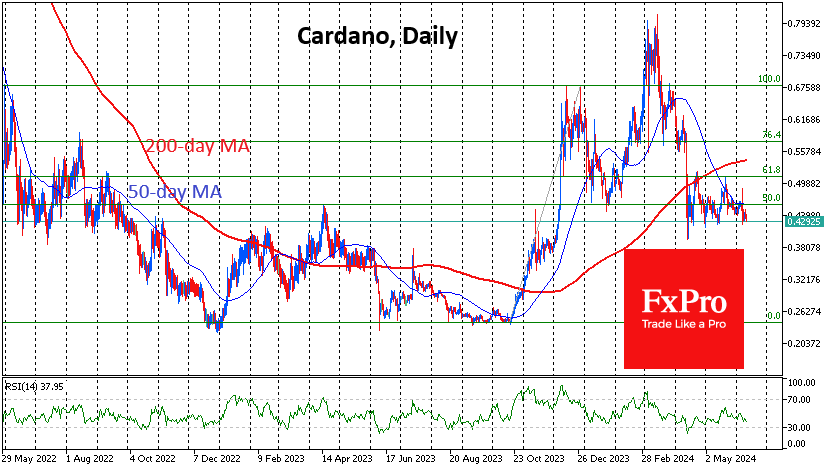
Cardano, whose relative performance is better than its peers, is in a rather vulnerable position in the medium term, testing support for the past two months at $0.43. It is currently trading in the lower half of the range from the October lows, under the 200- and 50-day moving averages. A failure of support potentially opens the way down to $0.38 or even $0.25.
News background
According to CoinShares, crypto fund investments rose by a record $2.038bn last week, after inflows of $185m a week earlier; the figure marks the fifth consecutive week of growth. Bitcoin investments increased by $1.973bn, Ethereum by $69m and Solana by $0.7m.
The total assets under management (AUM) of all spot bitcoin funds is about $61.1bn. In five months, BTC-ETFs have accumulated 60% of the AUM of gold investment products ($105bn) that have been around for more than 20 years.
Weekly trading volumes for the week rose 55% to $12.8bn.
The market recorded a new record high in short hedge fund positions in bitcoin, indicating a significant change in sentiment among investors, according to the financial portal Zerohedge. Bearish hedge fund positions negatively affect the sentiment of other market participants and lead to increased volatility.
According to a study by the Bank of New York Mellon, family wealth managers are willing to allocate about 5% of their investment portfolio to cryptocurrencies. The main factors preventing this are hacker attacks and cybercrime.
The total blocked value of assets (TVL) in the Ethereum-based Tier 2 Base network is over $8bn, surpassing OP Mainnet from the Optimism team. The protocol from Coinbase is now the second largest Ethereum scaling solution, behind only Arbitrum One with $18.27bn.
The team of Notcoin, a Web3 gaming project, reported that its user base has grown to 40 million people. According to the developers’ calculations, players have already earned $1.5 million in TON through 20 campaigns. The team expects this figure to grow tenfold after automating new missions that third-party projects will be able to launch independently.
ECB’s Villeroy downplays month-to-month inflation noises
ECB Governing Council member Francois Villeroy de Galhau highlighted today at a conference that month-to-month inflation data will be volatile due to base effects, particularly related to energy prices.
He cautioned that this "noise" in the data is not very meaningful, and the ECB remains "outlook driven" and will focus more closely on inflation forecasts.
Villeroy expressed confidence that, barring any external shocks, ECB will bring inflation back to its 2% target by next year, achieving this with a "soft rather than a hard landing."
He reiterated the need for a gradual approach to future rate adjustments and emphasized that ECB has "significant leeway" to cut rates before monetary policy becomes restrictive.
GBP/JPY Daily Outlook
Daily Pivots: (S1) 199.22; (P) 199.64; (R1) 200.33; More...
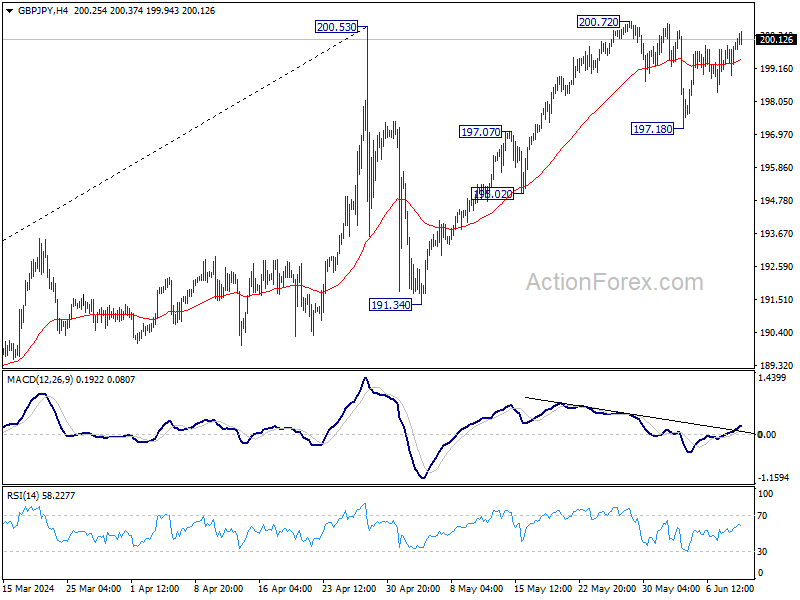
GBP/JPY is staying in range below 200.72 and intraday bias stays neutral. On the downside, break of 197.28 will strengthen the case that rise from 191.34 has completed. Intraday bias will be back on the downside for 195.02 support first. However, decisive break of 200.72 will resume larger uptrend instead.
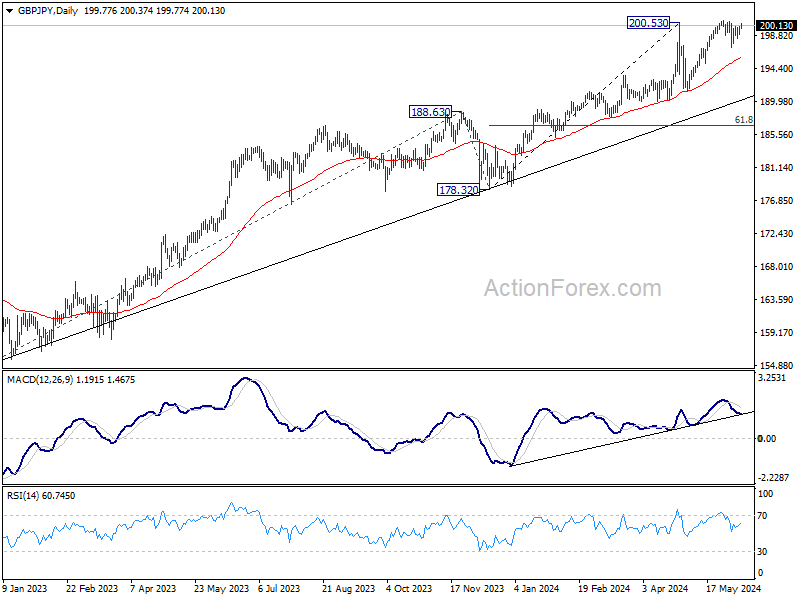
In the bigger picture, as long as 188.63 resistance turned support holds, long term up trend is expected to continue. Sustained trading above 200.53 will pave the way to 100% projection of 155.33 to 188.63 from 178.32 at 211.62.
EUR/JPY Daily Outlook
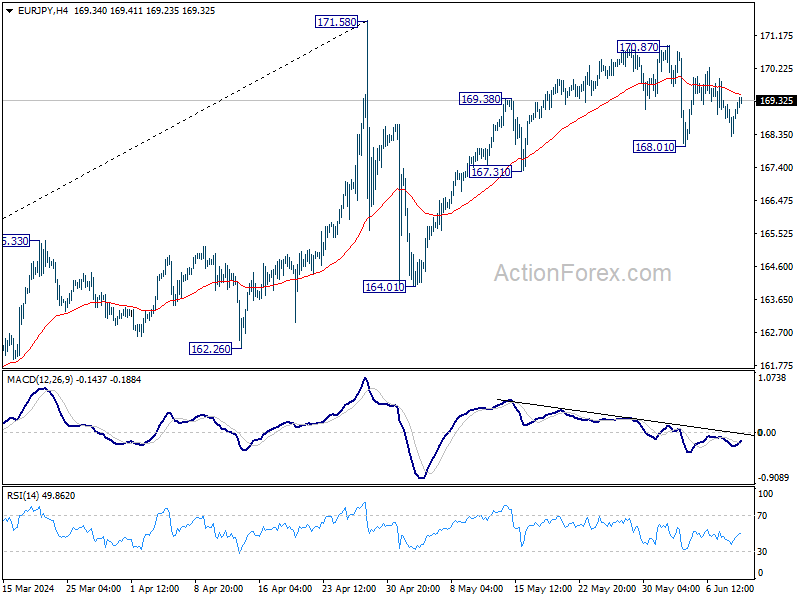
Daily Pivots: (S1) 168.50; (P) 168.86; (R1) 169.42; More...
Range trading continues in EUR/JPY and intraday bias stays neutral. On the downside, break of 168.01 support will strengthen the case that rise from 164.31 has completed at 170.78 already. Intraday bias will be back on the downside for 167.31 support, and then 164.01. Nevertheless, break of 170.87 will resume the rally to retest 171.58 high instead.
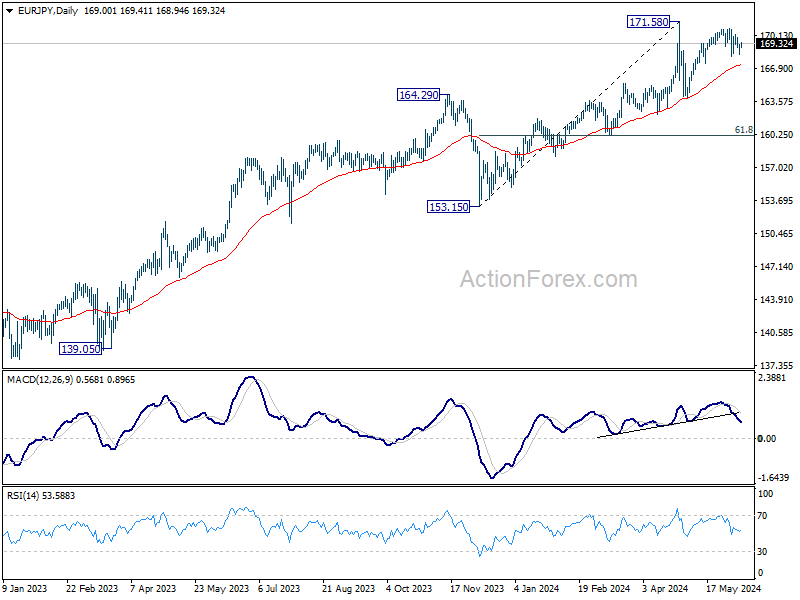
In the bigger picture, a medium top was formed at 171.58 after brief breach of 169.96 (2008 high). But as long as 55 W EMA (now at 159.51) holds, price actions from there is seen as correcting the rise from 153.15 only. That is, larger up trend remains in favor to continue. However, sustained break of 55 W EMA will argue that larger scale correction is underway and target 153.15 support.
EUR/GBP Daily Outlook
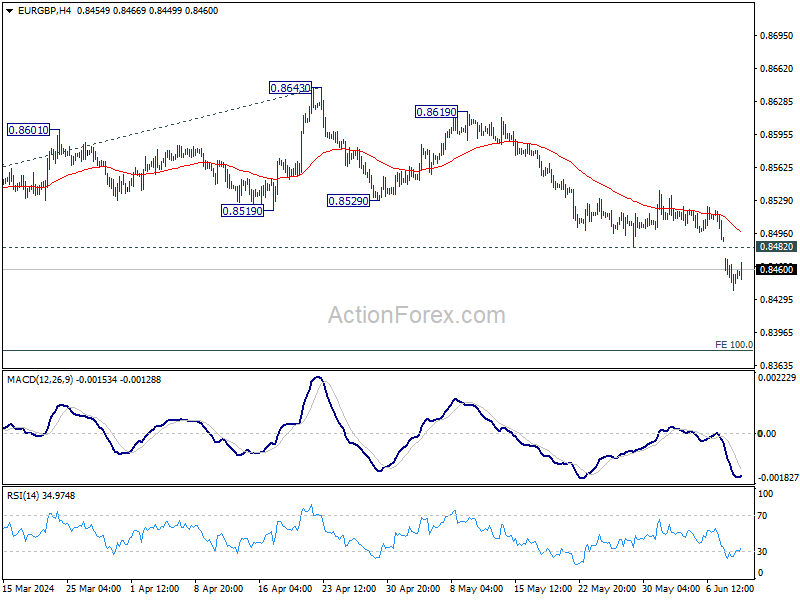
Daily Pivots: (S1) 0.8440; (P) 0.8456; (R1) 0.8472; More...
Intraday bias in EUR/GBP stays on the downside at this point. Current down trend should target 0.8376 projection level next. On the upside, above 0.8482 support turned resistance will turn intraday bias neutral and bring consolidations first, before staging another decline.
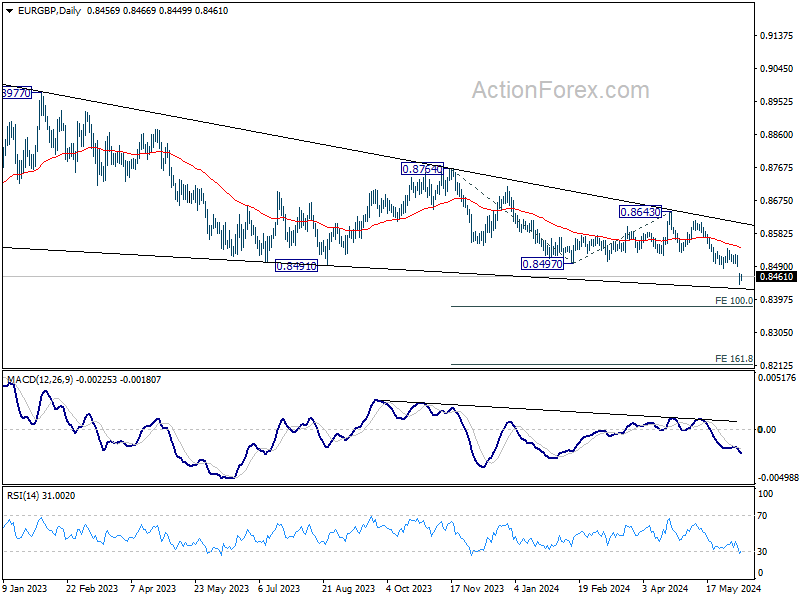
In the bigger picture, down trend from 0.9267 (2022 high is in progress). Next target is 100% projection of 0.8764 to 0.8497 from 0.8643 at 0.8376. Sustained break there will target 161.8% projection at 0.8211 next. For now, outlook will remain bearish as long as 0.8643 resistance holds, even in case of stronger rebound.
EUR/AUD Daily Outlook
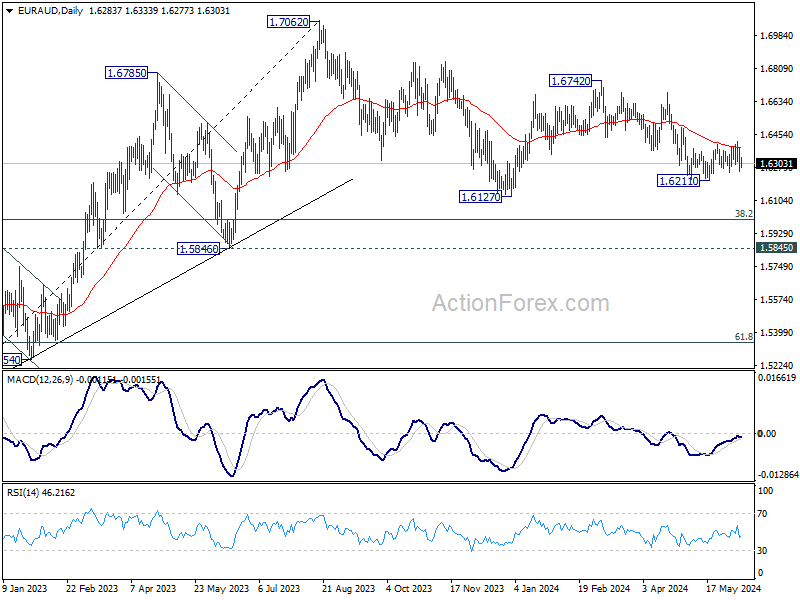
Daily Pivots: (S1) 1.6235; (P) 1.6311; (R1) 1.6362; More...
Intraday bias in EUR/AUD stays neutral as range trading continues. On the downside, firm break of 1.6211 support will resume the whole decline from 1.6742, as the third leg of the correction from 1.7062. On the upside, sustained break of 55 D EMA (now at 1.6381) will resume the rebound from 1.6211 instead.
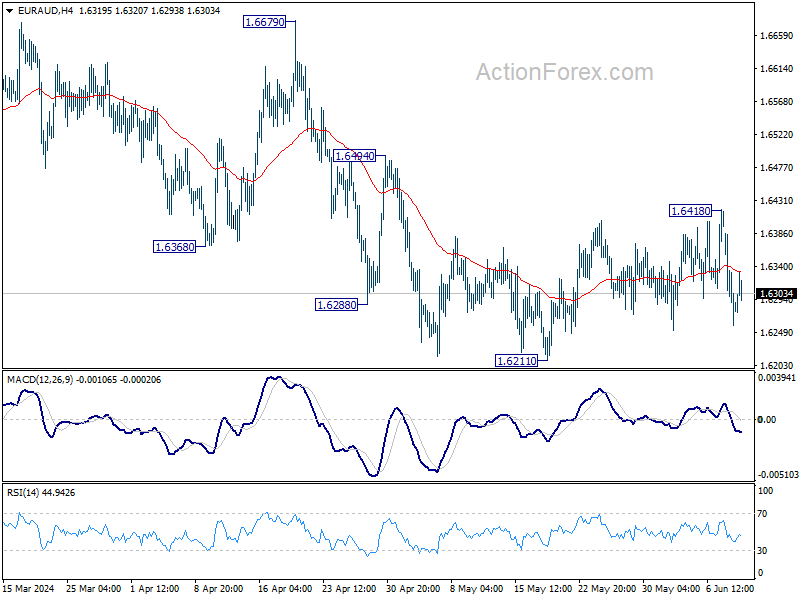
In the bigger picture, fall from 1.7062 medium term top is seen as a correction to the up trend from 1.4281 (2022 low). In case of deeper fall, strong support is expected around 1.5846 and 38.2% retracement of 1.4281 to 1.7062 at 1.6000 to bring rebound. Break of 1.7062 is in favor as a later stage.