Sample Category Title
Bitcoin Recovers, Altcoins Humbly Follow
Market picture
The crypto market is moving upwards, encouraged by Bitcoin’s positive momentum. Total cryptocurrency capitalisation reached $2.44 trillion, up 1.6% in 24 hours and 0.8% in seven days.
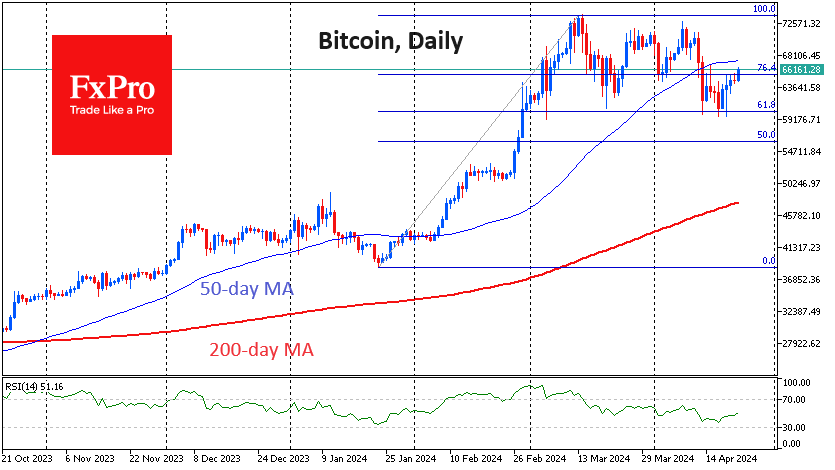
Bitcoin added 1.9% in 24 hours to $66.4K, gradually adding since last Thursday. The price hasn’t moved much in recent days, balancing the positivity from the halving and the negativity from the Nasdaq index’s decline.
Bitcoin is sticking to a classic upside pattern with a 61.8% Fibonacci retracement from the last rally. However, it’s worth remaining cautious until the price breaks above the 50-day moving average, which is now at $67.4K.
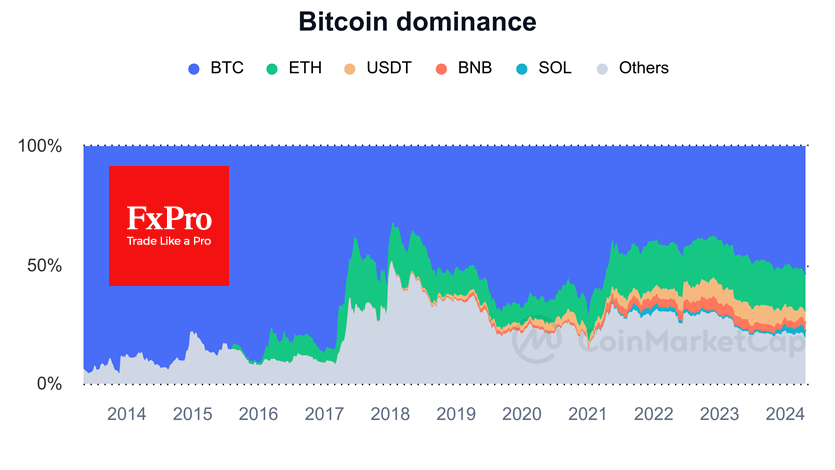
Altcoins are repeating the positive dynamics of the first cryptocurrency, adding since the end of last week. Still, they fell harder a fortnight ago and are recovering very sluggishly so far. As a result, the share of Bitcoin in total cap reached a three-year high near 55%.
News background
On 20 April at 0:10 GMT, the fourth halving in history took place on the Bitcoin network on block #840,000. The ViaBTC mining pool mined the block, and it saw the miners’ reward drop from 6.25 BTC to 3.125 BTC. Commissions in the first block of the BTC network rose sharply to $2.4 million after the halving. The record commission is attributed to user activity in the Runes Protocol.
The first cryptocurrency may enter a “re-accumulation phase” after halving. Then, a “parabolic uptrend” will begin, according to an analyst at Rekt Capital. In his opinion, the movement of BTC now follows the same pattern as in previous post-halving cycles.
In a clarified lawsuit against Tron founder Justin Sun, the SEC said his frequent visits to the United States entitled him to legal action. According to the SEC, San spent more than 380 days in the US between 2017 and 2019.
Ethereum blockchain made a net profit of $365.46 million in the first quarter, up nearly 200% from the previous period’s $123 million, according to The DeFi Report. Total transaction fees reached $1.17bn.
Tether, the issuer of USDT stablecoin, added support for The Open Network (TON) blockchain. Via Telegram, Crypto Bot users can now deposit USDT on the TON blockchain. Withdrawals will appear in the near future. There will be no fees for USDT transactions within Telegram, and users can instantly send the asset to their contacts in the messenger without a wallet address.
Telegram will start rewarding content creators and allow the purchase of goods for cryptocurrency, said Pavel Durov, the messenger’s founder. According to him, Telegram has integrated blockchain at a deep level.
Aussie Slips to 2024 Lows on Geopolitics
It was another rough week for the Aussie, pressured by strong US data, more hawkish Fedspeak and escalating Mideast geopolitical risks.
US data continued to impress with March retail sales (ex-autos and gas) rising 1.0%, materially stronger than expectations for a 0.3% gain. That, and more reserved Fedspeak around rate cut prospects, stressing patience, saw US10yr yields touch 4.69% last week, highs since November 2023. While the resilient US growth story and rising US rates kept the Aussie pressured last week, it was mainly rising Mideast risks that roiled it, at least temporarily.
As reports of an Israeli strike on Iran spread during Asia-Pacific trading on Friday US10yr yields fell more than 10bp at one stage, while Brent crude jumped almost US4/bbl and US equity futures were nursing early losses of around 2%.
Against that backdrop the Aussie slipped from around 0.6425 to new lows for the year at 0.6363. But as it became clear that key Iranian nuclear infrastructure facilities were untouched and Iranian officials were downplaying the event global markets quickly regained their composure.
The Aussie recouped losses and has started the new week back USD0.6400. Oil has also given back all of Friday’s squeeze.
But even as rising global market volatility often leaves the Aussie in the crosshairs it has not been the worst performing G10 currency lately. Month to date the Aussie is down 1.4%, but GBP and JPY have fared worse, with declines exceeding 2% against the USD. The ongoing squeeze in global commodity prices are helping shield the Aussie somewhat on crosses. The LME’s base metals index rose 5.3% last week taking its gains so far in April to 14%.
But volatility can still roil Aussie this week. The Nasdaq fell 5.5% last week and US earnings season kicks into high gear with results from the big tech names a key focus.
The local and global economic data calendars will give participants plenty to chew on too.
Locally, the main focal point will be on Q1 CPI. Analysts see Q1 CPI rising 0.8%, compared to 0.6% in Q4, though base effects will see the annual pace easing to 3.4%, from 4.1%. Westpac’s forecast for the trimmed mean is 0.8% for the quarter, taking the annual pace from 4.2%yr to 3.8%yr, the slowest since March 2022.
Markets do not expect the RBA to cut ahead of the Fed, with a full -25bp RBA cut not priced until December, versus Fed pricing for a September/November start to rate cuts. But a softer than consensus Q1 CPI could galvanise the potential for RBA rate cuts before the Fed.
On the international side, advance Q1 GDP on Thursday and the March monthly PCE deflator on Friday likely underscore the narrative around ongoing resilient US growth trends and the stalling in disinflation.
In the Eurozone, flash April PMIs on Tuesday likely show further recovery green shoots, while Friday’s Bank of Japan meeting and fresh economic projections will be closely scrutinised for any hints around further possible monetary policy adjustments later this year and any commentary around excessive yen weakness.
Event risk
Tuesday
Japan, Eurozone, UK, US S&P prelim Apr manufacturing and services PMIs
Wednesday
Australia Q1 CPI
Thursday
US advance Q1 GDP
Friday
Japan BoJ policy meeting
US Mar PCE deflator
USD/JPY: Keeps Firm Tone and Continues to Trade Near Pivotal 155.00 Barrier
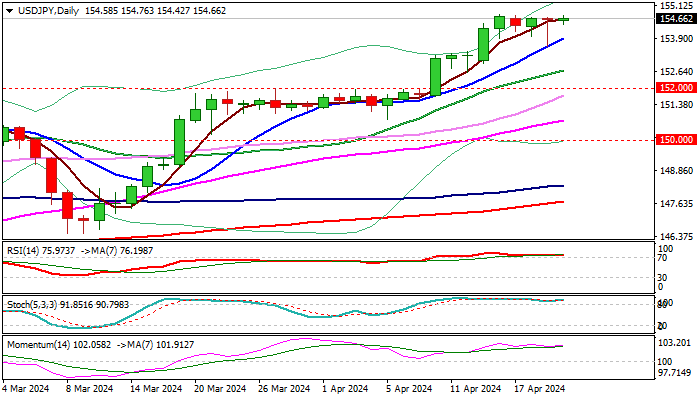
USDJPY keeps firm tone and continues to trade near pivotal 155 barrier, where strong offers cap the action on expectations that Japan’s authorities may intervene at this zone.
Technical picture on daily and weekly chart remains increasingly bullish, with strong positive signal generated on weekly close above important Fibo level at 152.60 (38.2% of larger 277.65/75.55, 1982/2011 downtrend), which would open way for stronger acceleration towards 160 zone (1990 high)., but with major requirement for sustained break of 155.00 trigger.
Rising 10DMA contained last Friday’s spike lower, adding to bullish near-term bias, though overbought conditions and strong headwinds at 155 barrier, warn that price action may stay in extended sideways mode.
Dips should hold above broken 152.60 barrier (reinforced by rising 20DMA) which reverted to strong support, to offer better opportunities to re-join bullish market.
Caution on sustained break below 152.60, which would weaken near-term structure and increase downside risk.
Res: 155.00; 155.77; 156.36; 157.73.
Sup: 154.42; 153.87; 152.60; 152.00.
Bitcoin Price Bullish after Halving-2024
On April 19, 2024, a halving occurred in the Bitcoin network, resulting in the reward for the mined block amounting to 3.125 BTC.
Historically, after the halving (which is associated with a reduction in supply), the price of Bitcoin heads to all-time highs. But, as Forbes reports, Goldman Sachs analysts warn against extrapolating the results of Bitcoin price movements after past halvings to the current moment. After all, back then, the halvings occurred during a period of loose monetary policy by the Federal Reserve, while this time the Fed is struggling with harsher-than-expected inflation.
JPMorgan analysts led by Nikolaos Panigirtzoglou are also cautious. “We do not expect Bitcoin price increases post halving as it has been already priced in,” they wrote.
However, this morning Bitcoin is trading above USD 66,000, the highest price in a week. Adding to the market's positivity are rumors that the Securities and Futures Commission (SFC) in Hong Kong is going to approve spot applications for Bitcoin ETFs.
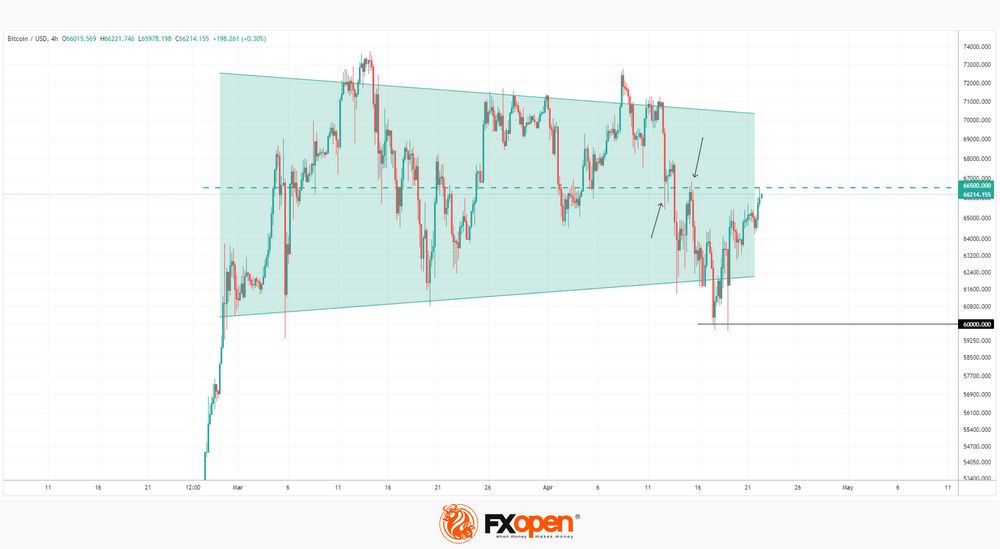
Technical analysis of the BTC/USD chart shows that:
→ Bitcoin price made a double false breakout of the psychological level of USD 60,000 last week – April 17 and 18;
→ after this maneuver, the Bitcoin price confidently recovered into the consolidation zone, shown by a narrowing green triangle;
→ Bitcoin price today may be affected by the USD 66,500 level, which is the central axis of the consolidation zone, as well as the former support level (as shown by the arrows);
What about the longer term? The demand activity seen around the USD 60,000 level can be interpreted as a stable interest in the main cryptocurrency on the part of investors, which may ultimately lead to an attempt by the Bitcoin price to attack the USD 70,000 level near the upper border of the consolidation zone.
FXOpen offers the world's most popular cryptocurrency CFDs*, including Bitcoin and Ethereum. Floating spreads, 1:2 leverage — at your service. Open your trading account now or learn more about crypto CFD trading with FXOpen.
*At FXOpen UK and FXOpen AU, Cryptocurrency CFDs are only available for trading by those clients categorised as Professional clients under FCA Rules and Professional clients under ASIC Rules respectively. They are not available for trading by Retail clients.
This article represents the opinion of the Companies operating under the FXOpen brand only. It is not to be construed as an offer, solicitation, or recommendation with respect to products and services provided by the Companies operating under the FXOpen brand, nor is it to be considered financial advice.
EURUSD Consolidates after Decline Pauses
- EURUSD drops to a fresh 5-month low before paring some losses
- Oscillators suggest that risks remain tilted to the downside
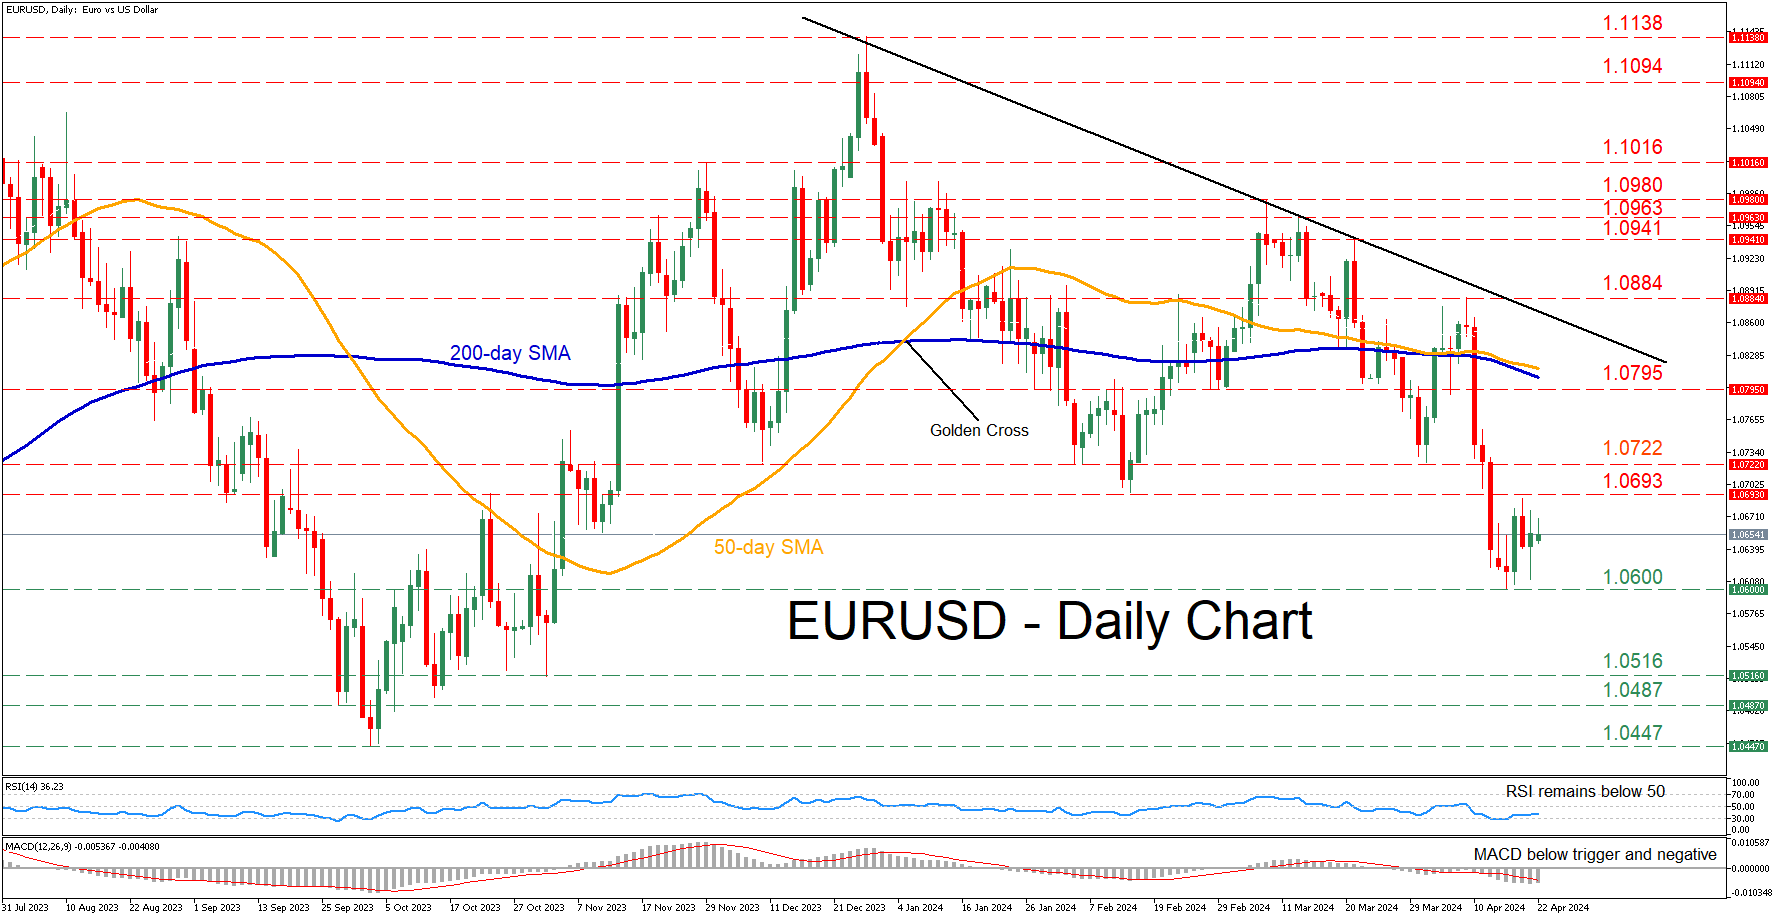
EURUSD came under severe selling pressure in the aftermath of a hotter-than-expected inflation report on April 10, violating its 2024 low of 1.0693. Although the pair managed to find its footing at the five-month bottom of 1.0600, it has so far failed to stage a significant recovery.
Should downside pressures persist, the pair might revisit its recent five-month low of 1.0600. Sliding beneath that floor, the price could test the October-November support of 1.0516. Even lower, the September support of 1.0487 may provide downside protection.
On the flipside, bullish actions might meet initial resistance at the crucial 2024 support zones of 1.0693 and 1.0722. Conquering this barricade, the bulls could attack 1.0795, a region that acted both as support and resistance throughout 2024. A violation of that hurdle could set the stage for the September high of 1.0884.
In brief, EURUSD has been rangebound in the last few sessions, but the momentum indicators are suggesting that the bears remain in control. Meanwhile, the completion of a death cross between its 50- and 200-day simple moving averages (SMAs) could potentially trigger a new round of weakness.
EURJPY Rallies Ahead of Key Market Events
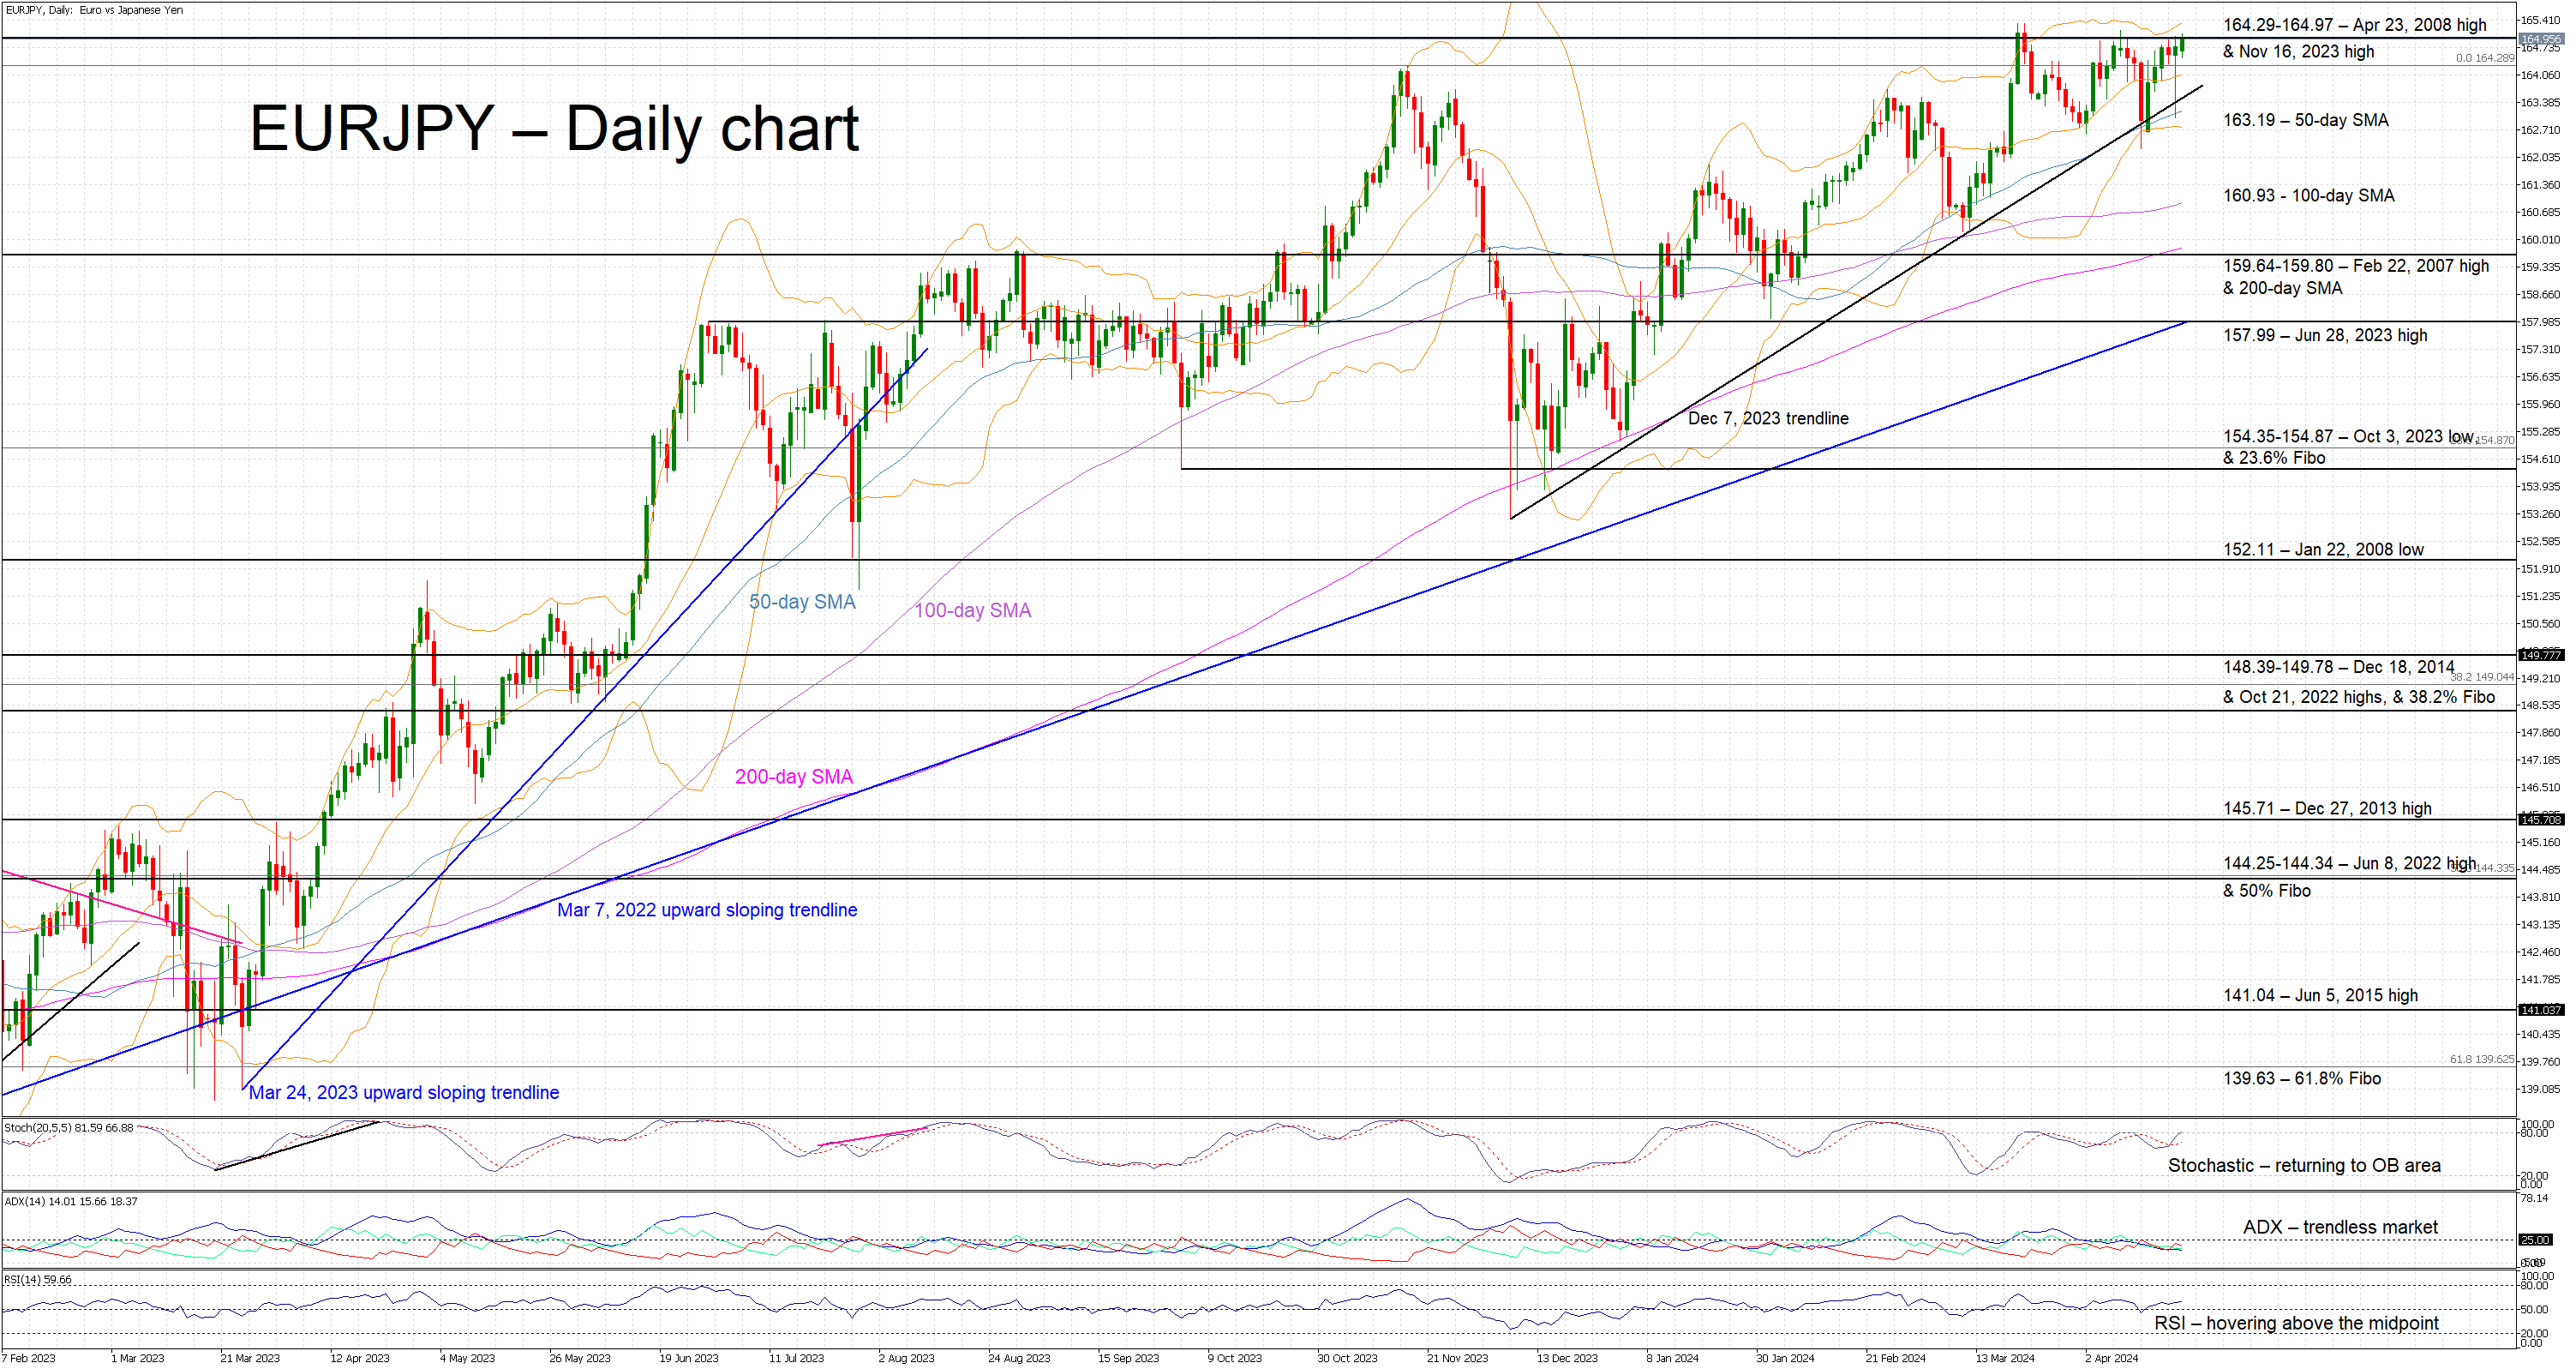
- EURJPY is preparing to test the recent 165.34 high
- The growing intervention threat is limiting the aggressive bullish appetite
- Momentum indicators maintain some degree of bullish tendency
EURJPY is edging higher today with the bulls apparently preparing to challenge the recent 165.34 high following another false attempt by the bears to push this pair below the December 7, 2023 ascending trendline. The continued verbal commentary from Japanese officials, the countdown to this week’s BoJ meeting and the dovish commentary from ECB members are keeping the door open to more volatile sessions ahead, as made evident by the tightening Bollinger bands.
In the meantime, momentum indicators still show a bullish tendency. Specifically, the RSI continues to hover tentatively above its midpoint and, more importantly, the stochastic oscillator is trying to rejoin its overbought territory. However, the Average Directional Movement Index (ADX) remains stuck far below its 25-threshold and thus signals a trendless market.
Should the bulls ignore the intervention threat, they would aim to push EURJPY comfortably above the 165.34 high. They could then gradually try to lead EURJPY towards the July 13, 2007 high at 168.93.
On the other hand, the bears are desperate to recoup part of their significant losses. They could attempt to push EURJPY back below the 164.29-164.97 area and then test the support set by the various simple moving averages employed at 163.19 (50-day SMA) and 160.93 (100-day SMA). If successful, they could then try their luck and determination against the busier 159.64-159.80 range.
To sum up, EURJPY bulls are trying to record a new higher high but the heightened intervention threat and the upcoming BoJ gathering are keeping them on their toes.
GBP/JPY Daily Outlook
Daily Pivots: (S1) 190.16; (P) 191.44; (R1) 192.58; More..
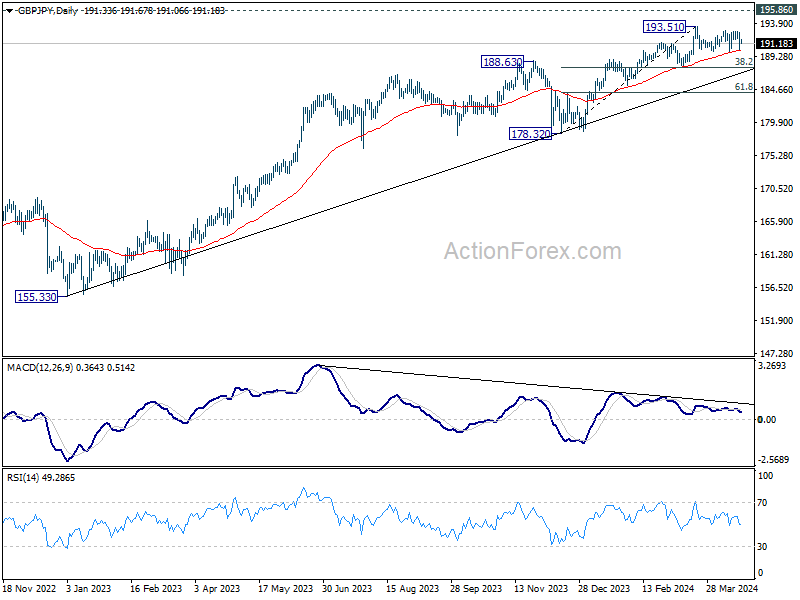
Intraday bias in GBP/JPY remains neutral as consolidations from 193.51 could extend further. On the upside, firm break of 193.51 will resume larger up trend to 195.86 long term resistance. Nevertheless, decisive break of 190.02 will indicate that it's at least correcting the rise from 178.32, and target 38.2% retracement of 178.32 to 193.51 at 187.70.
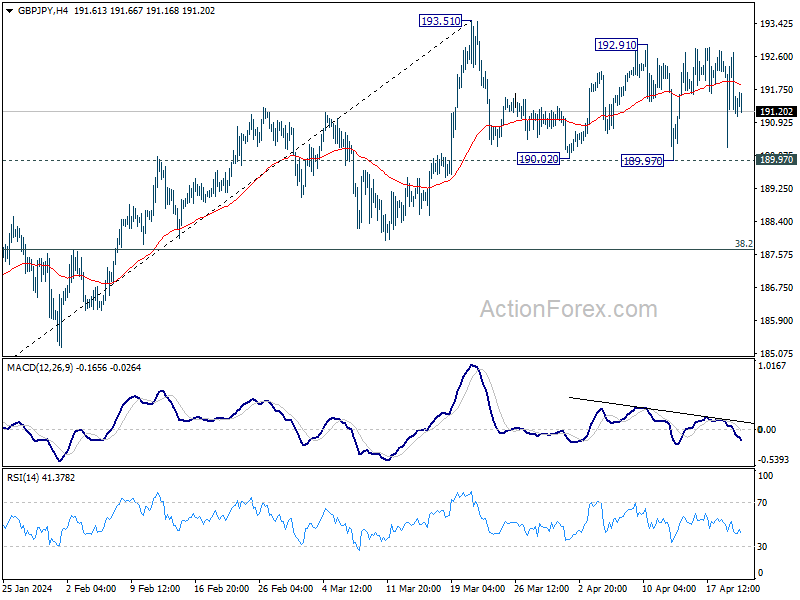
In the bigger picture, current rally is part of the up trend from 123.94 (2020 low), and is in progress for 195.86 long term resistance (2015 high). Break of 187.94 support is needed to be the first sign of medium term topping. Otherwise, outlook will remain bullish in case of retreat.
EUR/JPY Daily Outlook
Daily Pivots: (S1) 163.51; (P) 164.27; (R1) 165.52; More...
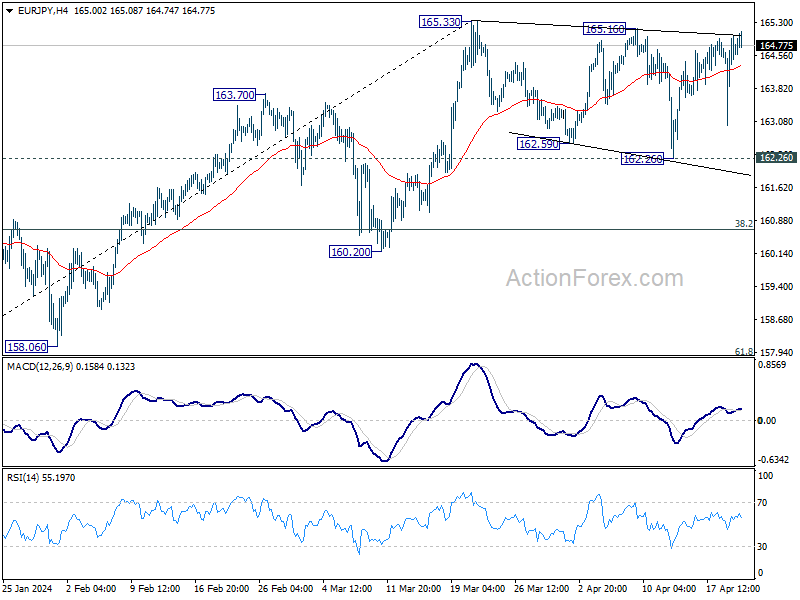
Intraday bias in EUR/JPY stays neutral for the moment. Consolidation from 165.33 could extend further. On the upside, firm break of 165.33 will resume larger up trend towards 169.96 key resistance next. However, decisive break of 162.59 will argue that it's at least correcting the rise from 153.15, and target 38.2% retracement of 153.15 to 165.33 at 160.67.
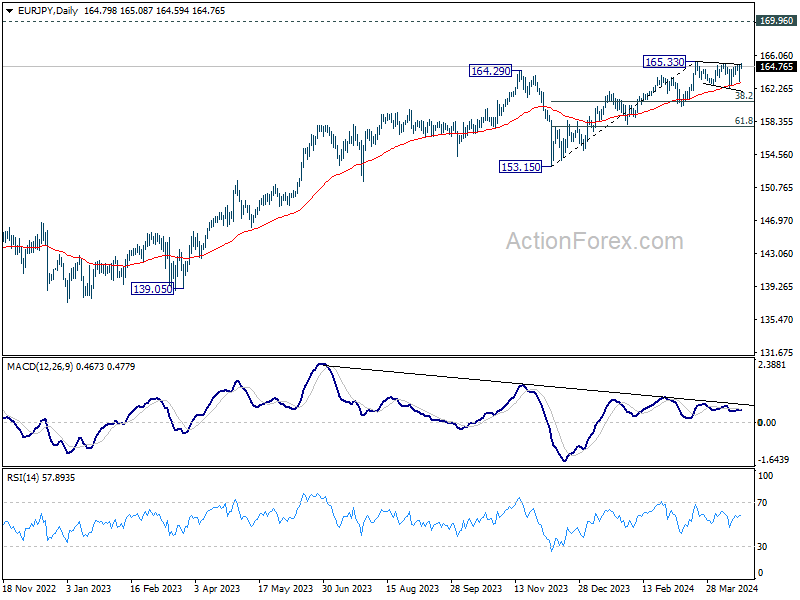
In the bigger picture, current rally is part of the up trend from 114.42 (2020 low), which is still in progress. Next target is 169.96 (2008 high). Break of 160.20 support is needed to be the first sign of medium term topping. Otherwise, outlook will stay bullish in case of retreat.
EUR/GBP Daily Outlook
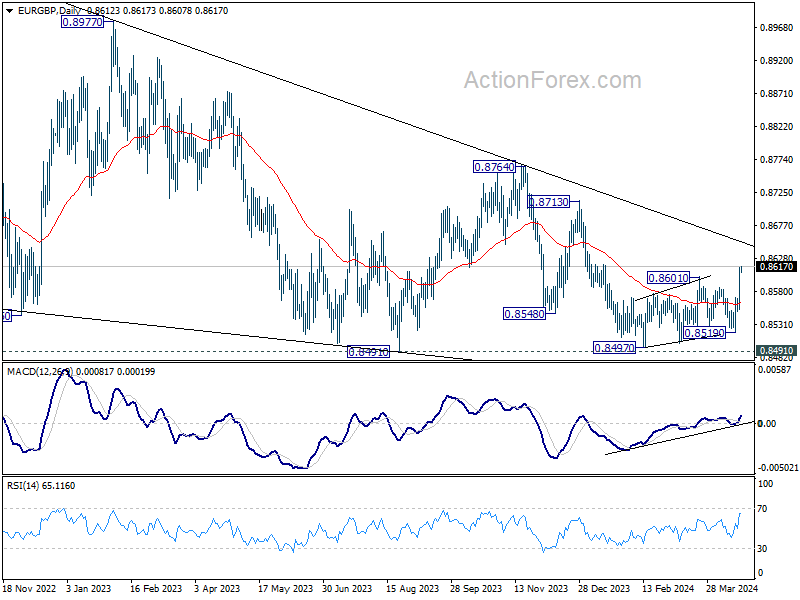
Daily Pivots: (S1) 0.8569; (P) 0.8593; (R1) 0.8637; More...
Intraday bias in EUR/GBP remains on the upside at this point. Fall from 0.8764 has probably completed already. Further rally would be seen to medium term trend line resistance (now at 0.8650). On the downside, below 0.8596 minor resistance will turn intraday bias neutral again first.
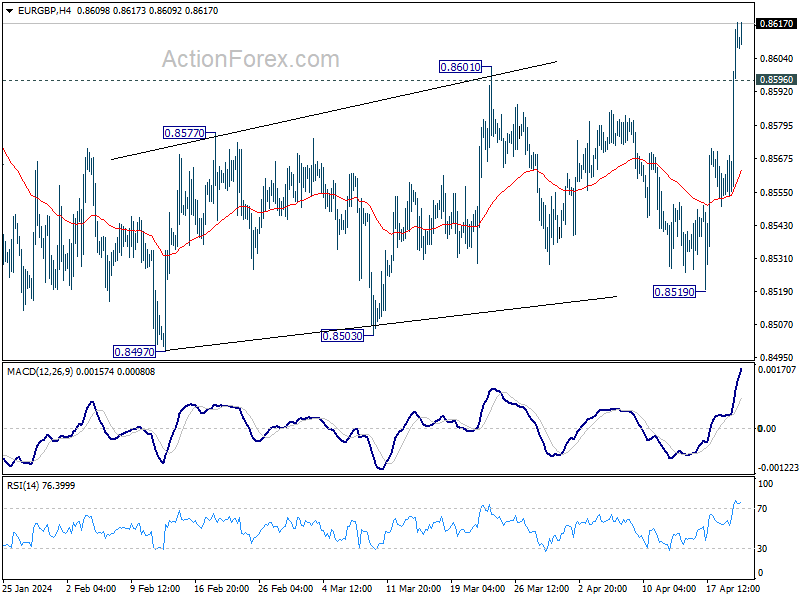
In the bigger picture, outlook is mixed up by current strong rebound. On the upside, sustained break of the trend medium term trend resistance will argue that the down trend from 0.9267 (2022 high) has completed as a triangle pattern. Further rise should then be seen through 0.8764 resistance next. However, rejection by the trend line will retain medium term bearishness for another fall through 0.8491 at a later stage.
EUR/AUD Daily Outlook
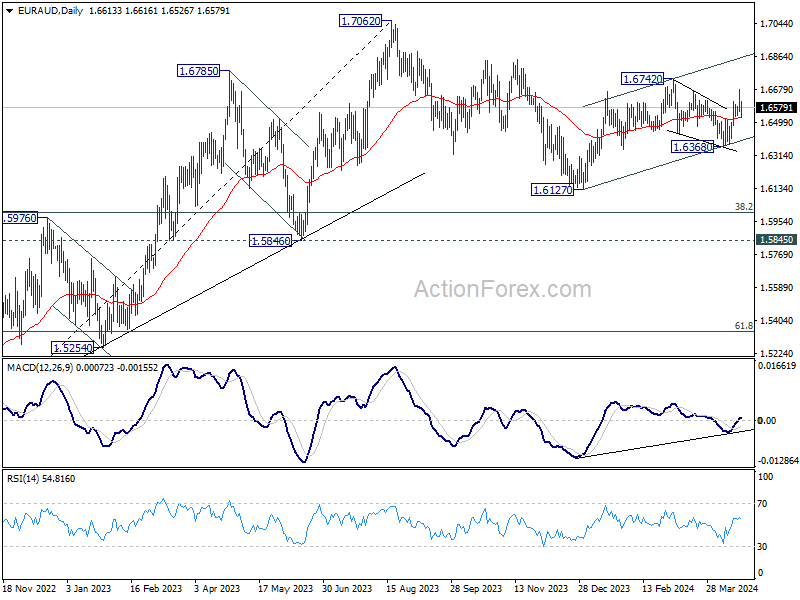
Daily Pivots: (S1) 1.6551; (P) 1.6616; (R1) 1.6672; More...
Intraday bias in EUR/AUD is turned neutral again with current retreat. But further rally will remain mildly in favor as long as 1.6368 support holds. Corrective fall from 1.6742 could have completed with three waves down to 1.6368. Above 1.6678 will target a retest on 1.6742 resistance next.
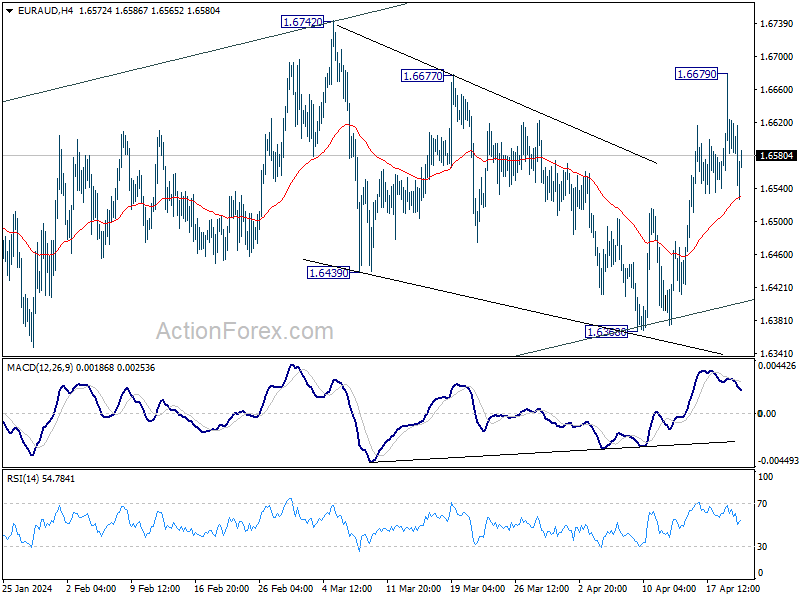
In the bigger picture, fall from 1.7062 medium term top is seen as a correction to the up trend from 1.4281 (2022 low). In case of another fall, strong support is expected around 1.5846 and 38.2% retracement of 1.4281 to 1.7062 at 1.6000 to bring rebound. Break of 1.7062 is in favor as a later stage.