Sample Category Title
GBP/USD Dips After Weak Employment Data
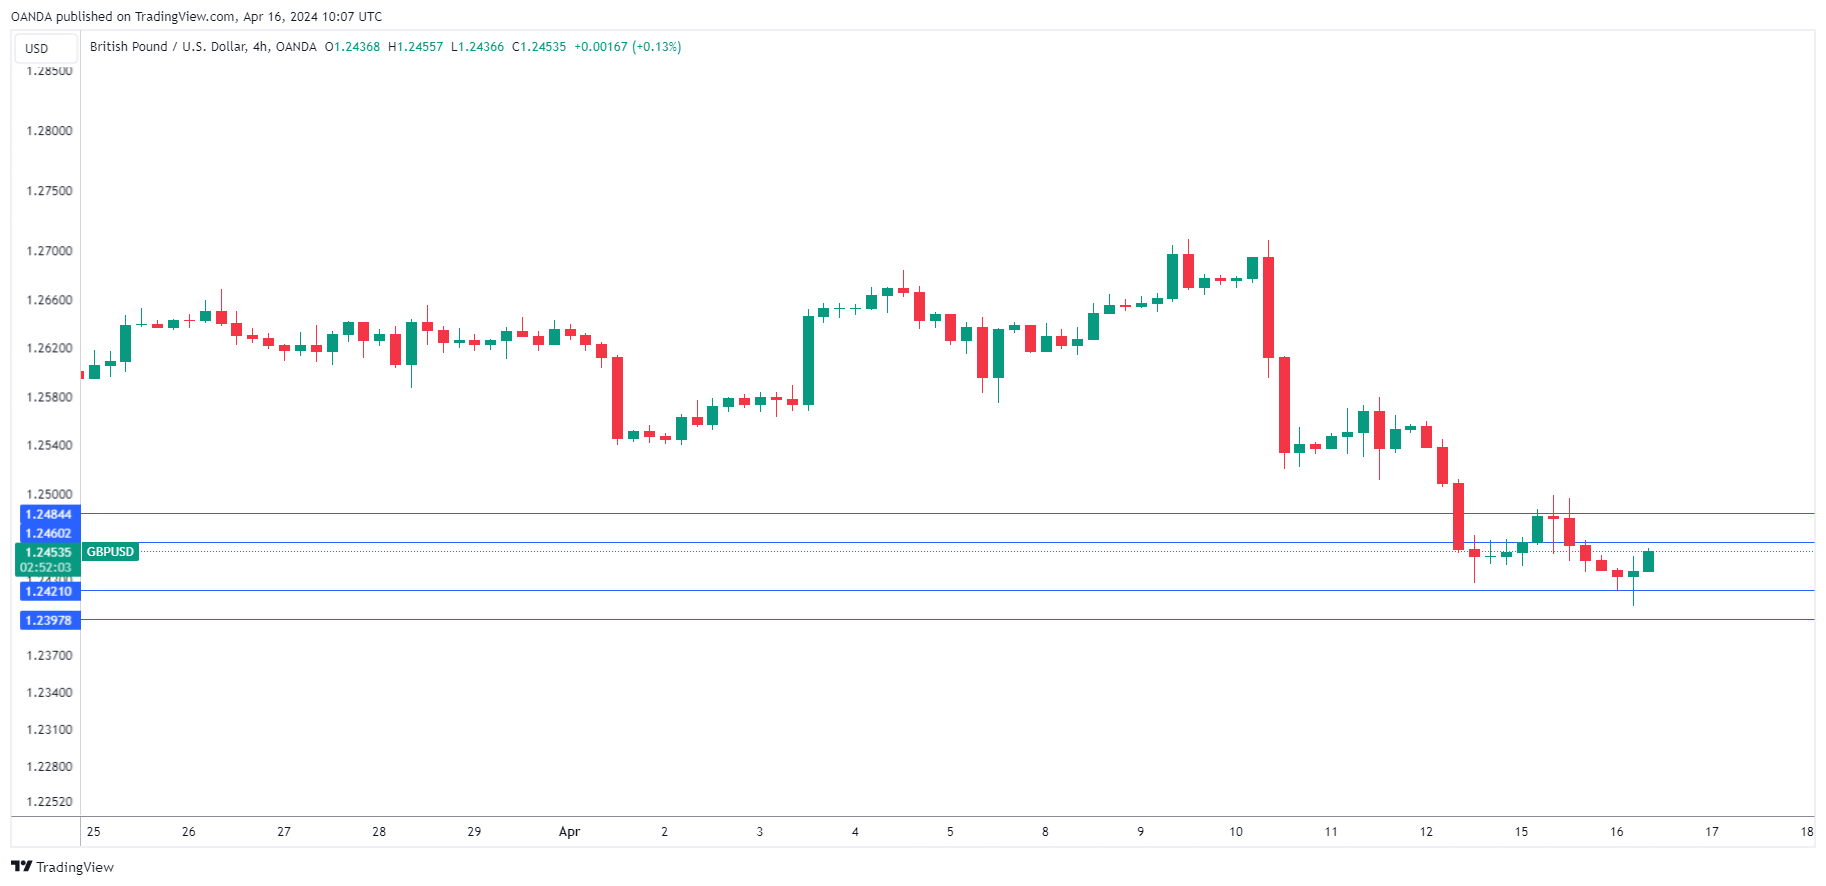
The British pound dropped 0.30% after today’s UK employment report but has recovered most of these losses. In the European session, GBP/USD is trading at 1.2452, up 0.05%.
UK job growth slides, unemployment rises
The UK employment report was weaker than expected. Job growth took a hard hit in the three months to February as the economy shed 156,000 jobs, following a 21,000 decline in the previous period. The market forecast of 110,000 new jobs was nowhere near the mark. As well, the unemployment rate rose to 4.2% in the three months to February, up from 4% in the period through January, the highest level since mid-2023.
The soft job numbers show that the labor market has cooled down due to the Bank of England’s prolonged rate policy of “higher for longer”, which has kept the cash rate of 5.25%. However, the employment report also indicated that pay growth remains stubbornly high, as it ticked lower to 6.0% in the three months to February, compared to 6.1% in the previous period.
This puts the BoE in a bind, as the labor market is cooling but wage growth, a driver of inflation, remains sticky. The BoE is under pressure to help provide relief to the private sector by lowering rates but is concerned that inflation could rebound if it moves to early.
The markets expect the BoE to pause at the May meeting with June a possible date for a first rate cut. The BoE decision will be dependent on the data and Wednesday’s inflation report will be part of that decision. Inflation is expected to have dropped to 3.1% y/y in March, down from 3.4% in February.
GBP/USD Technical
- GBP/USD tested support at 1.2421 earlier. Below, there is support at 1.2397
- There is resistance at 1.2460 and 1.2484
EUR/USD: Limited Consolidation to Precede Fresh Push Lower
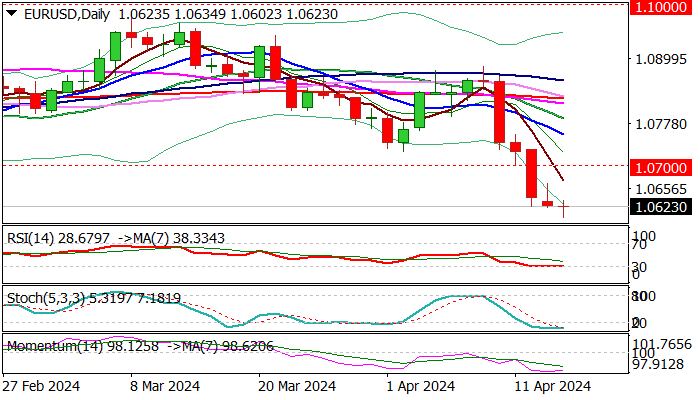
EURUSD edges higher from new 5 ½ month low 1.0602) on Tuesday, as strongly oversold daily studies prompted profit-taking.
Near-term sentiment turned fully bearish, and the action weighed by a large weekly bearish candle (the par was down 1.8% last week).
Upticks should provide better selling levels, with solid barriers at 1.0700 zone (former low of Feb 14 / psychological / Fibo 38.2% of 1.0885/1.0602 bear-leg) to ideally cap.
Violation of pivots at 1.0600 zone (fresh low / Fibo 38.2% of 1.0052/1.1275 rally) to open way for test of weekly cloud base (1.0502) and Oct 13 low (1.0495).
Res: 1.0665; 1.0695; 1.0710; 1.0743.
Sup: 1.0602; 1.0516; 1.0495; 1.0448.
German ZEW jumps to 42.9, euro’s depreciation helps
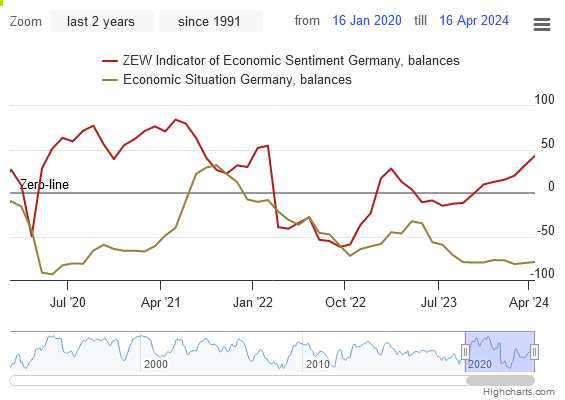
German ZEW Economic Sentiment jumped from 31.7 to 42.9 in April, well above expectation of 35.1, and marks the highest level since March 2022. But Current Situation Index improved just slightly from -80.5 to -79.2.
Eurozone ZEW Economic Sentiment also surged from 33.5 to 43.9, above expectation of 37.2. Current Situation Index climbed 6.0 pts to -48.8.
ZEW President Achim Wambach noted, "A recovering global economy is boosting expectations for Germany, with half of the respondents anticipating the country's economy to pick up over the next six months."
This optimism is largely driven by improved assessments of the economic situations in Germany's major export destinations. The positive outlook is further buoyed by the expected "appreciation of the US dollar against the euro", which could benefit Eurozone exporters by making their goods more competitive in international markets.
NZD Hits Five-Month Low Against Strong US Dollar
The New Zealand dollar has plummeted to a five-month low, with the NZD/USD pair touching the 0.5890 mark. This decline was triggered by the release of robust American retail sales data, which raised concerns that the Federal Reserve might delay interest rate cuts expected in 2024.
The prevailing expectation in the stock market is that the Fed will begin its monetary policy easing cycle in September, diverging from the earlier forecast of June. This expectation adjustment has bolstered the US dollar's position, exerting additional pressure on other currencies.
The Reserve Bank of New Zealand (RBNZ) has maintained its interest rate steady for six consecutive meetings, including a neutral stance in its April meeting. The central bank's primary objectives are alleviating production capacity pressures and mitigating inflation's economic impact. Despite signs of weakening economic activity, New Zealand's annual inflation rate dropped to 4.7% in the quarter ending December – the lowest since Q2 2021. However, inflation remains significantly above the RBNZ's 1-3% target range.
There are indications that the New Zealand economy entered a technical recession in Q3 2023, with more recent data still awaited.
Technical analysis of NZD/USD
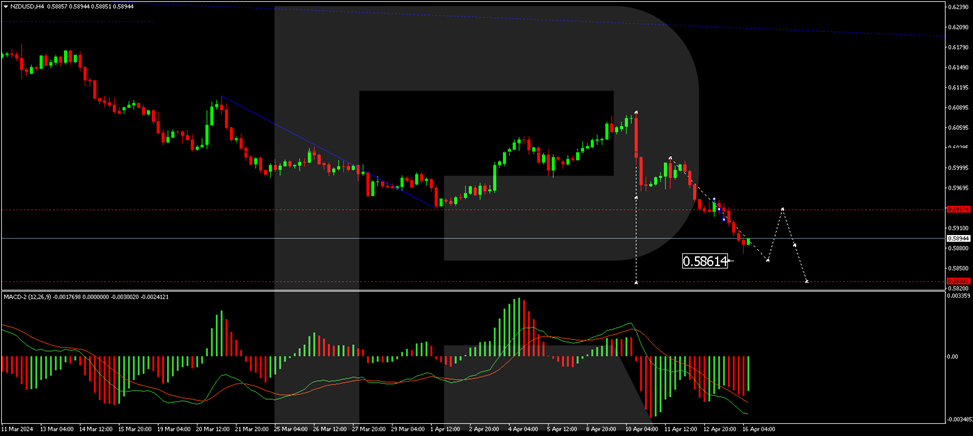
The H4 chart of NZD/USD shows that a consolidation range was established around the 0.5937 level, followed by a downward move to 0.5872. A corrective move back to 0.5900 is possible (testing from below), after which a further decline to 0.5830 is anticipated. This bearish scenario is supported by the MACD indicator, with its signal line positioned below zero and pointing downwards.
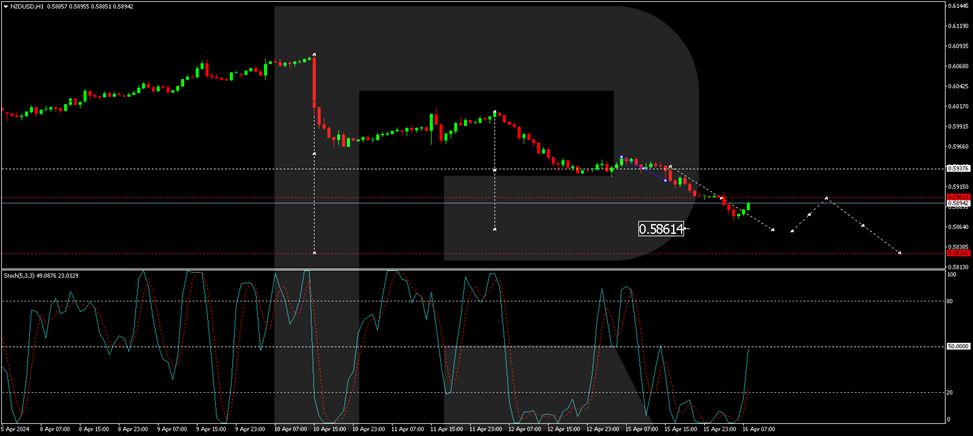
On the H1 chart, the NZD/USD pair continues its downward trajectory towards 0.5854. After completing the decline to 0.5872, a corrective movement to 0.5900 is likely. Subsequently, a new downward phase could target 0.5854, potentially extending towards 0.5830. This outlook is confirmed by the Stochastic oscillator, currently below 20, with an expected rise to 50, indicating the potential for a temporary corrective upswing before continuing the downward trend.
GBPUSD Pulls Back into the Negative Zone
- GBPUSD inches down to a new five-month low
- An extension below 1.2400 could generate fresh selling interest
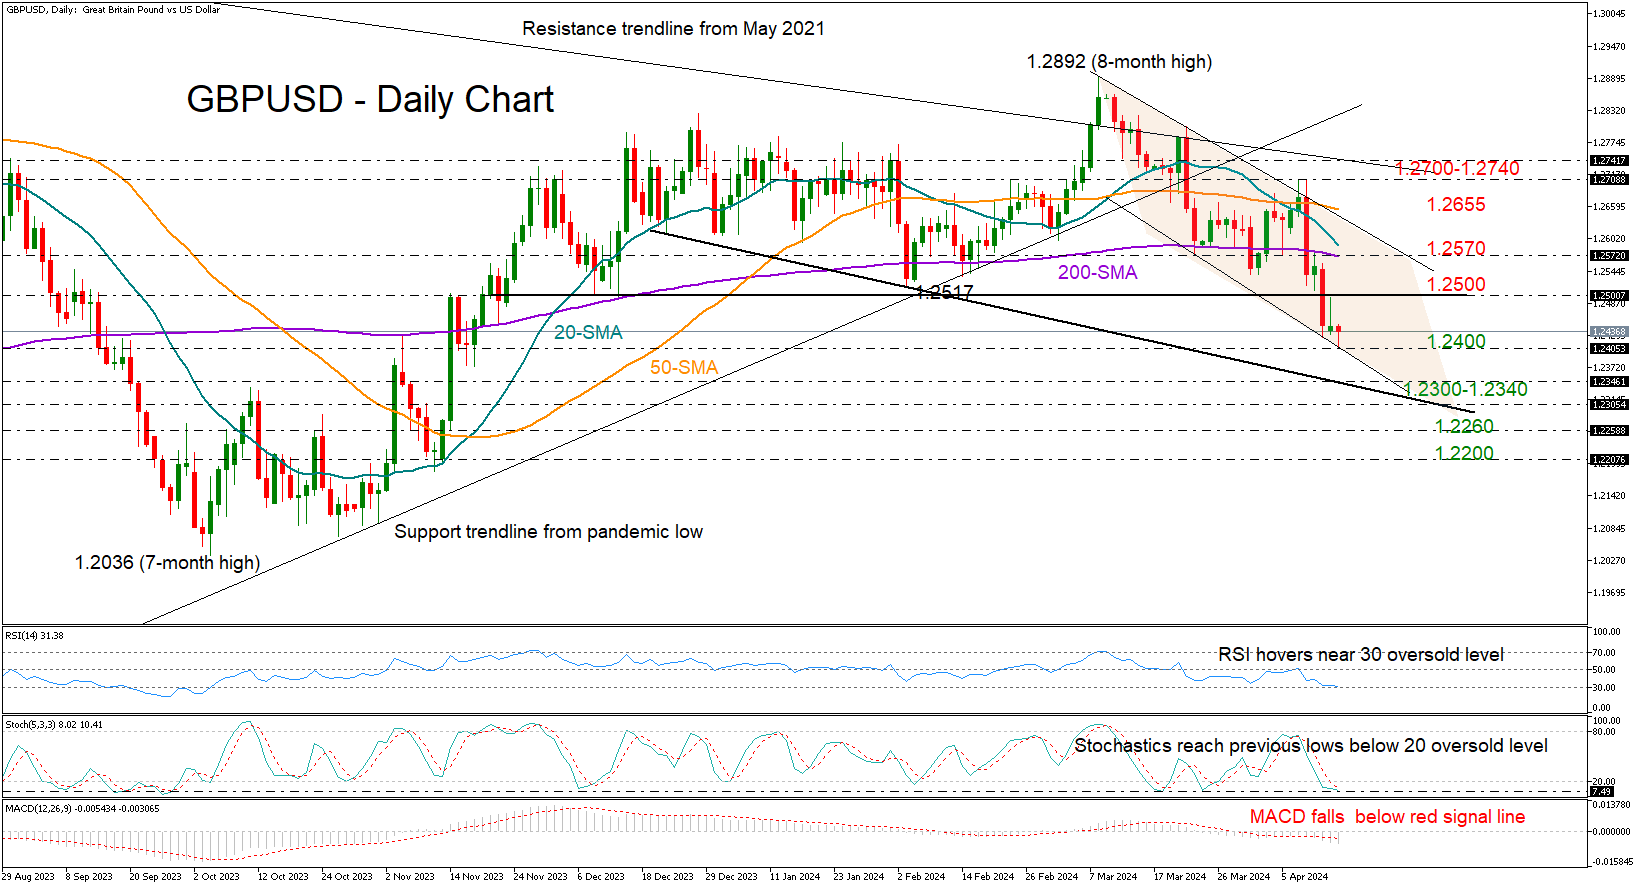
GBPUSD tried to breach the psychological barrier at 1.2500 and re-establish itself within the 1.2488-1.2892 range. But its efforts proved unsuccessful, with the pair charting a new lower low of 1.2405 during Tuesday’s early trading hours – the lowest level since November 2023.
The bears might take a breather soon as the stochastic oscillator has reached its previous support area below 20, and the RSI is hovering around the 30 oversold level, suggesting the bulls could be on their way.
However, the short-term outlook will remain negative until the price runs sustainably above the downward-sloping channel and the 50-day SMA at 1.2655. Discouragingly, the weakening SMAs and the narrowing gap between the 20- and 200-day SMAs are currently dampening hopes for a bullish trend reversal. Nonetheless, if the bulls succeed in taking charge above 1.2655, the spotlight will shift to the 1.2700-1.2740 level. Another victory there is expected to result in a test near the broken support trendline from the pandemic low near 1.2820.
If selling forces persist, the pair could tumble towards the tentative support line at 1.2340, while a steeper decline could even challenge the 1.2300 round level. A continuation lower could then examine the former constraining region of 1.2260 ahead of the 1.2200 psychological mark.
In summary, the rejection near the 1.2500 number on Tuesday suggested the bearish wave has yet to bottom out. While some consolidation cannot be excluded, a close below 1.2400 could clear the way towards 1.2340.
Frightened Crypto Market Chooses a Path
Market picture
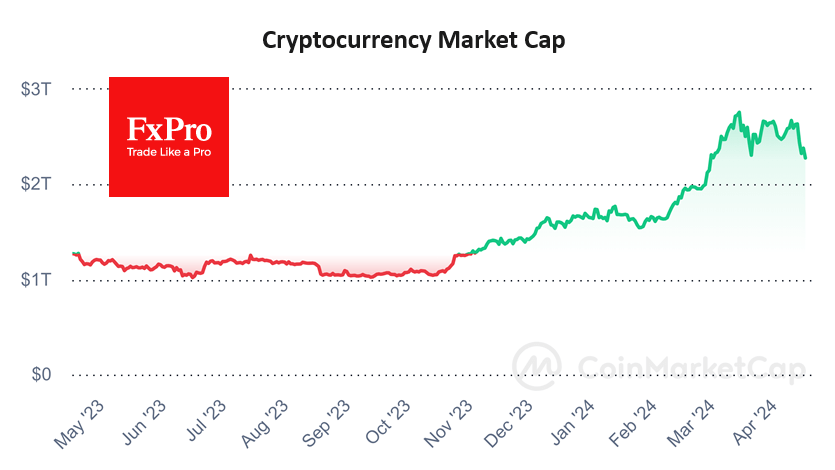
The sell-off in US stock markets affected global risk appetite late on Monday, reversing initial positivity. As a result, crypto market capitalisation fell 5.4% in 24 hours to 2.29 trillion, back near the weekend lows. The market is hovering near the lows of March. This is a key moment in choosing the market’s direction for the coming weeks. A bounce out of this area will allow for the expectation of an early recovery to the recent highs. A dip below would likely trigger a broader liquidation of positions.
Bitcoin has returned to the area of the lows of the past seven weeks, coinciding with the 61.8% retracement level of the rally from the January lows. Like the crypto market, Bitcoin is choosing between a loosely controlled deepening of the decline or a reversal to growth. On the negative side, the 50-day moving average triggered resistance on Monday.
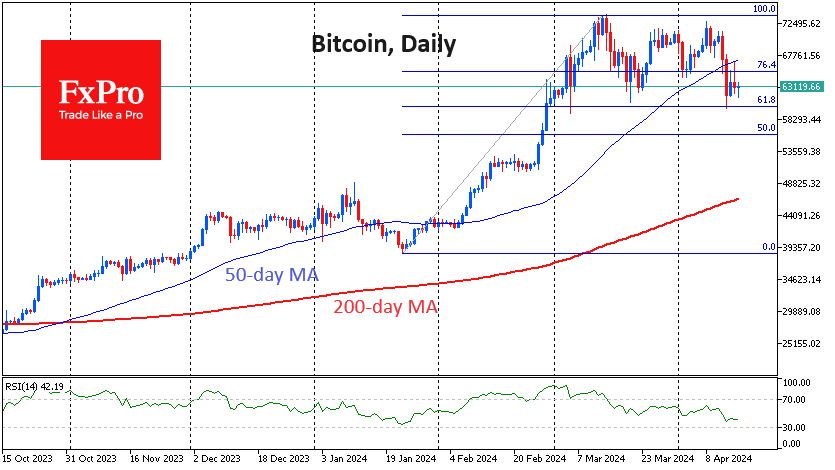
According to CoinShares, crypto fund investments fell by $126 million last week after inflows of $646 million a week earlier; the small outflow came after two weeks of growth in the index. Bitcoin investments decreased by $110 million, Ethereum – by $29 million, and Solana – by $4 million.
News background
If Bitcoin falls below short-term holders’ support at $58,900, the market risks going into a bearish phase, said analyst and CMCC Crest co-founder Willie Wu. He noted that almost every cycle prior to halving has seen a bear phase due to the ‘overaccumulation’ of the first cryptocurrency.
As a result of the Bitcoin halving, only 20 per cent of the world’s mining companies will be able to maintain their revenues at levels comparable to the previous period, TheMinerMag calculated. As a result, the mining industry could lose around $10 billion a year of revenue.
After the halving, miners could potentially liquidate $5bn worth of Bitcoin inventory, putting pressure on the price, 10x Research warned. The overhang of this sell-off could last four to six months.
The Hong Kong Securities and Futures Commission (SFC) has approved applications to launch spot bitcoin and Ethereum-ETFs. Matrixport estimates that demand for Bitcoin-ETFs in Hong Kong will reach $25bn.
Bitcoin mining companies will try to mine the first block that appears after the halving to get an ‘epic’ satoshi with an estimated value of several million dollars, CoinDesk reported.
XAU/USD Gold Price Reaches an Important Resistance Zone
The XAU/USD gold chart today indicates that the historical record price of the metal is above USD 2,400 per ounce.
In addition to fears of a new round of inflation due to rising commodity prices, geopolitical tensions are seen as the most important reason for the growth. At the moment, there are both active military conflicts on the planet (Ukraine, Israel-Iran), and there is a threat of creating new ones (Taiwan, for example). The US national debt and upcoming elections may also act as a destabilizing factor.
Therefore, gold acts as a traditional safe-haven asset. According to Goldman Sachs analysts, gold is in an “unshakable bull market”, so they raised their gold price forecast from USD 2,300 to USD 2,700.
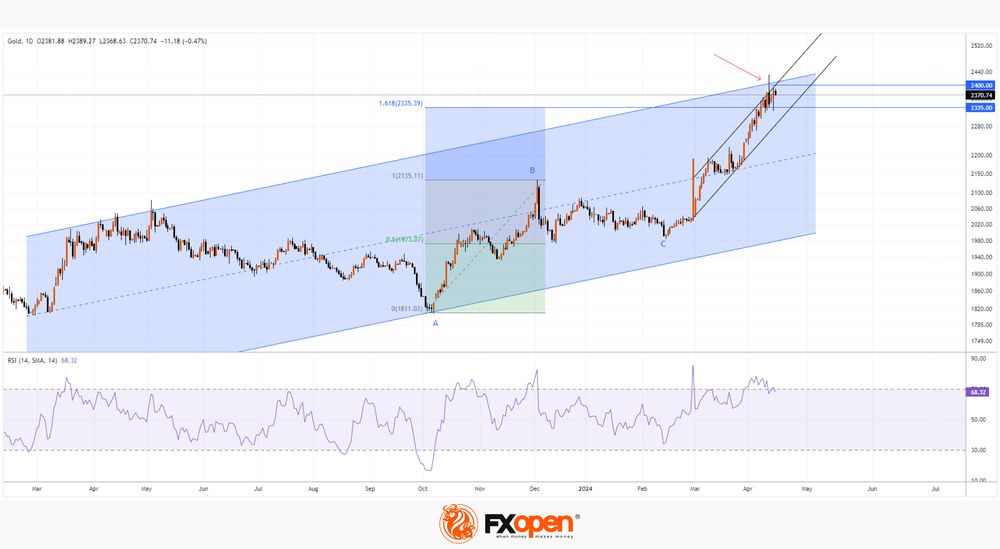
Since the beginning of 2024, the price of XAU/USD has risen 15%, setting a new all-time high of USD 2,425. Could the bull run continue further?
Although the fundamental backdrop remains tense, from a technical analysis perspective on gold prices, there are 4 important headwinds to consider:
→ the ascending channel (shown in blue). Today XAU/USD is near its upper line. As the arrow shows, the price of gold reacts to this line as resistance.
→ Psychological round level 2,400. Having exceeded it, the price quickly returned back.
→ The RSI indicator indicates that the market is overbought.
→ Fibonacci proportions. If we take impulse A→B as 100%, then the impulse price growth from point C has already exceeded the level = 1.618 (around 2,335), which could be the target.
On April 3, we wrote that the price of gold could rise to the level of 2,380. Now, in addition to the listed factors, it is worth taking into account the motive of some traders to take profits after a period of rising prices, which may contribute to the formation of a correction in the market - for example, to the lower intermediate channel lines (shown in black).
Start trading commodity CFDs with tight spreads. Open your trading account now or learn more about trading commodity CFDs with FXOpen.
This article represents the opinion of the Companies operating under the FXOpen brand only. It is not to be construed as an offer, solicitation, or recommendation with respect to products and services provided by the Companies operating under the FXOpen brand, nor is it to be considered financial advice.
AUDJPY Elliott Wave: Forecasting the Path
Hello fellow traders. In this technical blog we’re going to take a quick look at the Elliott Wave charts of AUDJPY Forex pair, published in members area of the website. As our members know we have been favoring the long side in YEN pairs. Recently we got a pull back that has made a clear 3 waves pull back that found buyers right at the equal legs area. In the further text we are going to explain the Elliott Wave forecast
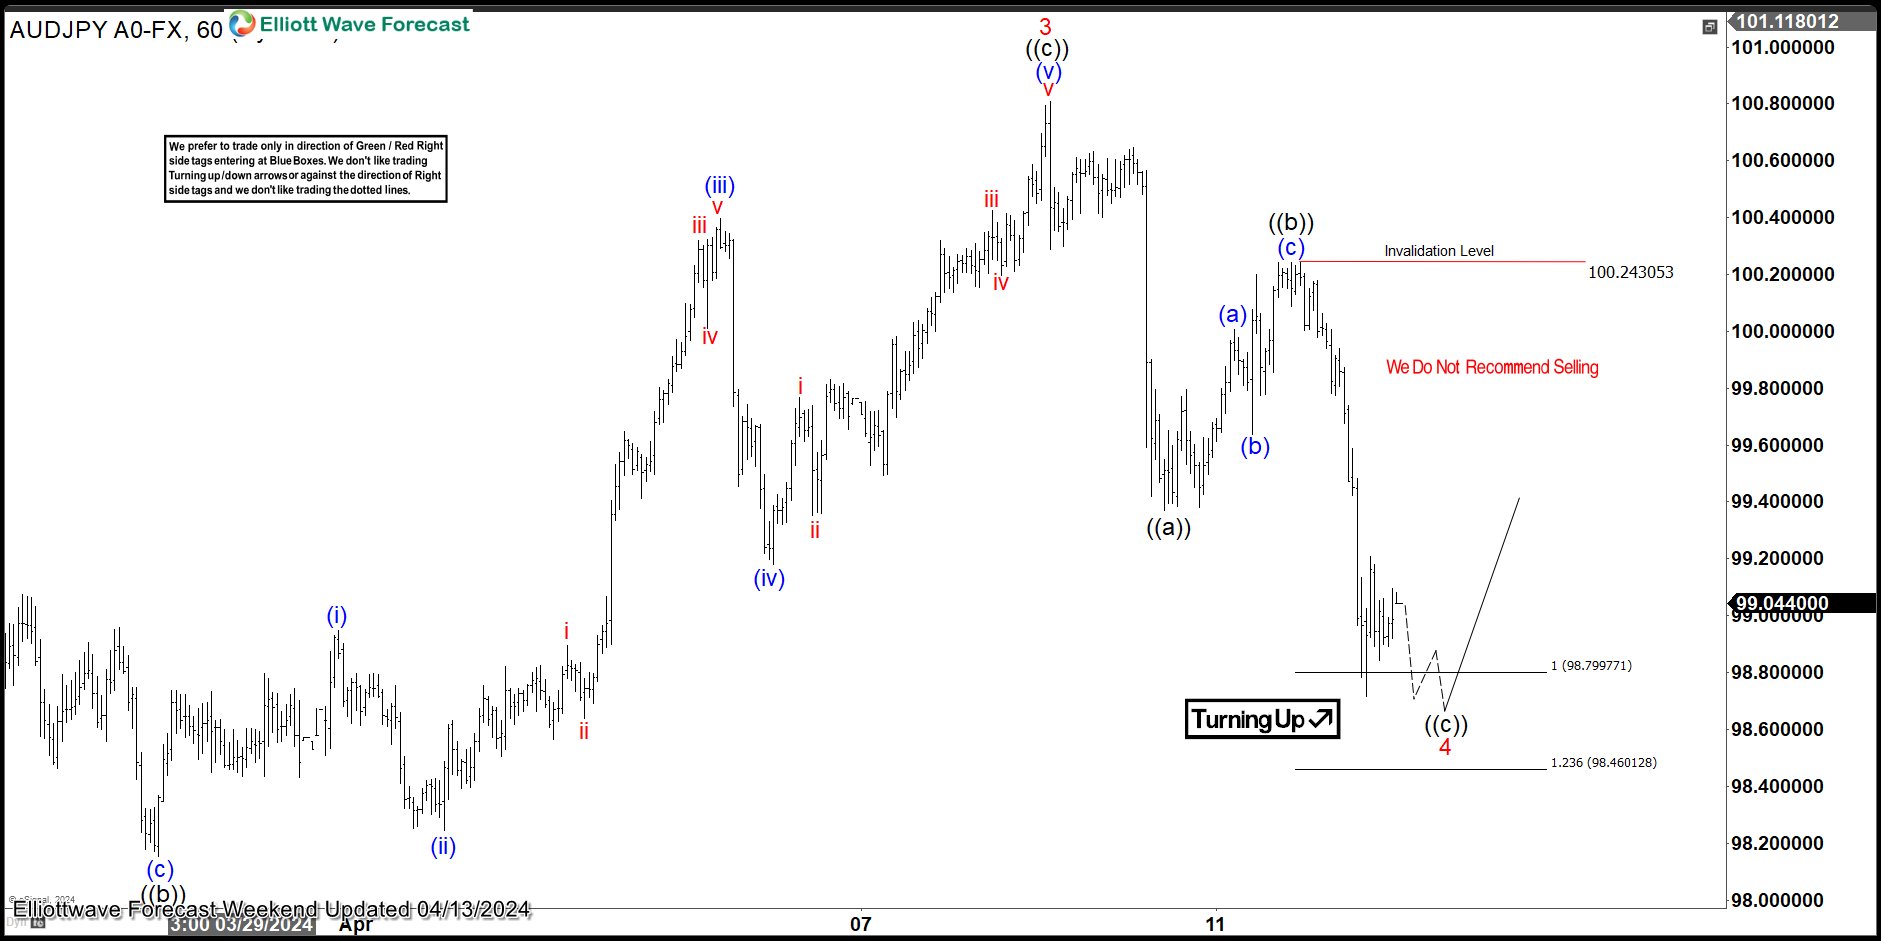
AUDJPY H1 Weekend Update 04.13.2024
AUDJPY ended cycle from the 96.8676 low and now correcting it. Current view suggests wave 4 red pull back can be unfolding as Elliott Wave Zig Zag Pattern. The Equal legs area is already reached at 98.799-98.460. We are aware that pull back can complete any moment. We don’t recommend selling the pair and expect further rally to resume from the buyers zone : 98.799-98.460.
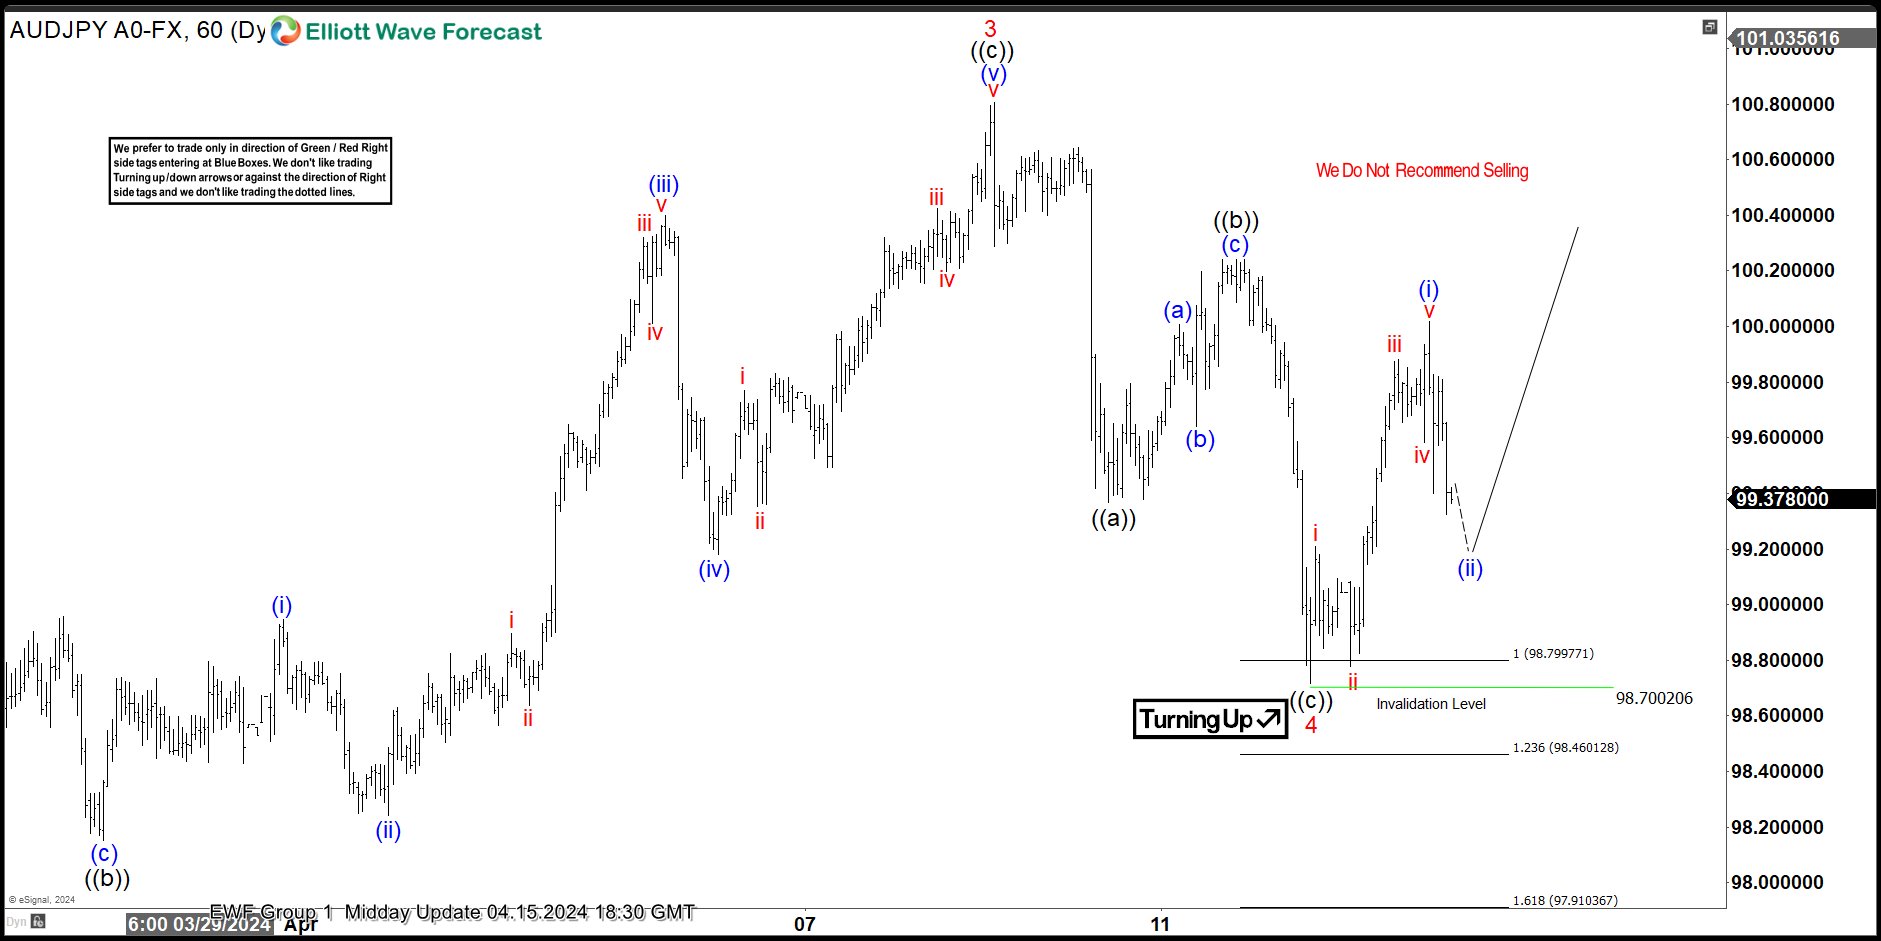
AUDJPY H1 Weekend Update 04.15.2024
AUDJPY has given us a nice reaction from the Equal Legs zone as expected. The bounce reached and exceeded 50% Fibonacci retracement against the ((b)) high, so we consider wave 4 red completed at the 98.7 low. We anticipate a break of the 3 red peak to confirm that the next leg up is in progress. Alternatively, if the price breaks below the 98.7 low, the pair will open up the possibility for a 7-swing pattern toward 97.963-97.476 area. In that case, any long positions will be stopped out at Break Even, and we will look to buy the dips again at the next set of equal legs.
ECB’s Rehn points to June rate cuts, but warns of geopolitical risks
ECB Governing Council member Olli Rehn highlighted in a statement that reduction in policy restrictions could commence in June as long as "inflation continues to fall as projected."
But he also addressed the predominant risks, identifying "geopolitics" as the primary source of uncertainty. He specifically pointed to the "deteriorating situation in Ukraine" and the "possible escalation of the Middle East conflict" as critical factors with potential ramifications on the European economy, especially concerning energy prices and overall economic stability.
Looking ahead to ECB's June meeting, the council will review an "updated assessment of the inflation outlook, the dynamics of underlying inflation, and the strength of monetary policy transmission."
This upcoming analysis will be crucial in determining whether ECB has sufficient confidence that inflation is sustainably converging towards its target, leading to a decision to "start to ease the stance of monetary policy and cut interest rates."
However, Rehn cautioned that this prospective easing is conditional on the absence of "further setbacks, for instance in the geopolitical situation and therefore in energy prices."
AUDUSD Breaks the Lower Bound of a Sideways Range
- AUDUSD extends slide after breaking lower bound of range
- MACD and RSI detect bearish momentum
- Break below 0.6390 could aim for 0.6335
- Recovery above 0.6500 could signal return within range
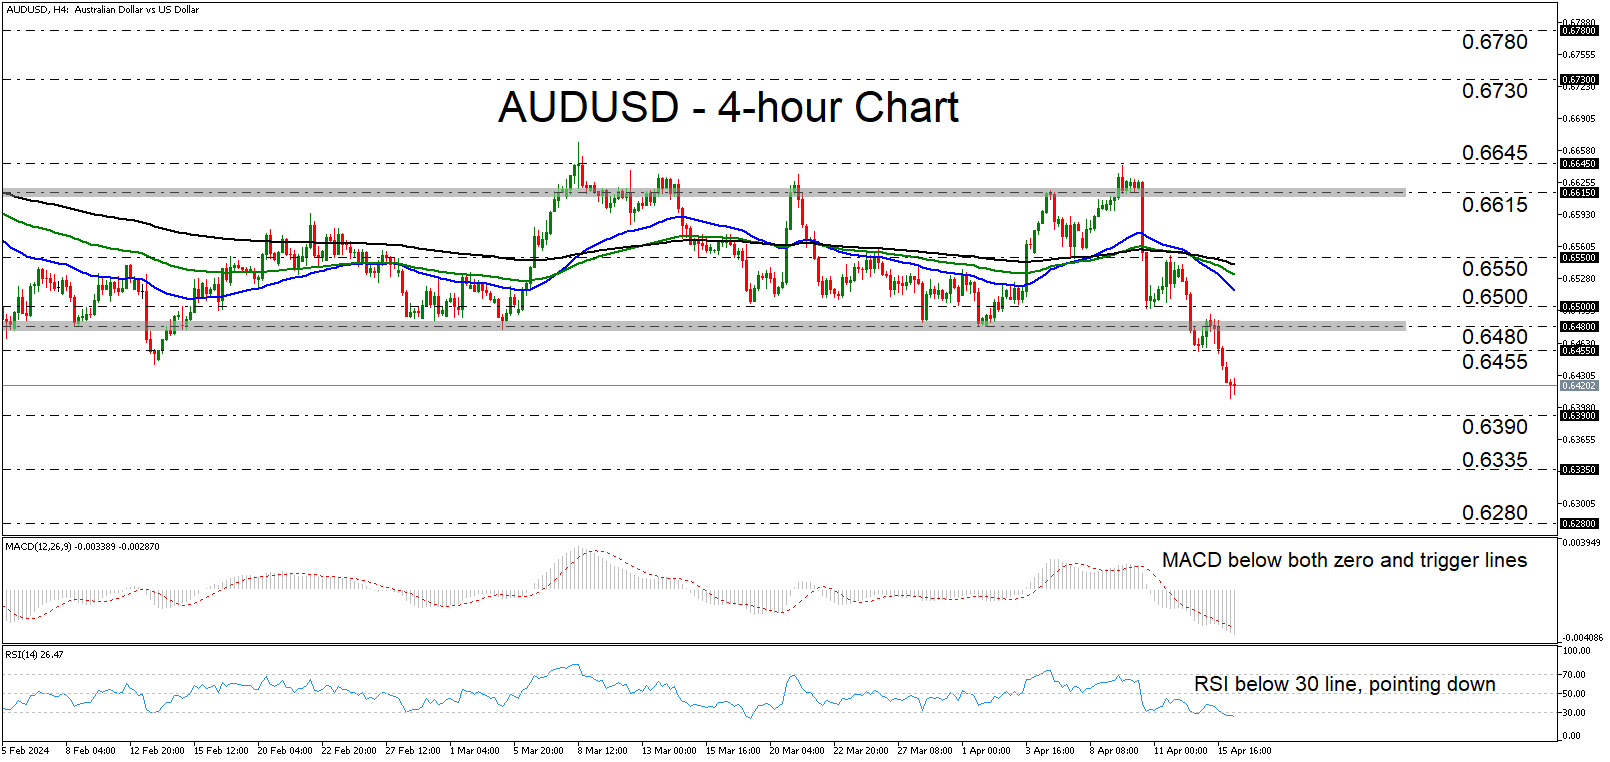
AUDUSD extended its tumble on Monday and during the Asian session Tuesday, falling below the key support barrier of 0.6455. On Friday, the pair broke below the lower end of a sideways range that was containing most of the price action since mid-January, and the dip below 0.6455 may have confirmed the shift in the near-term picture to bearish.
The short-term oscillators corroborate that view. The MACD is lying below both its zero and trigger lines, while the RSI is running below 30, pointing down as well.
If the bears are willing to stay in the driver’s seat, they could aim for the inside swing high of November 13, at around 0.6390, the break of which could extend the fall towards the low of the previous day, at around 0.6335. If there are no buyers to be found there either, then the next area to consider as support may be at around 0.6280. That zone stopped the pair from drifting lower on several occasions during October.
On the upside, a break back above 0.6500 may confirm the pair’s return within the aforementioned sideways range and thereby turn the outlook back to neutral. For the picture to be painted positively, AUDUSD may need to further recover and emerge above the upper bound of the range, at around 0.6615.
To sum up, AUDUSD continues to drift south after breaking the lower boundary of a sideways range that was in place since January. This has shifted the short-term outlook to bearish and suggests that further declines may be in store.