Sample Category Title
Persistent Dollar Rally Accompanied by Yen and Franc Comebacks
Dollar's rally presses on today and extends into early US session, reflecting continued strength even after a period of brief consolidation. Swiss Franc and Japanese Yen are also rebounding notably, indicating a broader trend of currency strength in traditionally safe-haven assets. This pattern is further underscored by the ongoing record rally in Gold, pointing to an underlying risk-off sentiment among global investors.
Despite these movements in the currency markets and previous metals, major European stock indexes are trading positively, while US futures show only a slight downturn. This divergence presents a contrasting picture, leaving the question on the dominant driving force unanswered for now.
As the trading week nears its close, Dollar stands out as the clear frontrunner, significantly outpacing other major currencies. New Zealand Dollar holds the second strongest position, although it appears vulnerable to being overtaken by the surging Japanese Yen, currently in third place. At the other end of the spectrum, Euro is the week's weakest performer, with British Pound and Australian Dollar following. Swiss Franc and Canadian Dollar are positioning in the middle of the pack.
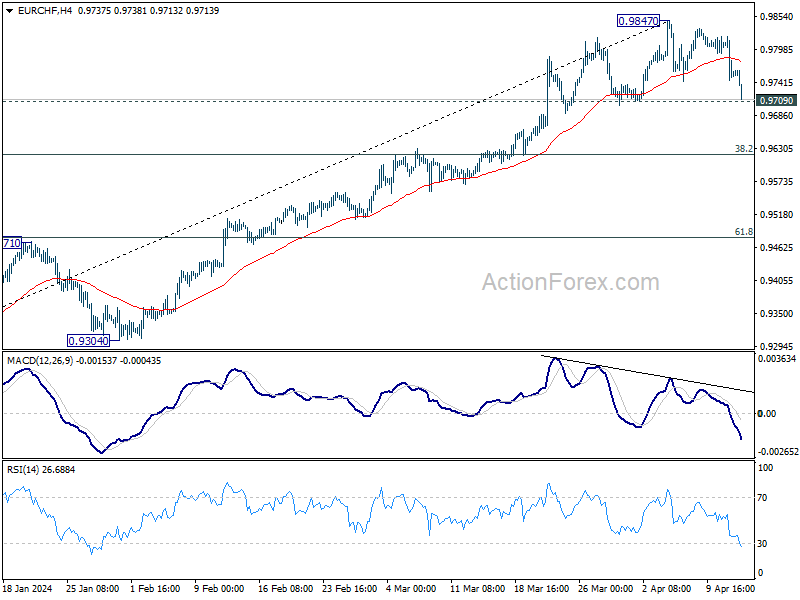
Technically, immediate focus is now on 0.9709 in EUR/CHF with current deep decline. Firm break there will at least bring deeper correction to 38.2% retracement of 0.9252 to 0.9847 at 0.9620. If realized, that would probably trigger downside acceleration in EUR/USD too.
In Europe, at the time of writing, FTSE is up 1.43%. DAX is up 0.85%. CAC is up 0.76%. UK 10-year yield is down -0.0612 at 4.142. Germany 10-year yield is down -0.105 at 2.362. Earlier in Asia, Nikkei rose 0.21%. Hong Kong HSI fell -2.18%. China Shanghai SSE fell -0.49%. Singapore Strait Times fell -0.33%. Japan 10-year JGB yield rose 0.0094 to 0.867.
Fed's Collins in the range of two rate cuts this year
In a Reuters interview, Boston Fed President Susan Collins revealed that she "in the range of two" rate cuts for this year, as per the quarterly forecast she submitted during the Fed's March meeting.
Collins was clear that an increase in interest rates is "not part of my baseline". However, she remained open to adjustments based on upcoming economic data, emphasizing, "I don't think you can take possibilities as not being on the table, it really depends on where the data take us."
Looking ahead, Collins anticipates slowdown in demand which she expects to continue into 2024. She believes this deceleration will be crucial in reducing inflationary pressures later in the year.
ECB's Stournaras advocates for insurance rate cut to nurture Eurozone recovery
ECB Governing Council member Yannis Stournaras expressed the need for an "insurance rate cut" to bolster the nascent recovery within Eurozone. Speaking to Bloomberg, Stournaras highlighted the critical balance the ECB aims to maintain in fostering economic growth without stifling it with persistently high interest rates.
Stournaras detailed the emerging signs of economic recovery across the Eurozone, particularly noting positive developments in Germany. "We see the first seeds of a recovery in Europe — also in Germany," he remarked, emphasizing "We don't want to kill these first seeds of recovery."
The concept of an insurance rate cut, as described by Stournaras, is intended to preemptively address potential downturns, mirroring the approach taken last September when rates were increased to guard against surging inflation.
Reflecting on the past year's policy decisions, Stournaras acknowledged that the situation has reversed, with new risks that "fall too far below the 2% target". Hence, "We now need an insurance in order not to get behind the curve," he added.
Moreover, Stournaras argued for a divergence from Fed's current monetary policy approach, citing fundamental differences between the economic environments in Eurozone and the US. He pointed out that unlike the US, where demand is buoyed by significant governmental budgetary measures, the Eurozone's inflation dynamics have been primarily driven by supply-side factors, not by demand or wage increases.
UK GDP rises 0.1% mom in Feb, led by production
UK GDP grew 0.1% mom in February, matched expectations. Services grew by 0.1% mom. Production output grew 1.1% mom, and was the largest contributor to growth in the month. Construction output fell -1.9% mom.
For the three months to February, compared with the three months to November 2023, GDP has grown 0.2%. Services rose 0.2%. Production grew 0.7%. Construction fell -1.0%.
NZ BNZ manufacturing falls to 47.1, 13th month of contraction
New Zealand BusinessNZ Performance of Manufacturing Index PMI fell from 49.1 to 47.1 from 49.1 in February, marking the lowest level since last December and indicating that the sector has been in contraction for 13 consecutive months.
Key components painted a concerning picture. Production experienced a notable decline from 49.1 to 45.7. Employment also fell from 49.2 to 46.8, suggesting that businesses are reducing their workforce in response to reduced demand. New orders, a critical indicator of future activity, decreased from 47.5 to 44.7.
Finished stocks were the only component of the index to show an increase, from 48.8 to 49.2. This could indicate that products are remaining in inventory longer due to lower sales volumes. Delivery times also worsened from 51.1 to 47.8, which could reflect logistical issues or supply chain disruptions.
The proportion of negative comments from survey respondents increased to 65% in March, up from 62% in February and 63.2% in January. Many cited a lack of orders and the general economic slowdown as major concerns.
Looking ahead
UK GDP is the main focus in European session, and trade balance will also be released. Germany will publish CPI final. Later in the day, US will release import price index and U of Michigan consumer sentiment.
EUR/USD Mid-Day Outlook
Daily Pivots: (S1) 1.0697; (P) 1.0727; (R1) 1.0755; More...
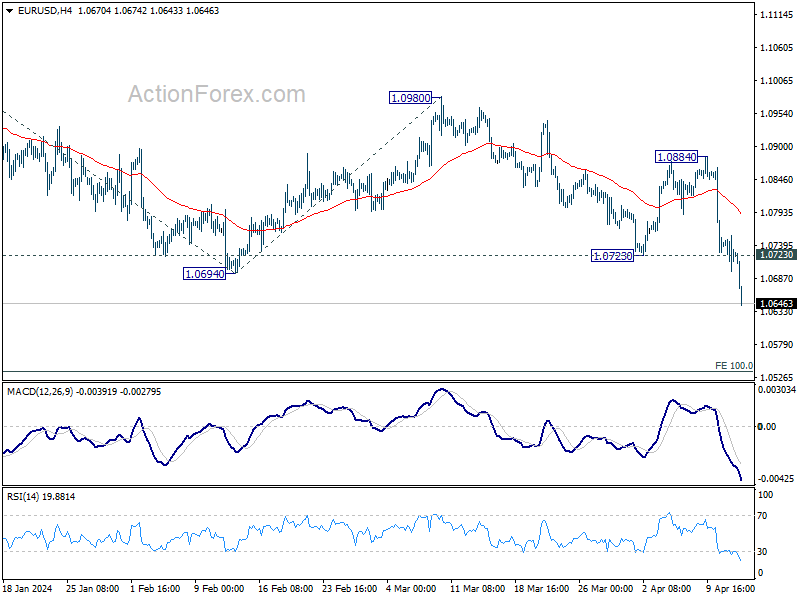
EUR/USD's decline extends through 1.0694 support today. The development confirms resumption of whole fall from 1.1138. Intraday bias stays on the downside for 100% projection of 1.1138 to 1.0694 from 1.0980 at 1.0536 next. On the upside, above 1.0723 support turned resistance will turn intraday bias neutral and bring consolidations first, before staging another fall.
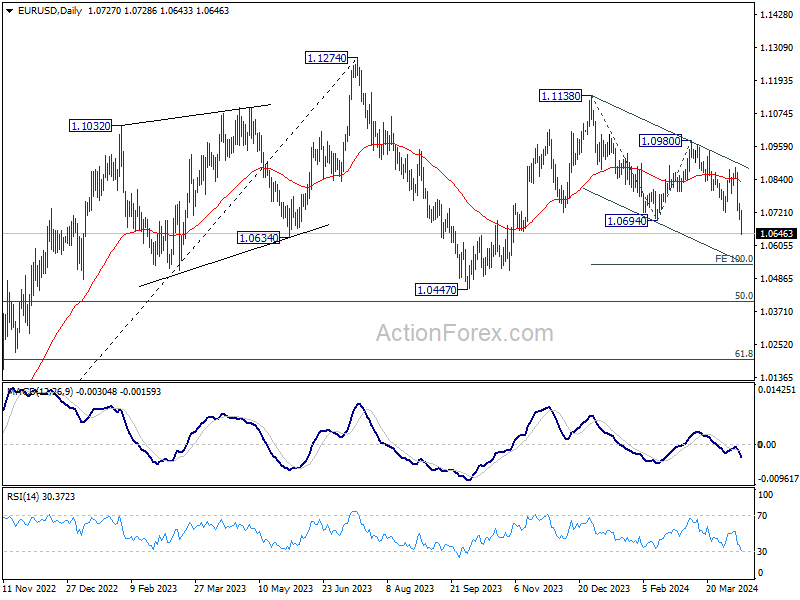
In the bigger picture, price actions from 1.1274 are viewed as a corrective pattern to rise from 0.9534 (2022 low). Current fall from 1.1138 is seen as the third leg. While deeper decline is would be seen to 1.0447 and possibly below. Strong support should emerge from 61.8% retracement of 0.9534 to 1.1274 at 1.0199 to complete the correction.
Economic Indicators Update
| GMT | Ccy | Events | Actual | Forecast | Previous | Revised |
|---|---|---|---|---|---|---|
| 22:30 | NZD | Business NZ PMI Mar | 47.1 | 49.3 | 49.1 | |
| 04:30 | JPY | Industrial Production M/M Feb F | -0.60% | -0.10% | -0.10% | |
| 06:00 | EUR | Germany CPI M/M Mar F | 0.40% | 0.40% | 0.40% | |
| 06:00 | EUR | Germany CPI Y/Y Mar F | 2.20% | 2.20% | 2.20% | |
| 06:00 | GBP | GDP M/M Feb | 0.10% | 0.10% | 0.20% | 0.30% |
| 06:00 | GBP | Manufacturing Production M/M Feb | 1.20% | 0.20% | 0.00% | -0.20% |
| 06:00 | GBP | Manufacturing Production Y/Y Feb | 2.70% | 2.10% | 2% | 1.50% |
| 06:00 | GBP | Industrial Production M/M Feb | 1.10% | 0.00% | -0.20% | -0.30% |
| 06:00 | GBP | Industrial Production Y/Y Feb | 1.40% | 0.60% | 0.50% | 0.30% |
| 06:00 | GBP | Goods Trade Balance (GBP) Feb | -14.2B | -14.5B | -14.5B | |
| 11:00 | GBP | NIESR GDP Estimate Mar | 0.40% | 0.00% | 0.20% | |
| 12:30 | USD | Import Price Index M/M Mar | 0.40% | 0.30% | ||
| 14:00 | USD | Michigan Consumer Sentiment Index Apr P | 79 | 79.4 |
Fed’s Collins in the range of two rate cuts this year
In a Reuters interview, Boston Fed President Susan Collins revealed that she "in the range of two" rate cuts for this year, as per the quarterly forecast she submitted during the Fed's March meeting.
Collins was clear that an increase in interest rates is "not part of my baseline". However, she remained open to adjustments based on upcoming economic data, emphasizing, "I don't think you can take possibilities as not being on the table, it really depends on where the data take us."
Looking ahead, Collins anticipates slowdown in demand which she expects to continue into 2024. She believes this deceleration will be crucial in reducing inflationary pressures later in the year.
Cryptocurrencies Look Stronger Than Stocks
Market picture
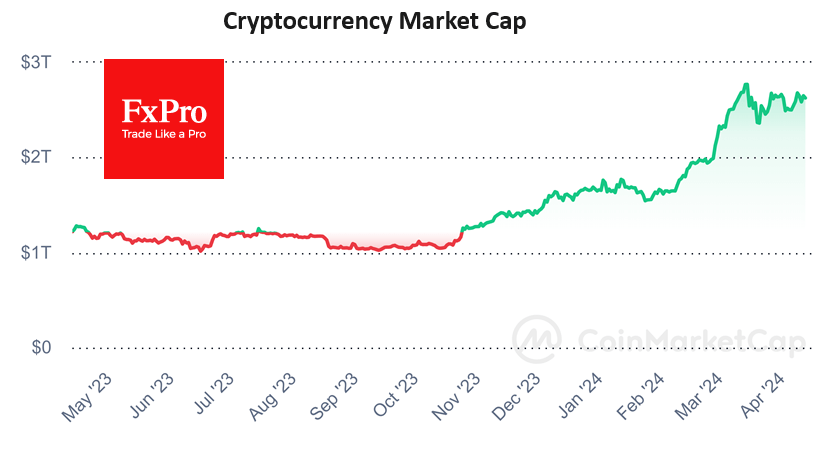
The crypto market continues to avoid gaining momentum on the upside but remains within an uptrend: the bulls fail to accelerate price gains, but the overall upward trend remains. ‘Extreme Greed’ persists in the markets, with the corresponding index at 79. In contrast, the sentiment in the stock markets is almost ‘Neutral’.
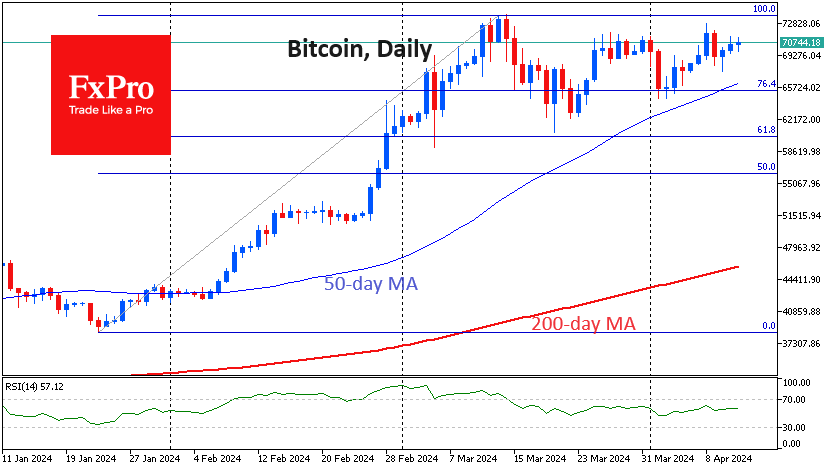
Bitcoin maintains its uptrend, leaving a gap between the price and the 50-day moving average of around 3.5%. From the current $71K, the first cryptocurrency has little trouble rising to $72K, but it could enter a turbulent zone further down when it starts to struggle against strong resistance. On the bearish side, a rising dollar and a breakdown of the upward trend in stock indices.
As a result of another recalculation, the difficulty of mining the first cryptocurrency increased by 3.92%. The index updated the maximum and reached 86.39 T. The average hashrate for the period since the previous change in the value was 705.39 EH/s.
Toncoin (TON) hit an all-time high of $7.70 on Thursday, rising 40% over seven days on the back of multiple announcements from The Open Network and Telegram. The token surpassed Cardano by capitalisation and ranked 9th by CoinMarketCap.
News background
TON’s positive momentum is attributed to recent initiatives by blockchain developers The Open Network, including several integrations with messenger Telegram. Meanwhile, there are some concerns in the community regarding the distribution of TON issuance. According to CoinCarp, more than 60% of the coins are held by the top 10 holders, while 93% are concentrated in the top 100 users.
Outflows from Grayscale’s (GBTC) spot bitcoin-ETF have exhausted themselves, said Grayscale CEO Michael Sonnenschein. He attributed his expectations to the completion of a number of transactions for the realisation of GBTC units by bankrupt cryptocurrency companies. He cited the passing of the peak of a wave of clients switching to alternative Bitcoin ETFs with lower fees as another reason. Since the ETF was approved, outflows from GBTC have approached $16bn.
Uniswap, the largest decentralised exchange, has been warned by the SEC that securities law violations have been discovered and a civil lawsuit could be filed in the future. The exchange’s team said it was ready to fight. It considered the regulator’s arguments weak.
According to Policygenius research, cryptocurrencies are more popular than stocks among Zoomers in the US. About 18% of US Zoomers own stocks, while 20% own crypto.
XAU/USD: Gold Hits New Record High
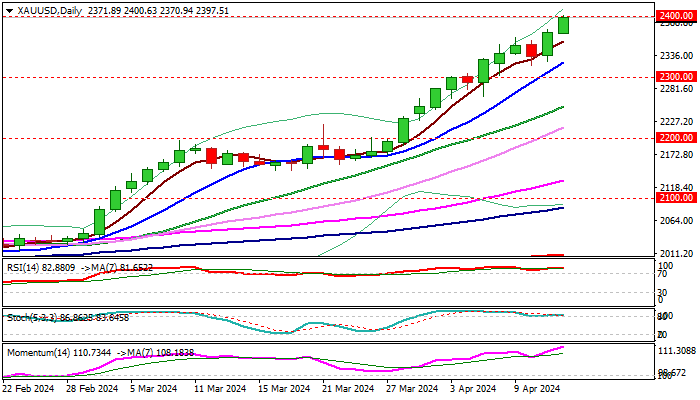
Gold climbed to new all-time high on Friday and cracked psychological barrier at $2400, remaining at a high speed and again taking just few days for a trip from one to another round-figure barrier.
Growing geopolitical tensions continue to fuel safe haven demand, particularly purchases by the central banks and lift metal’s price, offsetting negative influence from solid US economic data and stronger dollar on colling expectations for Fed’s first rate cut in June.
The yellow metal is on track for the fourth straight weekly gain and holding in a steep ascend for the second month, advancing by impressive 16% since the beginning of the year.
Technical picture remains bullish, as strong positive signal has been generated after the metal’s price broke above larger range (2020/2024), indicating continuation of broader uptrend.
Bulls are expected to keep control in coming months in favorable conditions for safe haven bullion, with next significant target at $2500, coming in focus.
Dips, under current circumstances, should be limited and provide better buying levels
Res: 2400; 2411; 2428; 2440.
Sup: 2370; 2358; 1324; 2300.
EUR/USD Extends Steep Fall as Bears Take Full Control After US Inflation Data/ECB Policy Decision
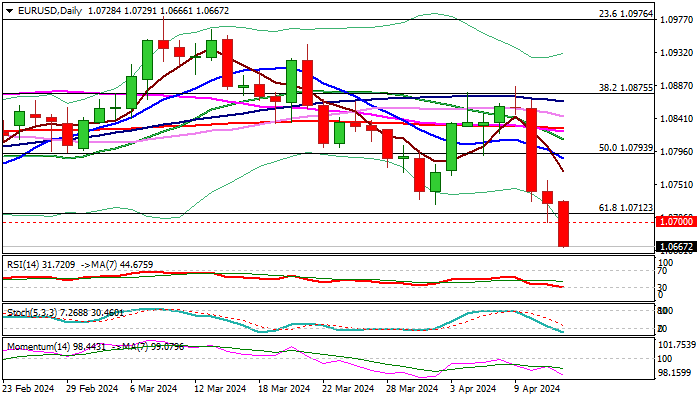
The Euro continues to trend lower and hit new 2024 in early Friday, as steep fall extends into third consecutive day, keeping the pair on track to the biggest weekly loss since the second week of May 2023.
The single currency stumbled after hotter than expected US inflation data, released earlier this week, with ECB’s more dovish than expected stance regarding monetary policy increasing pressure on the single currency.
Sustained break of pivotal 1.0700 support zone (Fibo 61.8% of 1.0448/1.1139 / psychological / former 2024 low) is likely to spark further weakness.
Bears eye next targets at 1.0628/11 (100WMA / Fibo 76.4%) and may extend towards key med-term support at 1.0448 (3 Oct 2023 low).
Bearish daily technical contribute to negative outlook, with limited corrective action on oversold conditions, likely to offer better levels to re-enter bearish market.
Broken pivotal supports at 1.0695/1.0724 zone reverted to initial resistances, with upticks to be capped under falling daily Tenkan-sen (1.0776) to keep bears in play
Res: 1.0695; 1.0724; 1.0762; 1.0776.
Sup: 1.0628; 1.0611; 1.0585; 1.0500.
Australian Dollar Struggles Amid Robust US Economic Data
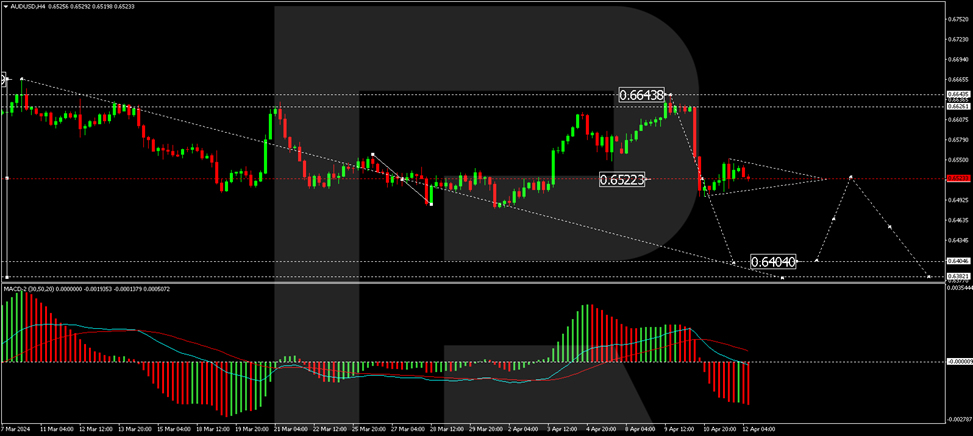
The AUD/USD pair remains under pressure, hovering around 0.6528 on Friday. Earlier this week, the Australian dollar faced significant challenges, with a sharp decline against the USD. Efforts to stabilise the exchange rate have seen limited success thus far.
The stronger-than-expected economic data from the US has dampened hopes for extensive interest rate cuts by the Federal Reserve this year. The capital market currently anticipates only a 40-basis point reduction, a downgrade from the 60-75 basis points expected at the start of the week.
The Reserve Bank of Australia (RBA) is considering initiating its monetary easing policies towards the end of 2024. However, Australia's robust employment market and persistent consumer inflation complicate these plans. Recent data indicates that the unemployment rate dropped to 3.7% in February, the lowest since September 2023, while inflation remained steady at 3.4% for the third consecutive month.
A recent Westpac report highlights the RBA's need for greater confidence in the inflation outlook before seriously contemplating a rate cut.
Technical analysis of AUD/USD
On the H4 chart, the AUD/USD is developing the fifth wave of decline towards 0.6832. The market has recently experienced a decline to 0.6498. A consolidation range is forming above this level today. If the pair exits this range upward, a corrective move to 0.6570 may occur. Conversely, a downward exit could lead to the continuation of the downward wave towards 0.6404. The MACD indicator supports this bearish outlook, with its signal line above zero but trending downwards sharply.
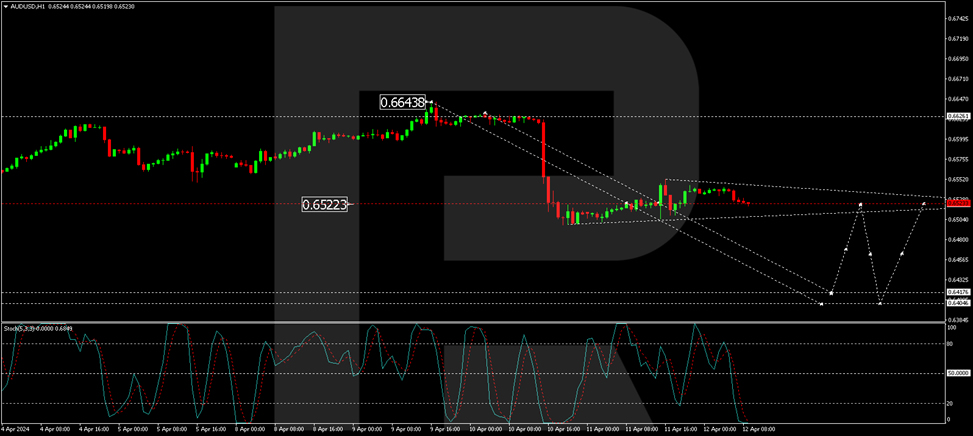
The H1 chart shows a consolidation around 0.6523. An upward breakout could lead to a correction towards 0.6570. A downward move from the range could initiate a further decline to 0.6420, potentially extending to 0.6404. The Stochastic oscillator, currently below 20, suggests a possible rise to 50, indicating potential short-term corrections within a broader downward trend.
US DJIA Technical: Major US Banks’ Q1 Earnings in Focus Over Adverse Macro Factors
- Three major US banks; JPMorgan Chase, Citigroup, and Wells Fargo will report their Q1 2024 earnings results today. JPMorgan Chase is ranked 13th in terms of component weightage in the DJIA.
- Analysts’ Q1 earnings estimates for these three US banks have been lowered which increases the possibility of positive earnings surprises.
- Technical analysis suggests a potential short-term mean reversion rebound scenario on the DJIA after 10 days of decline.
- Watch DJIA’s key short-term support of 38,200/060.
Since our last report, the price actions of the Dow Jones Industrial Average have shaped the expected rally, surpassed the highlighted 39,610 resistance, and printed a fresh all-time high of 40,031 on 1 April 2024 based on data obtained from the US Wall Street 30 Index (a proxy of the Dow Jones Industrial Average futures).
Thereafter, a minor corrective decline took form in the past 10 days and the Index tumbled by -4.5% amid a lingering fear of interest rates in the US staying higher for a longer period that pushed up the US 10-year Treasury yield above its 4.50% key medium-term resistance (it recorded a daily close of 4.59% in yesterday, 11 April US session).
A diminishing “Fed dovish pivot” narrative due to the recent backdrop of a resilient US jobs market and firmer US inflationary trends inferred from March’s CPI prints as well as commodities prices have triggered near-term headwinds on the major uptrend phases of the major US stock indices via a higher cost of funding conduit that can potentially put downside pressure on net profit margins, especially growth-related stocks.
DJIA’s performance has lagged S&P 500 & Nasdaq 100
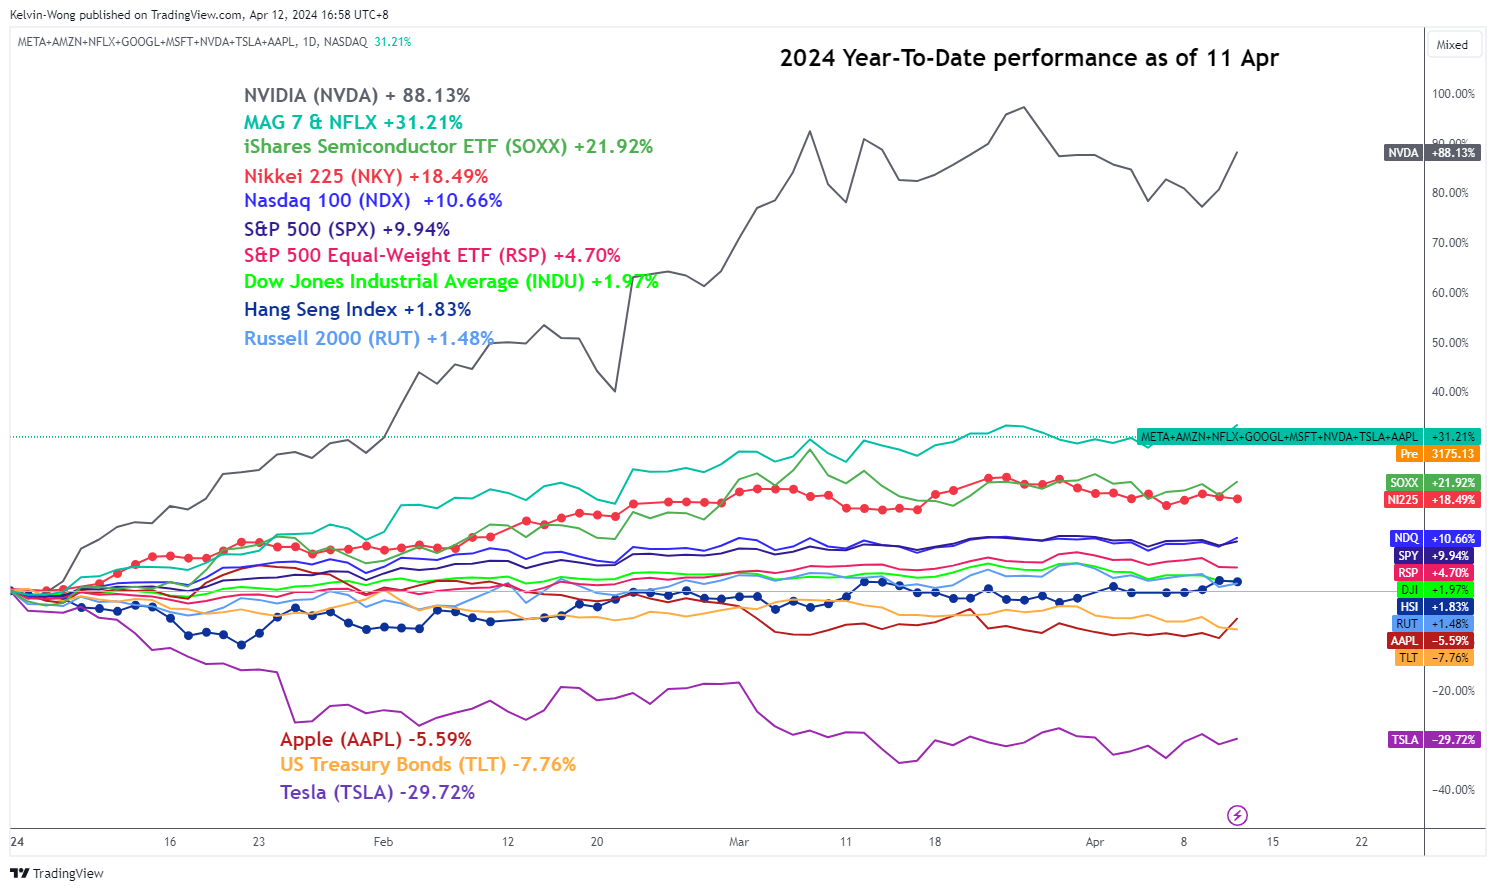
Fig 1: Year-to-date performances of major US stock indices with key US equities, sectors & global stock indices as of 11 Apr 2024 (Source: TradingView, click to enlarge chart)
So far, the Dow Jones Industrial Average has lagged behind the Artificial Intelligence (AI) technology-heavy weighted Nasdaq 100 (+11%) and S&P 500 (10%) with a year-to-date gain of just 2% as of yesterday, 11 April (see Fig 1)
Q1 earnings growth expectations for major US banks have been lowered significantly
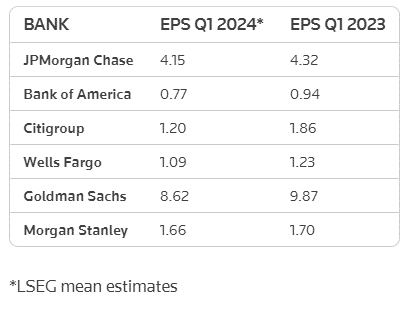
Fig 2: Analysts’ Q1 2024 EPS estimates for major US banks (Source: LSEG, Reuters News as of 11 Apr 2024, click to enlarge chart)
Three major US banks; JPMorgan Chase, Citigroup, and Wells Fargo will report their Q1 2024 earnings results today before the start of the US session. Given that these banks’ guidance on revenue outlook has been lowered in the past two months, equity analysts on average as surveyed by LSEG (see Fig 2) have pencilled in a weaker pace of earnings growth on US banks in Q1 2024; JP Morgan Chase is likely to post a 4% y/y drop in earnings per share (EPS) from the year-ago quarter, and further declines of 35% y/y and 11% y/y in EPS are forecasted for Citigroup and Wells Fargo.
Given that a “lower bar” has been set on the Q1 earnings projections for these three major US banks, a potential positive earnings surprise beat is likely to be easier to obtain which in turn may trigger a positive feedback loop at least in the short-term for the Dow Jones Industrial Average (JP Morgan Chase is ranked 13th in terms of component weightage in the DJIA while Goldman Sachs is ranked 3rd).
Watch the key short-term support of 38,200/060 on the DJIA
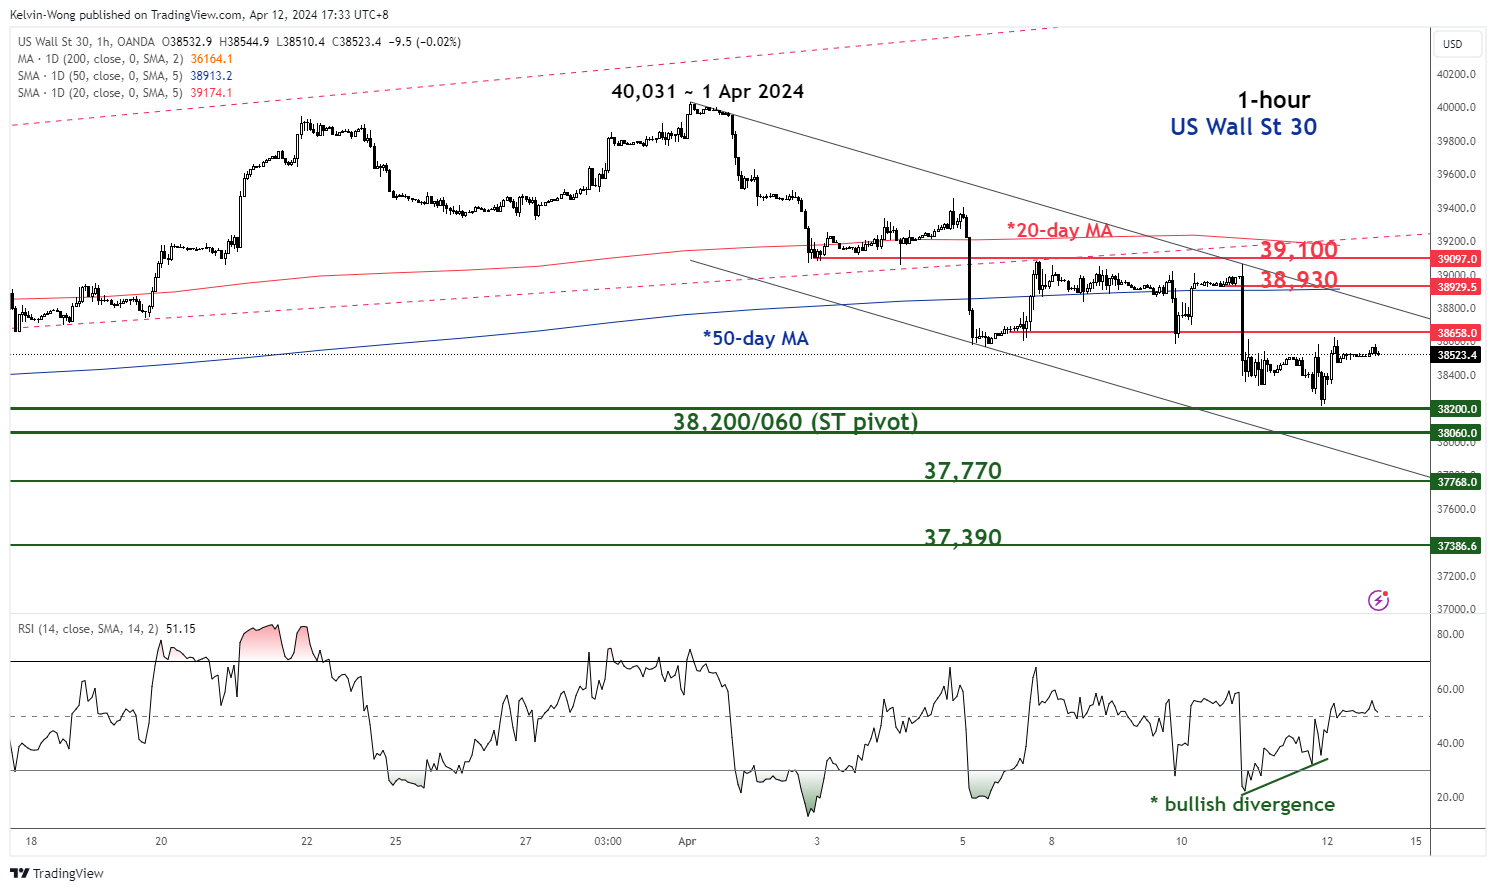
Fig 3: US Wall St 30 short-term trend as of 12 Apr 2024 (Source: TradingView, click to enlarge chart)
In the lens of technical analysis, trends do not move in a vertical direction but oscillate within trending phases.
The price actions of the US Wall Street 30 Index (a proxy of the Dow Jones Industrial Average futures) have started to transform into short to medium-term downtrend phases as it broke below the 20-day and 50-day moving averages.
Interestingly, recent observations seen in the hourly RSI momentum indicator have traced out a bullish divergence condition yesterday after it hit an oversold condition on Wednesday, 10 April which suggests that the short-term downside momentum in place since Wednesday has started to ease (see Fig 3).
The easing of downside momentum has increased the odds of a potential short-term mean reversion rebound for the Index as long as 38,200/060 key short-term pivotal support holds. A clearance above 38,660 near-term resistance sees the next intermediate resistances coming in at 38,930, and 39,100 (also confluences with the 20-day & 50-day moving averages).
On the flip side, a break below 38,060 invalidates the mean reversion rebound scenario for a continuation of the bearish impulsive down move sequence to expose the next intermediate supports at 37,770 and 37,390.
Pound Slips to 4.5-Month Low, UK GDP Ticks Higher
The British pound has edged lower on Friday. In the European session, GBP/USD is trading at 1.2594, down 0.47%. The pound is down 1.1% this week and fell to 1.2489 earlier today, its lowest point since November 23.
UK economy ekes out a 0.1% gain
It wasn’t a spectacular GDP report but a gain is a gain. The UK economy posted a gain of 0.1% m/m in February, a second month of expansion after an upwardly revised gain of 0.3% in January. The UK sustained a technical recession in the second half of 2023 but is on track to post a slight gain in the first quarter of this year.
The UK manufacturing sector has been struggling but posted an impressive rebound in March. Manufacturing production jumped 1.2% m/m, up from -0.2% in February and blowing past the market estimate of 0.1%. Industrial Production jumped 1.1% m/m, following a 0.3% decline in February and above the market estimate of zero.
The UK economy is still fragile despite the slight rise in GDP. Services posted a weak gain of 0.1% m/m in March and construction output fell by 1.9%. The UK is wallowing at the back of the G-7 economies, ahead of only Germany.
The Bank of England has held rates for five straight times and today’s data won’t change its cautious stance of “higher for longer”. Inflation dropped to 3.4% in February but remains well above the 2% target and the BoE will be reluctant to trim rates until inflation declines further.
In the US, Fed members are sounding hawkish about rate cuts after surprisingly strong data in March. Nonfarm payrolls crushed expectations last week with a gain of 303,000, while CPI accelerated for a second straight month and hit 3.5%. Federal Reserve members John Williams and Susan Collins both signaled that the Fed was not yet confident that inflation was moving down to 2% and there was no need to rush into cutting rates.
GBP/USD Technical
- GBP/USD has pushed below support at 1.2516 and is putting pressure on support at 1.2480
- There is resistance at 1.2548 and 1.2584
EURUSD Plummets After US CPI and ECB Decision
- As US CPI comes hotter than expected EURUSD tumbles
- After ECB interest rate decision EURUSD continues the fall
- Where is the next stop for the pair?
How did EURUSD reacted after the US CPI release on Wednesday and the ECB interest rate decision on Thursday?
EURUSD fell more than 100 pips after the US CPI data
Since June 2023, both consumer price index (CPI) and producer prices have been relatively stable without significant changes. In addition, a crucial measure of the Consumer Price Index (CPI) for services surged to 4.8% in March, showing no signs of decreasing. The Federal Reserve has encountered persistent and troublesome challenges in managing inflation mostly due to the stubborn and difficult-to-control price pressures in the services sector.
The Federal Reserve's favoured measure of inflation, known as the PCE measure, has seen more favorable growth. The core PCE price index, which is of great significance, decreased to 2.8% in February, marking its lowest level in almost three years.
Technically, after the US CPI release, EURUSD tumbled more than 100 pips, meeting the ascending trend line that is standing near the 1.0720 support level. The price dropped beneath the short-term simple moving averages (SMAs) in the daily timeframe, remaining within a symmetrical triangle. However, how did the pair react after the ECB announcement on Thursday?
ECB left interest rates unchanged with EURUSD continuing its negative move
As expected, the European Central Bank kept interest rates steady on Thursday, but it has provided further signs that it may soon start to decrease them.
The officials stated that they may consider lowering the existing degree of policy tightening if they become more certain that inflation is moving closer to their desired target. During the press conference, President Lagarde expressed that the decrease in inflation is providing reassurance, and some members of the board expressed confidence in reducing rates.
While she did not explicitly indicate a June rate cut, officials still expect a June interest rate reduction, as stated in a report released a few hours after her speech.
Since yesterday, EURUSD lost 0.8%, diving beneath the 1.0700 round number and creating a fresh five-month low near 1.0675. The price plunged below the ascending trend line, indicating a potential downside retracement with the next support level coming from 1.0655. Steeper decreases could open the way for the 1.0515 barricade, switching the longer-term timeframe to a more bearish one.
Looking at the technical oscillators, the RSI is approaching the 30 level with strong momentum, while the MACD is strengthening its negative momentum beneath its trigger and zero lines in the daily chart.
All in all, the pair has dived more than 1.7% over the last three days so far and any movements below 1.0655 could show some signs for more aggressive falls.
GBPUSD Outlook Worsens After Rapid Fall
- GBPUSD prints new low for this year
- Bearish continuation is likely below 1.2480-1.2500
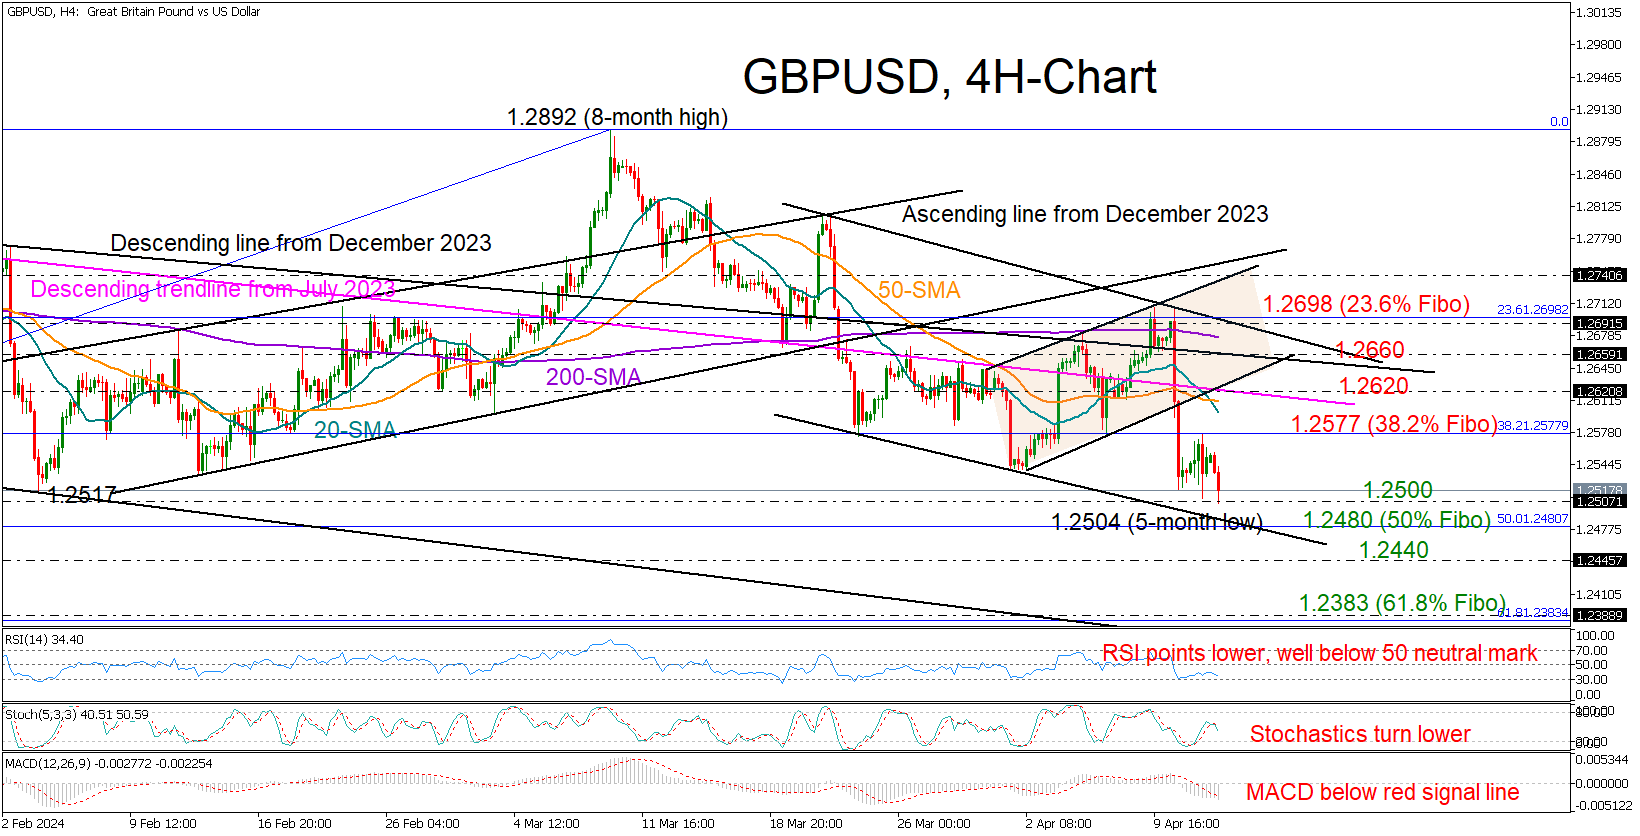
GBPUSD suffered a freefall in the face of hotter-than-expected US CPI inflation data on Tuesday and dropped to a new low of 1.2504 on Friday, retracing back to December’s lows and to the bottom of a broader range area.
Despite the consolidation phase, the rejection from the 38.2% Fibonacci retracement of the October 26-March 8 uptrend suggests another bearish wave is likely. This is evident by the negative slope in the momentum indicators too, which reflect persisting selling interest.
A close below the 1.2500 round level may lead to an immediate pause near the 23.6% Fibonacci mark of 1.2480. If the sell-off expands below the 1.2440 barrier, the pair might seek shelter somewhere between the 61.8% Fibonacci level of 1.2383 and the tentative support line from December at 1.2350.
On the upside, the bulls will have to breach the border at 1.2577 in order to access the descending line from July 2023 at 1.2620. The downward line from December’s peak at 1.2660 may prevent any further advances towards the 1.2698 resistance area, where the 23.6% Fibonacci and the tentative resistance line from March are located. Even higher, the rally could stall within the 1.2440-1.2460 region.
Overall, the latest sell-off in GBPUSD has negatively affected the short-term outlook, and further losses are expected if the bears successfully breach the 1.2500 floor.