Sample Category Title
Gold surges to new record, but anticipates stiff resistance at 2500
Gold's bullish momentum appears unstoppable for now as it surged to new record high in Asian session, now eyeing 2400 mark. This surge is driven by a confluence of factors that indicate broader market apprehensions, particularly about resurgence of inflation risks, with geopolitical tension in the background.
This shift in sentiment is evident in the sharp increase in benchmark treasury yields across various regions, including US, Europe, and even Japan. Concurrently, major stock indices are showing signs of a looming correction.
Judging from these developments, Gold's rally is more fueled by safe-haven flows, partly as hedge against selloff in stocks and bonds, and partly on geopolitical risks.
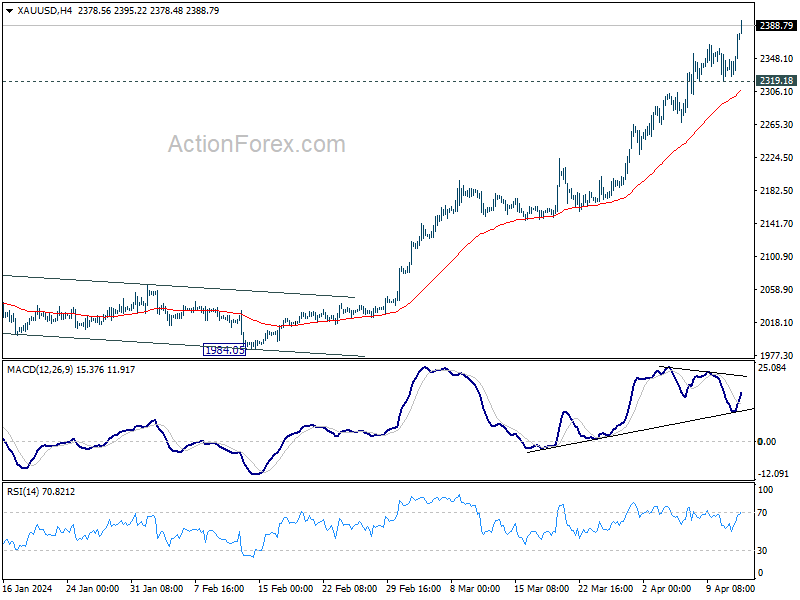
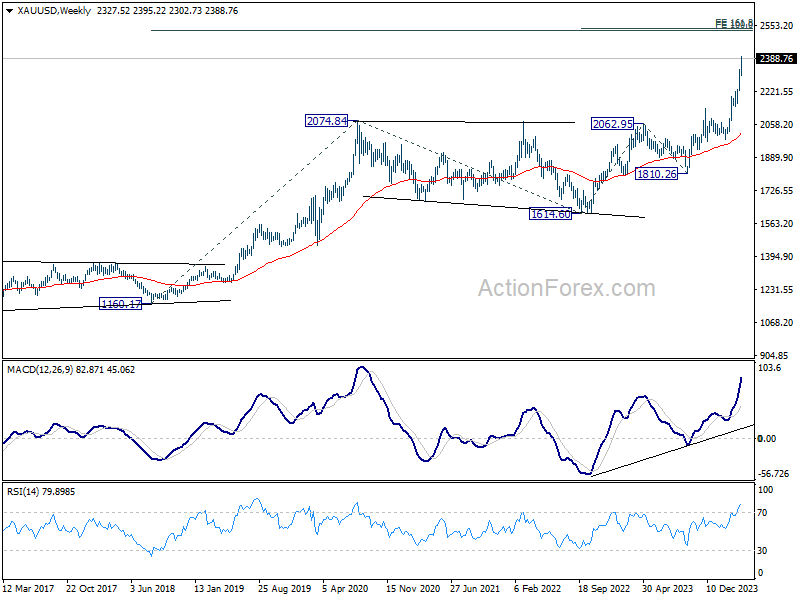
Technically, near term outlook in Gold will stay bullish as long as 2319.18 support holds. Next target is 2500 psychological level. Strong resistance is expected there to limit upside, at least on first attempt, to bring a notable correction.
Overbought condition, as seen in weekly RSI is a factor that could limit Gold's momentum ahead. More importantly, 2500 represents a cluster medium and long term projection levels. There lies 161.8% projection of 1614.60 to 2062.95 from 1810.26 at 2535.69, and 100% projection of 1160.17 to 2074.84 at 1614.60 at 2529.27.
USD/JPY Supported For More Gains, Gold Approaches $2,400
Key Highlights
- USD/JPY started another increase and cleared the 152.50 resistance.
- A key bullish trend line is forming with support at 152.70 on the 4-hour chart.
- EUR/USD and GBP/USD gained bearish momentum.
- Gold prices surged further above the $2,380 level.
USD/JPY Technical Analysis
The US Dollar remained well-bid above the 150.00 level against the Japanese Yen. USD/JPY formed a base and started another increase above 151.20.
Looking at the 4-hour chart, the pair settled above the 152.00 resistance, the 100 simple moving average (red, 4-hour), and the 200 simple moving average (green, 4-hour). There was also a clear move above the 152.50 resistance.
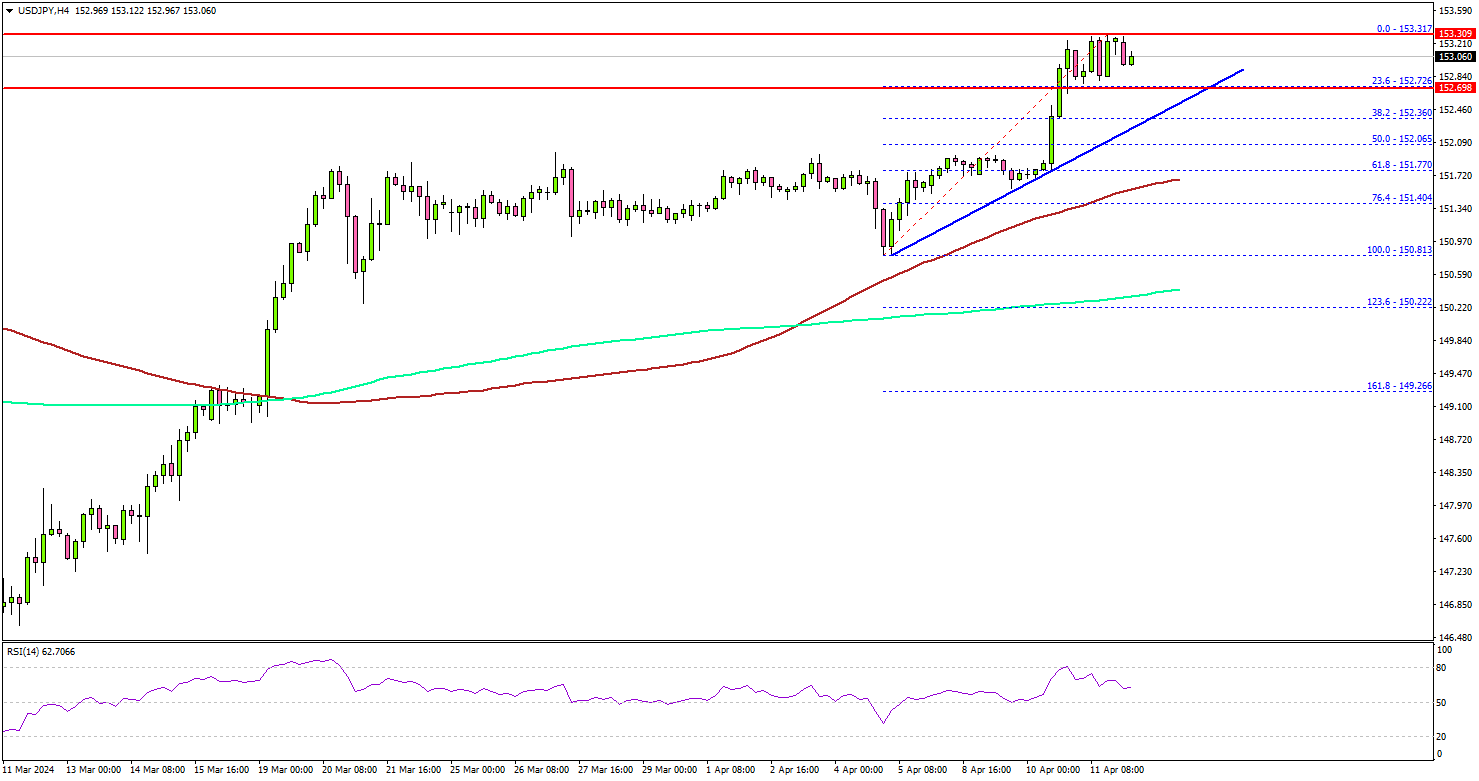
The pair traded to a new yearly high at 153.31 and currently consolidating gains. Immediate support is near the 152.75 level. There is also a key bullish trend line forming with support at 152.70 on the same chart.
The next major support is at 152.00. If there is a downside break below the 152.00 support, the pair could decline toward the 151.65 support. Any more losses might send the pair toward the 150.20 level in the near term.
On the upside, the pair is facing hurdles near 153.30. The first key resistance is near the 153.50 zone. A clear move above the 153.50 resistance could send the pair further higher. In the stated case, USD/JPY could rise toward the 155.00 level.
Looking at Gold, the price started another increase and broke the $2,380 resistance. It might soon test the $2,400 level.
Economic Releases
- US Import Price Index for March 2024 (MoM) – Forecast +0.3%, versus +0.3% previous.
- US Export Price Index for March 2024 (MoM) – Forecast +0.3%, versus +0.8% previous.
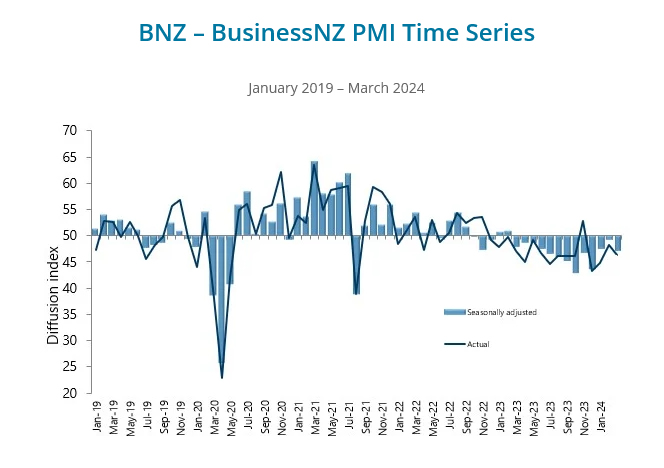
NZ BNZ manufacturing falls to 47.1, 13th month of contraction
New Zealand BusinessNZ Performance of Manufacturing Index PMI fell from 49.1 to 47.1 from 49.1 in February, marking the lowest level since last December and indicating that the sector has been in contraction for 13 consecutive months.
Key components painted a concerning picture. Production experienced a notable decline from 49.1 to 45.7. Employment also fell from 49.2 to 46.8, suggesting that businesses are reducing their workforce in response to reduced demand. New orders, a critical indicator of future activity, decreased from 47.5 to 44.7.
Finished stocks were the only component of the index to show an increase, from 48.8 to 49.2. This could indicate that products are remaining in inventory longer due to lower sales volumes. Delivery times also worsened from 51.1 to 47.8, which could reflect logistical issues or supply chain disruptions.
The proportion of negative comments from survey respondents increased to 65% in March, up from 62% in February and 63.2% in January. Many cited a lack of orders and the general economic slowdown as major concerns.
IMF Georgieva: Possible Fed rate cut in late 2024, but don’t hurry
In an interview with CNBC overnight, IMF Managing Director Kristalina Georgieva projected that by the end of the year, Fed would be positioned to lower interest rates. Nevertheless, She emphasized the importance of data-driven decisions, advising against premature action.
"We remain on our projection that we would see, by the end of the year, the Fed being in a position to take some action in a direction of bringing interest rates down," adding, "But again, don't hurry until the data tells you you can do it."
Georgieva also highlighted reasons for optimism regarding the US economy's future. She pointed out that the US is experiencing less upward pressure on labor costs compared to other regions, which helps in maintaining economic stability without the immediate threat of overheating.
Fed’s Collins signals reduced urgency for rate cuts and lesser easing in 2024
Boston Fed President Susan Collins suggested that the recent economic data do not necessitate an immediate adjustment in monetary policy, indicating that less easing might be required this year than previously anticipated.
At an even overnight, Collins highlighted that while recent data have not significantly altered her economic outlook, they but "highlight uncertainties related to timing" of economic developments. She stressed the importance of patience, acknowledging that "disinflation may continue to be uneven".
"This also implies that less easing of policy this year than previously thought may be warranted," she added.
Furthermore, "incoming data have eased my concerns about an imminent need to reassess the stance of monetary policy," she explained. And, "it may just take more time than previously thought for activity to moderate, and to see further progress in inflation returning durably to our target."
Policy Divergence Really Matters
Monetary policy settings across countries only make sense by also considering the fiscal context.
In 2020, the world faced the common shock of the pandemic. Initially similar consequences later diverged under the influence of very different policy responses. Roll forward to 2024, and the signs of that divergence are even starker.
Australia, for example, was late to the inflation surge because, compared with our advanced economy peers, we were later to open up after the pandemic. While the initial bounce back in demand returned consumption back to its pre-pandemic trend, the pandemic-era fiscal support that enabled this expired. Consumption per capita declined nearly 2½% over 2023 in Australia. It has been noticeably weaker than in peer economies, where it has generally been soft but broadly flat in level terms.
The United States, by contrast, has been an outlier on the other side. There, consumption per capita has been rising steadily.
The difference stems largely from the very different fiscal policy stances. In Australia, the federal government is running a surplus and likely to record another surplus in the current financial year. Some of this reflects windfall gains associated with high commodity prices but it is also due to the way tax operates in Australia. Personal income tax brackets are not indexed, and partly as a consequence of the surge in inflation, fiscal drag has resulted in the share of household income going to income tax reaching an historical high in the second half of 2023. (A graph showing this is in our April Market Outlook publication. (PDF 528KB))
By contrast in the United States, the federal government is running a budget deficit of around 6% of GDP, with no consolidation in sight or even being seriously discussed. Income tax brackets are indexed to the CPI, so American households are not seeing that drag from higher tax payments. Together with the fact that average mortgage rates paid have risen far less in the United States, macro policy is barely touching the sides for the US consumer.
The overarching lesson here is that monetary and fiscal policy are particularly powerful when they are working in the same direction. This was true in both Australia and the United States during the peak of the pandemic, when both governments managed to more than fill the hole in household and small business incomes created by lockdowns. It is also true in Australia now, though working in the opposite direction. Meanwhile, despite higher policy rates, growth in the United States has outstripped its peers among advanced economies. One reason for this is that fiscal policy is still boosting the level of demand.
The situation in some other advanced economies is, as consumption developments would suggest, somewhere in the middle. Fiscal support during the pandemic was not quite as fulsome in Europe and Japan as in the Anglosphere. More recently, it has also lain between the extremes of Australia and the United States.
This fiscal context goes a long way towards explaining recent differences in the perceived adequacy of monetary policy tightening. While there is still a body of opinion holding that the RBA will not cut rates until 2025, a number of customers overseas (I am writing this from London) are more likely to ask what would trigger the RBA to cut rates earlier than our current call for a late-September timing.
Meanwhile in the United States (and New Zealand, where fiscal policy also remains expansive), the tendency has been for market pricing of the first rate cut to be pushed out. On the other side, some commentators (for example as represented in the Geneva Report issued late last year) are concerned that the ECB and some other central banks are on the cusp of a policy mistake by keeping policy too tight.
All of this is to say that simple cross-country comparisons of current levels of the policy rate, or with estimates of neutral rates, are not the whole story. Aside from the uncertainties around estimating the neutral real rate of interest, there are other things going on that need to be taken into account. The size and shape of fiscal support is one major divergence that should not be ignored.
On top of influencing the required stance of monetary policy, differing fiscal strategies might influence monetary policy choices in other ways.
Recall that several central banks, including the Federal Reserve, RBNZ and Bank of Canada, have decided to retain a ‘floor system’ operational model, with excess bank reserves on the central bank’s balance sheet dragging down the overnight cash rate towards the rate paid on those reserves. Meanwhile the RBA, ECB, Bank of England and the Riksbank in Sweden have chosen the less expansive ‘ample reserves’ option.
These groupings start to make sense when we consider that the floor system group mostly have more expansionary fiscal policy than the ‘ample reserves’ group. (Central government deficits in the UK and Canada are both increasing but Sweden, like Australia, is running fiscal surpluses that were not previously forecast.)
The central banks are not consciously choosing to accommodate loose fiscal policy. Rather, they are assessing how large their bond holdings can be without degrading market functioning by ‘cornering’ the market. This naturally depends on the likely future size of the government bond market. Market size therefore shapes the view of the risks and costs of adopting a floor system of excess reserves, and so the choice between regimes. It is just another dimension of the principle that both policies need to be analysed in the context of the settings of the other policy.
EURGBP Wave Analysis
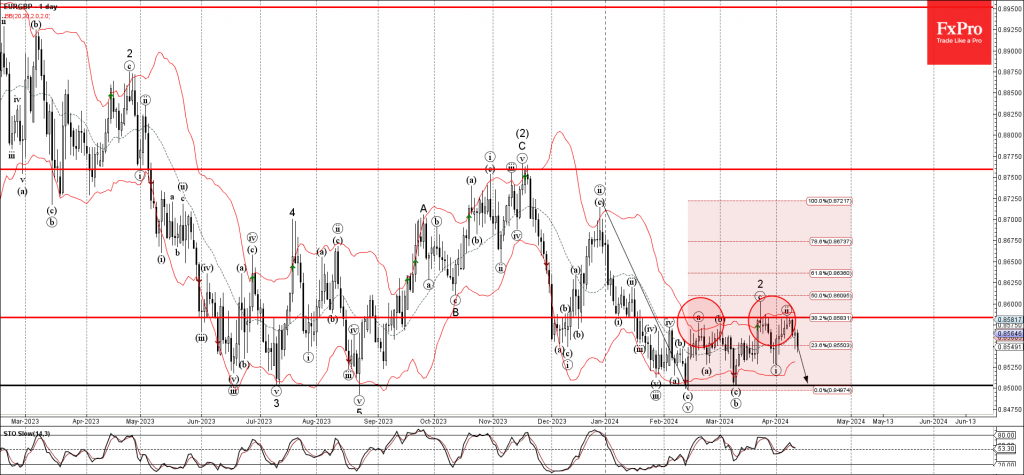
- EURGBP reversed from resistance level 0.8585
- Likely to fall to support level 0.8500
EURGBP currency pair recently reversed down from the pivotal resistance level 0.8585 (which has been reversing the price from February).
The resistance level 0.8585 was strengthened by the upper daily Bollinger Band and by the 38.2% Fibonacci correction of the downward impulse from December.
Given clear daily downtrend and the strongly bullish sterling sentiment, EURGBP currency pair can be expected to fall further to the next strong support level 0.8500 (which has been reversing the price from last July).
ETHUSD Finds Support at 50-day SMA
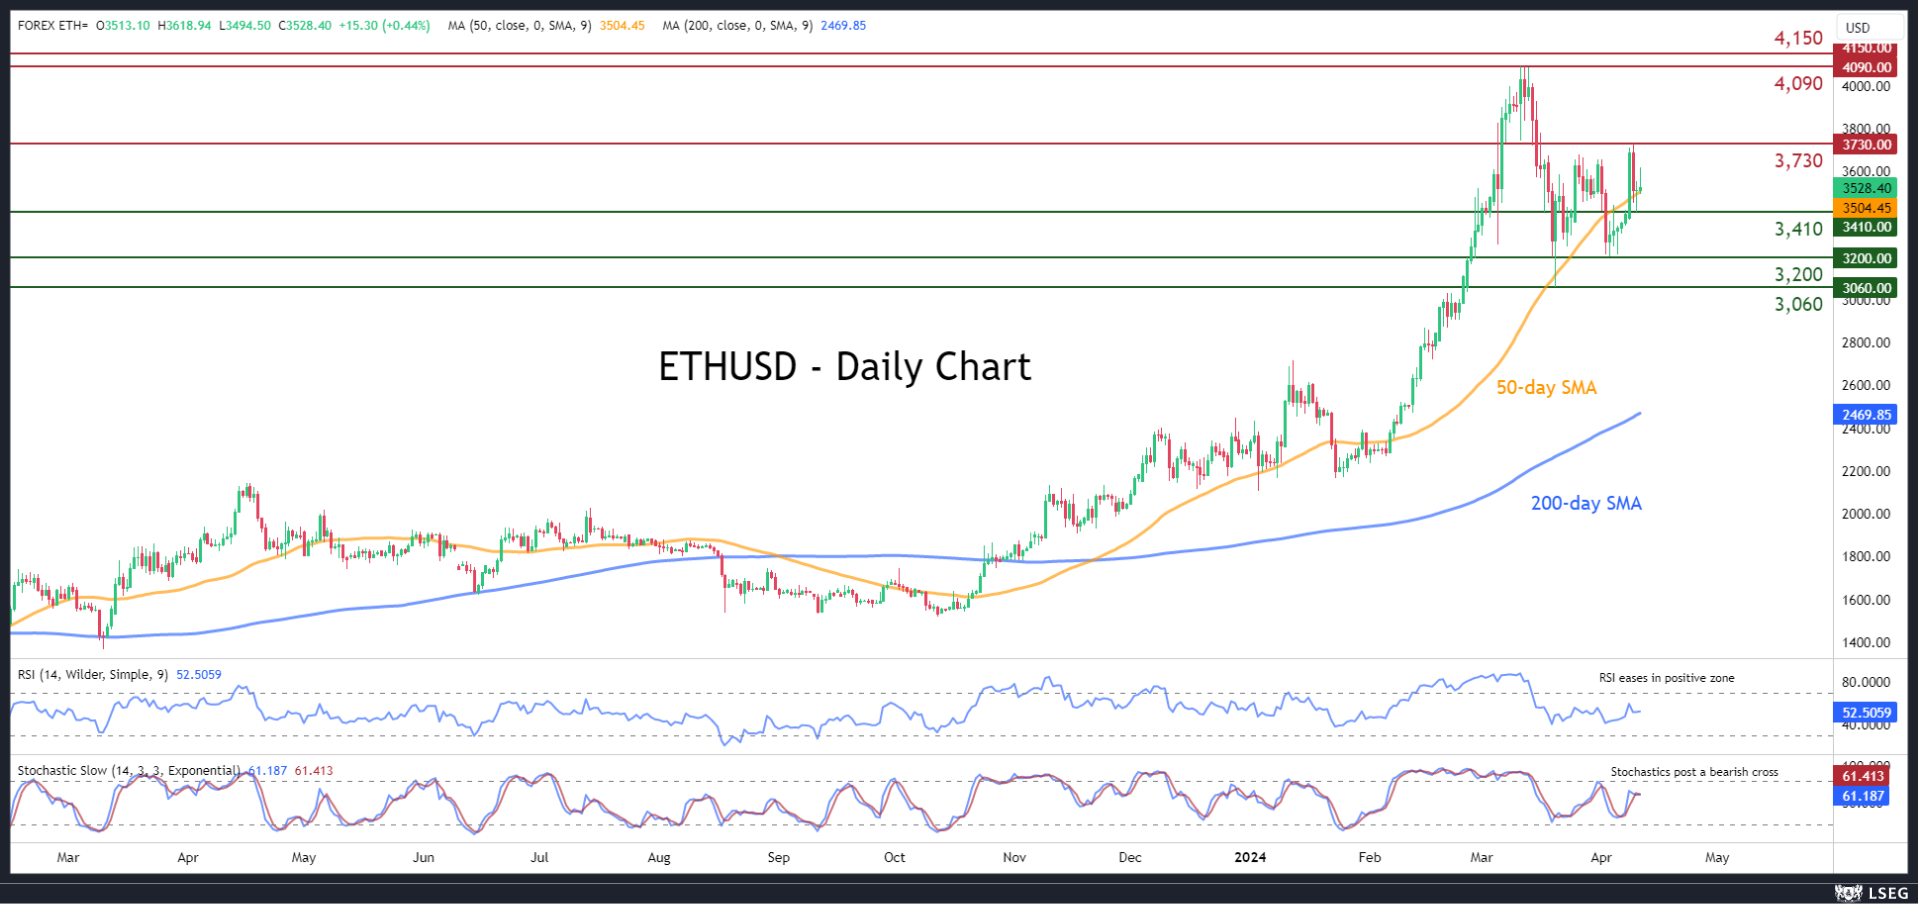
- ETHUSD slides after recording 1-month peak
- But the 50-day SMA curbs its retreat
- Momentum indicators ease in positive zones
ETHUSD (Ethereum) experienced a strong pullback from its 2024 peak of 4,090, dropping to as low as 3,060. This week, the price recorded a fresh one-month high of 3,410 before reversing lower to find solid support at the 50-day simple moving average (SMA).
Should Ethereum bounce off its 50-day SMA and storm higher, immediate resistance could be found at the one-month peak of 3,730. A violation of that zone could pave the way for the 2024 high of 4,090, which is also a two-year high. Failing to stop there, the price may then challenge the December 2021 resistance of 4,150.
On the flipside, if the price pierces through the 50-day SMA, the 3,410 support region could prove to be the first barrier for the bears to clear. Further declines could then come to a halt around the March-April support of 3,200. Even lower, the March bottom of 3,060 could provide downside protection.
Overall, ETHUSD has been struggling to extend its recent recovery, but the ascending 50-day SMA seems to be capping its downside for now. Hence, the short-term picture will remain bullish for as long as the price holds above this crucial barrier.
ECB Review: The Direction is Clear
Today, the ECB decided to leave policy rates unchanged as unanimously expected. A rate cut looks set to come in June, subject to further confidence on the three criteria that have guided ECB policy making through the past year.
The next to no new policy signals left markets largely unchanged.
Limited new signals
The ECB meeting today was relatively uneventful in terms of policy signals and consequently didn't leave a mark on the market. The key sentence of the policy statement was 'If the Governing Council's updated assessment of the inflation outlook, the dynamics of underlying inflation and the strength of monetary policy transmission were to further increase its confidence that inflation is converging to the target in a sustained manner, it would be appropriate to reduce the current level of monetary policy restriction.' while still calling for its 'data-dependent and meeting-by-meeting' approach to monetary policy setting and 'not pre-committing to a particular rate path'.
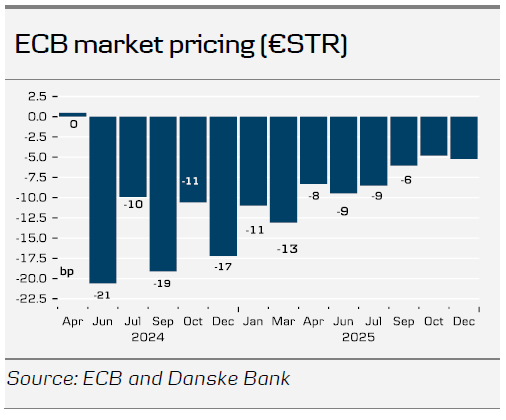
Given that the ECB meeting went basically as expected, see also our ECB Preview - An intention to cut, 5 April 2024, with the ECB guiding for a June rate cut subject to confirmation of the three factors that have guided the ECB's monetary policy setting in the past year (namely the 'updated assessment of the inflation outlook, the dynamics of underlying inflation and the strength of monetary policy transmission'), we continue to like our ECB rate call of a 25bp rate cut call in June, followed by further 25bp rate cuts once per quarter through the end of 2025. That said, and zooming into 2024, we see risks skewed to less than three rate cuts this year, due to the sticky domestic inflation.
No change in the ECB's view on inflation and growth
The ECB has not changed its view on inflation and growth since the March meeting. Lagarde noted that incoming information has broadly confirmed the Governing Council's previous assessment of the medium-term inflation outlook. Indicators of underlying inflation are easing, while wage growth is gradually moderating. However, robust domestic price pressures persist, particularly in the services sector, keeping inflation elevated in that area, posing an upside risk for the inflation outlook. However, firms are absorbing part of the increased labour costs through their profits. Financial conditions remain tight, and previous interest rate hikes continue to dampen demand, contributing to the downward pressure on inflation.
Lagarde said that the economy remains weak, especially due to the manufacturing sector. The ECB expects a gradual recovery in growth led by the service sector, supported by rising real incomes and improved terms of trade. Export growth should pick up as the global economy recovers and spending shifts to goods. Risks to the growth outlook remain tilted to the downside.
Muted market reaction
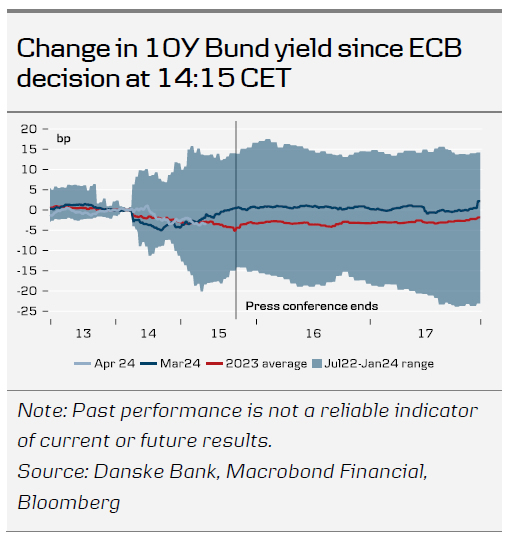
As expected, the market impact was very limited. EUR/USD initially declined slightly on the announcement, reaching around the 1.0715 mark, as the ECB essentially communicated that a cut in June is coming. Shortly after, US PPI figures came out slightly lower than expected, providing some support to EUR/USD and bringing the cross back to the mid 1.07-1.08 range, which is status quo for the day. There were no significant market moves during Lagarde's press conference.
At the current juncture, US data remains the primary driver of EUR/USD. Positioning data has recently shown a significant uptick in long USD positions, now in stretched long territory. This could suggest a potential asymmetric outcome favouring a weaker USD in the short term, especially in response to softer US data. That could potentially give EUR/USD some support in the next couple of months. However, over the full year, we still expect EUR/USD to trend lower. We believe the US economy is fundamentally in a stronger position relative to the euro area, based on factors such as relative terms of trade, real rates, and relative unit labour costs. Additionally, there are clear signs that underlying inflation appears more persistent in the US compared with the euro area. A strong USD, coupled with tighter financial conditions, is necessary for the Fed to sustainably achieve its inflation target of 2%. Our forecast for EUR/USD on a 12M horizon is 1.05.