

Sample Category Title
JPY Carry Trades Downside Pressure Reinforced Ex-post FOMC
- The US Federal Reserve pushed back the first Fed funds rate cut and Fed Chair Powell indicated that the “highly anticipated” March rate cut is not the base case for now.
- The dovish Fed Pivot narrative is still alive as both the 2-year and 10-year Treasury yields continued to inch lower and closed near their session lows.
- The continuation of down-trending US Treasury yields put pressure on JPY carry trades indirectly; AUD/JPY is the worst performing among the G-10 currencies so far.
The US Federal Reserve left its Fed funds rate unchanged at 5.25% to 5.50%, a 22-year high for the fourth consecutive FOMC meeting yesterday and reinforced the guidance that it has likely reached the peak of its current interest rate hike cycle via including a new reference to considering “any adjustments” to the Fed funds rate on its latest monetary policy statement, a shift away from its previous tightening bias.
In addition, Fed officials have thrown cold water to the earlier much anticipated March’s first Fed funds rate cut (from around 70% chance priced-in earlier a month ago to a current 35% odds by the 30-day Fed funds rate futures according to CME FedWatch Tool). They have signaled that a rate cut in the March FOMC meeting is unlikely as such a move is not appropriate until they gain more confidence that inflation is moving sustainably towards 2%.
However, the dovish Fed Pivot narrative for 2024 has not been totally “killed off”. During the Q&A session of the FOMC press conference, Fed Chair Powell painted a balanced tonality on the timing and pace of the upcoming expected interest rate cut cycle.
Dovish Fed Pivot is still alive & JPY carry trades are losing positive carry
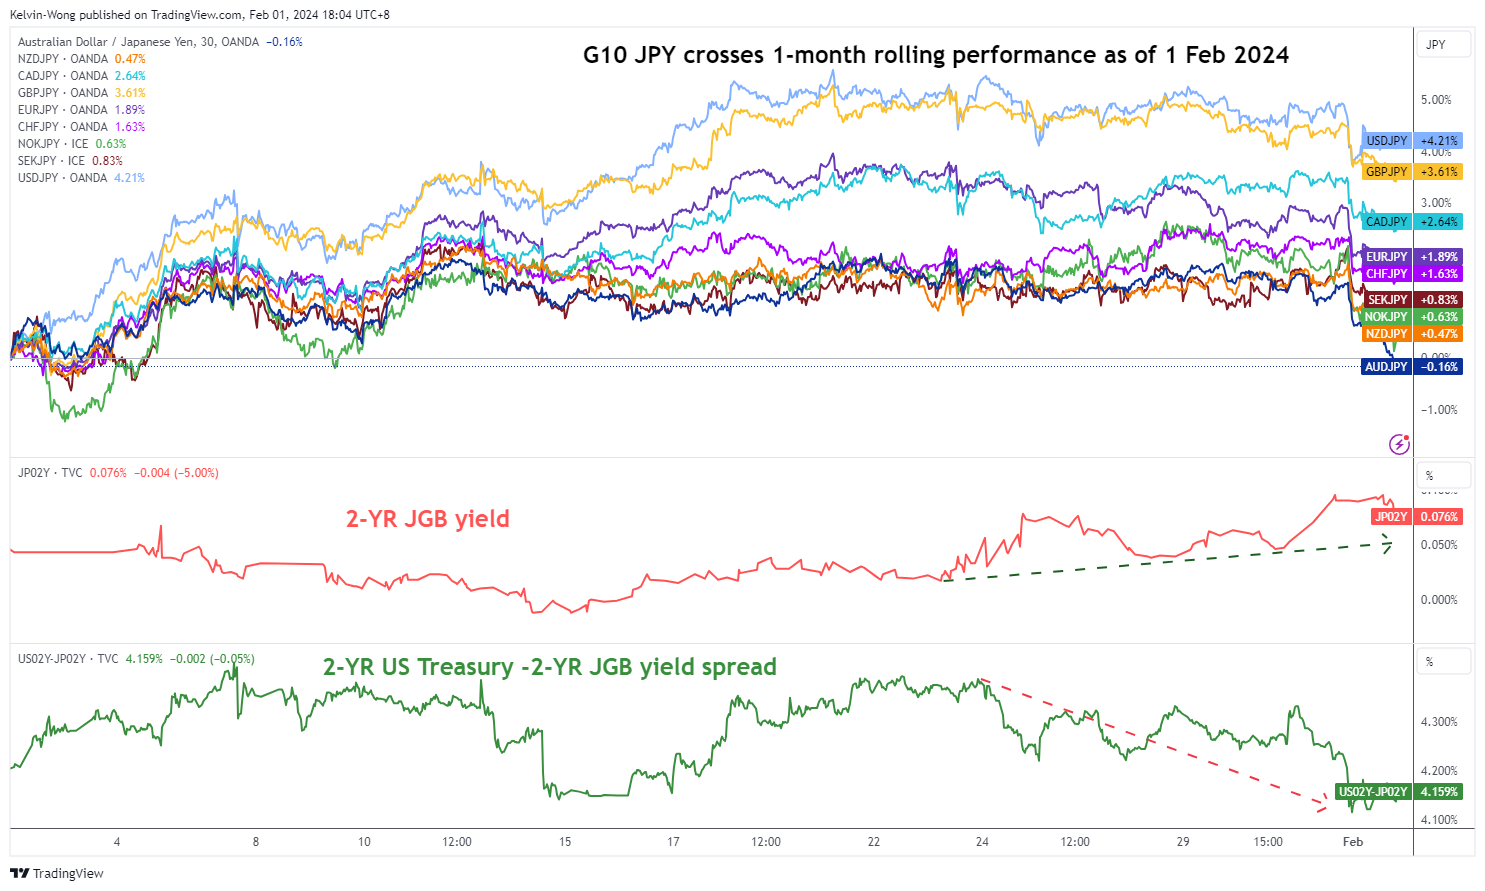
Fig 1: 1-month rolling performances of G-10 JPY crosses as of 1 Feb 2024 (Source: TradingView, click to enlarge chart)
The net effect is liquidity conditions are not being squeezed tightly as the Fed’s monetary policy-sensitive 2-year US Treasury yield ended yesterday, 31 January US session near its session low at 4.21% (-13 bps), and similar observations can be seen in the 10-year Treasury yield, the benchmark for long-term funding rate as it closed down by -12 bps to 3.92%, and traded below its 200-day moving average for the third consecutive day.
Given that the US Fed is still on the path of embarking on an accommodating monetary policy with the first interest rate cut now being pushed further to May’s FOMC (62% chance now at this time of the writing, up from 50% chance priced in a week ago according to the CME FedWatch Tool), in contrast to the Bank of Japan’s recent hawkish guidance on the “soon to be removed” short-term negative interest rates in Japan.
Hence, the 2-year US Treasury yield premium over the 2-year Japanese Government Bond (JGB) has continued to shrink significantly to trade now at 4.15%, a 10-month low from a high of 5.16% printed in mid-October 2023.
The persistent bout of US Treasury-JGB yield premium shrinkage has continued to put downside pressure on long-biased JPY-denominated carry trades in the foreign market as the positive carry diminishes due to higher funding costs as well from a rising 2-year JGB yield since mid-January 2024 (from 0% to 0.08%).
Among the G-10 JPY crosses, the worst hit so far is the AUD/JPY (-0.2%) based on a 1-month rolling performance basis (see Fig 1).
AUD/JPY bearish breakdown below 50-day moving average
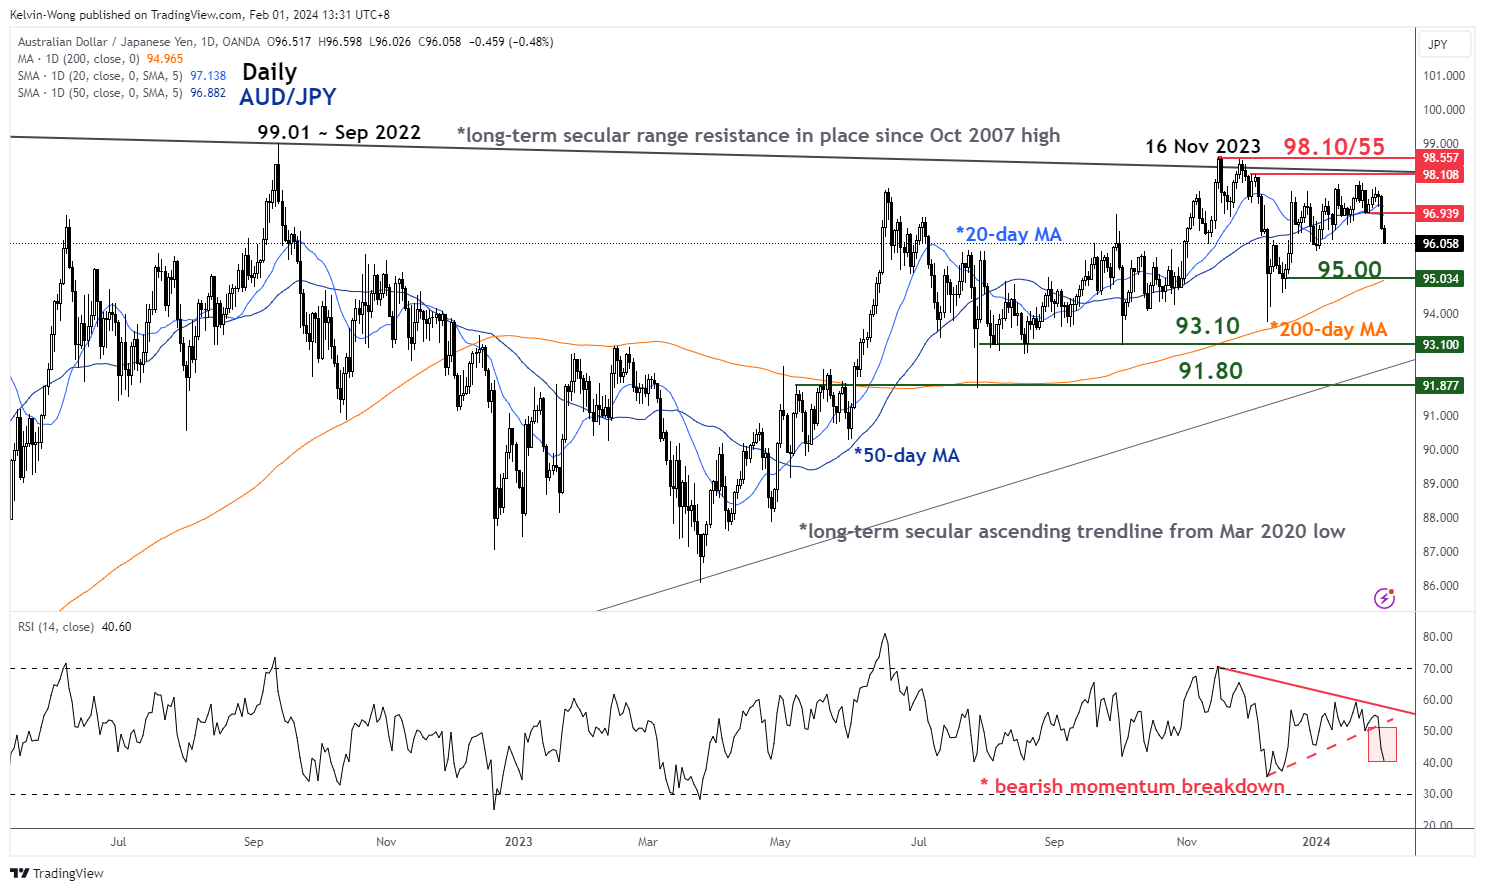
Fig 2: AUD/JPY medium-term trend as of 1 Feb 2024 (Source: TradingView, click to enlarge chart)
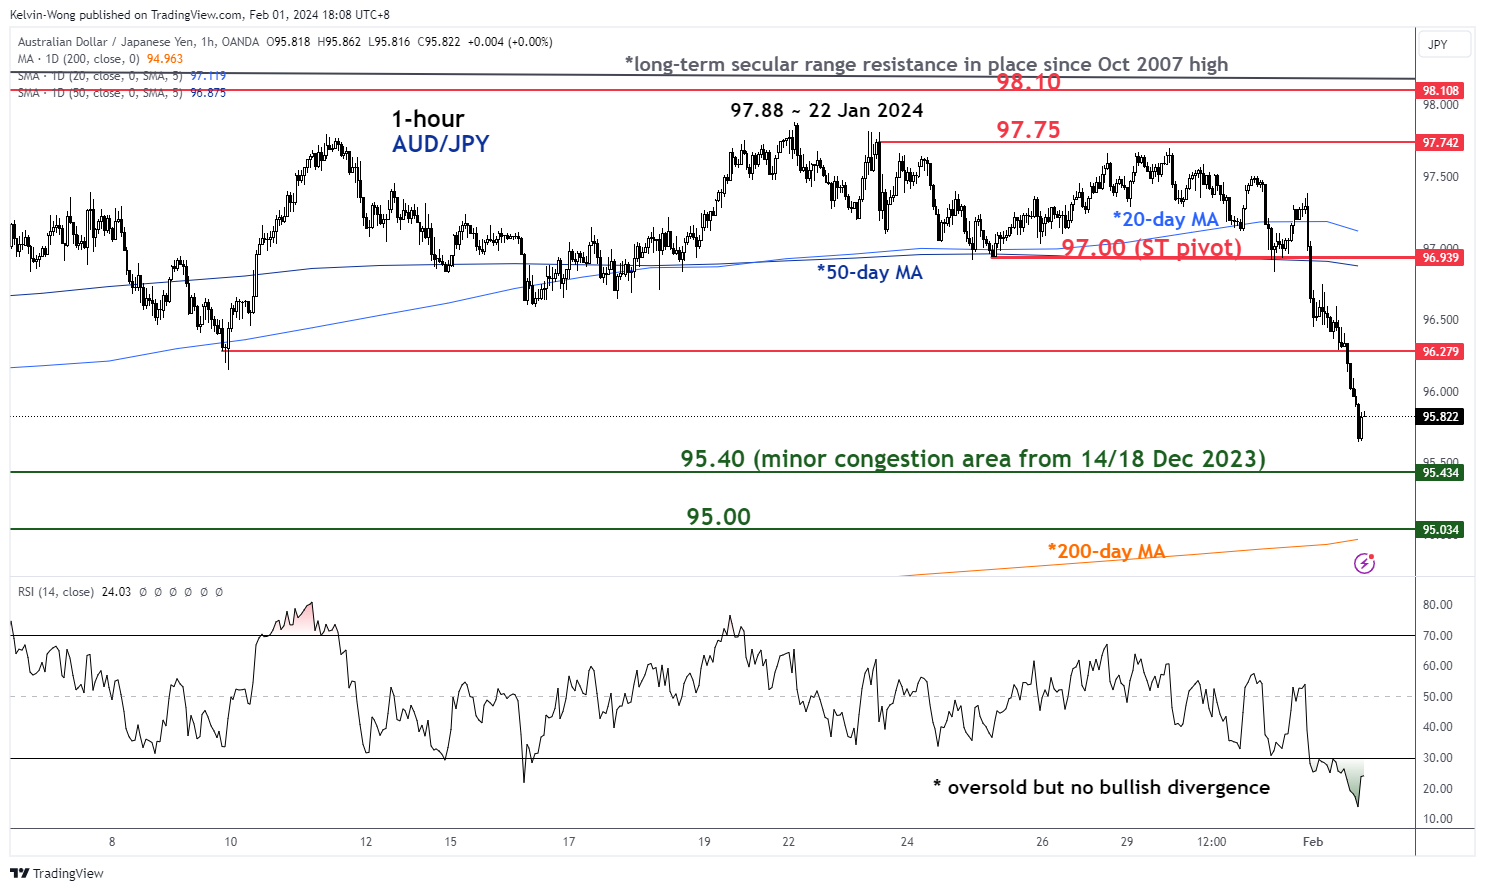
Fig 3: AUD/JPY short-term trend as of 1 Feb 2024 (Source: TradingView, click to enlarge chart)
After a recent retest close to the 98.10 long-term secular range resistance from the October 2007 swing high on 22 January 2024 (printed an intraday high of 97.88), the momentum has been bearish on the AUD/JPY as illustrated by the downward sloping daily RSI momentum indicator.
Yesterday’s price action has broken below the 20-day and 50-day moving averages which reinforces at least a short to medium-term negative feedback loop into the AUD/JPY.
Right now, the hourly RSI momentum indicator has collapsed into its oversold region (without any clear bullish divergence condition) after a rapid decline inflicted during today’s 1 February Asian session which in turn may see a minor snap-back rebound for AUD/JPY towards around the near-term resistance at 96.30.
If the 97.00 key short-term pivotal resistance is not surpassed to the upside, the odds are still skewed towards the bearish side for AUD/JPY to expose the next intermediate supports at 95.40 and 95.00 (also the 200-day moving average) in the first step.
However, a clearance above 97.00 invalidates the bearish tone for AUD/JPY to see the next intermediate resistance coming in at 97.75.
USDCHF Selling The Pair At The Blue Box Area
Hello fellow traders. In this technical article we’re going to take a quick look at the Elliott Wave charts of USDCHF published in members area of the website. As our members know, the pair is bearish against the 0.9246 pivot. Our team recommended members to avoid buying , while keep favoring the short side in the pair. Recently we got recovery that reached our selling zone. The pair found sellers and made reaction from the blue box as expected. In the further text we are going to explain the Elliott Wave Forecast and trading strategy.
USDCHF Elliott Wave 4 Hour Chart 01.23.2024
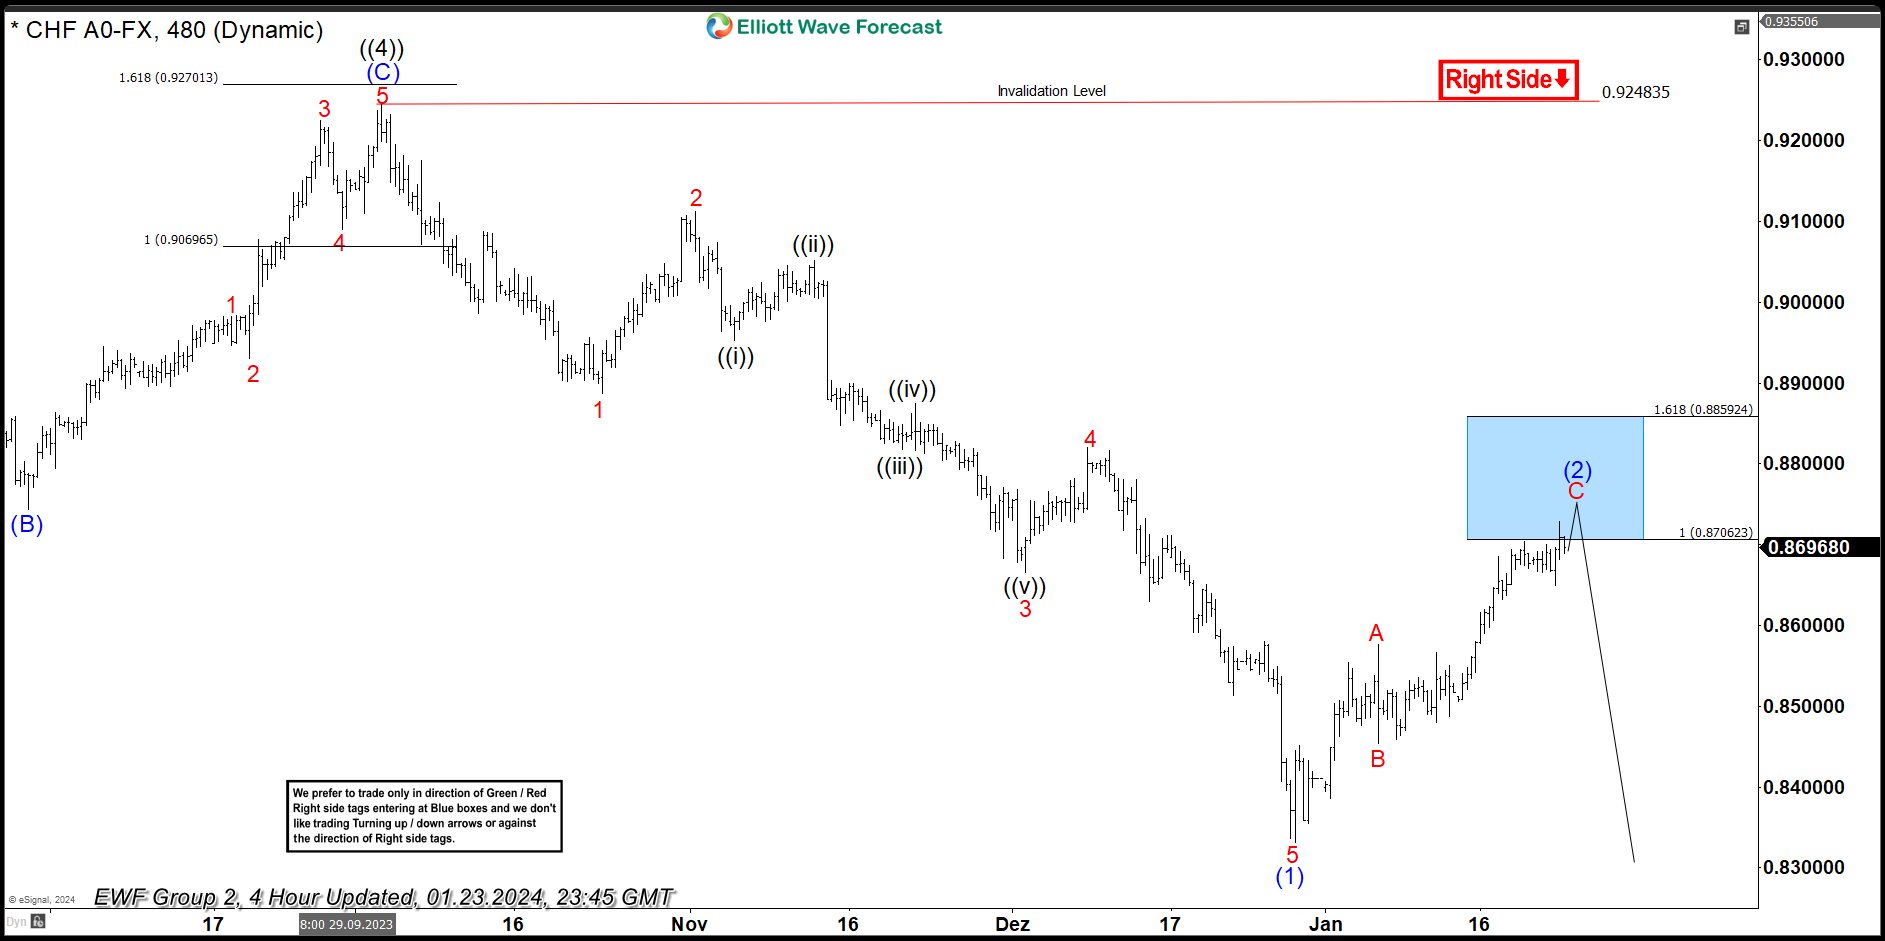
The pair ended cycle from the 0.92483 peak as 5 waves structure -(1) blue. Currently USDCHF is giving us (2) blue recovery which is unfolding as Elliott Wave Zig Zag Pattern. The price has reached extreme zone at 0.8706-0.8859 ( Blue Box – sellers zone). We don’t recommend buying the pair and prefer the short side from the blue box- equal legs zone. As the main trend is bearish, we expect to see at least 3 waves pull back from our selling zone. Once decline reaches 50 Fibs against the B red low , we will make short position risk free ( put SL at BE) and take partial profits. Invalidation for the short trades is break above 1.618 fib ext : 0.8859
Quick reminder:
Our charts are easy to trade and understand:
Red bearish stamp+ blue box = Selling Setup
Green bullish stamp+ blue box = Buying Setup
Charts with Black stamps are not tradable. 🚫
USDCHF Elliott Wave 4 Hour Chart 01.21.2024
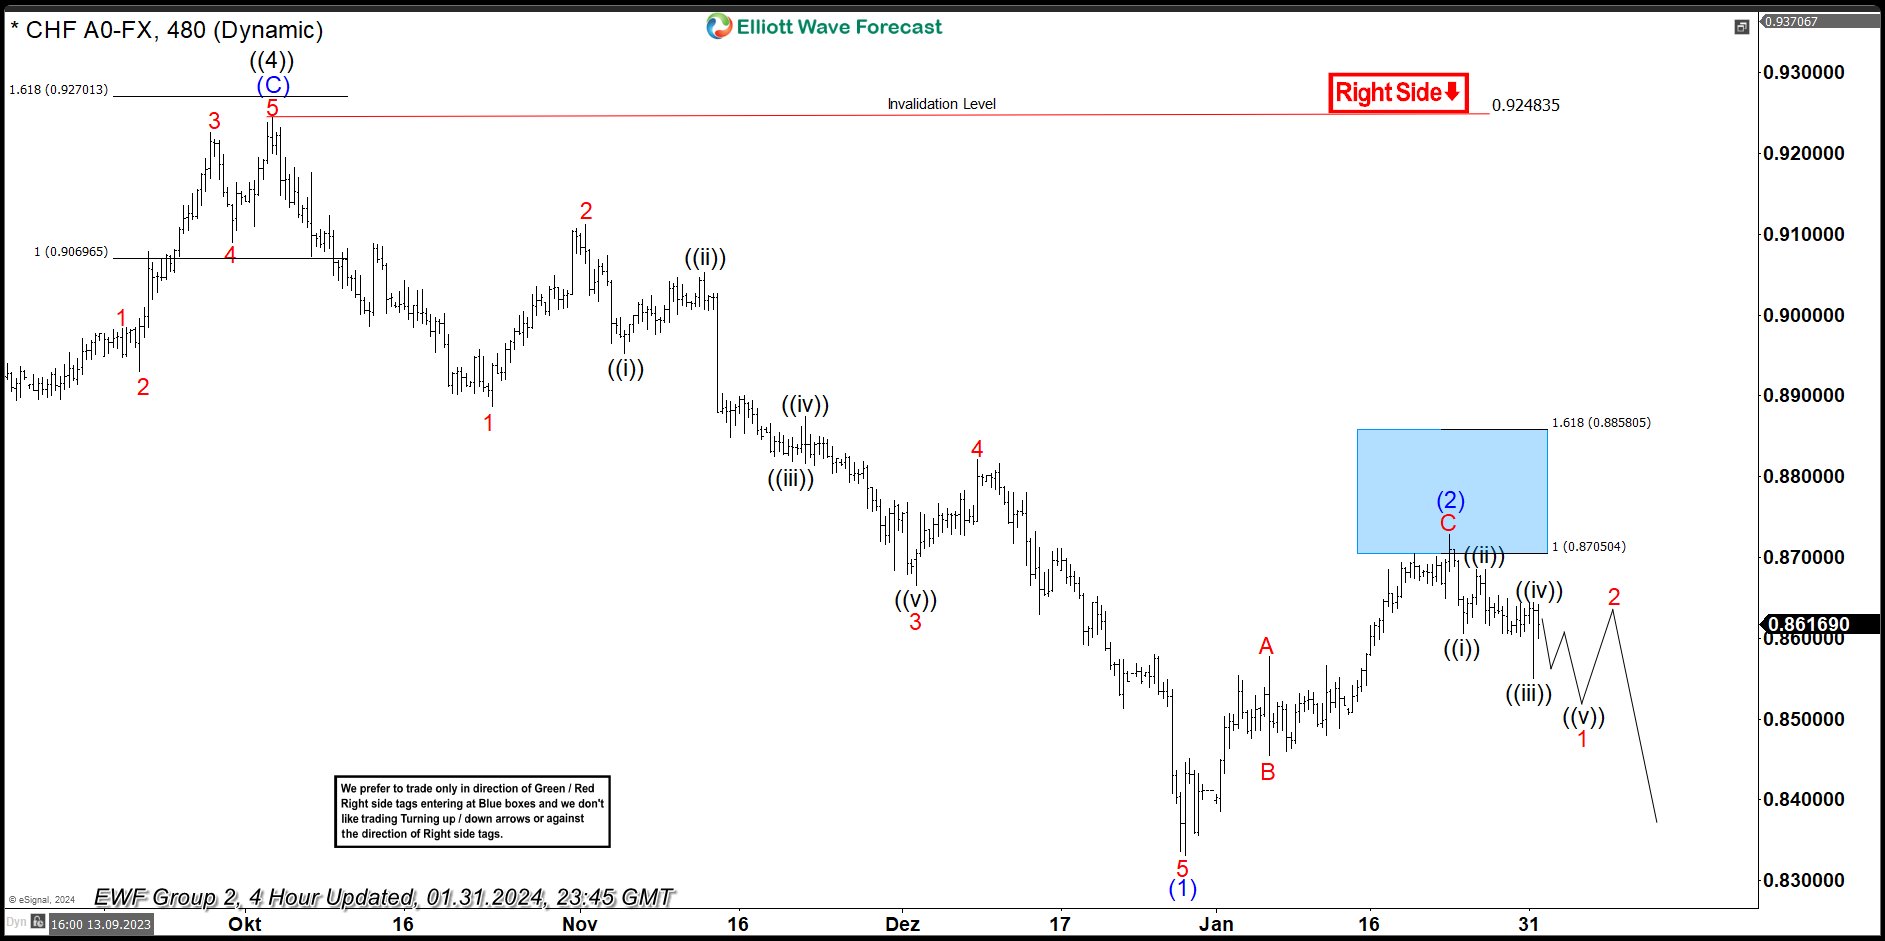
The pair found sellers right at the Blue Box area : 0.8706-0.8859 . Recovery completed at the 0.8727 high and we are getting good reaction from the selling zone. Decline reached and exceeded 50 fibs against the connector’s low. So members who took the short trade are enjoying profits now in a risk free positions. While below 0.8727 high, next leg down can be in progress toward new lows. However we would need to see break of (1) blue low to confirm.
EURCHF Retains Bearish Bias; Next Support at All-Time Low
- EURCHF holds beneath the 20- and 50-day SMAs
- MACD and RSI strengthens negative momentum
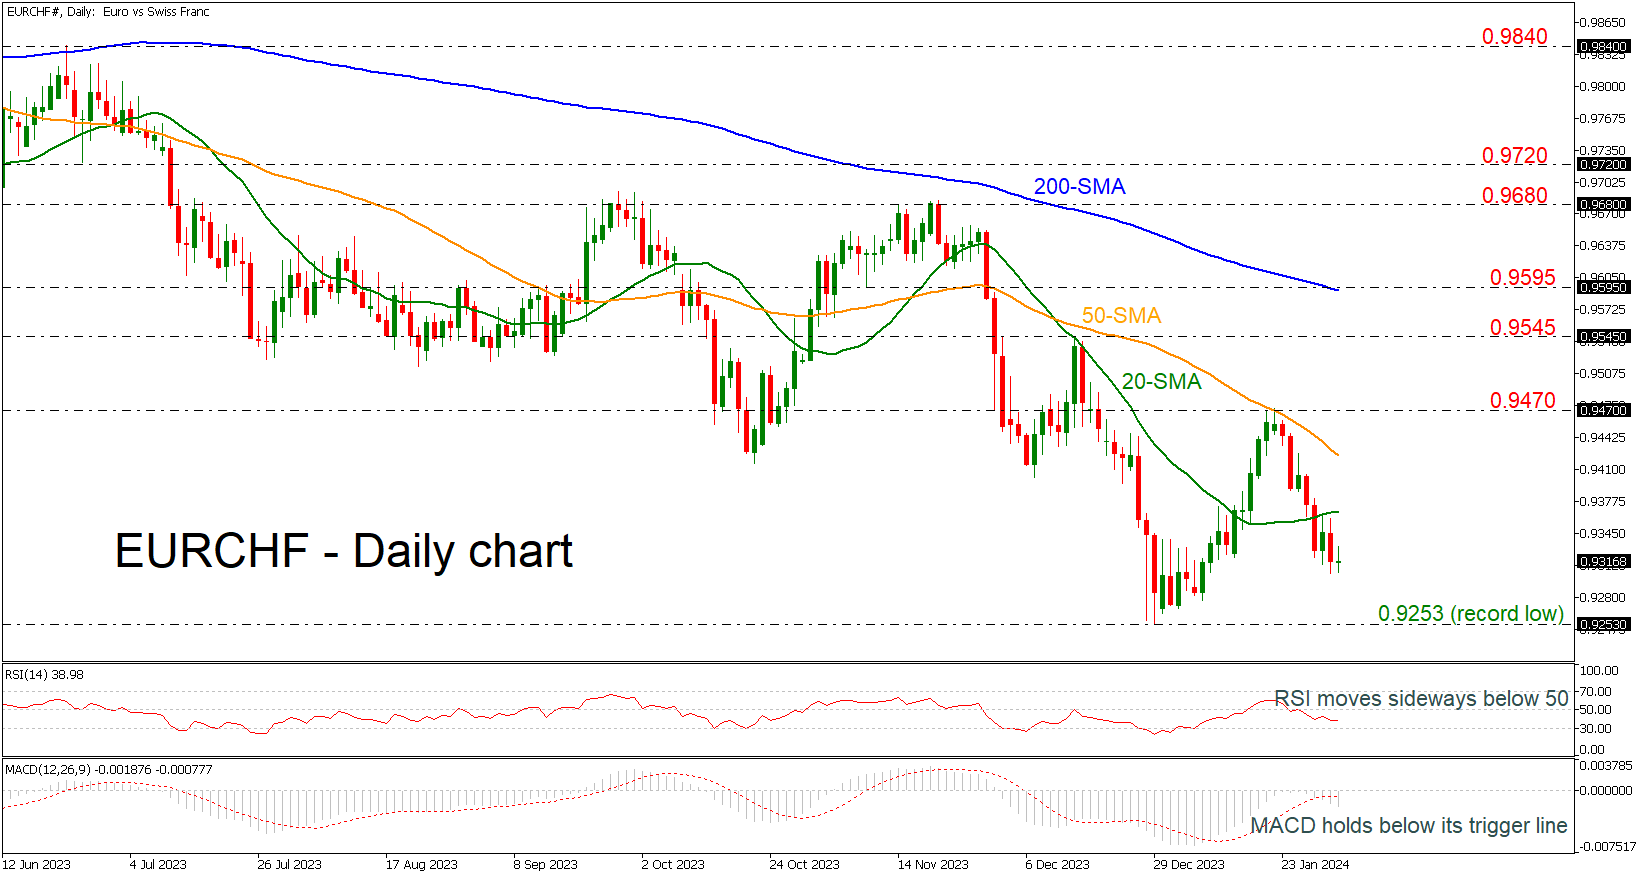
EURCHF is posting a leg to the downside after the pullback from the 0.9470 resistance level, heading towards the previous record low of 0.9253. The technical oscillators are endorsing the current picture on the price. The RSI is falling within the 30 to 50 area, while the MACD is strengthening its bearish structure below zero.
Immediate support level could come from the all-time low of 0.9253 before the market tumbles to uncharted territory. The next psychological marks such as 0.9200 and 0.9100 may halt downside movements.
Alternatively, a rebound off 0.9253 may take the price towards the 20- and then the 50-day simple moving averages (SMAs) at 0.9370 and 0.9425 respectively. Beyond those lines, the previous peak of 0.9470 could be a key level to watch ahead of 0.9545 and the 200-day SMA at 0.9595.
Turning to the medium-term picture, the bearish outlook came back into play after the pair posted a fresh record low of 0.9253. A jump above the 200-day SMA would restore a neutral mode. For a bull market though traders need to wait for a clear close above 0.9840, taken from the top in June 2023.
Overall, EURCHF holds a bearish profile both in the short and the medium-term.
Bitcoin More Comfortable Staying Lower
Market picture
Crypto followed equity indices lower on Wednesday evening. Cautious buying is seen in the market on Thursday. The crypto market capitalisation now stands at $1.62 trillion, 1.9% lower than 24 hours ago.
Solana remains one of the most volatile of the leading altcoins, down 4.7%. XRP, down 2.6%, continues to slide, losing nearly 20% in 30 days.
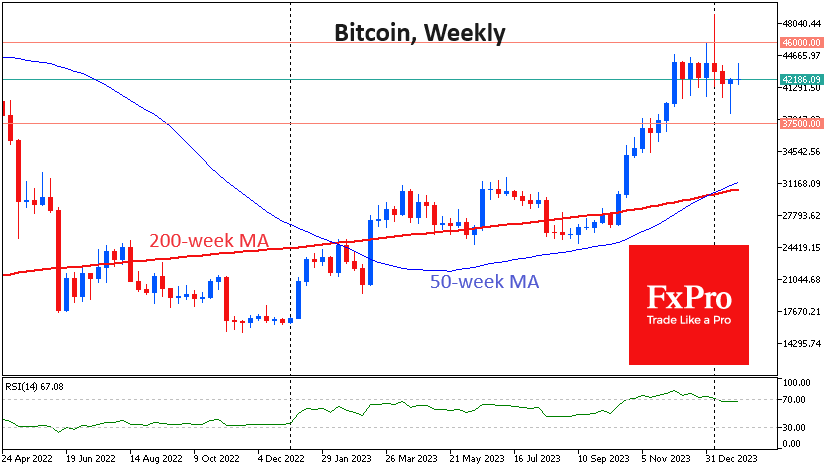
Bitcoin started the week on Thursday morning, getting support from buyers on the way down towards $42K. Technically, we saw a worrying pullback below the 50-day MA, suggesting an increased chance of further declines. We see evidence of the same on the weekly timeframe. After seven weeks of tight sideways trading and a spike higher, a move lower has been implied. This did not materialise last week, but the price is now cruising below the centre of gravity of the last consolidation.
News background
Bitcoin could reach a new high of $125K by the end of 2025, and its price fluctuations will become “more stable”, according to Marathon Digital CEO Fred Thiel. BTC will reach a new all-time high in late Q3 or early Q4 2024 but will then decline to $40K-$50K. A gradual rise to a new ATH of $120K will then follow in early 2025.
Ethereum developers have successfully implemented the Dencun (Deneb-Cancun) hard fork in the ecosystem’s second test network, Sepolia. On 17 January, the deployment of the upgrade in the Goerli testnet caused the chain to split. The Ethereum team was able to make the necessary changes and complete the hard fork within four hours.
The SEC will approve spot Ethereum ETFs on 23 May, by which time the price of the second cryptocurrency will reach $4,000, Standard Chartered predicts. The bank expects the regulator to follow the same strategy for Ethereum as it did for Bitcoin.
According to The Block, the trading volume of Ethereum options reached a record $20 billion in January. Most of the activity was concentrated on call options with a strike price of $2,500 on 23 February. In other words, a significant portion of traders expect ETH to break above $2500 by the end of the month.
Visa has partnered with Web3 payment infrastructure provider Transak to enable the conversion of cryptocurrencies into fiat money on bank cards. According to Transak, the service is available in more than 145 countries.
Natural Gas Prices Recover from 3.5-year Lows
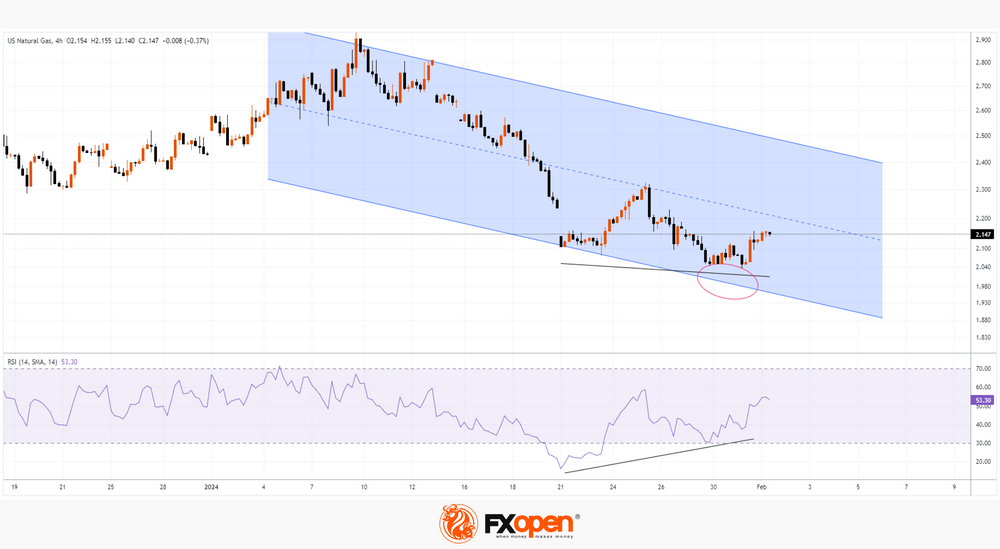
As the chart shows, the price of XNG fell below 2.040 on January 31 for the first time since August 2020. This was facilitated by:
→ seasonal trend, because towards the end of winter the price of natural gas tends to fall;
→ weather data. Temperatures could remain above average and snowfall amounts will decrease across North America, according to the U.S. Climate Prediction Center and AccuWeather.
However, the chart shows signs of increased demand:
→ the RSI indicator forms divergence;
→ the bears were unable to reach the lower boundary (shown on the chart) of the downward channel.
Signs of increased demand could come from short covering after the XNG price fell by more than 25% this year, as well as sentiment ahead of the release of news on gas reserves (today at 18:30 GMT+3).
It is possible that the news release will provoke even greater demand activity, and the XNG price will reach the median line of the shown channel.
This article represents the opinion of the Companies operating under the FXOpen brand only. It is not to be construed as an offer, solicitation, or recommendation with respect to products and services provided by the Companies operating under the FXOpen brand, nor is it to be considered financial advice.
Eurozone CPI down to 2.8%, core falls to 3.3%, both above expectations
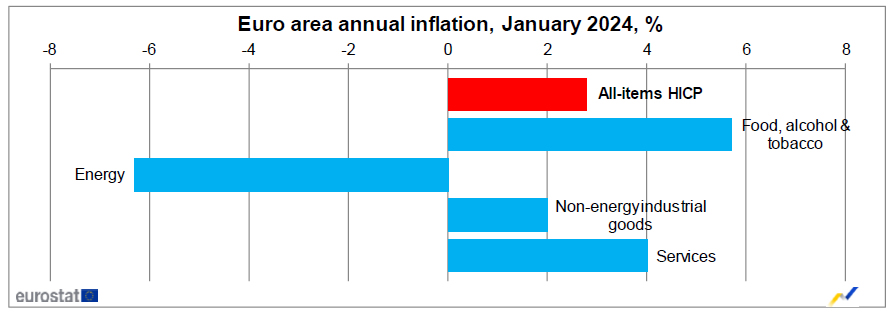
Eurozone CPI slowed from 2.9% yoy to 2.8% yoy in January, above expectation of 2.7% yoy. CPI core (excluding energy, food, alcohol & tobacco) slowed from 3.4% yoy to 3.3% yoy, above expectation of 3.2% yoy.
Looking at the main components, food, alcohol & tobacco is expected to have the highest annual rate in January (5.7%, compared with 6.1% in December), followed by services (4.0%, stable compared with December), non-energy industrial goods (2.0%, compared with 2.5% in December) and energy (-6.3%, compared with -6.7% in December).
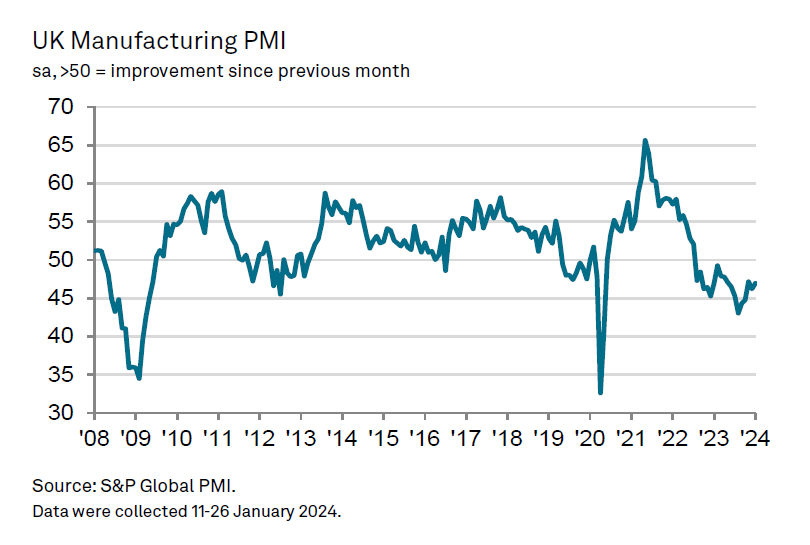
UK PMI manufacturing finalized at 47.0, challenged by cost pressures and supply disruptions
UK PMI Manufacturing was finalized at 47.0 in January, up from December's 46.2. This modest improvement, however, did not signal an end to the sector's downturn, with continued contractions observed across key areas.
Rob Dobson, Director at S&P Global Market Intelligence, highlighted the pervasive nature of the contraction, noting declines in output, new orders, and employment across various manufacturing sub-industries. He pointed out that manufacturers are adopting a cost-cautious approach, focusing on cutting back on purchasing and stock holdings to improve efficiency, maintain cash flow, and protect margins in these challenging times.
The industry faces compounded difficulties due to the ongoing "Red Sea crisis", which is exacerbating supply chain disruptions. The rerouting of inputs from the Asia-Pacific region is leading to increased costs and longer supplier lead times, intensifying the strain on production schedules and amplifying inflationary pressures. This situation is particularly problematic as manufacturers grapple with weak domestic and international demand.
GBPUSD Relies on Support Levels as Bears Stay in Play
- GBPUSD exposed to more declines in the short-term
- Outlook to stay neutral as long as the price holds above 1.2485
- BoE policy announcement due at 12:00 GMT
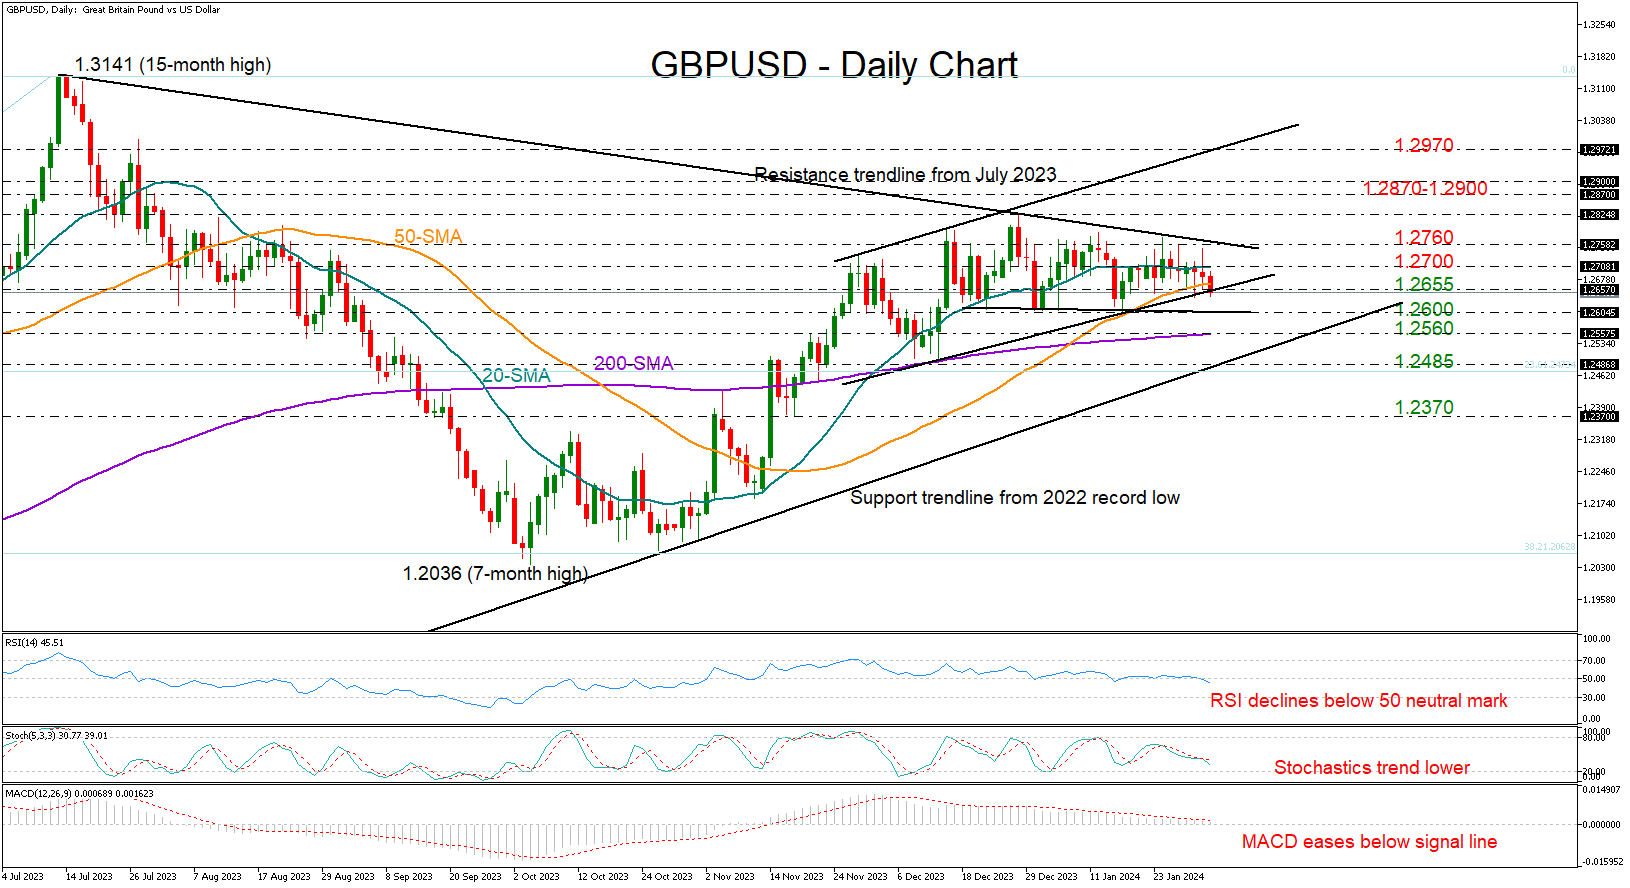
GBPUSD came under renewed downside pressure on the first trading day of February, feeling the blues from Powell’s hawkish rate message.
The pair is currently testing the short-term support trendline from December’s lows at 1.2647, but the technical indicators cannot guarantee a rebound in the coming sessions. The RSI has slid below its 50 neutral mark, the stochastic oscillator is drifting southwards, and the MACD remains negatively charged below its red signal line.
Moreover, the pair could not successfully close above the 20-day simple moving average (SMA), nor it could reach the resistance trendline from July 2023 at 1.2760, increasing the risk for a bearish breakout ahead of the Bank of England’s rate announcement.
Despite the bearish vibes in the market, there are a couple of key support levels, which could still cool selling forces. The area of 1.2560-1.2600 could come first into view ahead of the crucial ascending trendline at 1.2485, which connects the September 2022 record low and the October 2023 trough. A decisive close below the latter would shift the outlook from neutral to bearish, likely intensifying the decline towards the 1.2370 bar.
In the event of an upside reversal, the bulls might attempt to push above the 20-day SMA at 1.2700 and beyond the resistance trendline from July 2023 at 1.2760. If they succeed, the price could increase straight up to December’s high of 1.2826, while higher, it could retest the 1.2870-1.2900 region before gearing up to meet the ascending line from November currently around 1.2970.
Summing up, downside pressures could persist in GBPUSD, but any potential declines may not upset traders unless the pair crosses below 1.2485.
News from the Fed Push Down EUR/USD Price to a Year Low
Financial markets were buoyant last night due to news from the Fed. Interest rates remained unchanged — as expected. However, somewhat unexpected was the harsh rhetoric of Jerome Powell, who said that:
→ interest rate reduction in March is unlikely;
→ the Fed needs to see more data to be confident in the rate change.
This cooled financial market expectations for a rate cut in March, which in turn led to a strengthening of the US dollar relative to other currencies and a decline in stock indices, with risk assets falling especially sharply.
The strengthening of the US dollar caused the EUR/USD rate to drop below 1.079 today for the first time since mid-December last year.
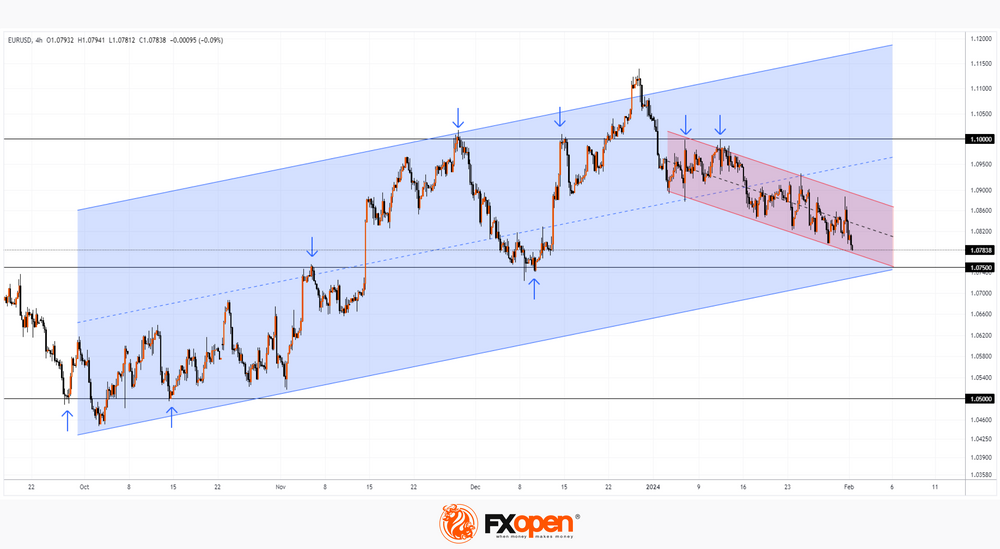
The EUR/USD chart today shows that the price is falling towards the lower border of the ascending channel (shown in blue), and the market is very sensitive to psychological levels:
→ the level of 1.100 (which we paid attention to in the analysis on November 29 and December 15) in January acted as an important resistance twice, preventing the price from rising.
→ Level 1.075, from which reversals were formed, may provide support. Bulls can also pin their hopes on it, since the lower boundary of the ascending channel passes near the level of 1.075.
→ The 1.050 level seems unattainable - but who knows, if the Fed continues to keep rates high “for as long as necessary,” this could lead to a breakdown of the ascending channel, opening the way to support 1.05.
This article represents the opinion of the Companies operating under the FXOpen brand only. It is not to be construed as an offer, solicitation, or recommendation with respect to products and services provided by the Companies operating under the FXOpen brand, nor is it to be considered financial advice.
Eurozone’s manufacturing PMI finalized at 46.6, persistent contraction with glimmers of hope in the south
Eurozone PMI Manufacturing was finalized at a 10-month high of 46.6 in January, up from December's 44.4. Despite this, caution is advised as the index still hovers below the critical expansion threshold. Cyrus de la Rubia, Chief Economist at Hamburg Commercial Bank, highlights that although there's been a consistent rise over the past three months, including in forward-looking indicators like new orders, the majority of the sub-indices, including the headline index, remain in the contraction zone.
This rebound in manufacturing is particularly evident in the "southern economies", with Greece leading at a 21-month high of 54.7 and both Spain (49.2) and Italy (48.5) showing encouraging trends. However, among the largest Eurozone economies, Germany, despite an 11-month high, remains in contraction at 45.5, and France's economic situation continues to be concerning, at 43.2.
The upward trend in sub-indicators such as stock of purchases, backlogs of work, and output, along with a growing optimism for higher output in the coming year, offers a glimmer of hope. This gradual recovery in the manufacturing sector, spearheaded by the southern economies, may serve as a crucial catalyst to pull the larger Eurozone economies out of the recessionary environment.