Sample Category Title
WTI Oil Price Falls Sharply, On Track for Biggest Daily Loss Since Mid-November
WTI oil price fell nearly 5% on Monday, deflated by decision of top oil exporter, Saudi Arabia, to cut February selling price to Asia to the lowest in over two years and rise in OPEC output.
The measures partially counter persisting supply fears over rising geopolitical tensions in the Middle East and may limit the latest price drop.
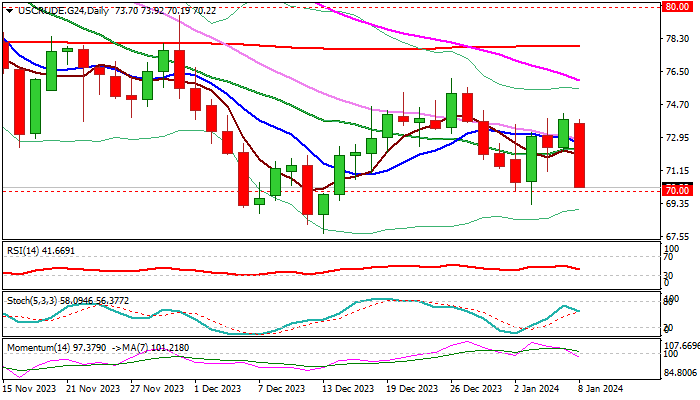
Fresh weakness has so far retraced the largest part of last week’s $69.27/$74.22 recovery leg and pressuring psychological $70 support.
Loss of pivots at $70/$69.27 (psychological / Jan 3 low) would further weaken near-term structure on completion of failure swing pattern on daily chart and risk retest of Dec 13 low at $67.70 (five-month low).
Weakening structure on daily chart (MA’s turned to full bearish setup / falling 14-d momentum broke into negative territory) support the action, with limited upticks (under $72.00 zone) to keep bears in play and offer better selling levels, in the environment of favorable fundamentals.
Res: 70.93; 71.93; 72.22; 72.93.
Sup: 70.00; 69.70; 69.27; 68.79.
Sunset Market Commentary
Markets
This week’s opening session had little to offer, especially not coming on the heels of last week’s spectacular opening week including US activity/labour data and EMU inflation numbers. Their outcome and the market reaction to them suggests that the bullish bond correction since the early November FOMC meeting is over, making way for more neutral, sideways action ahead. EMU EC confidence data for December were today’s sole economic highlight. Sentiment improved unexpectedly (96.4 from 94; highest since May) on the back of a rebound in services confidence. Central bank comments were scarce with ECB Vujcic the sole on the wire. He expects inflation to slow gradually and believes that the ECB probably won’t be discussing rate cuts before Summer. That contrasts sharply with money markets discounting a first 25 bps rate cut as soon as April, taking the cumulative amount of rate cuts as high as 150 bps by year-end. German Bunds underperform US Treasuries today. German yields add 3.5 bps to 4 bps across the curve whereas daily US yield changes are broadly flat at the moment. The US Treasury’s mid-month refinancing operation (including 10y & 30y sales) and CPI inflation numbers (Thursday) are this week’s key talking points across the Atlantic. EUR/USD is currently changing hands near 1.0960 after spending most of the day just below 1.0950. Key European and US stock benchmarks record gains of up to 0.50%.
The Kingdom of Belgium is expected to launch its 100th OLO benchmark via syndication tomorrow. The bond will have a 10yr maturity (Oct2034) and is the debt agency’s first initiative to fund this year’s €52.92bn gross financing requirement. This covers a €21.48bn deficit (net financing), €29.27bn maturing debt and €1.50bn of planned pre-funding. Gross borrowing is €5.62bn higher than last year. A €4bn decline in the cash deficit is more than offset by an €8bn uptick in debt redemptions. The bulk of this year’s funding will be raised through OLOs for an amount of €41.00bn with the option to fund another €2bn under EMTN & Schuldscheine programmes. The debt agency expects to raise €2bn through retail State Notes, of which the maturities vary between 3, 5, 8 and 10 year. Doing so, the Belgian debt agency realizes a long-term funding comparable to 2023. To fill the remaining gap, the agency turns to short term debt instruments. The outstanding stock of Treasury Certificates is expected to increase by €4.72bn (to €25bn) while there will made almost full use of the structurally higher cash surpluses for an amount of €11.60bn. The anticipated issuance of a new €13.5bn 1-yr State Note compensates for the sharp outflow when the September 2023 one (€21.9bn) expires later this year. The Note needs to be launched before June 30 if the preferential fiscal regime is retained.
News & Views
Swiss inflation stagnated month-on-month in December. In defying expectations for a minor 0.1% decline, the yearly figure accelerated slightly more than anticipated, from 1.4% to 1.7%. The speedier price rises are no major surprise and are in part the result of ongoing rent hikes after the key reference rate rose twice. Electricity and gas prices also added. Inflation is seen higher for some months to come, also supported by a VAT boost in force since January this year. That said, it’s still comfortably within the Swiss National Bank’s 0-2% target. Together with a historically strong CHF dampening (imported) prices, there’s probably little need for the central bank to move from the sidelines. It has hit the pause button at a policy rate of 1.75% since September last year. EUR/CHF marginally loses ground today. The pair has been extensively testing the 0.93 big figure over the past few days and trades around the strongest CHF levels since the huge spike higher following the removal of the price cap in January 2015.
Brent oil declines more than $2/b today, trading around $76. The drop was triggered by Saudi Arabia announcing a bigger-than-expected reduction for its Middle Eastern flagship Arab light crude supplies. The move underscores the soft nature of the physical market, which in this case also includes China. The fact that it’s the de facto OPEC+ leader doing so carries great signaling power. One of the assets suffering collateral damage from the oil price drop is the Norwegian krone. EUR/NOK extends a bottoming out process that started end 2023 with a 0.8% advance today to 11.365. The EUR/NOK 11.40 area serves as a first resistance before 11.60 pops up as the more daunting test.
EUR/USD Mid-Day Outlook
Daily Pivots: (S1) 1.0881; (P) 1.0939; (R1) 1.1002; More...
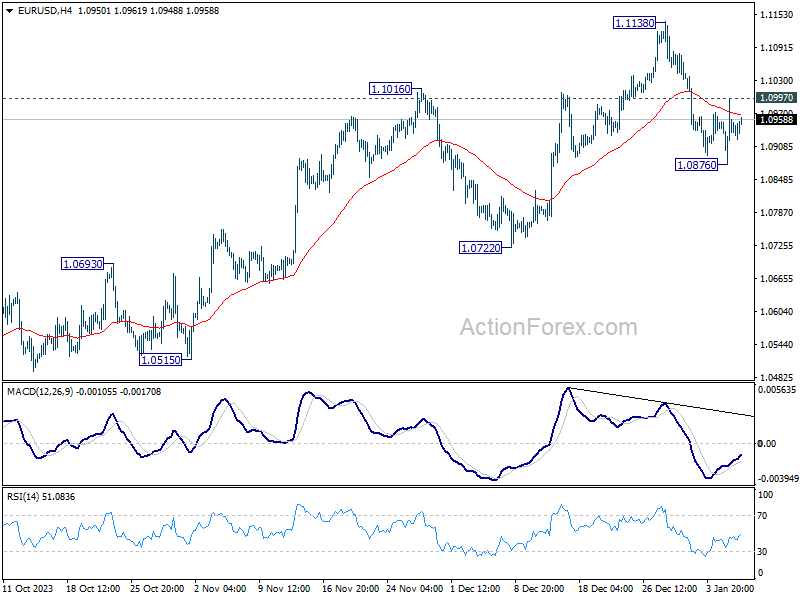
Outlook in EUR/USD is unchanged and intraday bias stays neutral. On the downside break of 1.0876 will resume the fall from 1.1138 short term top to 1.0722 support next. However, break of 1.0997 will turn bias back to the upside for retesting 1.1138 high instead.
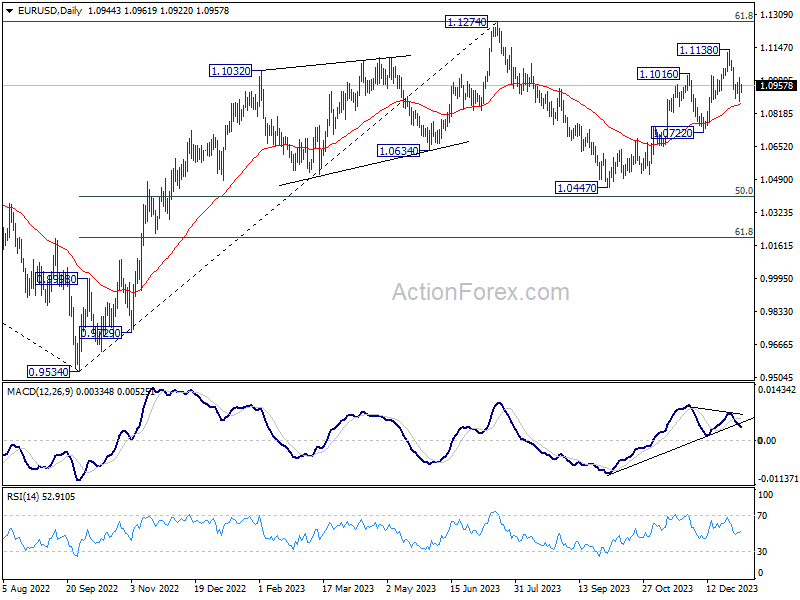
In the bigger picture, price actions from 1.1274 are viewed as a corrective pattern to rise from 0.9534 (2022 low). Rise from 1.0447 is seen as the second leg. While further rally could cannot be ruled out, upside should be limited by 1.1274 to bring the third leg of the pattern. Meanwhile, sustained break of 1.0722 support will argue that the third leg has already started for 1.0447 and below.
GBP/USD Mid-Day Outlook
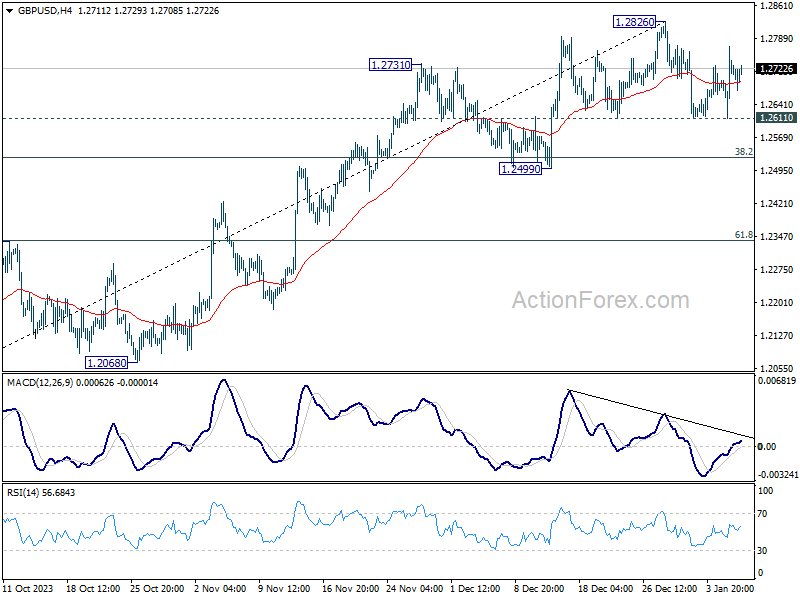
Daily Pivots: (S1) 1.2630; (P) 1.2701; (R1) 1.2789; More...
Intraday bias in GBP/USD is turned neutral again with current retreat. On the upside, decisive break of 1.2826 high will resume whole rally from 1.2036. Nevertheless, another fall and break of 1.2611 will bring deeper correction to 1.2499 support instead.
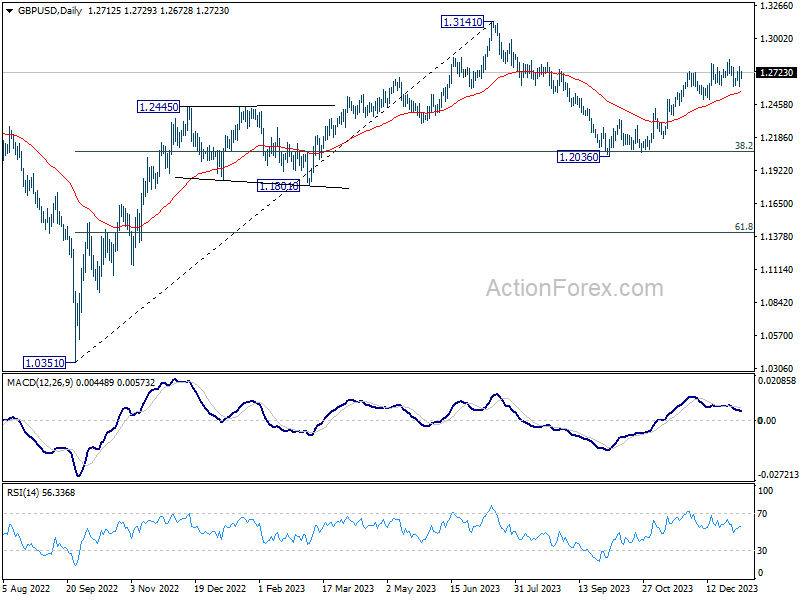
In the bigger picture, price actions from 1.3141 medium term top are seen as a corrective pattern to up trend from 1.0351 (2022 low). Rise from 1.2036 is seen as the second leg that's in progress. Upside should be limited by 1.3141 to bring the third leg of the pattern. Meanwhile, break of 1.2499 support will argue that the third leg has already started for 38.2% retracement of 1.0351 (2022 low) to 1.3141 at 1.2075 again.
USD/CHF Mid-Day Outlook
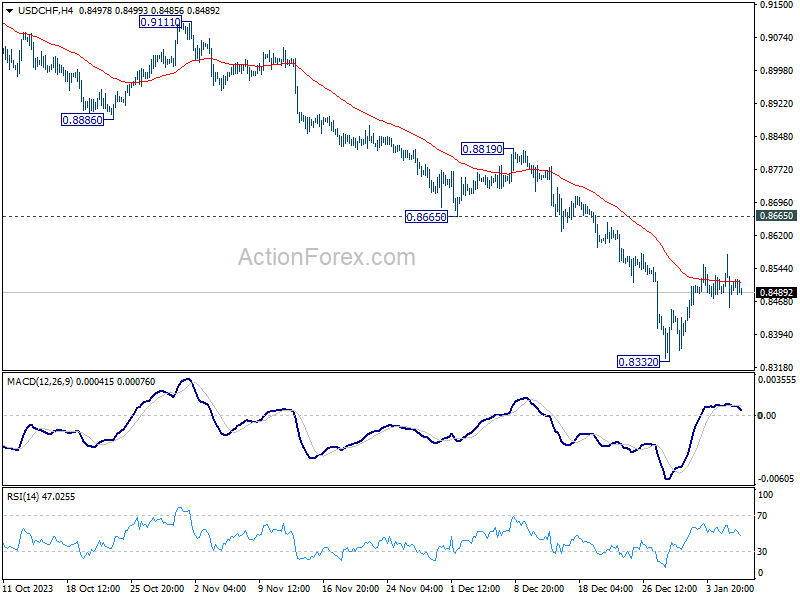
Daily Pivots: (S1) 0.8447; (P) 0.8512; (R1) 0.8568; More....
No change in USD/CHF's outlook and intraday bias stays neutral at this point. While recovery from 0.8332 short term bottom could extend higher, outlook will stay bearish as long as 0.8665 support turned resistance holds. On the downside, break of 0.8332 will resume larger fall from 0.9243 to 0.8257 projection level.
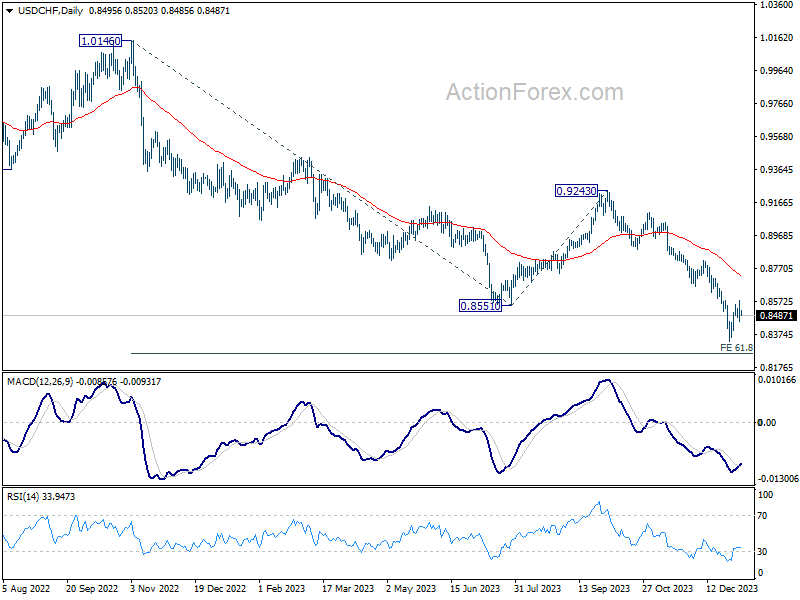
In the bigger picture, the down trend from 1.0146 (2022 high) is in progress. Next target is 61.8% retracement of 1.0146 to 0.8551 from 0.9243 at 0.8257. Sustained break there could prompt downside acceleration to 100% projection at 0.7648. This will now remain the favored case as long as 0.8819 resistance holds.
USD/JPY Mid-Day Outlook
Daily Pivots: (S1) 143.63; (P) 144.80; (R1) 145.80; More...
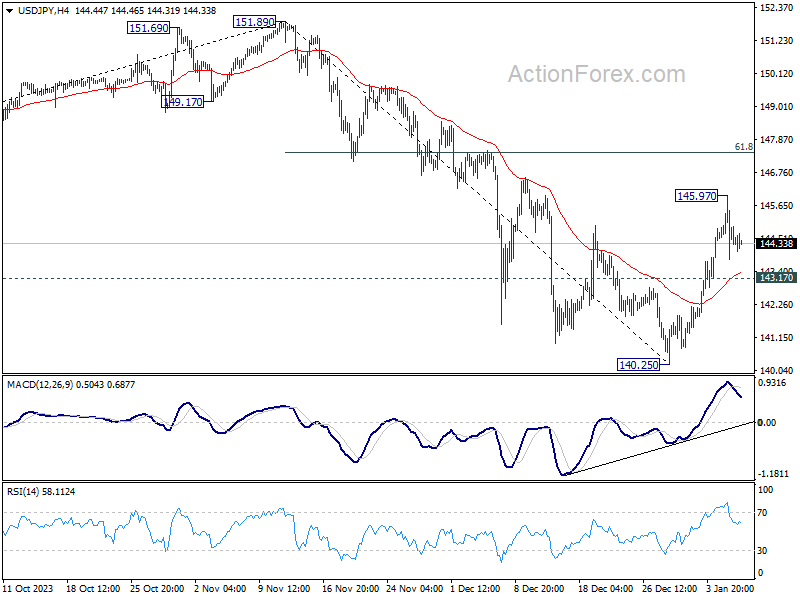
Intraday bias in USD/JPY stays neutral at this point. On the upside, above 145.97 will resume the rebound from 140.25. But upside should be limited by 61.8% retracement of 151.89 to 140.25 at 147.44. On the downside, below 143.17 minor support will turn bias back to the downside for retesting 140.25 low.
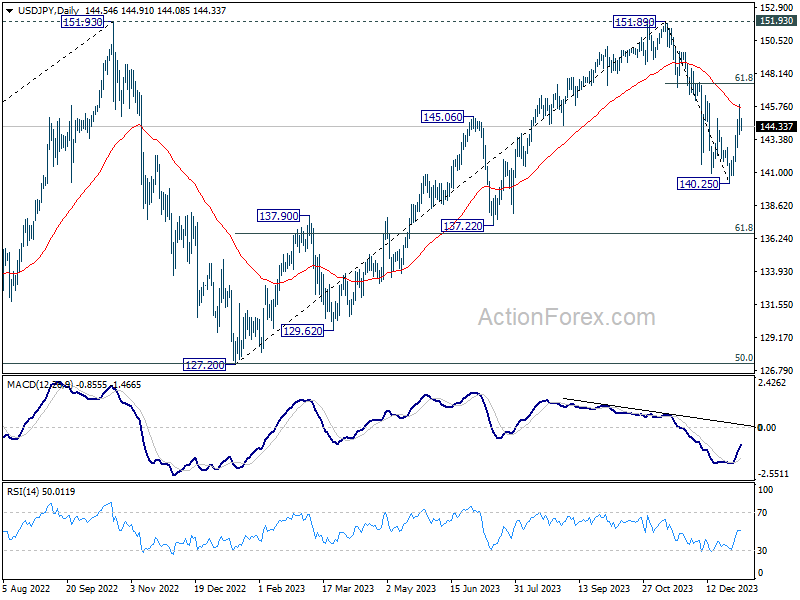
In the bigger picture, for now, fall from 151.89 is still seen as the third leg of the corrective pattern from 151.89. Another decline through 140.25 will target 61.8% retracement of 127.20 to 151.89 at 136.63. Sustained break there will pave the way to 127.20 support (2022 low). However, firm break of 147.44 fibonacci resistance will dampen this view and bring retest of 151.89 instead.
Commodity Currencies Weaken; Focus on AUD/JPY Ahead of Australia and Japan Data
In today's relatively subdued markets, the notable development is weakness in commodity currencies, led by Australian Dollar. This decline comes amid a drop in oil prices following Saudi Arabia's decision to cut official selling prices across all regions. Additionally, precious metals have softened in response to rebound in global benchmark treasury yields. The downward trend also extends to industrial metals, which are affected by worsening global economic outlook.
On the other hand, Japanese Yen is currently the strongest among major currencies, but its gains are tempered as traders anticipate the release of Tokyo's CPI and and Japan's household spending data tomorrow. Euro is showing resilience despite weaker-than-expected investor confidence and retail sales data, trailing closely behind Yen. Swiss Franc is also performing well, supported by CPI figures that met expectations. Meanwhile, Dollar and British Pound are mixed movements.
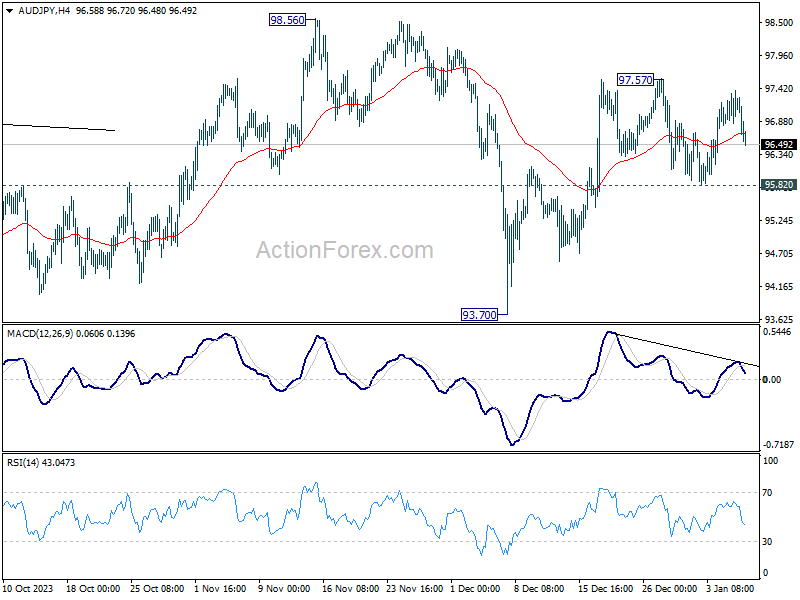
AUD/JPY would be a pair to watch in the upcoming Asian session, considering that Australia will also release retail sales. For now, rebound from 93.70 could still extend through 97.57 resistance. However, as this rise is seen as the second leg of the consolidation pattern from 98.56, upside should be limited by the resistance. Break of 95.82 minor support will suggest that the third leg has started to 93.70 support and below.
In Europe, at the time of writing, FTSE is down -0.09%. DAX is up 0.28%. CAC is up 0.08%. Germany 10-year yield is up 0.048 at 2.207. UK 10-year yield is up 0.038 at 3.830. Earlier in Asia, Hong Kong HSI fell -1.88%. China Shanghai SSE fell -1.42%. Singapore Strait Times rose 0.09%. Japan was on holiday.
Eurozone Sentix rises to -15.8, but German recession continues
Eurozone Sentix Investor Confidence rose from -16.8 to -15.8 in January, below expectation of -15.4. That's nonetheless the third increase in a row, and the highest reading since May 2023. Current Situation Index also rose for the third month from -23.5 to -22.5. Expectations Index rose for the fourth month, from -9.8 to -8.8, highest since February 2023.
Sentix noted that the sharp drop of -18 points in the sub-index of inflation expectations, from 16.25 to -1.75, raises concerns. This significant decrease is attributed not only to extensive administrative cost increases from tax hikes in Germany but also to a noticeable rise in freight costs, influenced by recent unrest in the Red Sea area. These factors suggest that the prevailing interest rate optimism might be misguided, potentially imposing new challenges on the already struggling Eurozone economy.
Also to be noted, Germany's overall Investor Confidence Index fell from -25.5 to -26.1. Current Situation Index fell from -35.3 to -35.5. Expectations Index fell from -15.3 to -16.3. Sentix noted, "Germany is not emerging from the recession and thus from its economic crisis."
Eurozone retail sales fall -0.3% mom in Nov, EU down -0.2% mom
Eurozone retail sales fell -0.3% mom in November, worse than expectation of -0.1% mom. Volume of retail trade decreased by -0.4% for non-food products and by -0.1% for food, drinks and tobacco, while it increased by 1.4% for automotive fuels.
EU retail sales fell -0.2% mom. Among Member States for which data are available, the largest monthly decreases in the total retail trade volume were registered in the Germany (-2.5%), Luxembourg (-1.4%) and Austria (-0.7%). The highest increases were observed in Portugal (+3.1%), Croatia and Slovenia (both +3.0%), Malta and Romania (both +1.7%).
Swiss CPI rises to 1.7% yoy in Dec, matches expectations
Swiss CPI was flat at 0.0% mom in December, above expectation of -0.1% mom. Core CPI (fresh and seasonal products, energy and fuel) rose 0.2% mom. Domestic products prices rose 0.3% mom. Import products price fell -0.7% mom.
For the 12-month period, CPI rose from 1.4% yoy to 1.7% yoy, matched expectations. Core CPI rose from 1.4% yoy to 1.5% yoy. Domestic products prices rose from 2.1% yoy to 2.3% yoy. Imported products prices from also rose from -0.6% yoy to -0.2% yoy.
Also published, retail sales rose 0.7% yoy in November, above expectation of 0.0% yoy.
USD/JPY Mid-Day Outlook
Daily Pivots: (S1) 143.63; (P) 144.80; (R1) 145.80; More...
Intraday bias in USD/JPY stays neutral at this point. On the upside, above 145.97 will resume the rebound from 140.25. But upside should be limited by 61.8% retracement of 151.89 to 140.25 at 147.44. On the downside, below 143.17 minor support will turn bias back to the downside for retesting 140.25 low.
In the bigger picture, for now, fall from 151.89 is still seen as the third leg of the corrective pattern from 151.89. Another decline through 140.25 will target 61.8% retracement of 127.20 to 151.89 at 136.63. Sustained break there will pave the way to 127.20 support (2022 low). However, firm break of 147.44 fibonacci resistance will dampen this view and bring retest of 151.89 instead.
Economic Indicators Update
| GMT | Ccy | Events | Actual | Forecast | Previous | Revised |
|---|---|---|---|---|---|---|
| 07:00 | EUR | Germany Factory Orders M/M Nov | 0.30% | 1.10% | -3.70% | -3.80% |
| 07:00 | EUR | Germany Trade Balance (EUR) Nov | 20.4B | 17.9B | 17.8B | 17.7B |
| 07:30 | CHF | Real Retail Sales Y/Y Nov | 0.70% | 0.00% | -0.10% | -0.30% |
| 07:30 | CHF | CPI M/M Dec | 0.00% | -0.10% | -0.20% | |
| 07:30 | CHF | CPI Y/Y Dec | 1.70% | 1.70% | 1.40% | |
| 09:30 | EUR | Eurozone Sentix Investor Confidence Jan | -15.8 | -15.4 | -16.8 | |
| 10:00 | EUR | Eurozone Economic Sentiment Indicator Dec | 96.4 | 93.8 | 94.0 | |
| 10:00 | EUR | Eurozone Industrial Confidence Dec | -9.2 | -9.5 | ||
| 10:00 | EUR | Eurozone Services Sentiment Dec | 8.4 | 4.9 | 5.5 | |
| 10:00 | EUR | Eurozone Consumer Confidence Dec F | -15.0 | -15.1 | -15.1 | |
| 10:00 | EUR | Eurozone Retail Sales M/M Nov | -0.30% | -0.10% | 0.10% | 0.40% |
Nasdaq 100 Technical: Potential Short-Term Bounce on the Horizon
- Recent decline has almost reached the upward-sloping 50-day moving average.
- Short-term RSI momentum indicator has suggested downside momentum has eased.
- Potential short-term bounce above 16,160 key short-term support.
The US Nas 100 Index (a proxy for the Nasdaq 100 futures) has tumbled towards the 16,160/125 intermediate support as highlighted in our earlier analysis as it hit an intraday low of 16,190 last Friday, 5 January after a bearish reaction off the 16,990 intermediate resistance post-Christmas with a current all-time high level of 16,999 printed on 28 December 2023.
So far the Index has declined by -4.76% from its 28 December 2023 all-time high level in the past week, reinforced by weakness in the share price of Apple recorded a weekly loss of -6.41% last week, and underperformed within the “Magnificent 7” group of mega-capitalization US equities due to two sell-side brokerages performance degrades over potential waning demand for its latest iPhone model.
The decline almost reached the 50-day moving average
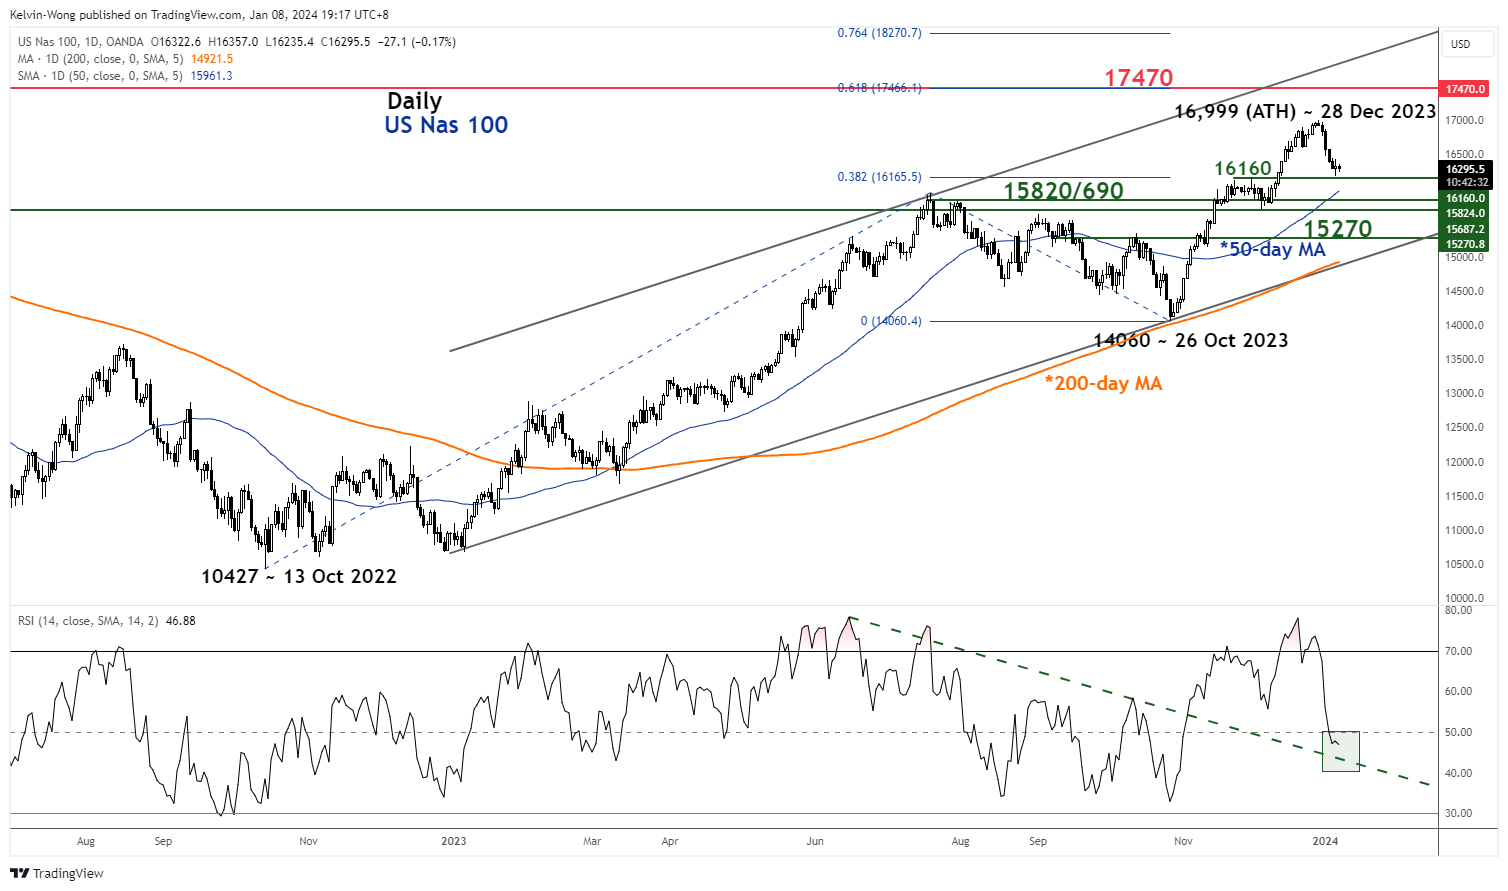
Fig 1: US Nas 100 medium-term trend as of 8 Jan 2024 (Source: TradingView, click to enlarge chart)
The 5-day slide has almost reached the 50-day moving average, the former swing high areas of 22 November/29 November 2023 now acting as a pull-back support at 16,160, and the 61.8% Fibonacci retracement of the prior minor uptrend phase from 4 December 2023 low to 28 December 2023 high.
The short-term downside momentum has dissipated
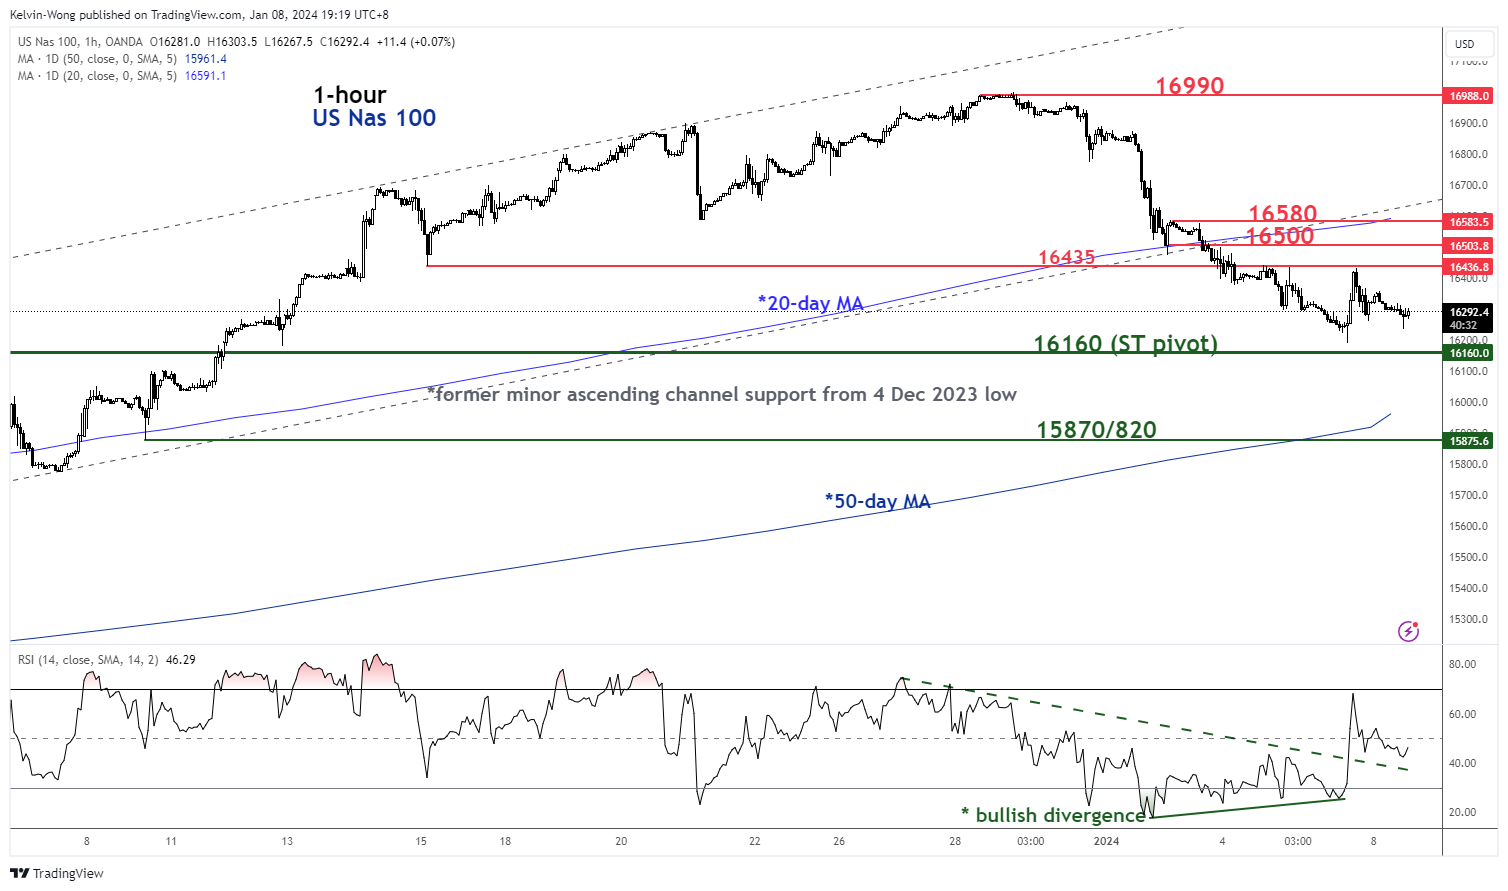
Fig 2: US Nas 100 minor short-term trend as of 8 Jan 2024 (Source: TradingView, click to enlarge chart)
The hourly RSI momentum indicator has flashed a prior bullish divergence signal at its oversold region before a bullish momentum breakout last Friday, 5 Jan which increases the odds of a minor recovery scenario at this juncture as the downside momentum of last week’s decline has eased.
Watch the 16,160 key short-term pivotal support and clearance above 16,435 near-term resistance sees the next intermediate resistance zone coming at 16,500/580 (20-day moving average, former minor ascending channel support & the 61.8% Fibonacci retracement of the decline from 28 December 2023 high to 5 January 2024 low).
However, failure to hold at 16,160 invalidates the recovery scenario to see the continuation of the minor corrective decline within its major uptrend phase to expose the next intermediate support at 15,870/820 in the first step.
EURCHF Bulls Could Find An Opening
- EURCHF trades a tad above its all-time low of 0.9235
- Euro bulls are trying to regain market control and limit their losses
- Momentum indicators could open the door for a rebound
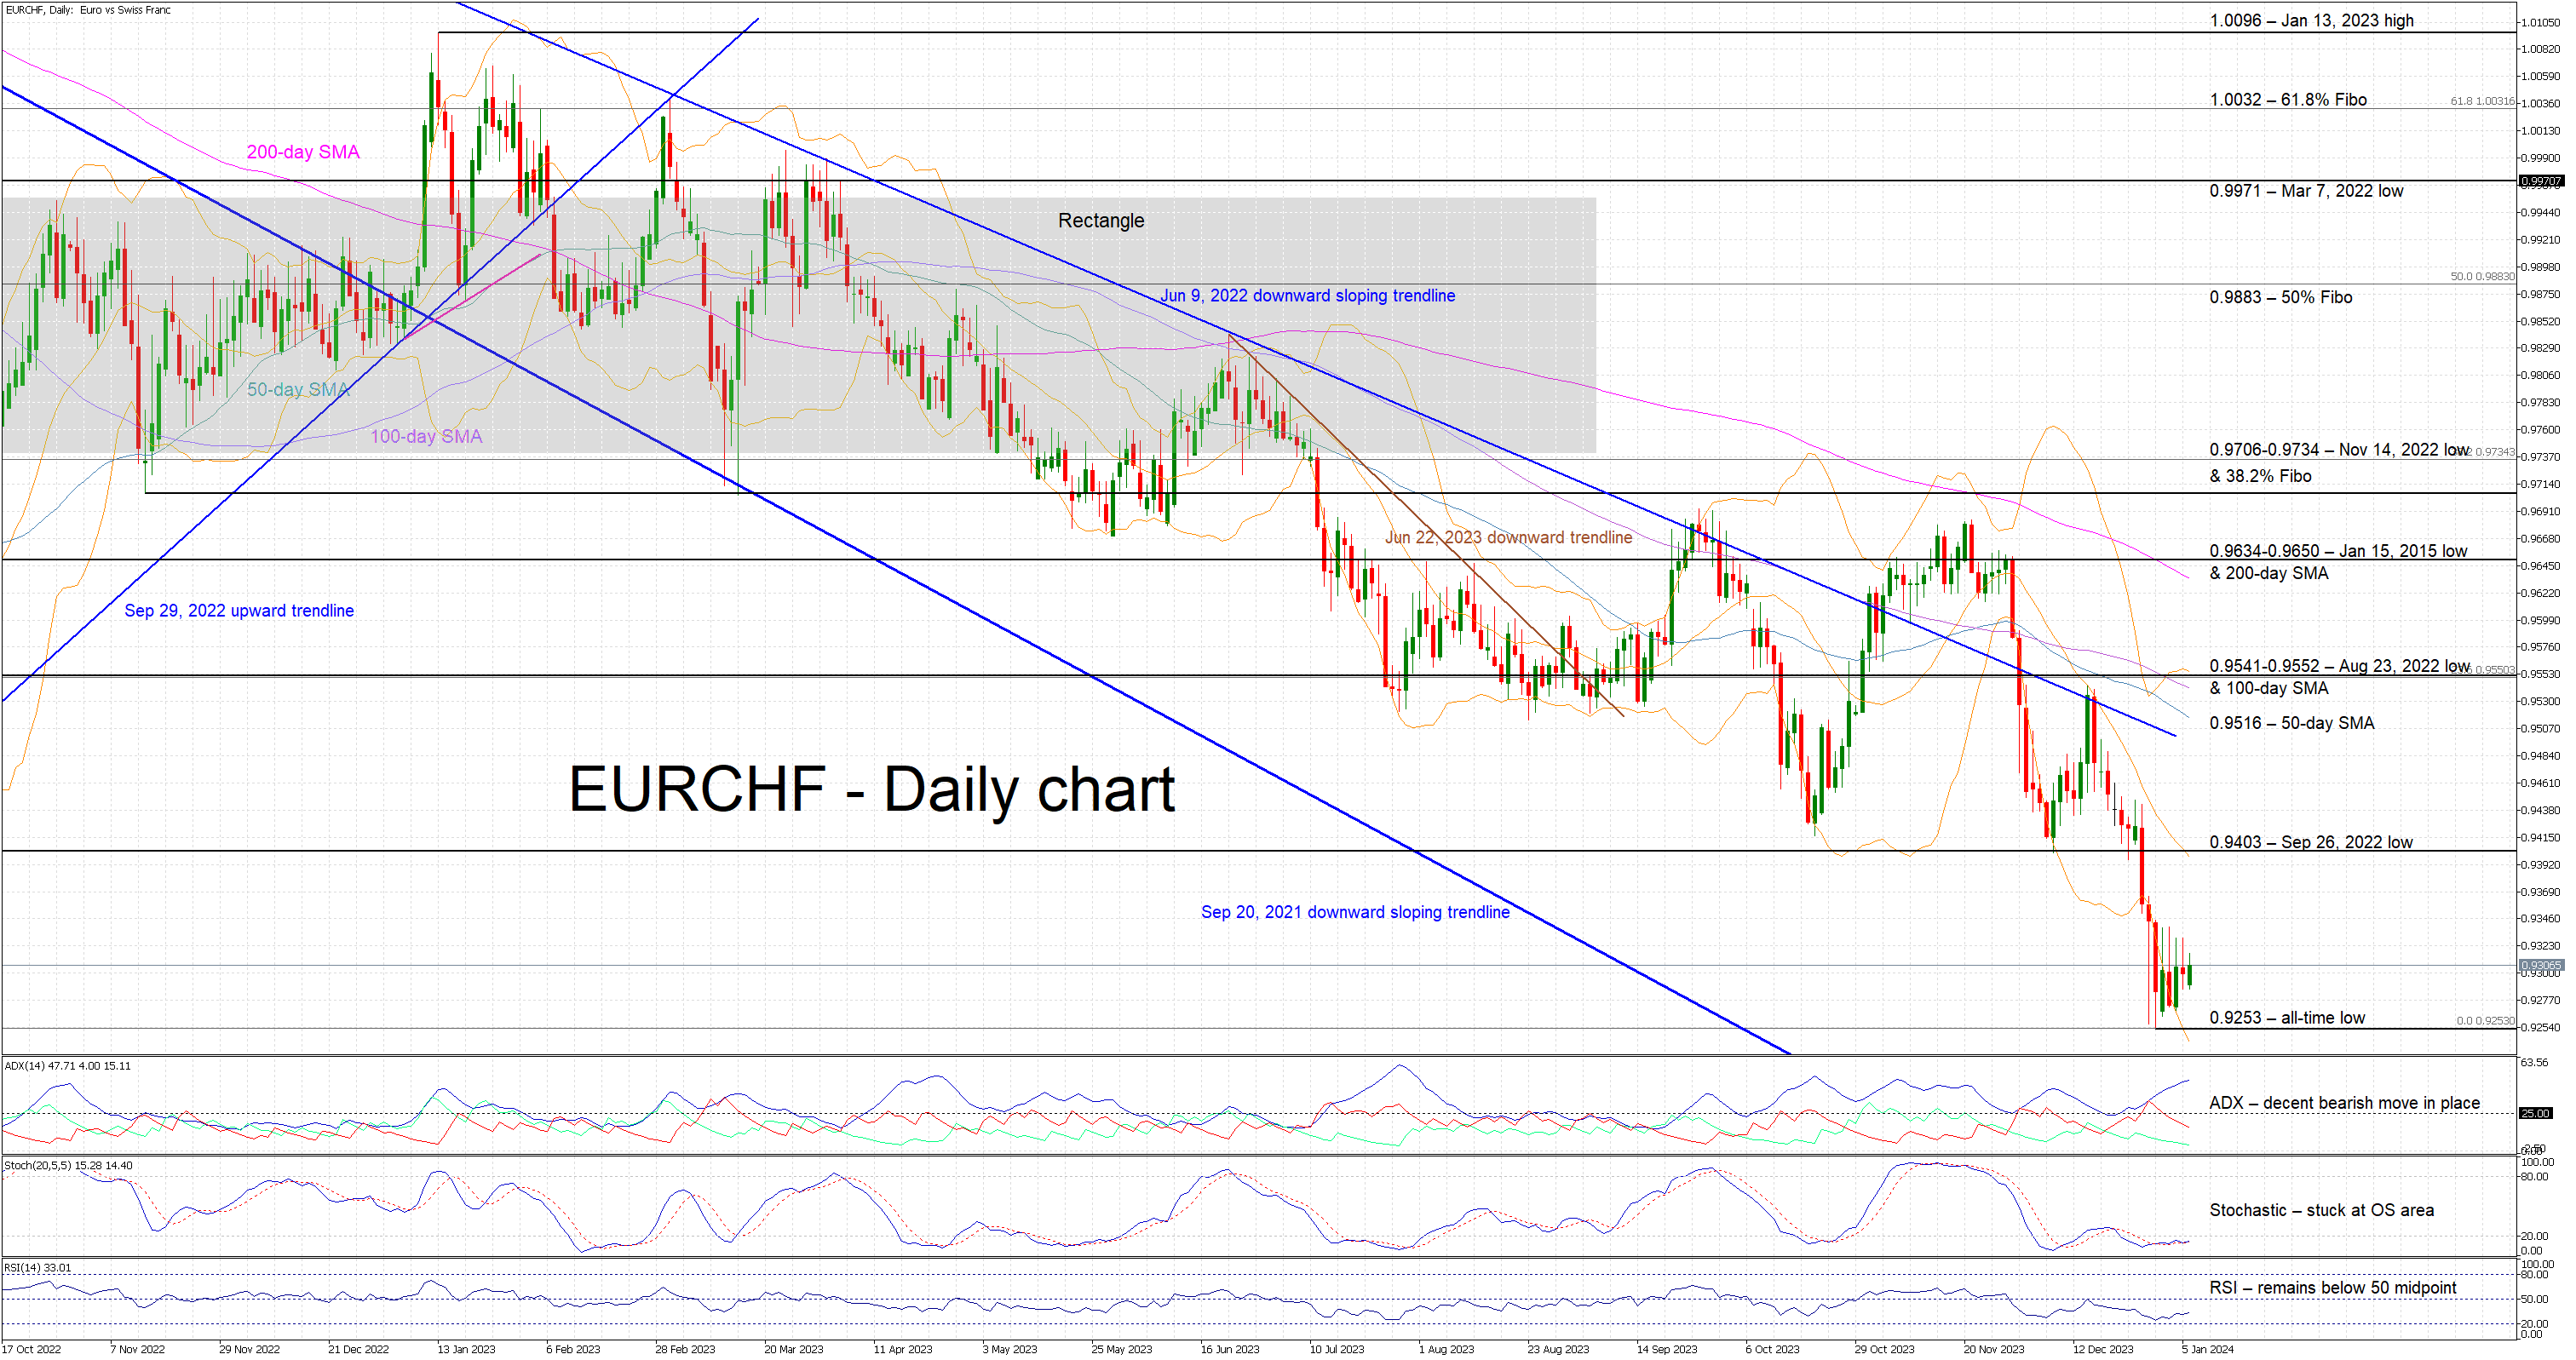
EURCHF is edging higher today but trades very close to its all-time low of 0.9235 recorded on December 29, 2023 with the recent series of lower lows and lower highs remaining intact. Euro bulls are trying to recover part of their significant 6% losses recorded during 2023, but they appear unable to regain market control and push EURCHF towards the 0.9403 area.
The momentum indicators could hold the key to a possible upleg. In more detail, the Average Directional Movement Index (ADX) is edging higher, but the downwards move of the D- indicator could mean that the current sell-off has run its course. Additionally, the RSI remains below its 50-midpoint and thus confirming the current bearish pressure. Interestingly, the stochastic oscillator is still hovering at its oversold (OS) territory, battling with its moving average. Should it manage to break above its OS, it would be seen as a strong bullish signal.
If the bulls become more confident, they could try to lead EURCHF higher towards the September 26, 2002 low at 0.9403. It might not be a one-way street move higher, but if successful, the bulls could then have a go at gradually testing the resistance set by the June 9, 2022 downward sloping trendline and the 50-day simple average (SMA) at 0.9516.
On the flip side, the bears are probably enjoying their hard-earned gains and could possibly be taking a breather at this stage. They could try to push EURCHF lower towards its recent low at 0.9235 and then be given the chance to record a new all-time low, with 0.9200 looking like the next plausible target.
To sum up, the bearish trend remains in place, but the bulls could have the chance to stage a rebound if the momentum indicators turn in their favour soon.
Dow Futures (YM_F) Elliott Wave Forecasting The Path
Hello fellow traders. In this technical article we’re going to take a look at the Elliott Wave charts charts of Dow Futures ($YM_F ) published in members area of the website. As our members know YM_F we see cycle from the 32406 low completed at the 38115 peak. While below that level, we could be getting a deeper correction. Recently, the futures reached the intraday equal legs from the 38115 peak and made 3 waves bounce as expected. In further text we’re going to explain the Elliott Wave pattern and forecast.
Dow YM_F Elliott Wave h1 Chart 01.05.2023
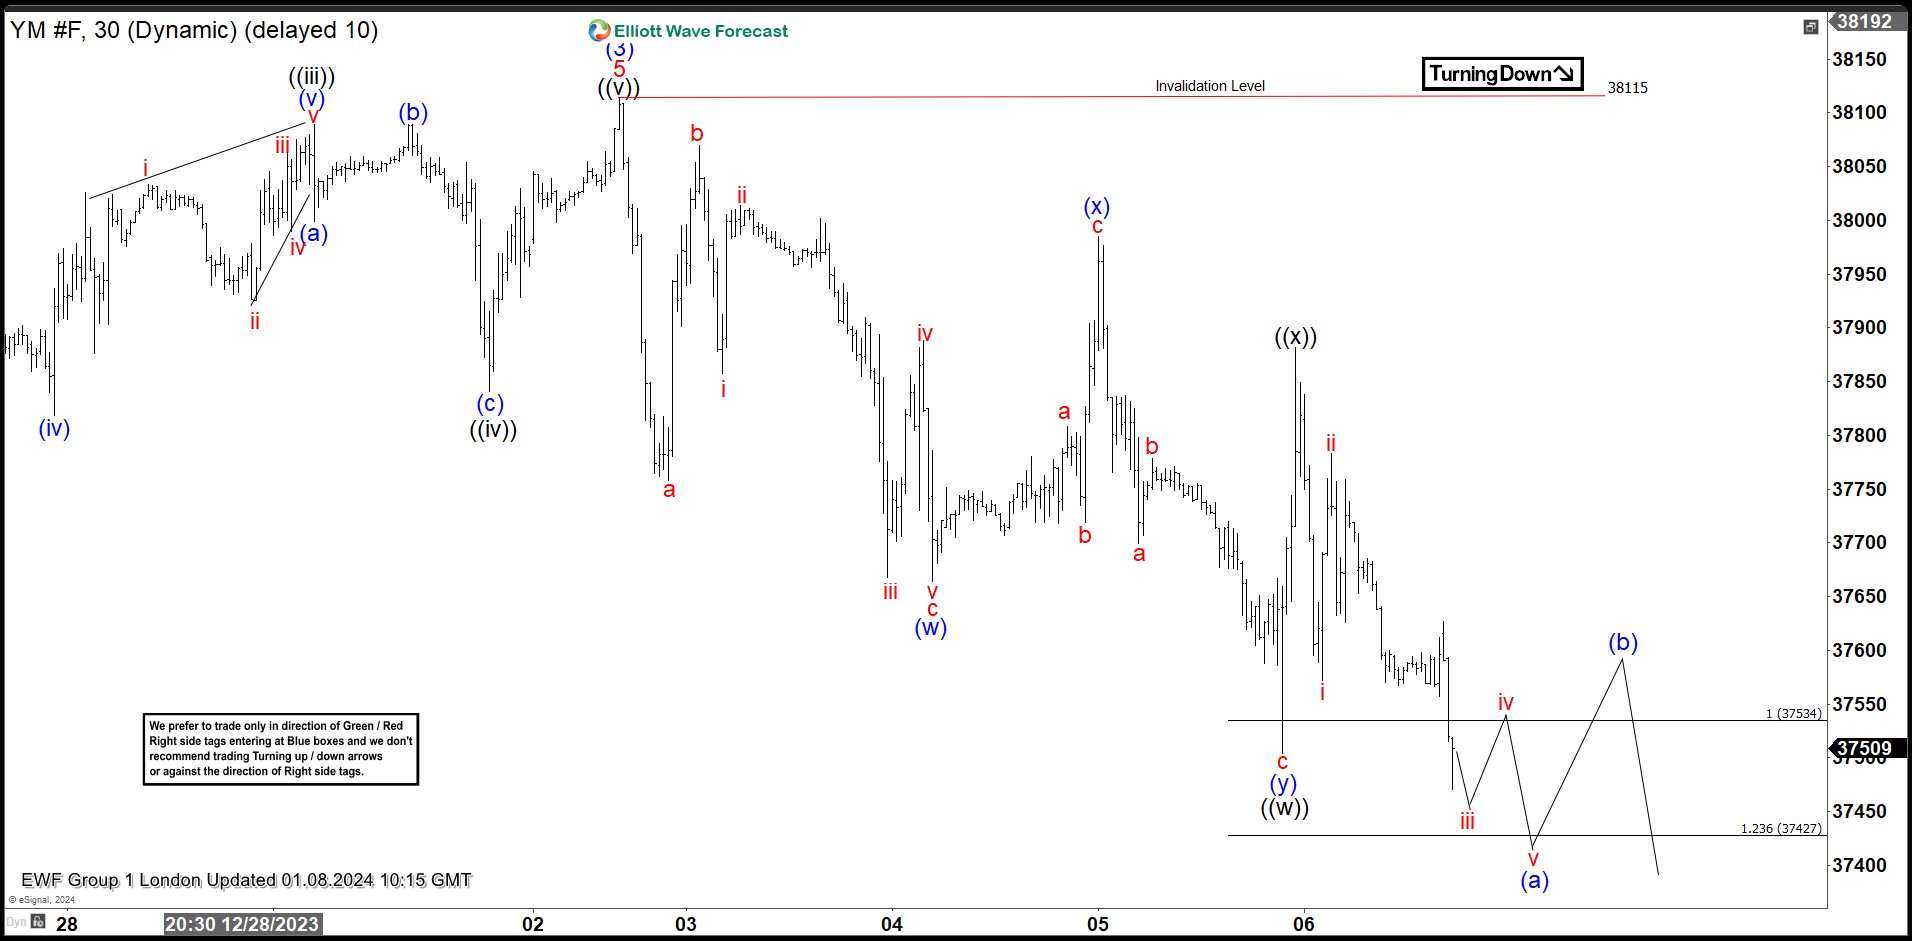
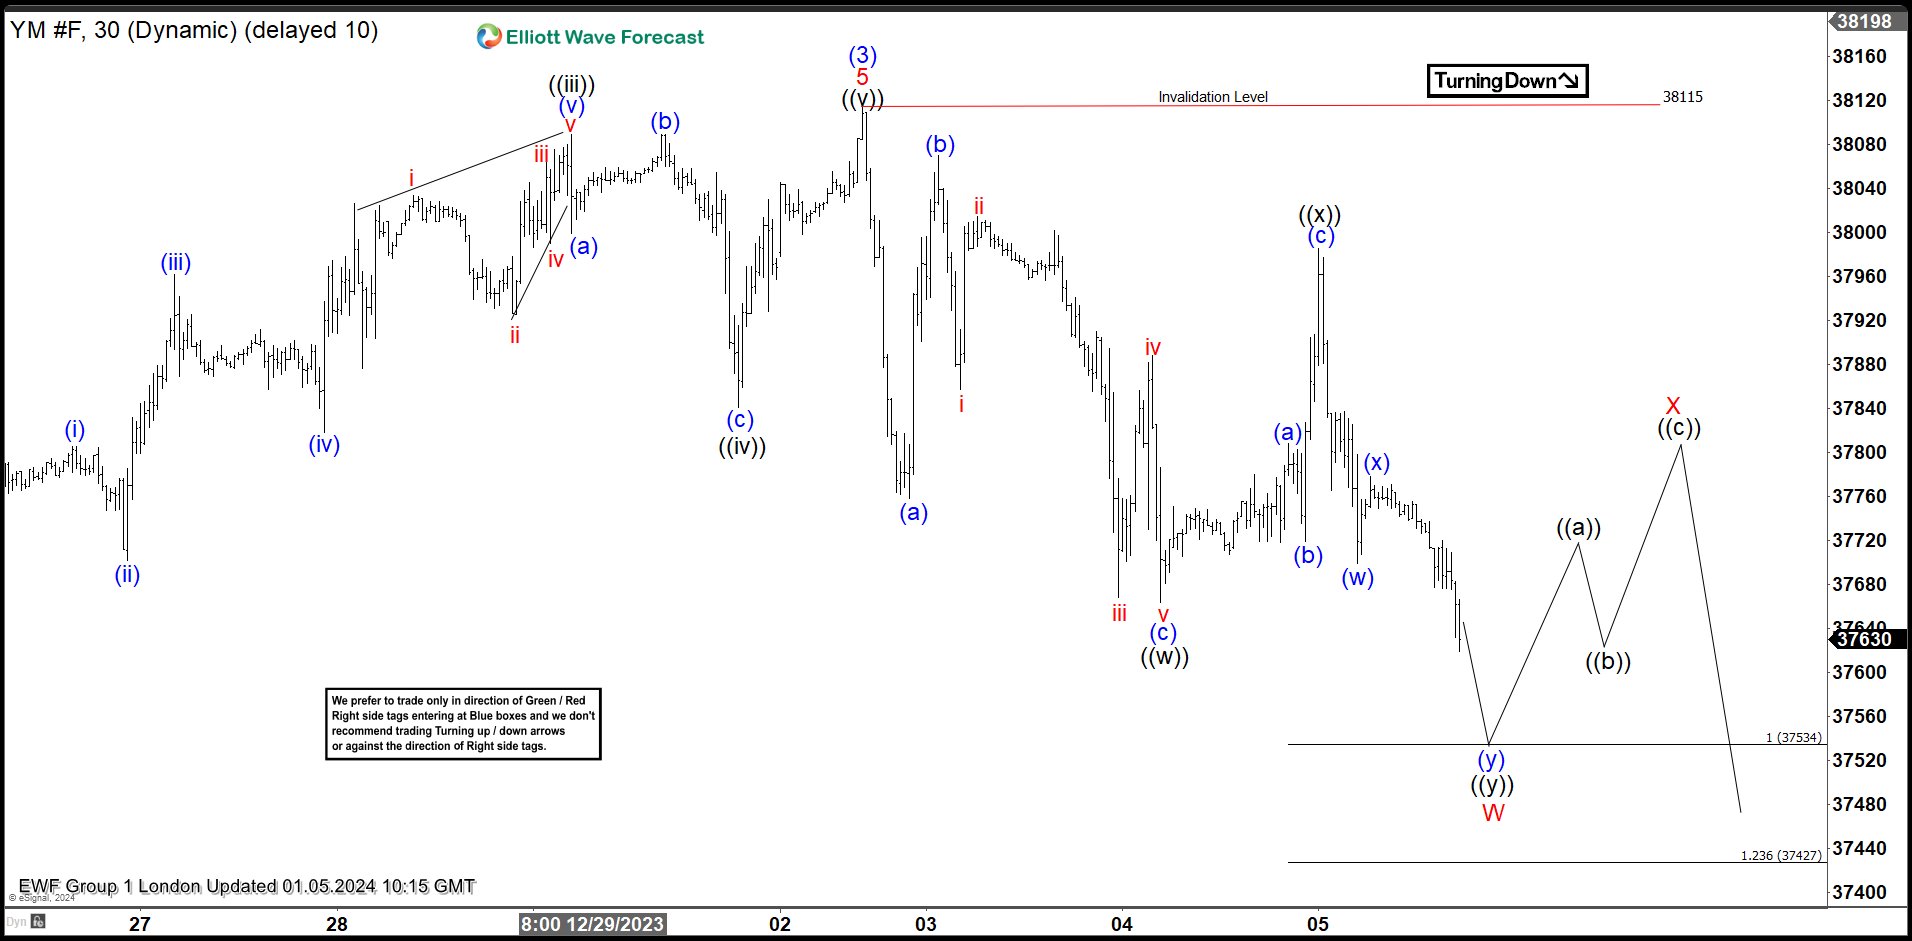
Cycle from the 38115 peak looks incomplete at the moment. The futures shows lower low sequences, suggesting more short term weakness toward 37534-37427 area. At the marked zone we can be ending first leg W red as potential Double Three pattern. From that zone we expect to see 3 waves bounce before more weakness is seen in Y red leg.
Dow YM_F Elliott Wave h1 Chart 01.08.2023
Dow Futures made decline and the price reached extreme zone from the peak at 37534-37427 . We got nice bounce against the 38115 peak, after which the price turned lower again and made break toward new lows as expected. At the moment the price structure from the 38115 peak is incomplete again, suggesting more weakness ideally in near term. Next tech zone to the downside comes at 37287 area.