

Sample Category Title
RBA Gives Itself Time to Assess
As we expected, the RBA Board kept rates on hold following its December meeting. Information received since the previous meeting in early November was considered ‘broadly in line’ with their expectations. The Governor’s decision statement emphasised that inflation continues to moderate, driven by the goods sector. Ahead of its meeting in February 2024, the Board will be focused on the December quarter CPI result. If inflation does not decline as the RBA intends, the Board will respond with increased rates. But this is not the most likely outcome.
As we expected, the RBA Board kept rates on hold following its December meeting. Information received since the previous meeting in early November was described as ‘limited’ and considered ‘broadly in line’ with their expectations. Given that, the Board did not see a need to follow up last month’s increase with another this month. Recall that the RBA’s November forecasts were predicated on ‘one to two’ increases in the cash rate, with one having already been delivered. By pausing this month, the RBA Board is giving itself ‘time to assess’ the impact of recent rate increases. The statement noted that both household consumption and dwelling investment are weak, and that conditions in the labour market are continuing to ease gradually.
The Governor’s statement noted that ‘[h]igher interest rates are working to establish a more sustainable balance between aggregate supply and demand in the economy. The impact of the more recent rate rises, including last month’s, will continue to flow through the economy.’ In other words, policy is working as normal. The Board would be aware that further rate increases from here will have much of their impact at least a year from now – by which time inflation should already be at or close to target.
The October CPI indicator was lower than market forecasts and, we believe, the RBA’s expectations. Much of this surprise was in noisy components such as fuel and holiday travel, which the RBA will tend to look through. The Governor’s statement highlighted the role of goods prices in driving the decline in inflation. It also called out that the October release contained little information on services inflation, which is the centre of the Board’s concerns.
Given the Board’s determination to return inflation to target in a reasonable timeframe, it is understandable that the Governor’s statement does not highlight downside risks to inflation. Even so, the October outcome does point to downside risks tempering the upside risks to inflation. One of these potential downsides is that government rent assistance weighed on rent inflation by more than expected. Unlike electricity rebates, this is a lasting reduction in rent levels and does not involve the ‘payback’ seen when temporary measures expire. In addition, headline inflation is what people experience, so the downside surprise in the October indicator lowers the risk of inflation expectations rising. The Governor’s statement after the meeting repeated the Bank’s assessment that inflation expectations remain consistent with the RBA’s inflation target. It also repeated the language of earlier statements about wages growth being consistent with inflation returning to target, ‘provided productivity growth picks up’.
Among the changes to the statement from last month was an acknowledgement that there are ‘encouraging signs on goods inflation abroad’. Recent downside surprises for inflation in some major advanced economies would surely also have been some comfort to the Board, given the global nature of the inflation pressures coming from goods and energy prices. While the Governor’s statement does not mention it, the appreciation of the exchange rate over recent weeks is also helpful for dampening inflation pressures, at least at the margin.
A noteworthy change in the language of the Governor’s statement is the recap of the reasoning behind the previous month’s decision to increase rates. A similar recap of the evolution of the Board’s thinking was also included in the Overview of the November Statement on Monetary Policy. We interpret this as part of the Bank’s response to the RBA Review’s recommendations for clearer and more straightforward communication.
In the lead-up to the next meeting in February, the RBA Board will be assessing whether inflation is declining fast enough to reach the 2–3% target in 2025. They have no tolerance for further delays in the return of inflation to target beyond this date. Any upside surprises will be met with further policy action. For this reason, the February meeting should still be considered ‘live’. It remains our view, though, that it is more likely than not that the RBA has reached the peak of its rate hiking cycle.
AUD/USD: Challenging Key 200-Day Moving Average Post RBA
- RBA left its policy cash rate unchanged at 4.35% in line with expectations.
- A slight dovish tonality in the monetary policy statement has reduced the expectations of a “hawkish pause”.
- Technical analysis suggests that the medium-term uptrend phase of the AUD/USD from its 26 October 2023 low remains intact.
- Watch the 0.6570 pivotal support.
Australia’s central bank, RBA has left its policy cash rate unchanged today at 4.35% which came in line with expectations after a prior 25 basis points (bps) hike last month.
Before today’s monetary policy meeting, newly appointed RBA Governor Bullock peppered her public speeches with hawkish rhetoric that expressed concerns about sticky elevated domestic inflation pressures that required higher interest rates to negate them.
Hence, in the run-up to today’s RBA meeting, several market participants expected a “hawkish pause” with similar hawkish rhetoric text to be expressed in the accompanying policy statement.
AUD/USD plummeted due to “cognitive dissonance”
But in contrast, the actual tonality of the statement has leaned towards a dovish tilt with a focus on data dependence; it stated that whether further tightening is warranted will depend on the data as well as the evolving assessment of risk, added that the outlook on household consumption remains uncertain.
Also, the statement acknowledged that inflation has moderated as seen in the softer-than-expected monthly CPI for October (4.9% from 5.6% September, and below 5.2% consensus) was driven by the goods sector but the October inflation update did not provide much information on the services sector.
The cognitive dissonance between the tonality of the latest RBA monetary statement and the recent hawkish speeches from RBA Governor Bullock continued to put downside pressure on the AUD/USD today (5 December) where it has shed -117 pips from yesterday’s intraday high of 0.6690 to print a current intraday low of 0.6571 at this time of the writing.
Retesting the key 200-day moving average with oversold condition
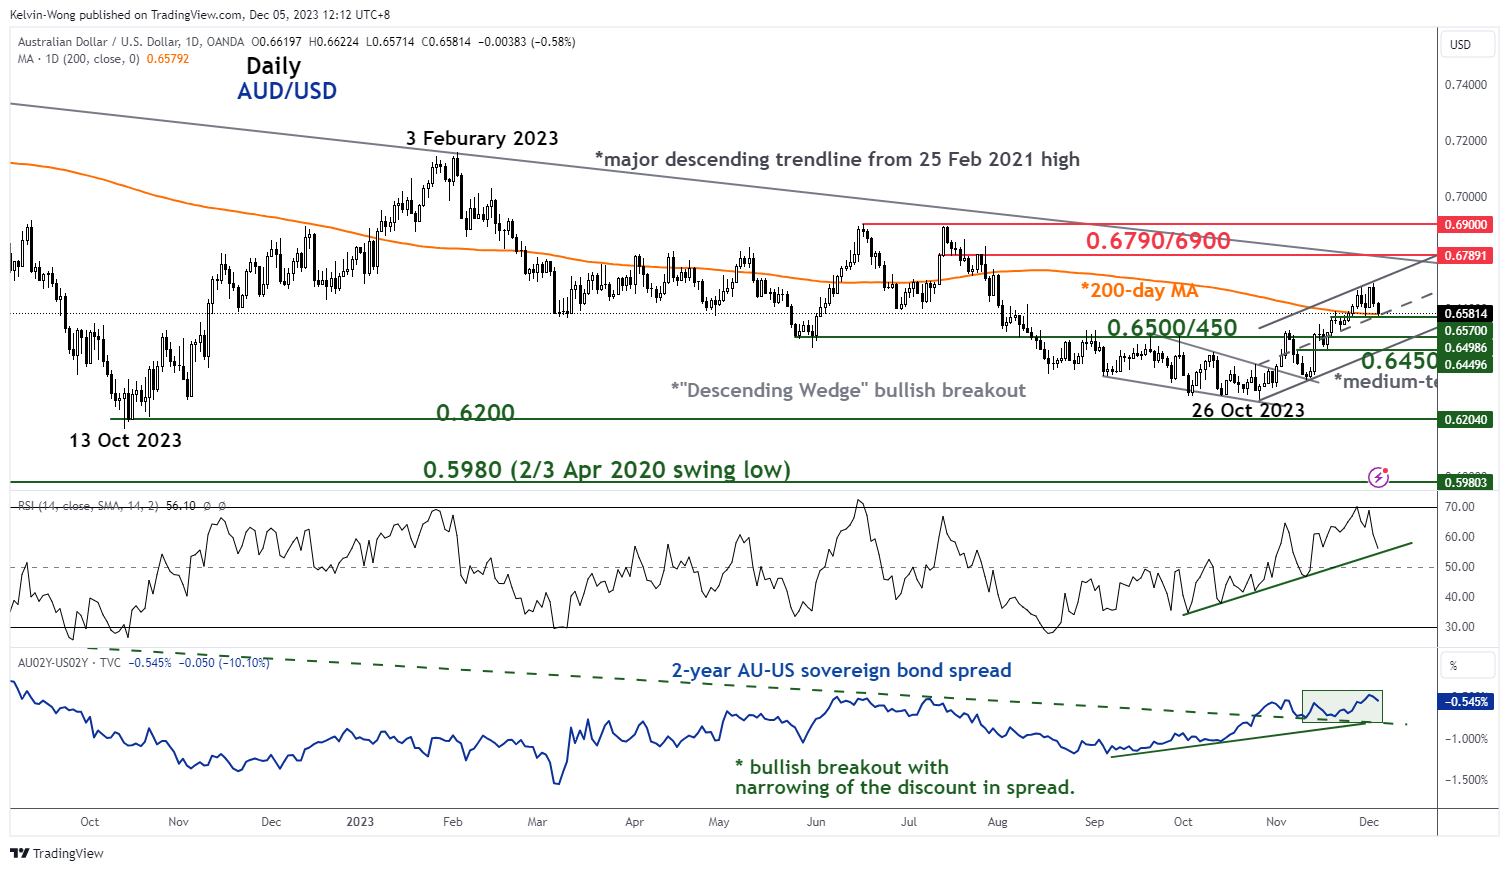
Fig 1: AUD/USD medium-term trend as of 5 Dec 2023 (Source: TradingView, click to enlarge chart)
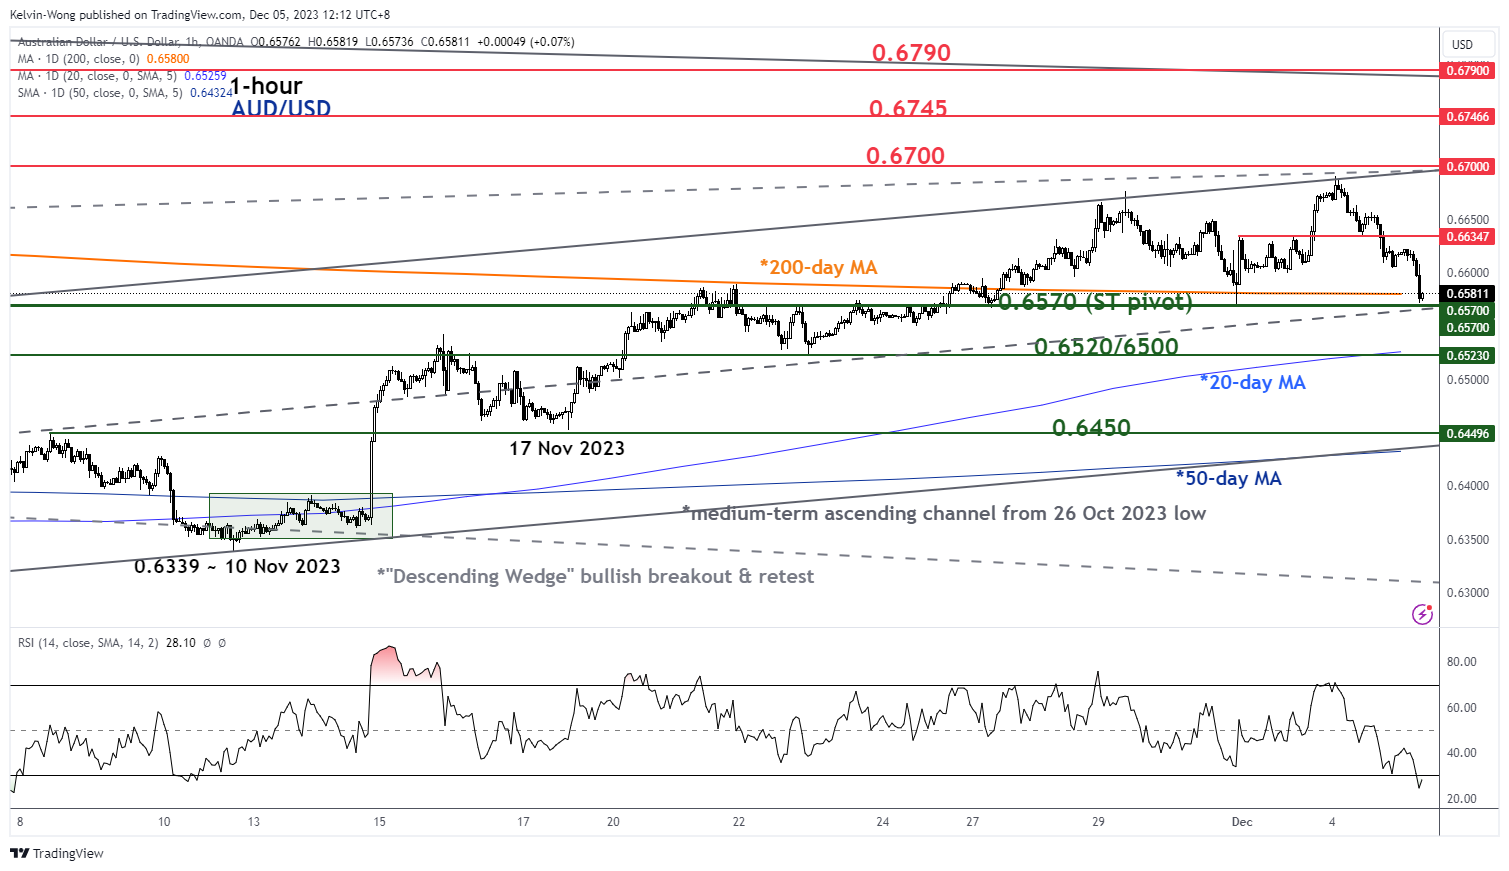
Fig 2: AUD/USD minor short-term trend as of 5 Dec 2023 (Source: TradingView, click to enlarge chart)
The current weakness seen in the AUD/USD has led it to challenge a key pivotal support at 0.6570 that also confluences with the key 200-day moving average where price actions have traded above it since 27 November 2023.
Several positive elements suggest the AUD/USD may stage a potential bullish reversal at this juncture.
Firstly, the 2-year spread between Australian sovereign bonds and US Treasury notes has continued to inch upwards since its bullish breakout from a key resistance on 26 October 2023, suggesting a further potential narrowing of the 2-year yield negative spread.
Secondly, the daily RSI momentum indicator has not reached an overbought condition and it remains above a parallel ascending support at the 55 level.
Thirdly, the short-term hourly RSI momentum indicator has dipped down to an oversold level of 24.40, its lowest since 7 November 2023 which suggests an overstretched minor decline from yesterday’s intraday high of 0.6690.
Watch the 0.6570 pivotal support and clearance above 0.6635 near-term resistance may reinstate the bullish tone to see the next intermediate resistance coming at 0.6700 (also the upper boundary of the medium-term ascending channel in place since the 26 October 2023 low) in the first step.
However, a break below 0.6570 invalidates the recovery scenario to expose the next intermediate supports at 0.6500 (20-day moving average) and 0.6450 (lower boundary of the medium-term ascending channel & 50-day moving average).
Dow Futures (YM_F) Sequence Remains Bullish
Dow Futures (YM_F) shows incomplete sequence from 10.3.2022 low favoring further upside. Rally from 10.3.2022 low is unfolding as a 5 waves impulse Elliott Wave structure. Up from 10.3.2022 low, wave (1) ended at 35228 and dips in wave (2) ended at 32409. Wave (3) higher is in progress as an impulse in lesser degree. Up from wave (2), wave 1 ended at 34315 and dips in wave 2 ended at 33913. Index then resumed higher in wave 3 towards 36338.
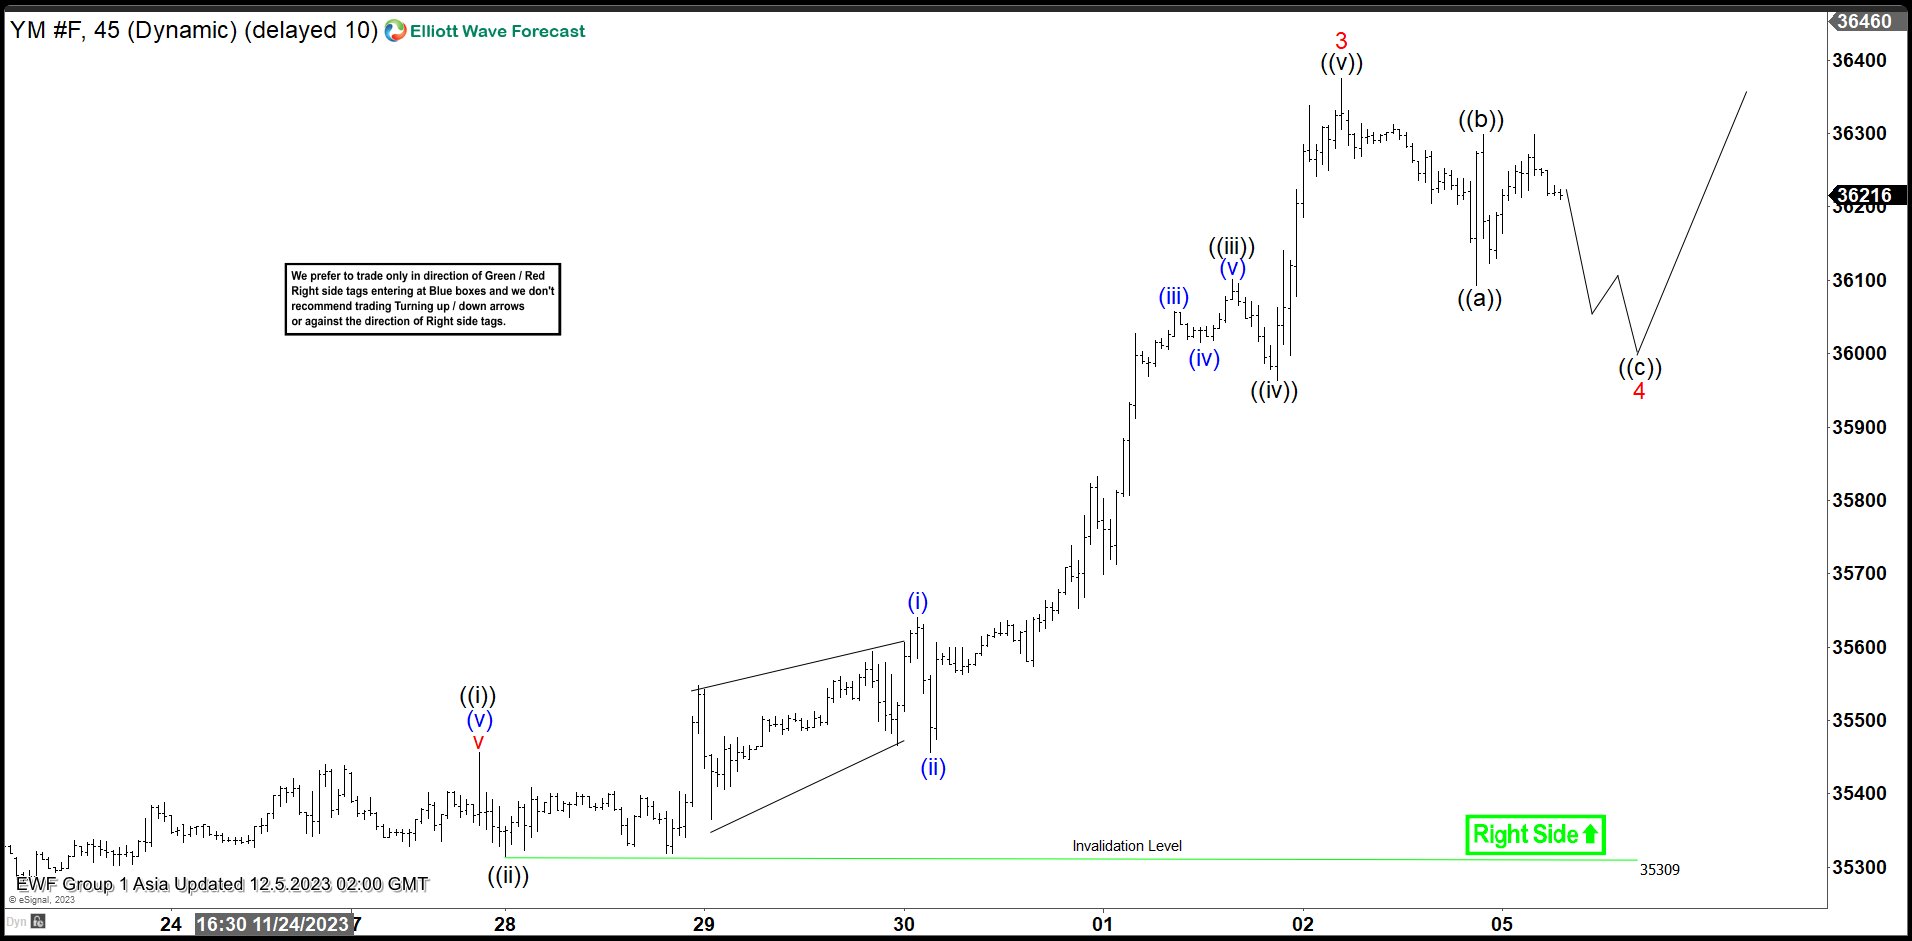
The 45 minutes chart below shows the move higher in wave 3. Up from wave 2, wave ((i)) ended at 35456 and pullback in wave ((ii)) ended at 35309. Up from wave ((ii)), the Index is nesting in wave (i) at 35641 and dips in wave (ii) ended at 35456. Index then resumed higher in wave (iii) towards 36058 and dips in wave (iv) ended at 36015. Wave (v) higher ended at 36101 which completed wave ((iii)). Pullback in wave ((iv)) ended at 35963. Wave ((v)) higher ended at 36337 which completed wave 3 in higher degree. Pullback in wave 4 is currently in progress as a zigzag structure. Down from wave 3, wave ((a)) ended at 36093 and wave ((b)) rally ended at 36299. Wave ((c)) lower is expected to complete at the 100% extension area at 35857 – 36026 where wave 4 should end. From there, the Index should see further upside or 3 waves rally at least.
Dow Futures (YM_F) 45 Minutes Elliott Wave Chart
YM_F Elliott Wave Video
https://www.youtube.com/watch?v=PfSweGbGrx4
Technical Outlook and Review
DXY:
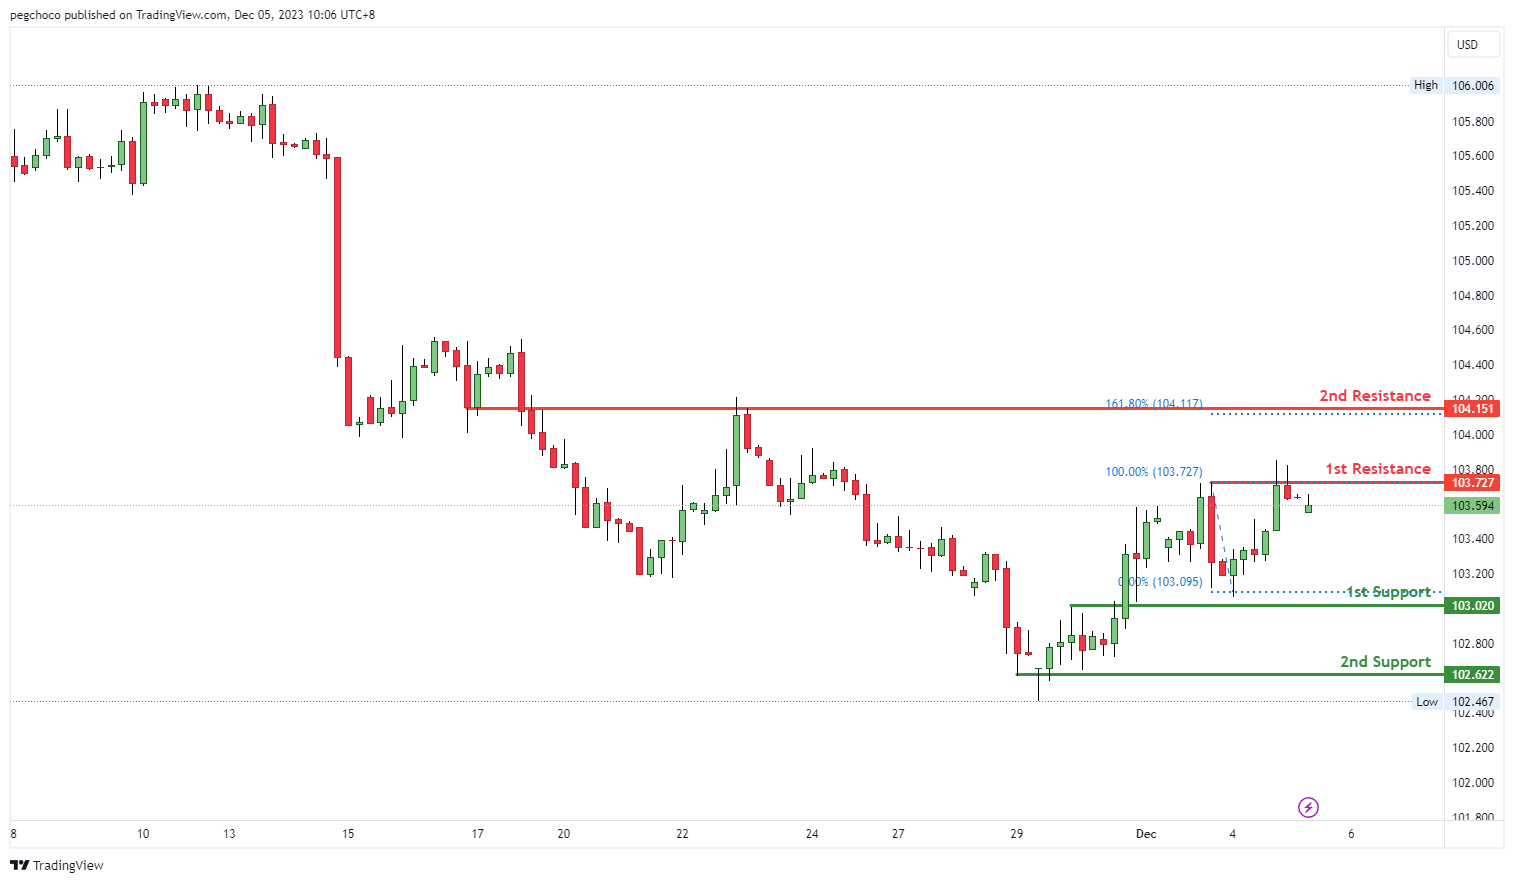
The DXY (US Dollar Index) chart currently has a bearish overall momentum. Price could potentially continue this bearish trend towards the 1st support at 103.02, which is identified as an overlap support. This level may act as a significant area where buying interest could emerge and potentially provide some support for the DXY.
If the bearish momentum continues, the 2nd support at 102.62, categorized as a multi-swing low support, may come into play as an additional level of potential support.
On the resistance side, the 1st resistance at 103.72 is noted as a multi-swing high resistance, indicating it as a significant barrier where selling interest may intensify, potentially limiting further upward movement. The 2nd resistance at 104.15 is categorized as an overlap resistance, adding to the potential resistance factors for the DXY.
EUR/USD:
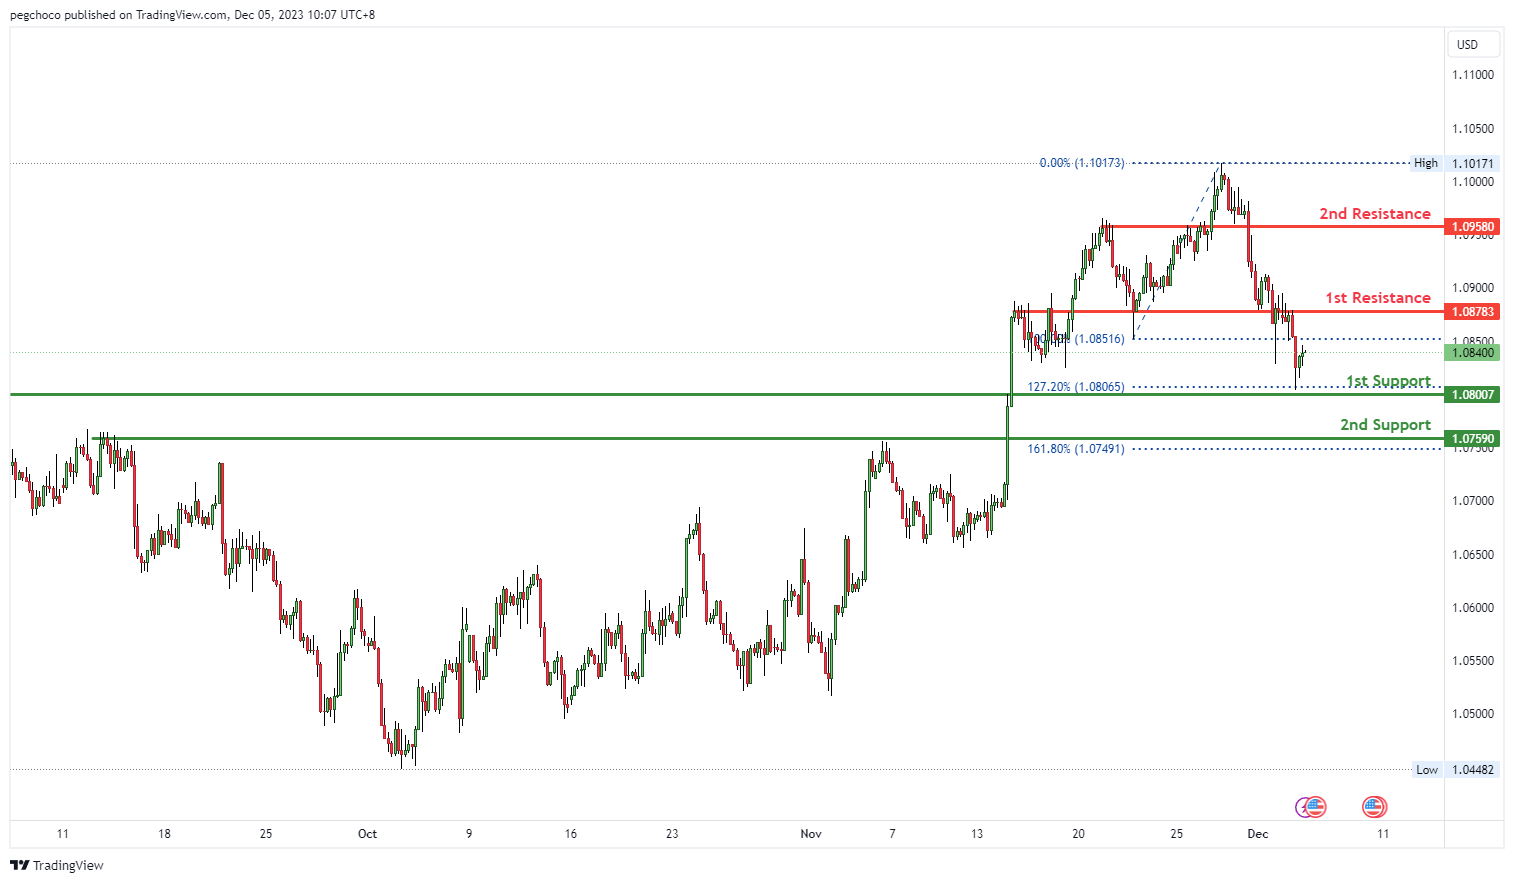
The EUR/USD chart currently exhibits a bullish overall momentum. Price could potentially experience a bullish bounce off the 1st support at 1.0800, which is identified as an overlap support with the added significance of a 127.20% Fibonacci Extension. This level may act as a strong support zone where buying interest could emerge, potentially propelling the currency pair higher.
If the bullish momentum continues, the 2nd support at 1.0759, categorized as a pullback support with the significance of a 161.80% Fibonacci Extension, may provide an additional level of support.
On the resistance side, the 1st resistance at 1.0878 is noted as an overlap resistance, indicating it as a significant barrier where selling interest may intensify, potentially limiting further upward movement. The 2nd resistance at 1.0958 is categorized as a pullback resistance, adding to the potential resistance factors for the EUR/USD.
EUR/JPY:
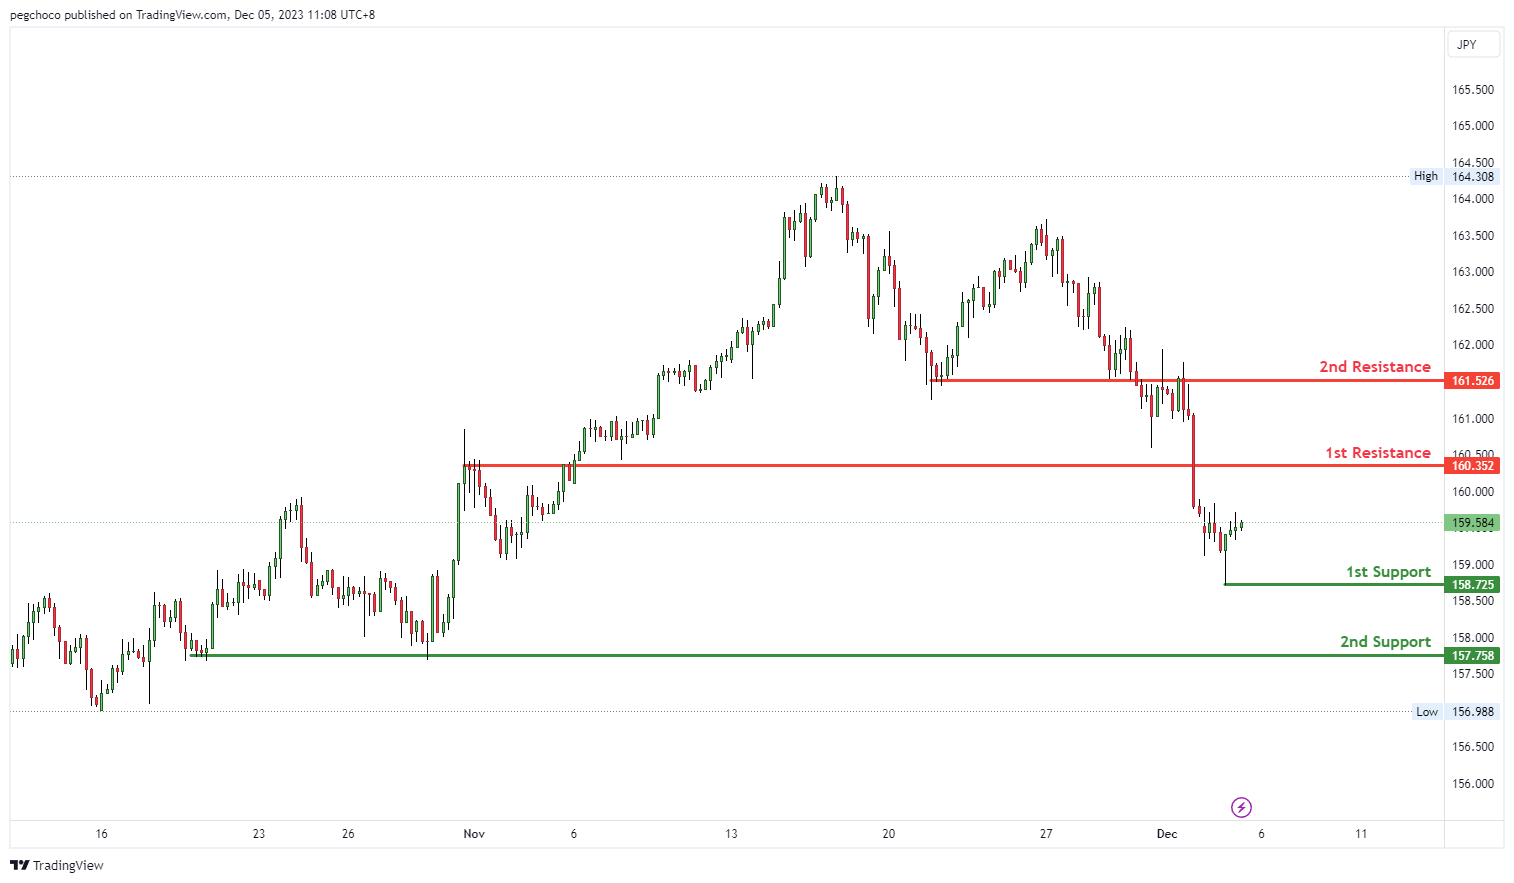
The EUR/JPY chart currently has a bearish overall momentum, and there’s a potential scenario in which the price could rise towards the 1st resistance in the short term before reversing and dropping towards the 1st support level.
1st support at 158.72: This level is identified as a swing low support, suggesting that it could be a significant area where buying interest may emerge, potentially providing support for EUR/JPY.
2nd support at 157.75: This support level is categorized as a multi-swing low support, indicating that it’s a level where buyers might become active.
On the resistance side, 1st resistance at 160.35: The 1st resistance is noted as a pullback resistance, suggesting that it’s a substantial barrier where selling interest could intensify, potentially triggering a reversal.
2nd resistance at 161.52: This is identified as an overlap resistance, indicating another level where selling pressure may increase.
EUR/GBP:
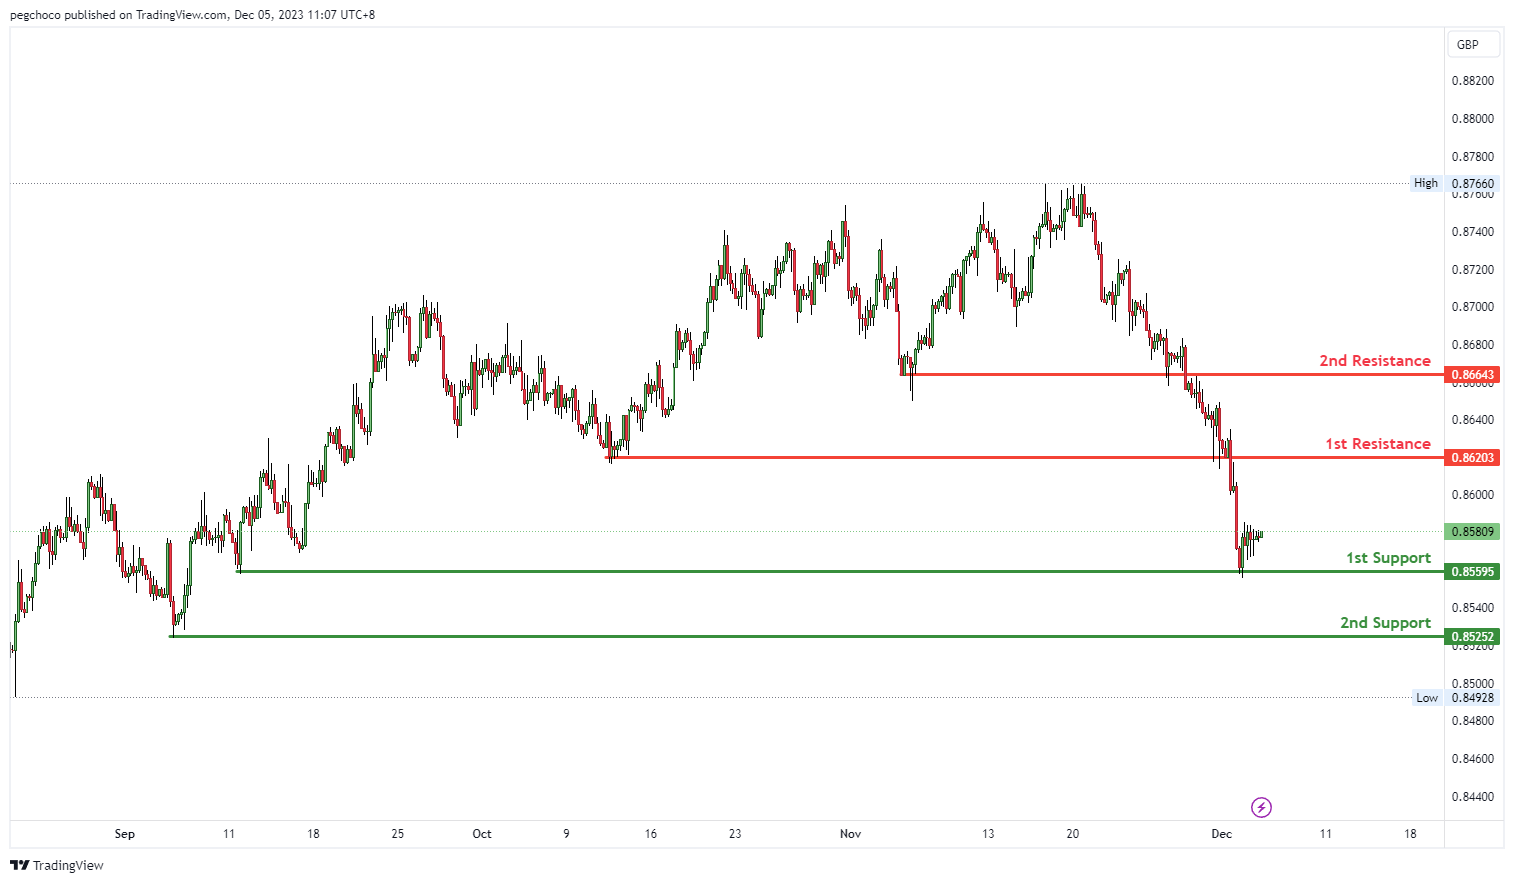
The EUR/GBP chart currently has a bearish overall momentum, and there’s a potential scenario in which the price could rise towards the 1st resistance in the short term before reversing and dropping towards the 1st support level.
1st support at 0.8559: This level is identified as a multi-swing low support, indicating that it could be a significant area where buying interest may emerge, potentially providing support for EUR/GBP.
2nd support at 0.8525: This support level is categorized as a swing low support, suggesting that it’s a level where buyers might become active.
On the resistance side, 1st resistance at 0.8620: The 1st resistance is noted as a pullback resistance, suggesting that it’s a substantial barrier where selling interest could intensify, potentially triggering a reversal.
2nd resistance at 0.8664: This is identified as an overlap resistance, indicating another level where selling pressure may increase.
GBP/USD:
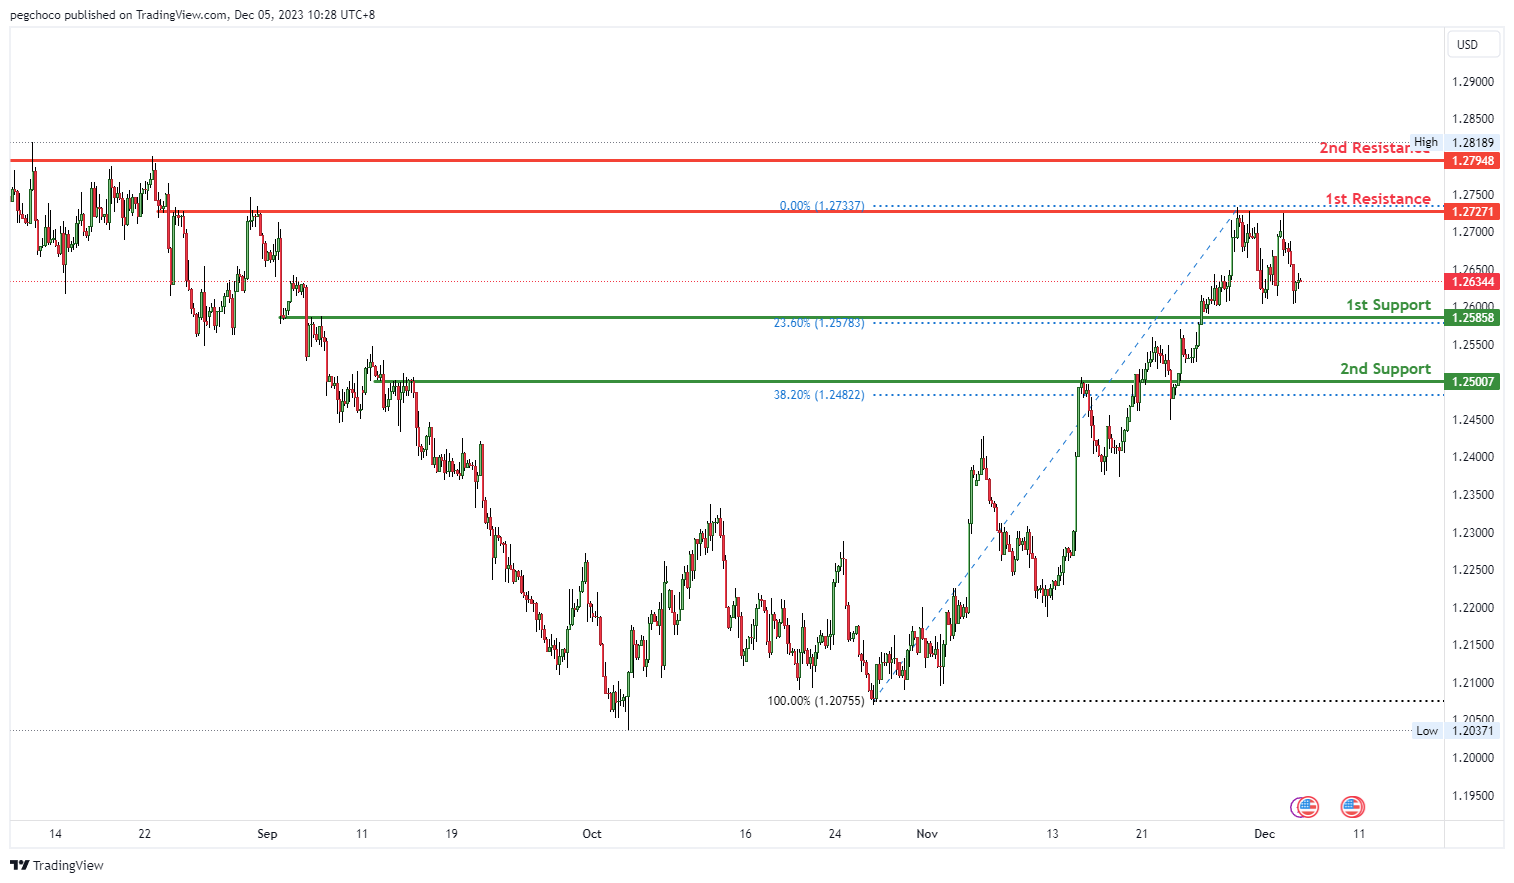
The GBP/USD chart currently has a bullish overall momentum. Price could potentially make a bullish bounce off the 1st support at 1.2585, which is identified as an overlap support and coincides with the 23.60% Fibonacci Retracement level. This support level may act as a strong zone where buying interest could emerge, potentially driving the currency pair higher.
If the bullish momentum continues, the 2nd support at 1.2500, categorized as a pullback support and associated with the 38.20% Fibonacci Retracement, may offer an additional level of support.
On the resistance side, the 1st resistance at 1.2727 is noted as an overlap resistance, indicating it as a significant barrier where selling interest may intensify. The 2nd resistance at 1.2794 is categorized as a multi-swing high resistance, further adding to potential resistance factors for the GBP/USD.
GBP/JPY:
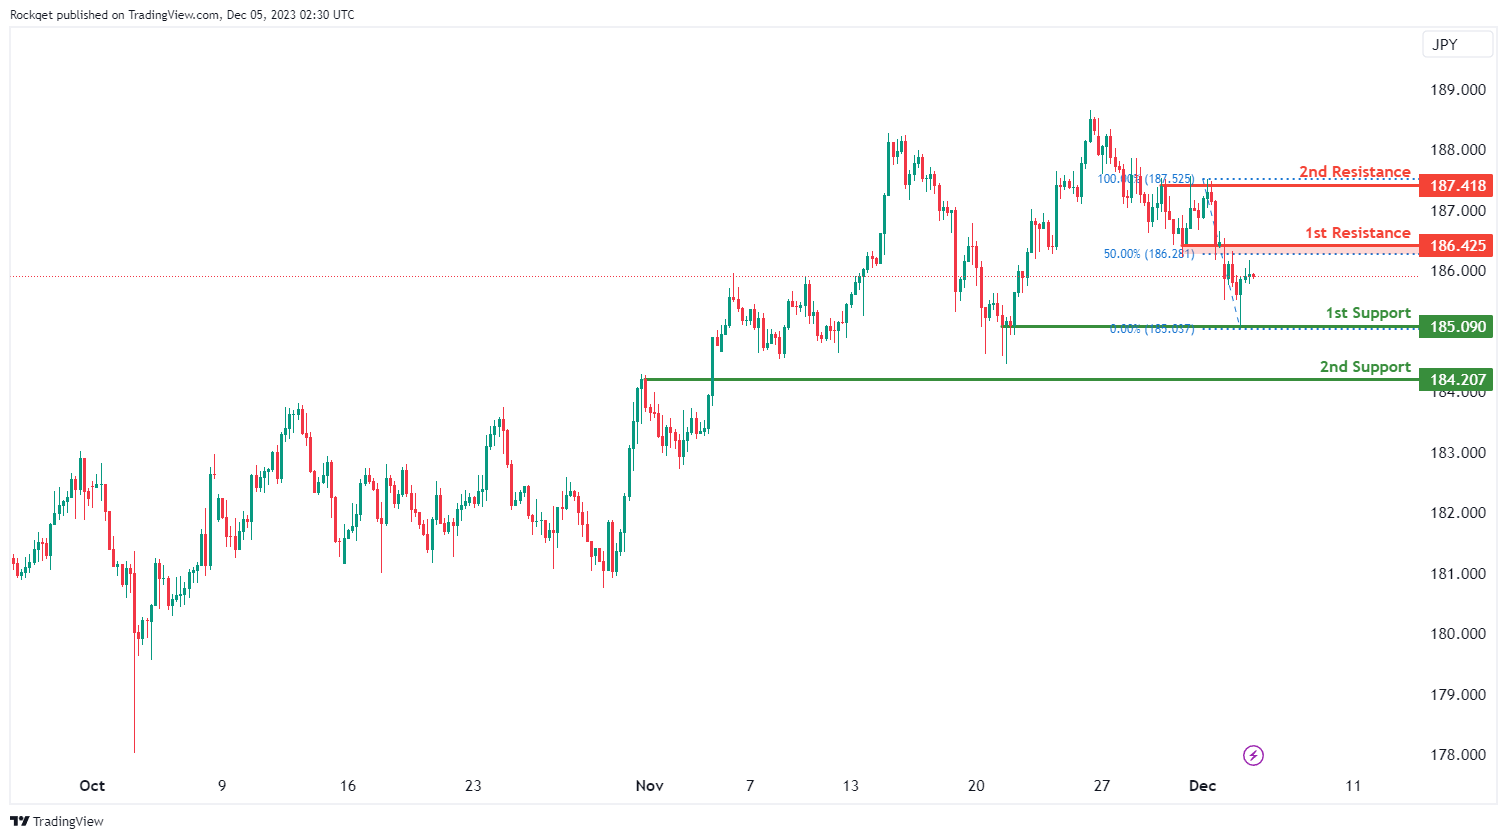
The overall momentum of GBP/JPY is bearish. Price could potentially rise towards the 1st resistance in the short term before reversing off it and dropping towards the 1st support.
There could be a potential bullish move towards the 1st resistance, but traders should watch for signs of reversal or a failure to break above the 186.43 level. If the price fails to break above the 1st resistance, it could reverse and target the support levels.
1st support at 185.09: This level is a multi-swing low support, suggesting potential buying interest if the price approaches it.
2nd support at 184.21: This support level is based on a pullback and could provide additional buying interest if tested.
1st resistance at 186.43: This is the initial resistance level. It’s an overlap resistance and coincides with the 50% Fibonacci Retracement, making it a significant barrier for potential bullish moves.
2nd resistance at 186.43 – This is the initial resistance level. It’s an overlap resistance and coincides with the 50% Fibonacci Retracement, making it a significant barrier for potential bullish moves.
USD/CHF:
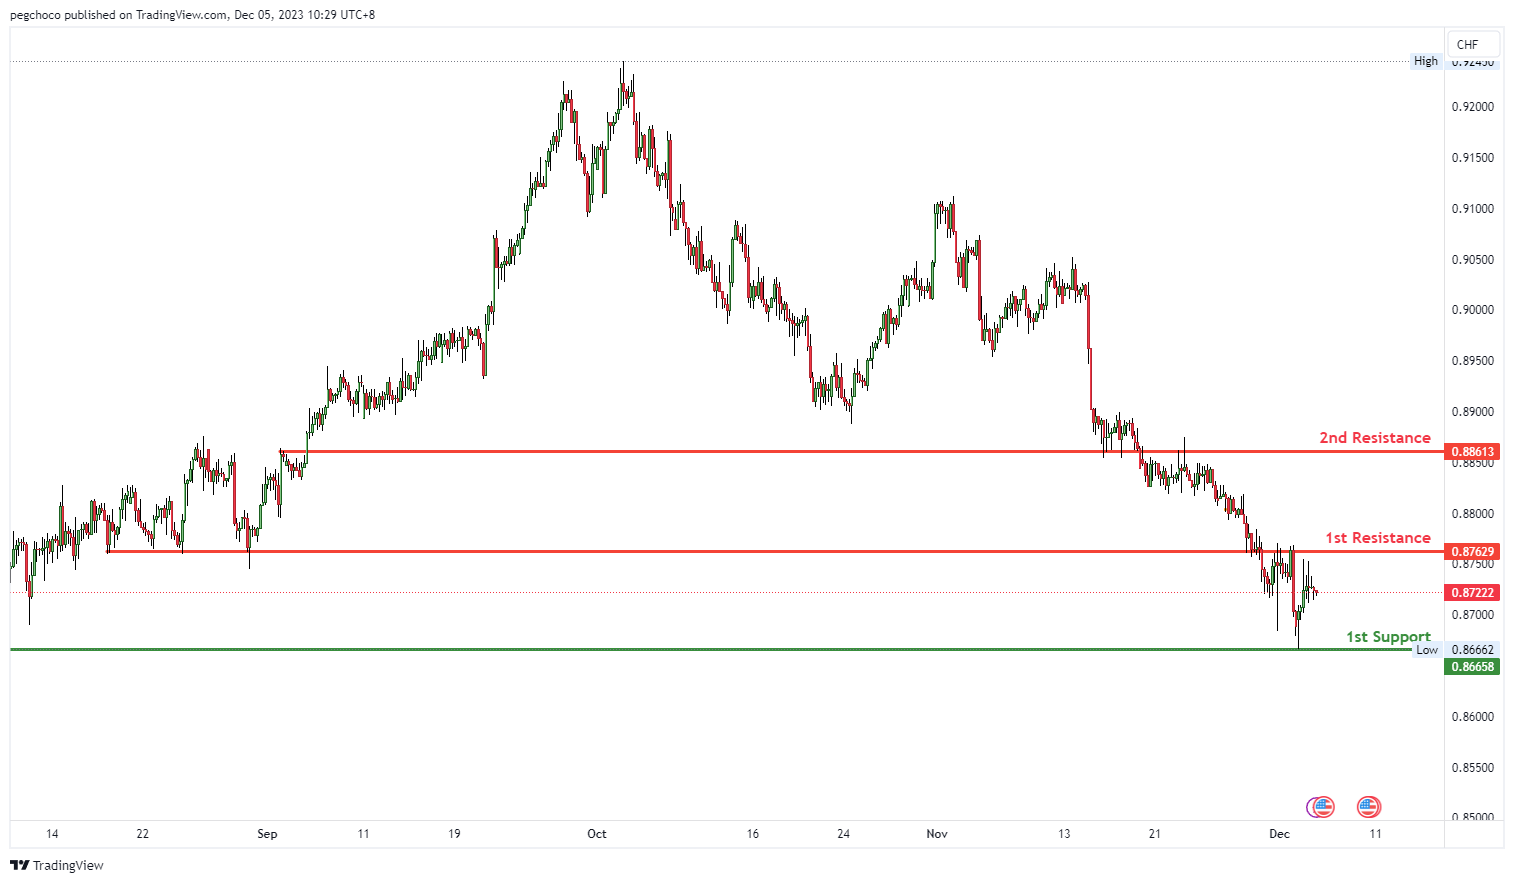
The USD/CHF chart currently has a bearish overall momentum, and price could potentially make a bearish continuation towards the 1st support at 0.8665. This support level is identified as a multi-swing low support, indicating that it has held as a significant level of buying interest in the past.
On the resistance side, the 1st resistance at 0.8762 is categorized as an overlap resistance, which suggests it could act as a substantial barrier where selling interest may intensify. The 2nd resistance at 0.8861 is also noted as an overlap resistance, further reinforcing the potential resistance factors for the USD/CHF.
USD/JPY:
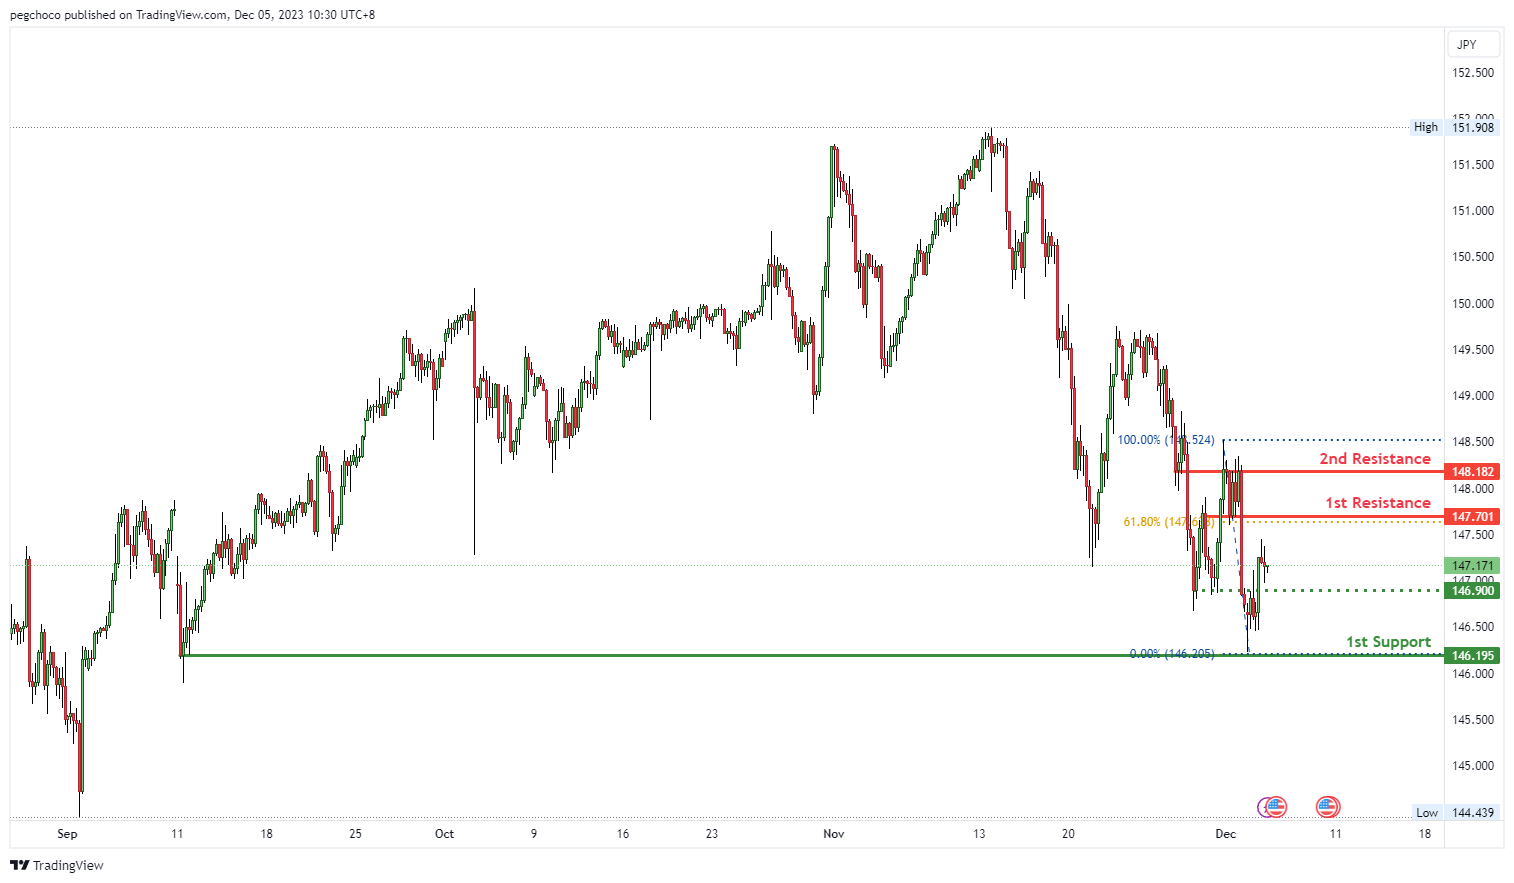
The USD/JPY chart currently has a bearish overall momentum, and price could potentially continue this bearish trend towards the 1st support at 146.19. This support level is identified as a swing low support, indicating its significance as a potential area where buying interest may emerge.
Additionally, there is an intermediate support at 146.90, categorized as an overlap support, which further reinforces its potential as a level where buyers might become active, potentially providing some support for USD/JPY.
On the resistance side, the 1st resistance at 147.70 is noted as a pullback resistance, and it also coincides with the 61.80% Fibonacci retracement level. This suggests it could act as a substantial barrier where selling interest may intensify. The 2nd resistance at 148.18 is categorized as an overlap resistance.
USD/CAD:
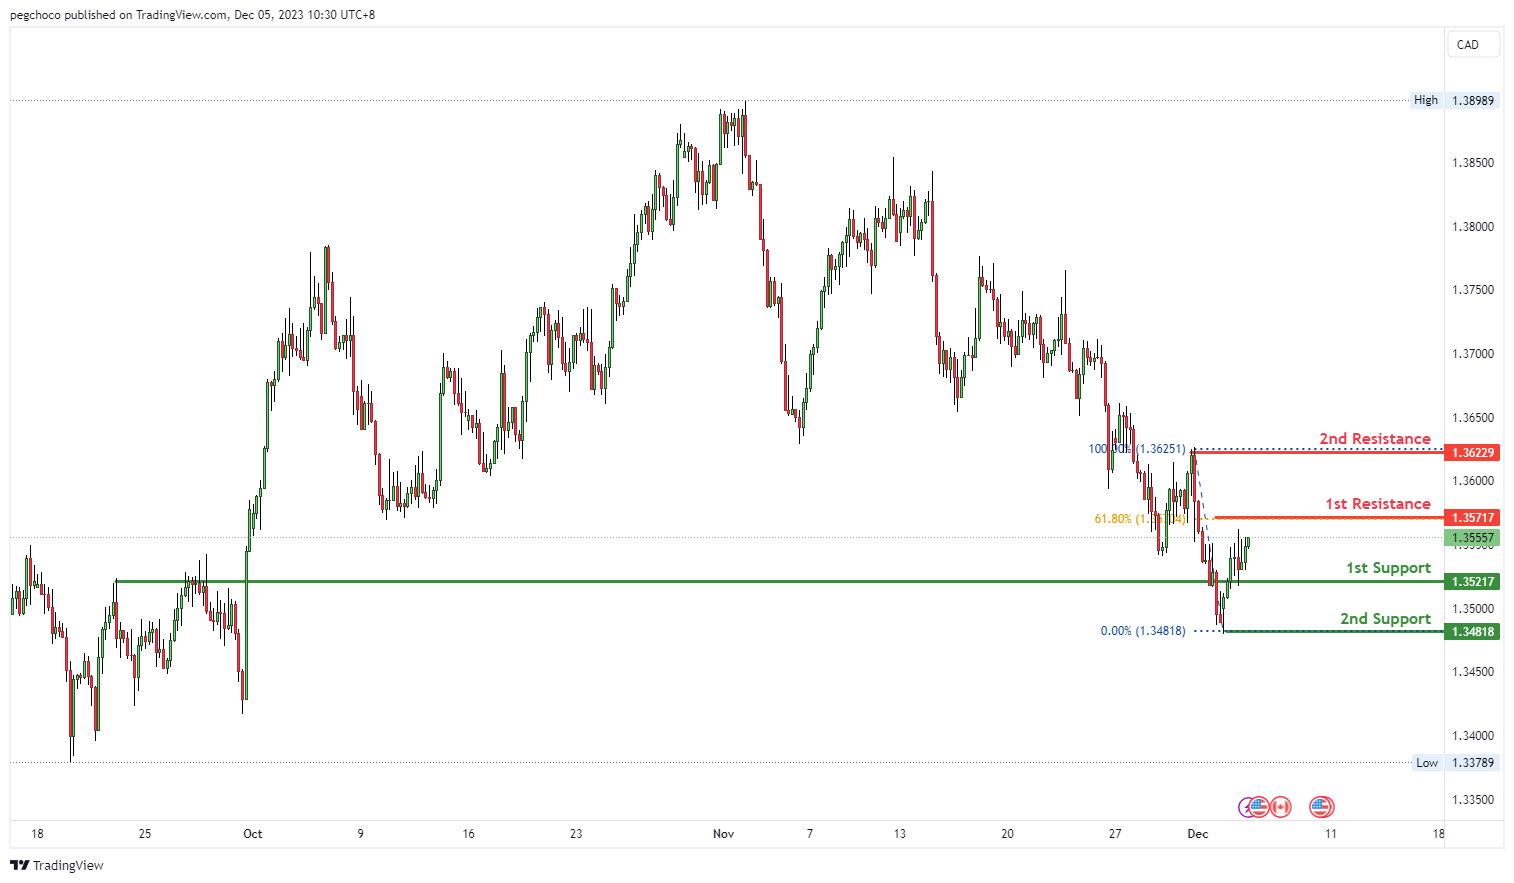
The USD/CAD chart currently exhibits a bearish overall momentum, and there is potential for a bearish reaction off the 1st resistance level, leading to a drop towards the 1st support.
The 1st support at 1.3521 is identified as an overlap support level, indicating it could be a significant level where buying interest may emerge.
Further down, there is a 2nd support at 1.3481, noted as a swing low support, which adds to its potential importance as another area where buyers might become active.
On the resistance side, the 1st resistance at 1.3571 is supported by the 61.80% Fibonacci Retracement level, suggesting it could act as a substantial barrier where selling interest may intensify. The 2nd resistance at 1.3622 is identified as a swing high resistance, reinforcing the potential resistance factors for USD/CAD.
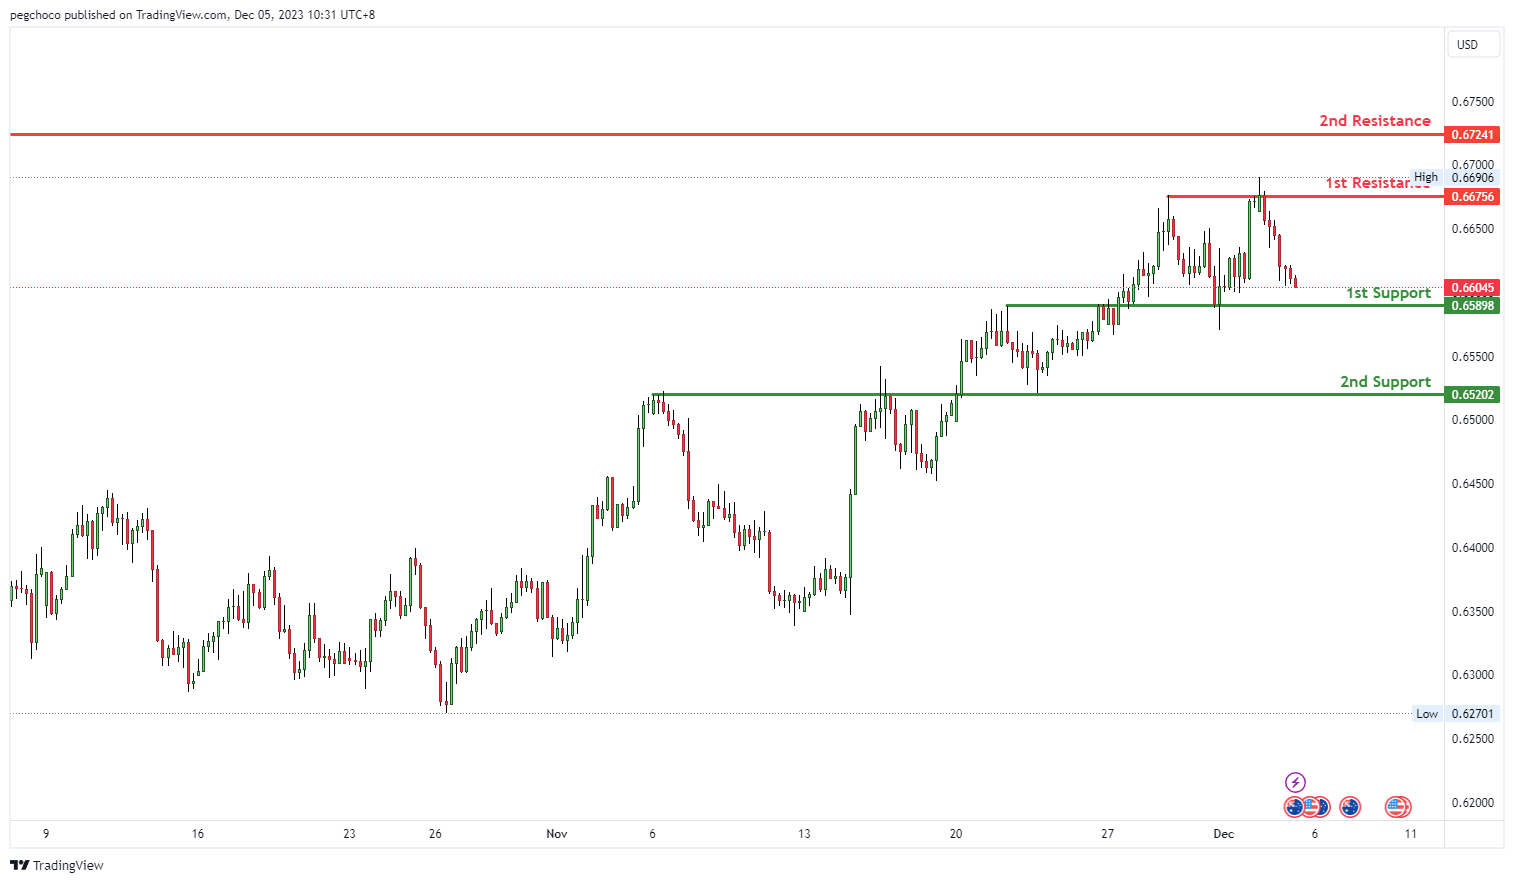
AUD/USD:
The AUD/USD chart currently exhibits a bearish overall momentum, and there is potential for a bearish continuation towards the 1st support level.
The 1st support at 0.6589 is identified as an overlap support, indicating it could be a significant level where buying interest may emerge.
Further down, there is a 2nd support at 0.6520, also noted as an overlap support level, which adds to its potential importance as another area where buyers might become active.
On the resistance side, the 1st resistance at 0.6675 is categorized as a multi-swing high resistance, suggesting it could act as a substantial barrier where selling interest may intensify. The 2nd resistance at 0.6724 is identified as a swing high resistance, reinforcing the potential resistance factors for AUD/USD.
NZD/USD
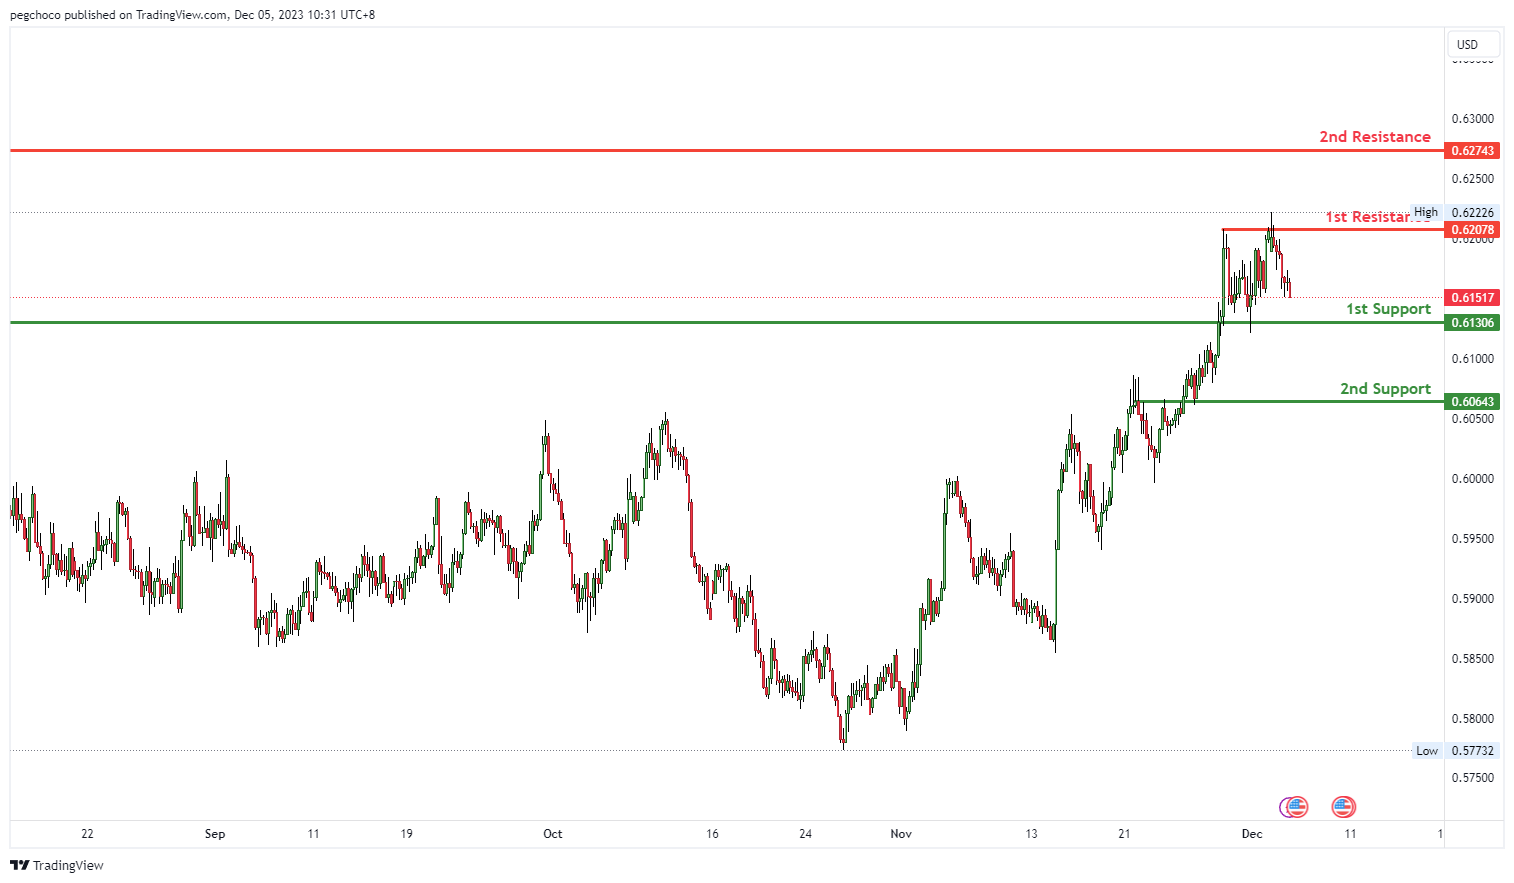
The NZD/USD chart currently exhibits a bearish overall momentum, and there is potential for a bearish continuation towards the 1st support level.
The 1st support at 0.6130 is considered significant as it aligns with an overlap support level, indicating it could serve as a strong level where buying interest might emerge.
Further down, there is a 2nd support at 0.6064, also identified as an overlap support level, adding to its potential importance as another area where buyers could become active.
On the resistance side, the 1st resistance at 0.6207 is categorized as a multi-swing high resistance, suggesting it could act as a substantial barrier where selling interest may intensify. The 2nd resistance at 0.6274 is noted as a swing high resistance, further reinforcing the potential resistance factors for NZD/USD.
DJ30:
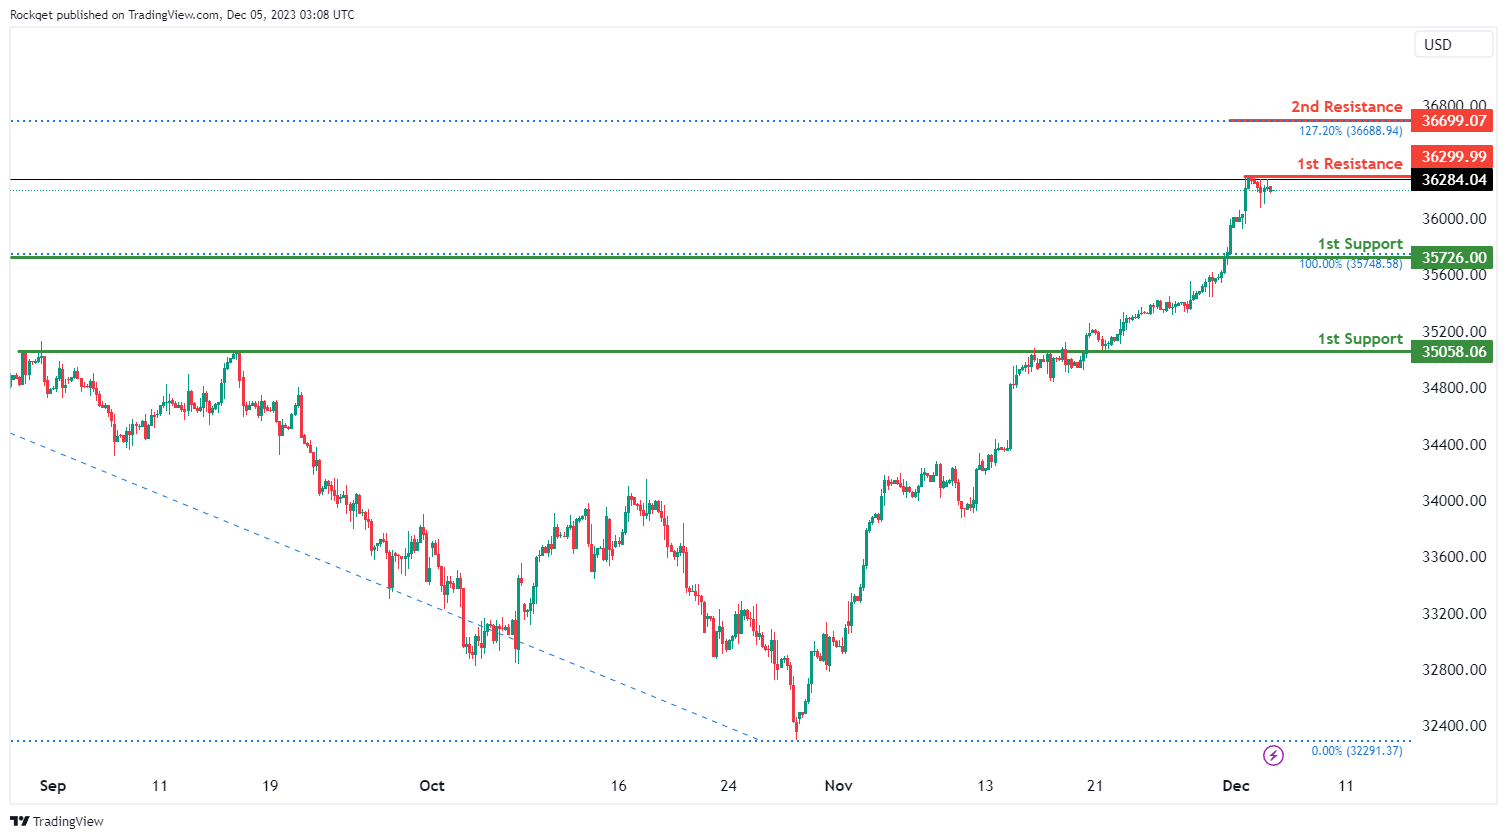
The DJ30,the momentum of the chart is the overall momentum of the chart is weak bullish with low confidence. Price could potentially make a bullish continuation towards 1st resistance.
1st support at 35726.00: This level is a multi-swing low support, indicating that it has previously provided a base for the price. Traders may view this as a potential level for buying interest.
2nd support at 35058.06: This level represents an overlap support, which is formed when previous price action has clustered around a particular level. It could act as a support zone if the price approaches it.
1st resistance at 36299.99: This level is a swing high resistance, where the price has encountered selling pressure in the past. Traders may look for potential bullish breakouts or reversals around this level.
2nd resistance at 3699.07: This level aligns with the 127.2% fibonacci retracement level.
GER40:
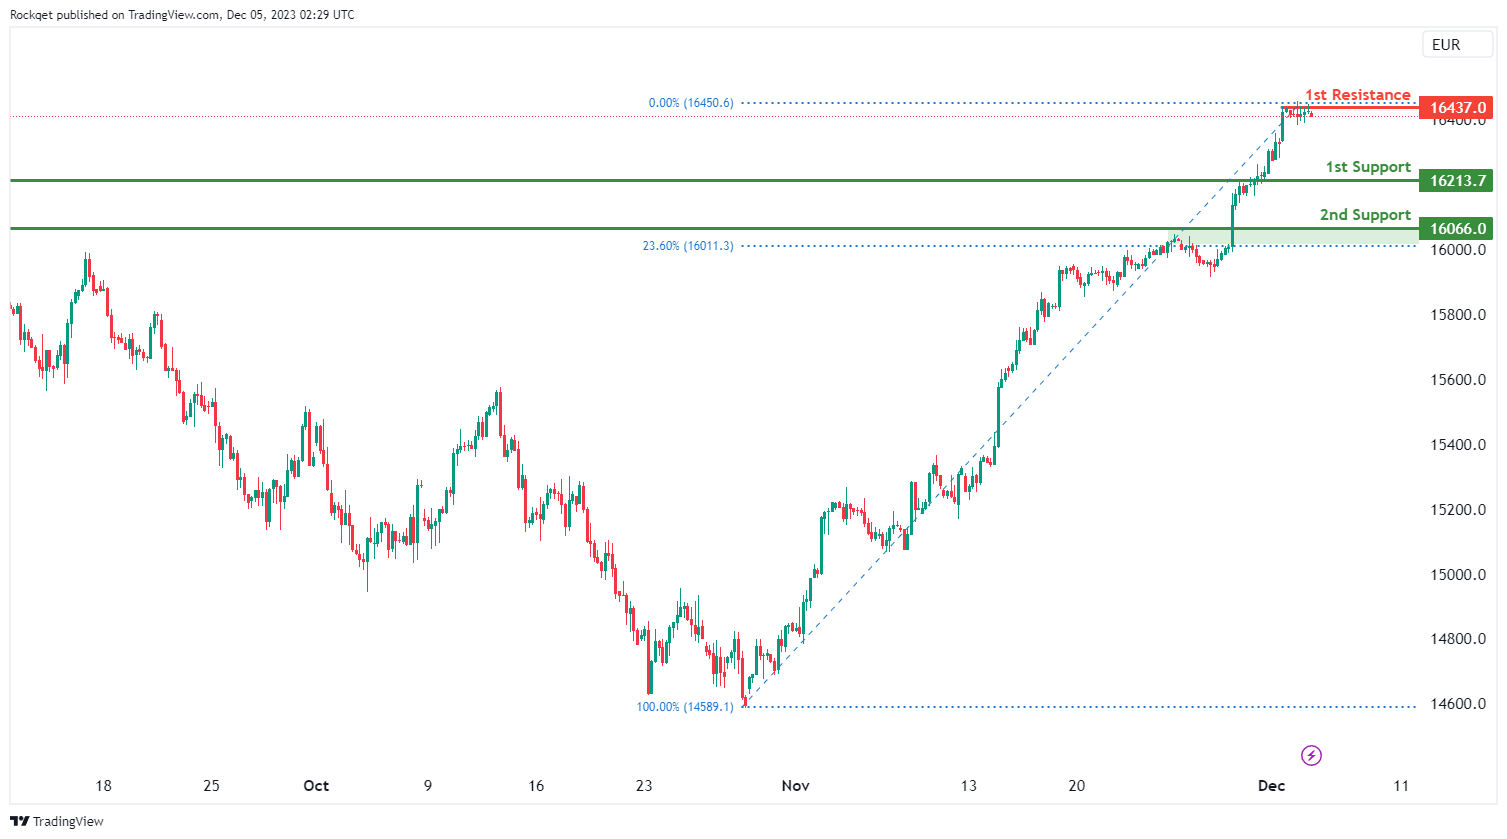
The GER40 overall momentum is the overall momentum of the chart is bearish. There is a potential bearish reaction off 1st resistance and drop to 1st support.
1st support at 16213.7: This level is a pullback support and has previously acted as a support level. It might attract buying interest if the price approaches it.
2nd support at 15523.4 (23.60% Fibonacci Retracement): Fibonacci retracement levels are often watched by traders as potential support or resistance areas. This level aligns with a key Fibonacci retracement, making it a significant support level.
1st resistance at 16437.0: This level is a swing high resistance. It’s an important level where the price has previously encountered selling pressure. Traders may look for potential reversals or bearish opportunities around this level.
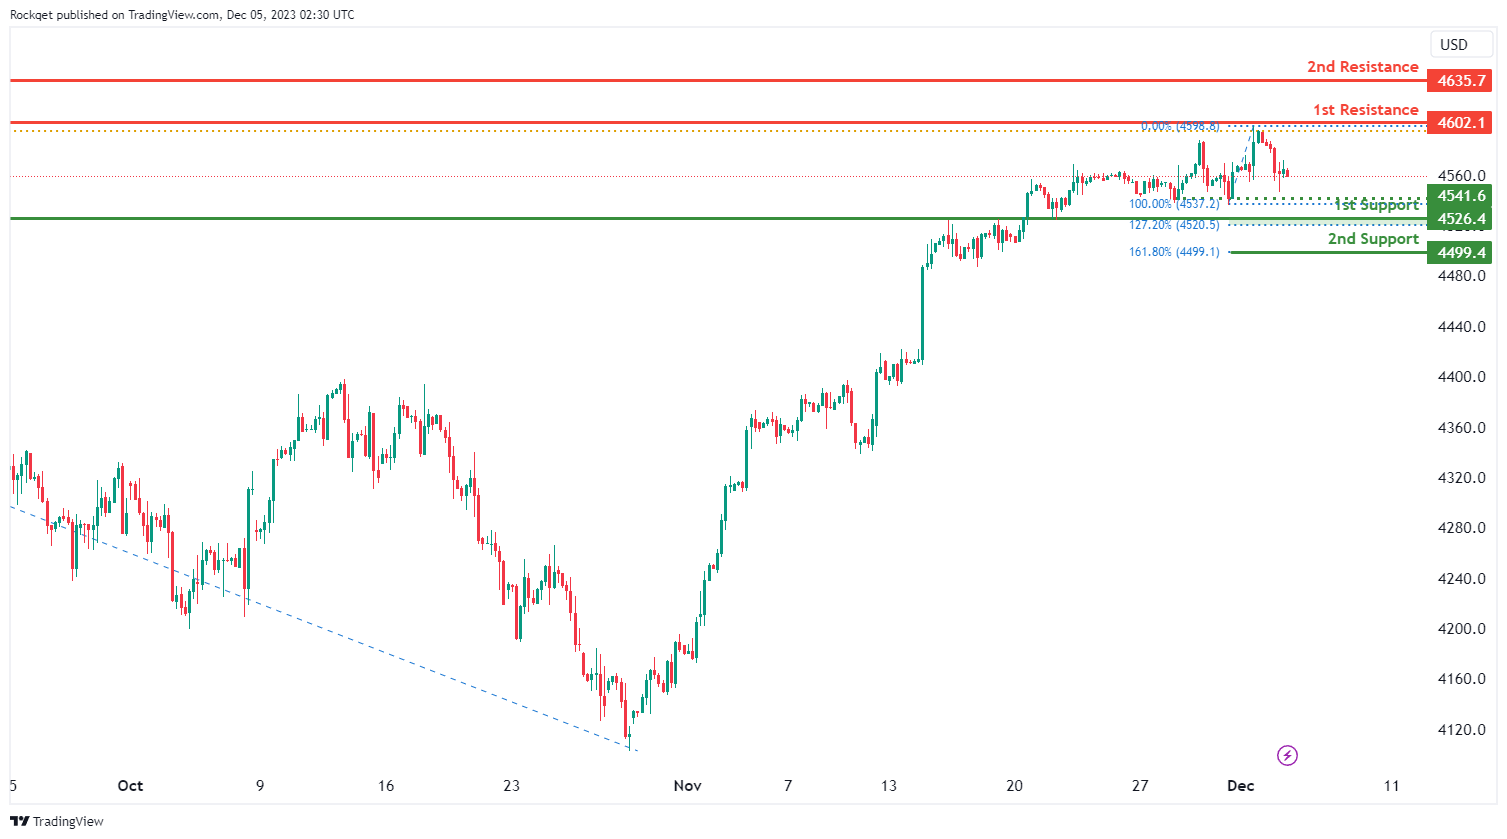
US500:
The overall momentum of US500 is the overall momentum of the chart is bearish. There is a possibility of a bearish continuation towards 1st support.
1st support at 4526.4: This level is a pullback support, which makes it a good candidate for a potential bounce. It has previously acted as a support level.
2nd support at 4499.4: This level corresponds to the 161.80% Fibonacci Extension. Fibonacci extensions are used to identify potential reversal or continuation levels. In this case, it provides an additional support level.
1st resistance at 4602.1: This level is a pullback resistance and coincides with the 61.80% Fibonacci Projection. It’s a significant resistance area where price may face selling pressure. A break above this level could signal a bullish reversal.
2nd resistance at 4635.7: This level represents a swing high resistance, which could act as a strong barrier for further upside. It’s another important level to watch for potential reversals.
BTC/USD:
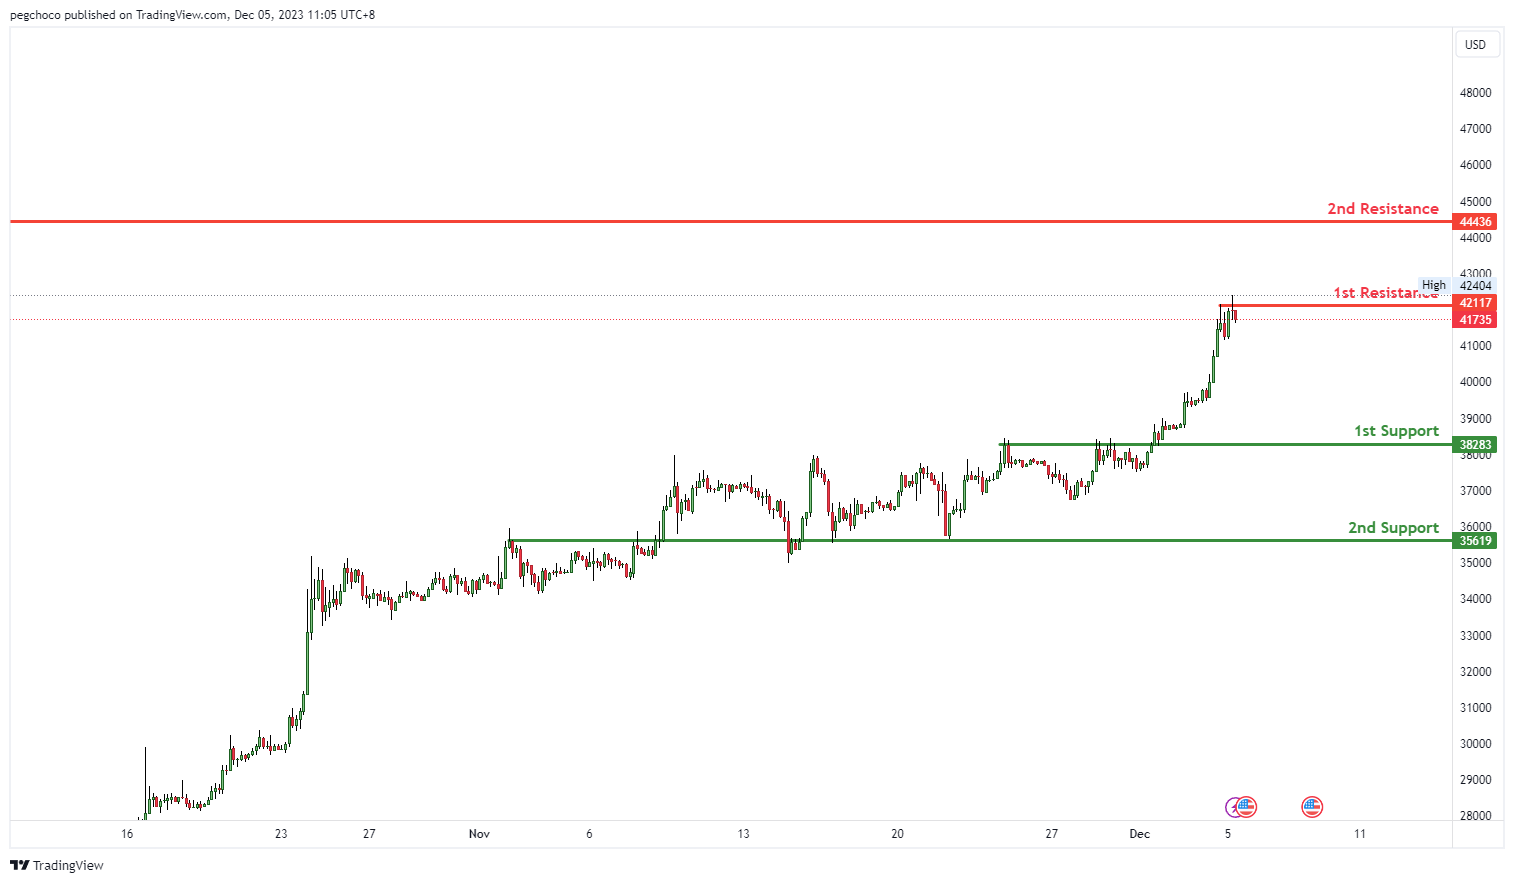
The BTC/USD chart currently has a bearish overall momentum, and there’s potential for a bearish continuation towards the 1st support level.
The 1st support at 38283 is categorized as an overlap support, indicating that it could be a significant level where buying interest may emerge, potentially providing support for the BTC/USD pair.
Further down, there is a 2nd support at 35619, also identified as an overlap support. This reinforces the significance of this support level, suggesting it as a potential area where buyers might become active.
On the resistance side, the 1st resistance at 41735 is noted as a swing high resistance. This implies that it’s a substantial barrier where selling interest could intensify, potentially triggering a bearish continuation.
The 2nd resistance at 44436 is identified as a pullback resistance, indicating another level where selling pressure may increase.
ETH/USD:
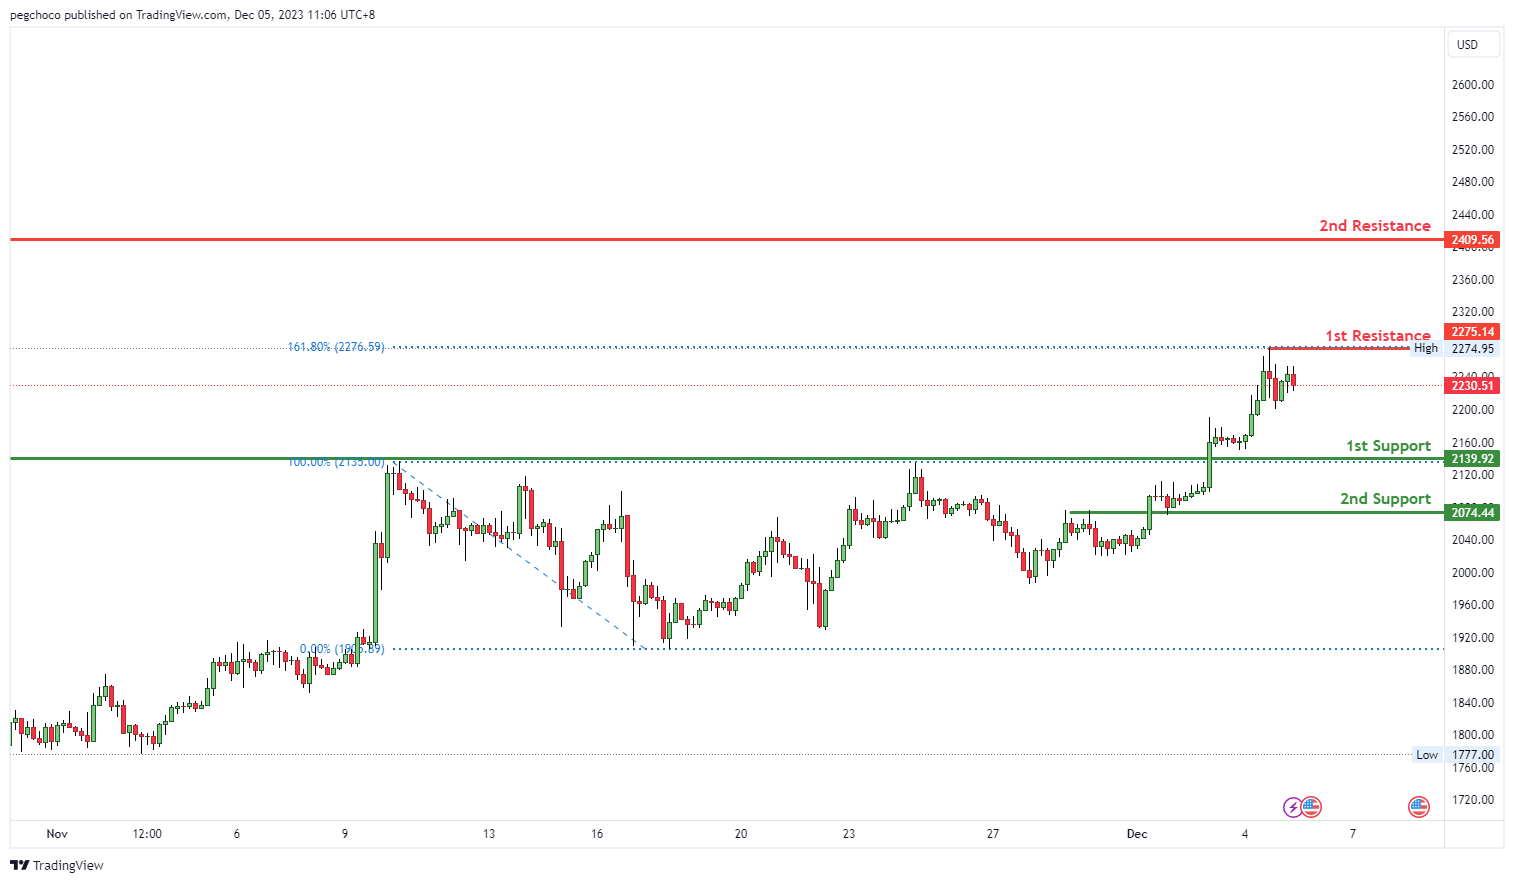
The ETH/USD chart currently has a bearish overall momentum, and there’s potential for a bearish continuation towards the 1st support level.
The 1st support at 2139.92 is categorized as a pullback support, indicating that it could be a significant level where buying interest may emerge, potentially providing support for the ETH/USD pair.
Further down, there is a 2nd support at 2074.44, identified as an overlap support. This adds to the significance of this support level, indicating it as a potential area where buyers might become active.
On the resistance side, the 1st resistance at 2275.14 is noted as a swing high resistance. This suggests that it’s a substantial barrier where selling interest could intensify, potentially triggering a bearish continuation.
The 2nd resistance at 2409.56 is identified as a multi-swing high resistance, reinforcing the potential resistance factors for ETH/USD.
WTI/USD:
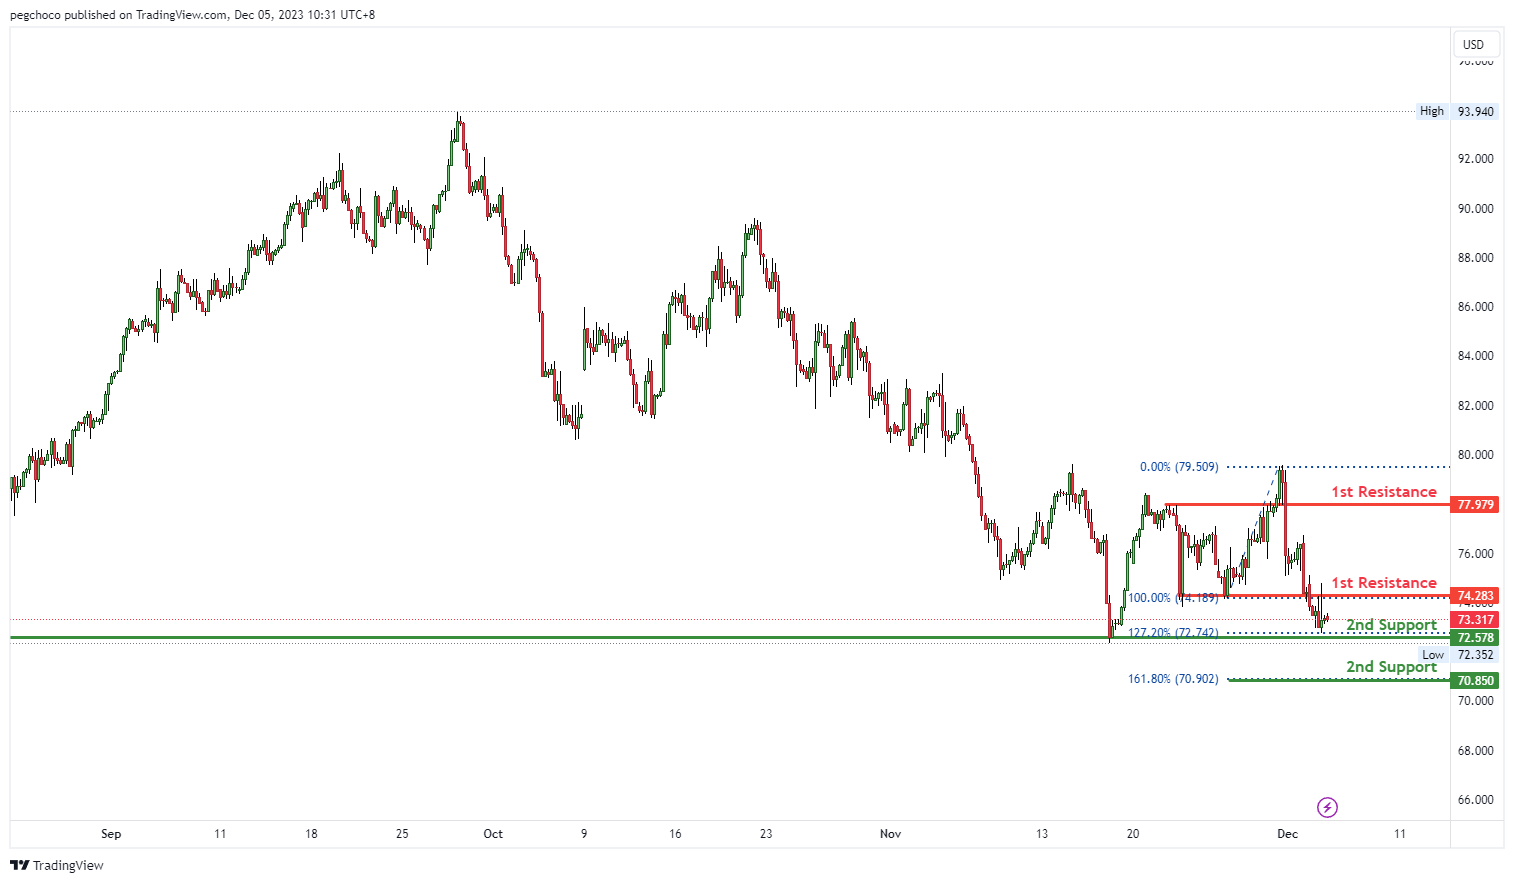
The WTI chart currently shows a bearish overall momentum, and it could potentially continue this bearish trend by breaking below the 1st support and heading towards the 2nd support.
The 1st support at 72.57 is considered significant as it aligns with a multi-swing low support level and coincides with the 127.20% Fibonacci extension level, adding to its importance as a potential area where buying interest may emerge.
Further down, there is a 2nd support at 70.85, which is also identified as a support level and corresponds with the 161.80% Fibonacci extension level, emphasizing its potential significance as another level where buyers might become active.
On the resistance side, the 1st resistance at 74.28 is categorized as an overlap resistance, suggesting it could act as a substantial barrier where selling interest may intensify. The 2nd resistance at 77.97 is noted as a pullback resistance, further reinforcing potential resistance factors for WTI.
XAU/USD (GOLD):
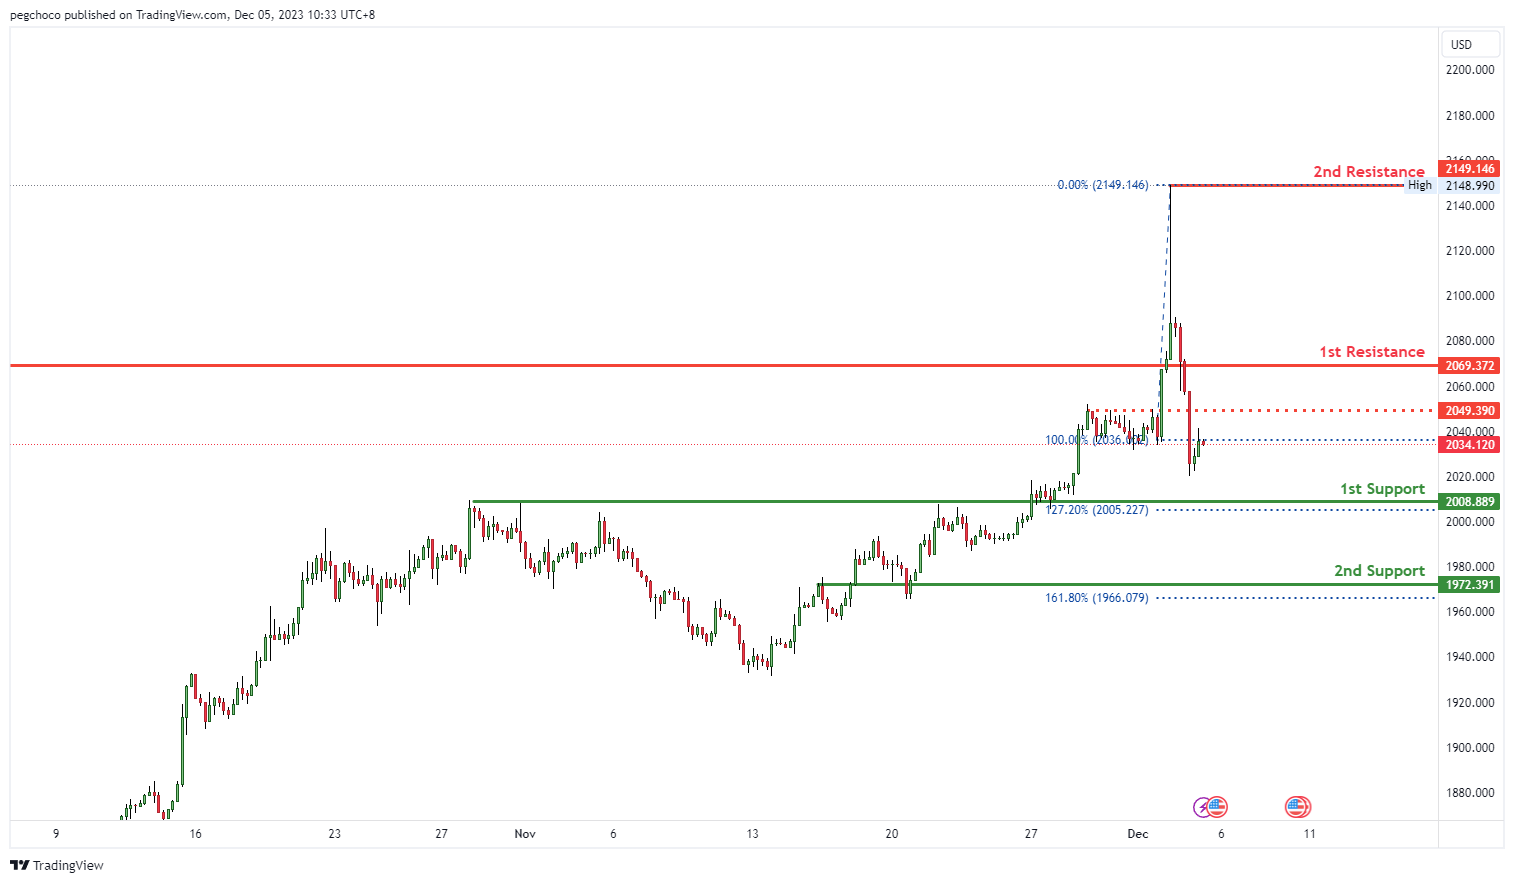
The XAU/USD (Gold) chart currently exhibits a bearish overall momentum, and it could potentially continue this bearish trend towards the 1st support at 2008.88. This support level is categorized as a pullback support and coincides with the 127.20% Fibonacci extension level, adding to its significance as a potential area where buying interest may emerge.
Further down, there is a 2nd support at 1972.39, which is also identified as a pullback support and aligns with the 161.80% Fibonacci extension level, emphasizing its potential importance as a level where buyers might become active.
On the resistance side, the 1st resistance at 2069.37 is categorized as a pullback resistance, indicating it could act as a substantial barrier where selling interest may intensify. The 2nd resistance at 2149.14 is noted as a swing high resistance, further reinforcing potential resistance factors for XAU/USD.
RBA holds rates following sparse information since last meeting
RBA kept its cash rate target unchanged at 4.35%, aligning with market expectations. The central bank's latest statement indicates continued openness to further rate hikes, but emphasizes that any such decision "will depend upon the data and the evolving assessment of risks." This stance reflects a careful approach, as RBA awaits more comprehensive data, particularly the Q4 inflation figures due in January, before its next meeting in early February.
In its review of the "limited information" available since November meeting, RBA acknowledged that the data were "broadly in line with expectations." The October monthly CPI update suggested continued moderation in inflation, but did not provide substantial insights into services inflation. While wage growth accelerated in Q3, it is "not expected to increase much further". The labor market conditions are seen as "continuing to ease gradually," though they remain tight.
RBA also highlighted "still significant uncertainties" regarding the economic outlook. It pointed out the potential for persistent services inflation in Australia. Domestically, the uncertainties include the lag effects of monetary policy and household consumption patterns. On a global scale, the ongoing uncertainty around Chinese economy's trajectory and the broader implications of international conflicts were noted as significant factors influencing Australia's economic environment.
(RBA) Statement by Michele Bullock, Governor: Monetary Policy Decision
At its meeting today, the Board decided to leave the cash rate target unchanged at 4.35 per cent and the interest rate paid on Exchange Settlement balances unchanged at 4.25 per cent.
Last month, the Board increased interest rates by 25 basis points, following a period of four months where it had held interest rates steady. This decision reflected the Board's view that progress in bringing inflation back to the target range of 2 to 3 per cent was looking slower than earlier forecast. While the economy has been experiencing a period of below-trend growth, it was stronger than expected over the first half of the year. Underlying inflation was higher than expected at the time of the August forecasts, including across a broad range of services. Conditions in the labour market had eased but remained tight. Housing prices were continuing to rise across the country as was the number of new mortgages. Given this, the Board judged that the risk of inflation remaining higher for longer had risen and an increase in interest rates was therefore warranted to be more assured that inflation would return to target in a reasonable timeframe.
The limited information received on the domestic economy since the November meeting has been broadly in line with expectations. The monthly CPI indicator for October suggested that inflation is continuing to moderate, driven by the goods sector; the inflation update did not, however, provide much more information on services inflation. Overall, measures of inflation expectations remain consistent with the inflation target. Wages growth picked up in the September quarter but this was expected given that it captured the earlier Fair Work Commission decision on award wages. Wages growth is not expected to increase much further and remains consistent with the inflation target, provided productivity growth picks up. Conditions in the labour market also continued to ease gradually, although they remain tight.
Higher interest rates are working to establish a more sustainable balance between aggregate supply and demand in the economy. The impact of the more recent rate rises, including last month's, will continue to flow through the economy. High inflation is weighing on people's real incomes and household consumption growth is weak, as is dwelling investment. Holding the cash rate steady at this meeting will allow time to assess the impact of the increases in interest rates on demand, inflation and the labour market.
Returning inflation to target within a reasonable timeframe remains the Board's priority. High inflation makes life difficult for everyone and damages the functioning of the economy. It erodes the value of savings, hurts household budgets, makes it harder for businesses to plan and invest, and worsens income inequality. And if high inflation were to become entrenched in people's expectations, it would be much more costly to reduce later, involving even higher interest rates and a larger rise in unemployment. To date, medium-term inflation expectations have been consistent with the inflation target and it is important that this remains the case.
There are still significant uncertainties around the outlook. While there have been encouraging signs on goods inflation abroad, services price inflation has remained persistent and the same could occur in Australia. There also remains a high level of uncertainty around the outlook for the Chinese economy and the implications of the conflicts abroad. Domestically, there are uncertainties regarding the lags in the effect of monetary policy and how firms' pricing decisions and wages will respond to the slower growth in the economy at a time when the labour market remains tight. The outlook for household consumption also remains uncertain, with many households experiencing a painful squeeze on their finances, while some are benefiting from rising housing prices, substantial savings buffers and higher interest income.
Whether further tightening of monetary policy is required to ensure that inflation returns to target in a reasonable timeframe will depend upon the data and the evolving assessment of risks. In making its decisions, the Board will continue to pay close attention to developments in the global economy, trends in domestic demand, and the outlook for inflation and the labour market. The Board remains resolute in its determination to return inflation to target and will do what is necessary to achieve that outcome.
GBP/USD Remains In Uptrend But Bulls Lose Strength
Key Highlights
- GBP/USD rallied toward 1.2740 before it corrected lower.
- A key bullish trend line is forming with support near 1.2610 on the 4-hour chart.
- EUR/USD corrected lower below the 1.0880 support zone.
- The US ISM Services PMI could increase from 51.8 to 52.0 in Nov 2023.
GBP/USD Technical Analysis
The British Pound started a steady increase above the 1.2500 resistance against the US Dollar. GBP/USD even spiked above 1.2700 before the bears appeared.
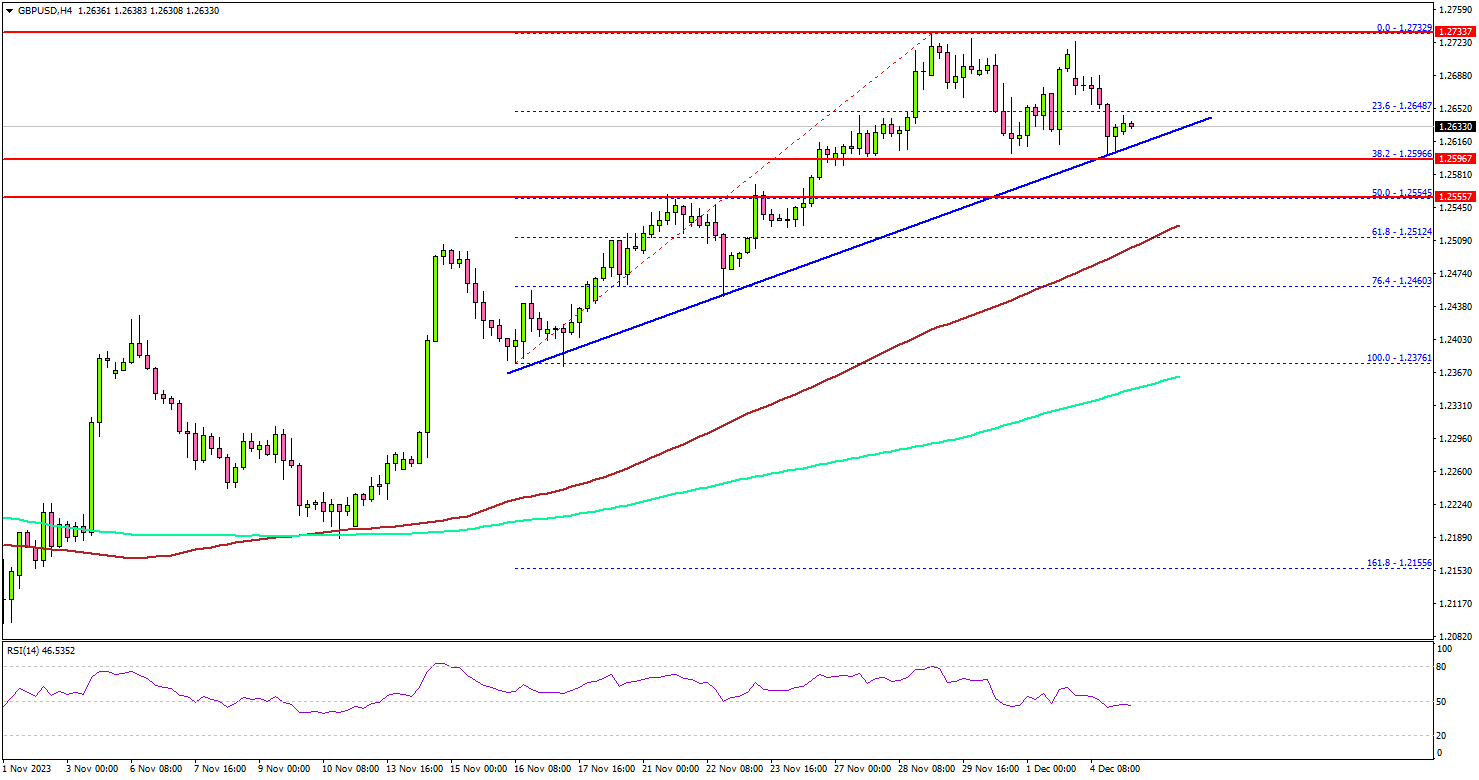
Looking at the 4-hour chart, the pair settled above the 1.2600 pivot level, the 100 simple moving average (red, 4 hours), and the 200 simple moving average (green, 4 hours).
A high was formed near 1.2732 before the pair corrected lower. There was a move below the 1.2700 and 1.2765 levels. The pair even declined below the 23.6% Fib retracement level of the upward move from the 1.2376 swing low to the 1.2732 high.
It is now testing the 1.2620 support. There is also a key bullish trend line forming with support near 1.2610 on the same chart.
The next key support is near 1.2550 or the 50% Fib retracement level of the upward move from the 1.2376 swing low to the 1.2732 high, below which the pair could test the 1.2500 level in the near term. Any more losses might call for a move toward 1.2440.
On the upside, immediate resistance is near the 1.2680 level. The next key resistance is near the 1.2720 level. A close above the 1.2720 zone could open the doors for more upsides. The next stop for the bulls might be 1.2800.
Looking at EUR/USD, the pair started a downside correction, and it even broke the 1.0880 support zone.
Economic Releases
- Euro Zone Services PMI for Nov 2023 – Forecast 48.2, versus 48.2 previous.
- UK Services PMI for Nov 2023 – Forecast 50.5, versus 50.5 previous.
- US Services PMI for Nov 2023 – Forecast 50.8, versus 50.8 previous.
- US ISM Services PMI for Nov 2023 – Forecast 52.0, versus 51.8 previous.
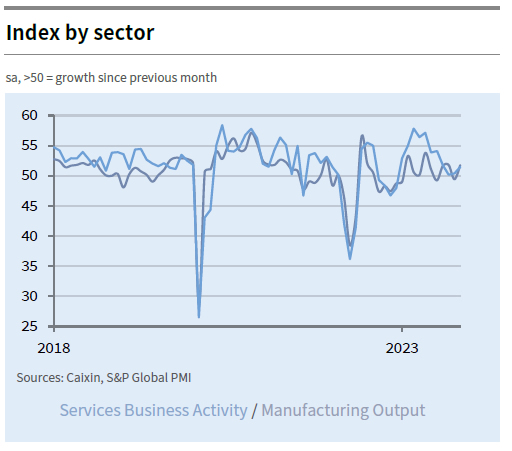
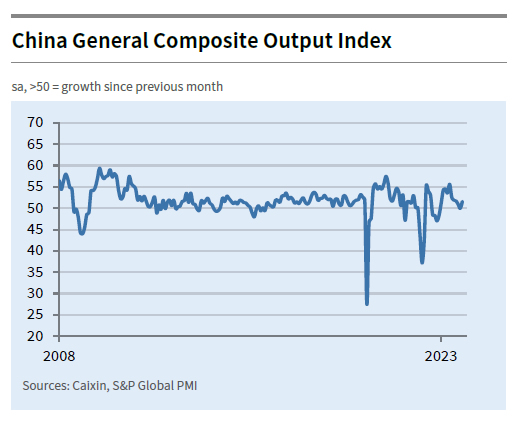
China’s PMI services rose to 51.5 in Nov, composite rose to 51.6
China's Caixin PMI Services rose from 50.4 to 51.5 in November, above expectation of 50.8. PMI Composite rose from 50.0 to 51.6.
Wang Zhe, Senior Economist at Caixin Insight Group said: "Overall, the macroeconomy showed signs of a positive recovery, with steady growth in consumer spending, solid progress in industrial production and improved market expectations.
"However, due to various unfavorable factors, both domestic and external demand still face challenges and employment pressures remain relatively high. The foundation for economic recovery needs to be further consolidated."
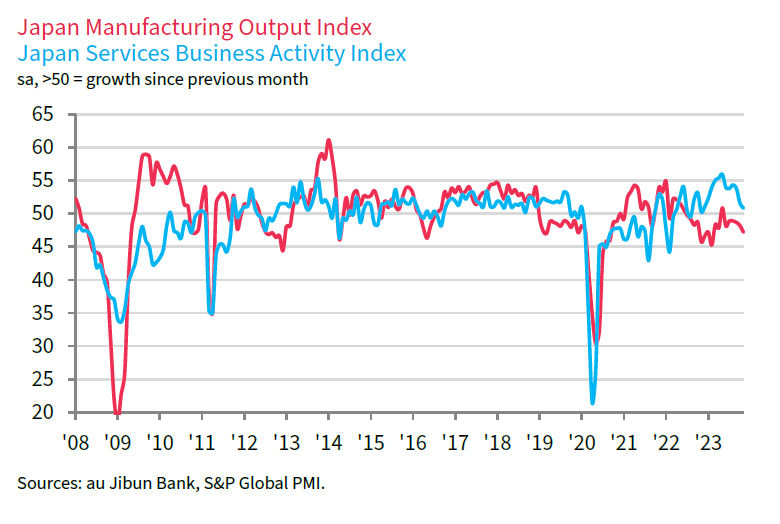
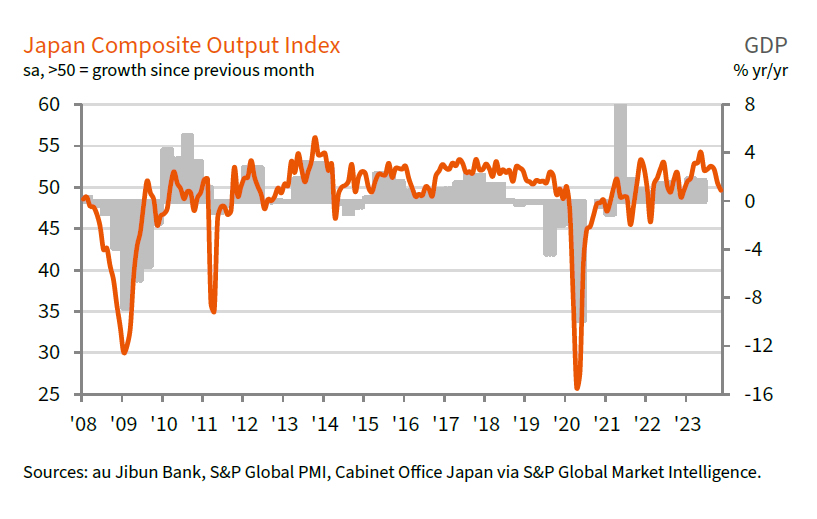
Japan’s PMI services finalized at 50.8, weakening in a year of strong growth
Japan's PMI Services for November was finalized at 50.8, down from October's 51.6, marking the weakest reading since November 2022. PMI Composite also fell to 49.6, down from 50.5 in the previous month, indicating the first contraction since December 2022.
Trevor Balchin, Economics Director at S&P Global Market Intelligence, contextualized these numbers, stating, "November data signalled a further loss of momentum in the services sector, but this should be viewed in the context of a year of strong growth." He highlighted that Business Activity Index for 2023 is trending at 53.7, the highest annual reading since the survey's inception in 2007.
Balchin also pointed out several positive aspects in the latest survey. The rise in new business, sustained employment growth, and the increase in outstanding work indicate ongoing economic activity. Furthermore, the 12-month outlook for activity improved and was "among the strongest on record". Despite these optimistic signs, price pressures in November eased but remained above long-term trends.
Japan’s Tokyo CPI core slows to 2.3% yoy in Nov, core-core still stick at 3.6% yoy
November's inflation data in Japan's capital Tokyo shows a notable slowdown. CPI core, which excludes fresh food, dropped from 2.7% yoy to 2.3% yoy, falling slightly below the expected 2.4%. This decline brings the reading further towards BoJ target of 2%.
Headline CPI also experienced a decrease, falling back to 2.6% yoy. This reduction comes after an unexpected rise from 2.8% yoy in September to 3.2% yoy in October.
Furthermore, CPI core-core, which excludes both food and energy, showed some progress. It declined from 3.8% yoy to 3.6% yoy, a reduction from its peak of 4.0% seen in July and August. However, the still relatively high CPI core-core reading indicates that underlying inflationary pressures remain persistent within the economy, despite the overall slowdown.