Sample Category Title
December Flashlight for the FOMC Blackout Period
Summary
- We look for the FOMC to keep rates on hold at its December 13 meeting, an expectation that is universally shared. If realized, the third consecutive hold would suggest that, rather than the FOMC merely hiking at a slower pace, the fed funds rate probably has reached its terminal level of this cycle.
- Both sides of the Fed's mandate are moving toward their longer-run estimated levels. The labor market is becoming less tight, and inflation continues to recede.
- That said, inflation has not yet receded all the way back to 2%. Consequently, we expect the post-meeting statement will keep the door open to the possibility of additional tightening this cycle. However, while the statement likely will indicate that further tightening remains possible, we would not be surprised for it to hint that another rate hike is less probable.
- A more benign inflation outlook is the key to what we believe will be a flat-to-modestly-lower "dot plot" in the Summary of Economic Projections released at the conclusion of the meeting on December 13. We expect that the median dot for year-end 2024 will shift down from 5.125% in the September SEP to 4.875%. For 2025 and beyond, we suspect the median dots will be more or less unchanged.
- We look for the FOMC to maintain its current pace of balance sheet runoff (i.e., quantitative tightening).
It Appears That This Tightening Cycle Has Come to an End
Since the summer, the FOMC has been keeping its options open regarding the possibility of additional rate hikes. However, recent economic data and comments suggest less need and desire to exercise that option. We see the Committee leaving the fed funds target range at its current level of 5.25-5.50% at the conclusion of its upcoming meeting on December 13. If realized, the third consecutive hold would suggest that, rather than the FOMC merely hiking at a slower pace, the fed funds rate probably has reached its terminal level of this cycle. With the Committee seeming to settle into a prolonged hold, the conversation around the future policy path will shift toward when—and under what circumstances—the FOMC eventually cuts rates.
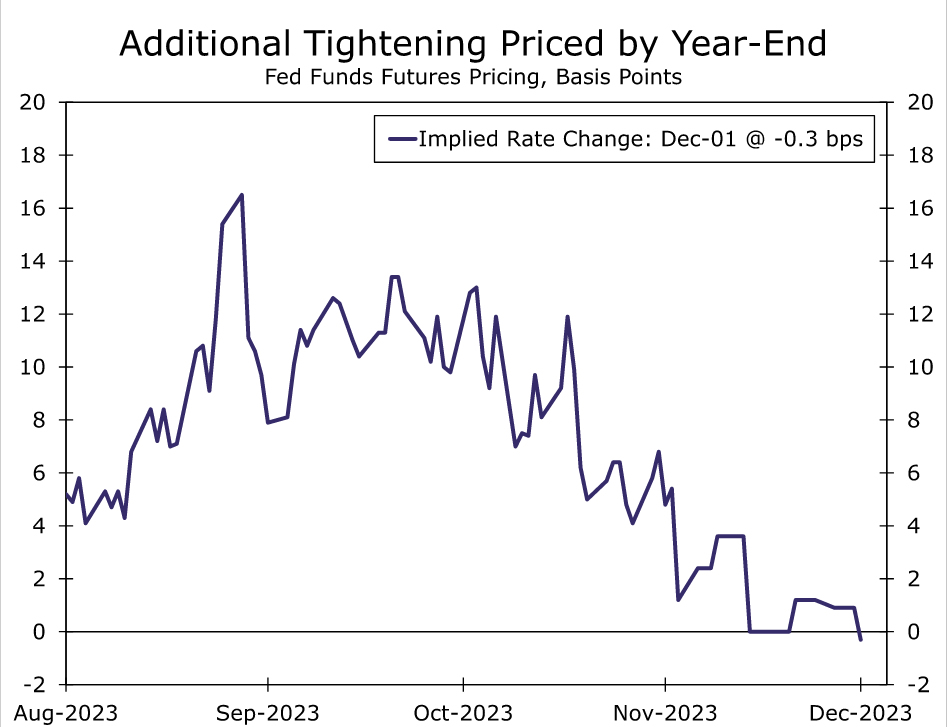
We have maintained since the FOMC last raised the fed funds rate at its July 26 meeting that the increase was likely the last of this hiking cycle, a view not always shared by market participants. As recently as October, market pricing suggested that another 25 bps hike was slightly more likely than not, a bet bolstered in part by Committee members' own projections in September. Yet over the past two months, market pricing for an additional hike before year-end has fallen close to zero (Figure 1).
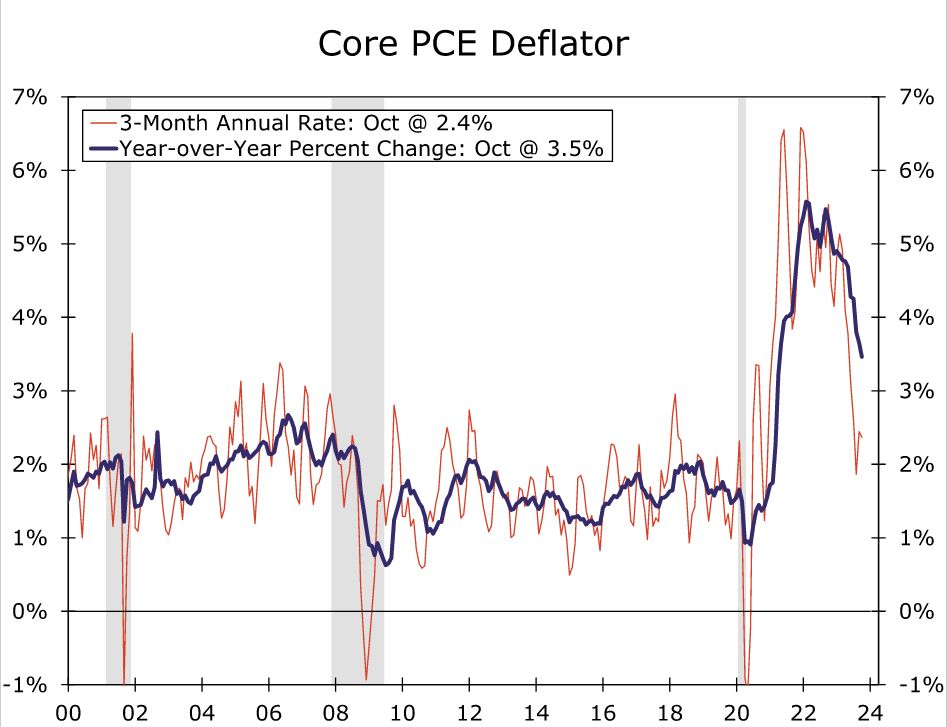
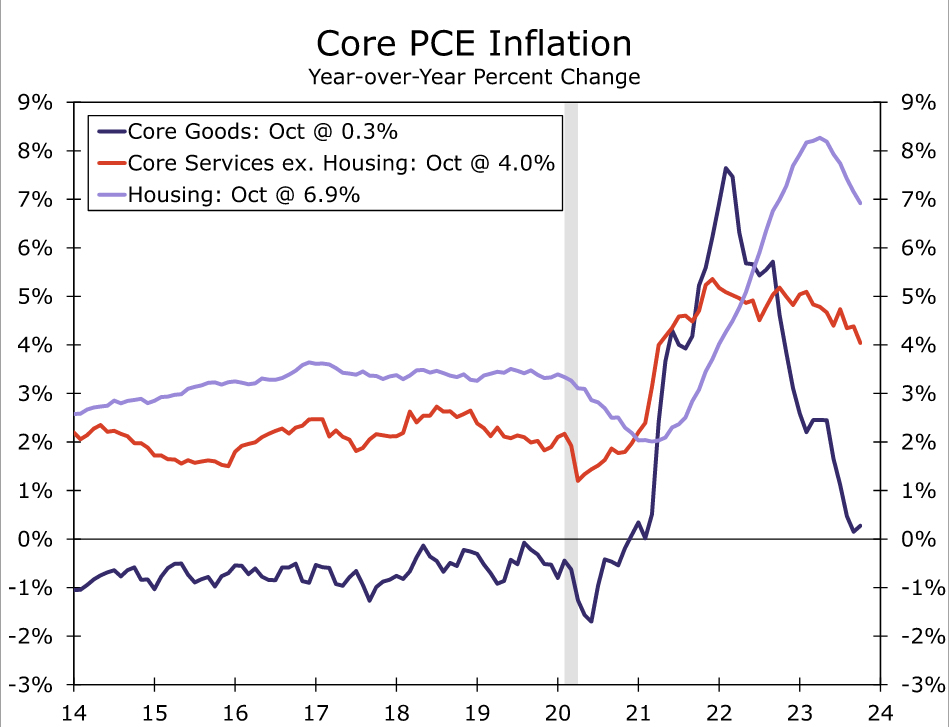
The declining odds of one additional hike this year come as both sides of the Fed's mandate are moving toward their longer-run desired levels. Notably, inflation has made encouraging progress toward returning to the FOMC's 2% target. In October, core PCE inflation, the Fed's preferred benchmark for price growth, fell to 3.5% year-over-year, nearly a two-and-a-half-year low. The latest monthly readings suggest the recent pace has downshifted even further, with core prices in October up at an annualized rate of only 2.4% relative to July (Figure 2). All major categories frequently highlighted by FOMC members have contributed to the slowdown: core goods prices are nearly flat relative to a year ago, housing inflation has rolled over and even "super core" inflation (core services less housing) has come off its recent peak (Figure 3). In addition to softer core inflation, lower energy prices and more modest increases in food costs have helped drive the year-over-year rate of the headline PCE deflator down to the lowest rate since early 2021.
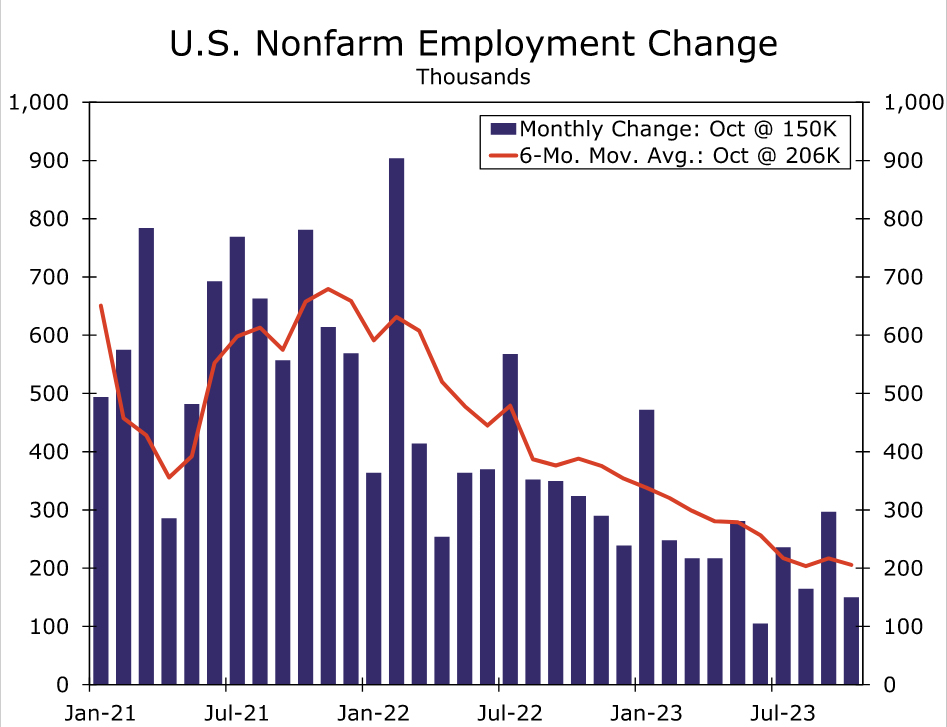
Meantime, the labor market is showing clearer signs of cooling. The share of workers quitting their job is essentially back to pre-COVID levels, which, along with strong growth in the labor supply, has helped to reduce upward pressure on wages. Layoffs remain low, but continuing jobless claims have crept higher in a sign that it is taking displaced workers longer to find new employment. The FOMC will get one more key read on the labor market before its upcoming meeting with the November jobs report to be released on December 8. Although we expect to see a pickup in payroll growth thanks to the conclusions of the United Autoworkers and Hollywood strikes, the overall trend in hiring has downshifted since earlier in the year (Figure 4), while the unemployment rate has drifted up from 3.4% in April to 3.9% in October.
Yet, while inflation is progressing back toward target, it has not yet arrived at 2%. At the same time, financial conditions have eased since the FOMC's last meeting, only partly due to adjusted expectations for the Fed's policy path, in our view. Therefore, we expect the post-meeting statement will keep the door open to the possibility of additional tightening this cycle.
However, while the statement likely will indicate that further tightening remains possible, we would not be surprised for it to hint that another rate hike is less probable. A modestly more dovish outlook could be relayed through adjusting the current statement that "In determining the extent of additional policy firming that may be appropriate..." to verbiage indicating that the risks to the outlook, and therefore the policy path, are becoming more balanced. A slightly less-constructive assessment of recent economic conditions could also suggest that the Committee views additional tightening as less necessary ahead.
SEP: Slower Inflation = Lower Dots?
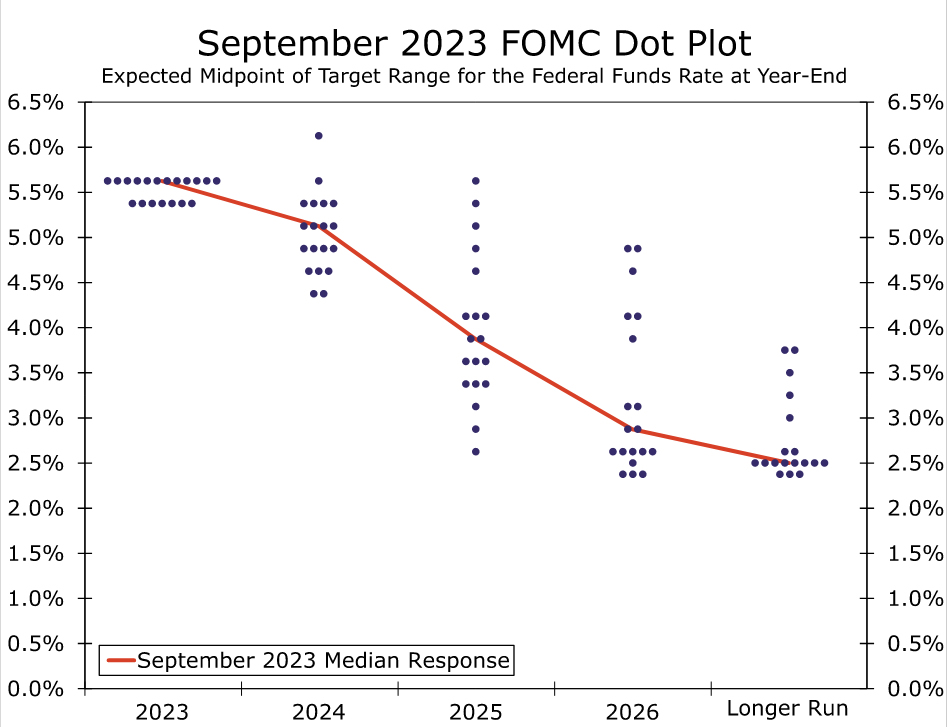
The December FOMC meeting will include an update to the Committee's Summary of Economic Projections (SEP). The last SEP, which was published in September, implied one more 25 bps increase in the target range for the federal funds rate by year-end 2023. Barring a rate hike on December 13, which would come as a major surprise to the vast majority of market participants, the median dot for 2023 will come down to 5.375%, the midpoint of the current target range for the federal funds rate. The September dot plot contained a median projection of 5.125% for the federal funds rate at year-end 2024 (Figure 5). However, the distribution of the 2024 dots was skewed to the downside, with nine submissions below 5.125% and only six above. Given this distribution, and given that inflation has continued to recede faster than the Committee anticipated in September, we expect the median 2024 dot will decline 25 bps to 4.875%. For 2025 and beyond, we suspect the median dots will be more or less unchanged. The distribution of dots for the "longer-run" has an upward bias, and it would not take much to move the median up from its current 2.5%, where it has been since the pandemic began. We have no compelling reason to think an upward revision is coming in December, but the skew and ongoing debate about r-star (i.e., the "equilibrium" real interest rate) suggest that this is something to keep an eye on going forward.
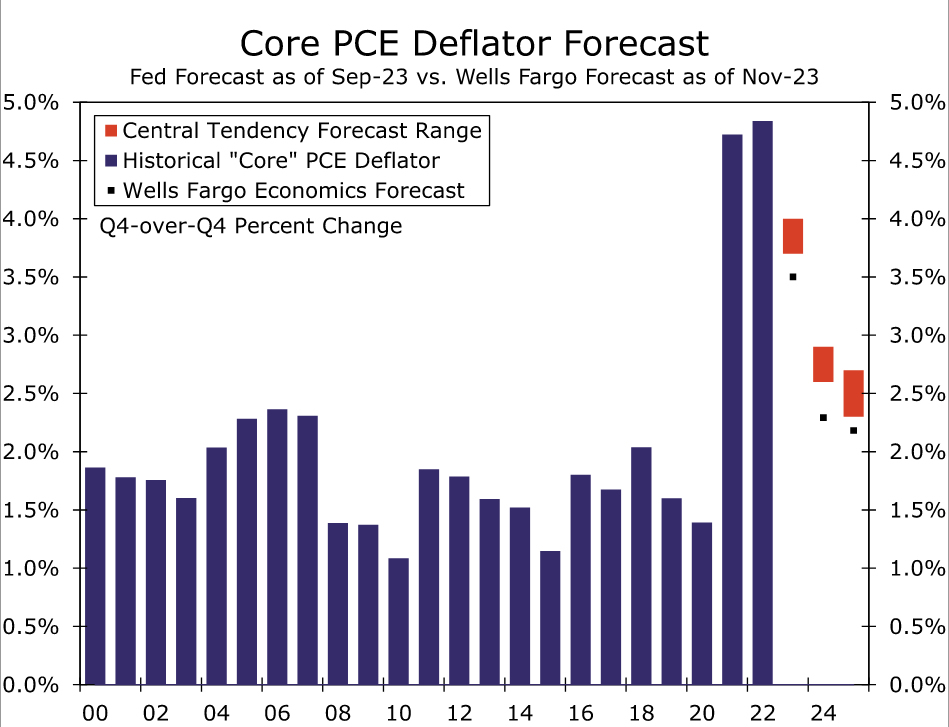
A more benign inflation outlook is the key to a flat-to-modestly-lower dot plot. In September, the FOMC's median inflation projections declined for the first time since 2020. The median submission for core PCE inflation in 2023 fell from 3.9% in June to 3.7% in September. We expect a similar downward revision in the December SEP, as our current forecast for core PCE inflation is 3.5% year-over-year in Q4-2023 (Figure 6). The median projection for headline PCE inflation for 2023 should also fall a few tenths-of-a-percentage point on the back of lower energy prices. For 2024, we think the median inflation forecast may fall a tenth-of-a-percentage point or so, but probably not much more than that. We doubt the FOMC will want to signal an overly optimistic 2024 inflation outlook even with the recent progress.
Real GDP growth projections for 2023 are poised for another upward revision. As recently as June, the median Committee participant expected just 1.0% real GDP growth this year. This estimate was upwardly revised to 2.1% in the September SEP, and another notch higher to 2.5% or so seems likely at the December meeting. We would not be surprised if the Committee's median projection for economic growth in 2024, currently 1.5%, falls slightly to account for a higher base comparison after the faster-than-expected growth in recent months. Accordingly, the median projections for the unemployment rate in 2024 and 2025 may rise by a tick or two but likely will remain close to the longer-run projection of 4.0%.
Quantitative Tightening: Full Steam Ahead
We also expect the FOMC to once again reaffirm its ongoing quantitative tightening (QT) program. The FOMC is currently allowing up to $60 billion of Treasury securities and $35 billion of mortgage-backed securities to roll off of its balance sheet each month. This passive runoff has reduced the size of the Fed's balance sheet from a peak of nearly $9 trillion in Q2-2022 to roughly $7.8 trillion today, and so far there have been few signs of bank reserves becoming scarce. The effective federal funds rate remains comfortably within the FOMC's target range, and other key benchmark rates, such as the Secured Overnight Financing Rate (SOFR), have been relatively stable. As a result, the FOMC likely will reaffirm its intention to continue QT into 2024. We analyzed the outlook for the Fed's balance sheet in 2024 and beyond in a recent special report, which can be found here.
Could BoC Remain Hawkish?
- BoC meets on Wednesday; it could maintain its hawkish stance
- Market is preparing for a series of rate cuts in 2024
- Loonie’s outperformance against the US dollar could pick up speed
Last Bank of Canada meeting for 2023
December starts on a high note with the final BoC meeting for 2023 held on Wednesday and the respective Fed and ECB meetings scheduled for next week. It has been a tough year for central bankers, but their efforts appear to be paying dividends as the most recent inflation reports have been showing a significant slowdown. As a result, the market has assumed that the key central banks have probably concluded their current tightening cycle. In addition, in the case of Canada, the BoC’s own quarterly forecasts point to inflation dropping even further to 2.2% by the end of 2025, in line with its remit.
BoC officials worry about the housing sector and wages
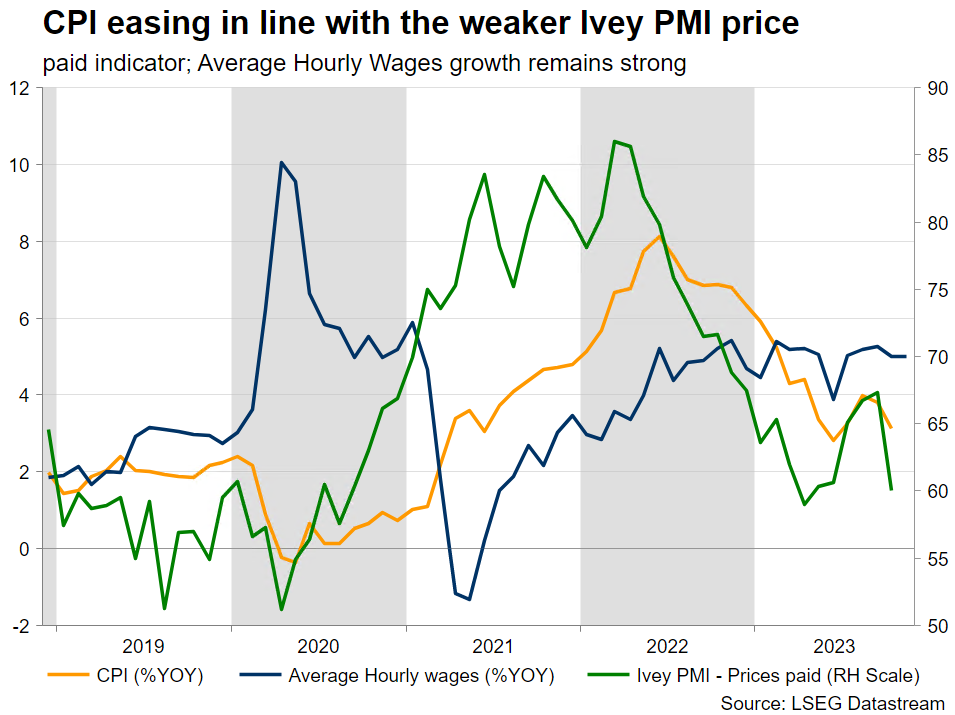
However, there are several issues keeping the central bankers up at night. For example, wage increases remain high, and along Canada’s population surge, they support strong consumer demand despite the higher borrowing costs. In addition, the repeated rate increases have failed to dent the housing sector demand, thus keeping prices supported and offering a wealth boost to homeowners. Understandably, the minutes from the October BoC gathering revealed a debate in the policy board about the possibility of another rate hike. Decent data releases, like the ones seen last Friday, are probably going to keep this debate alive at the upcoming meeting.
The BoC could remain hawkish on Wednesday
One could say that the recent RBNZ meeting probably set the scene for this round of gatherings, and hence being hawkish is a win-win situation for the BoC. If inflation edges higher, maybe due to an oil price rally, which in the case of Canada also means stronger GDP growth, then the BoC could go ahead with another rate hike. This might be shocking for current market expectations, but the BoC has been keeping its option open.
On the flip side, staying hawkish at this gathering does not exclude the possibility of reversing stance, adopting a more dovish rhetoric, and even announcing a rate cut during the first quarter of 2024, if needed. In this case, the market will be content as their current scenario of aggressive rate cuts would quickly be confirmed.
In addition, last week’s OPEC+ shenanigans will probably maintain volatility in the oil market, letting most central banks guess its 2024 trend and impact on inflation. The production cuts announced by OPEC+ for the first quarter of 2024 are mostly voluntary, thus increasing the possibility of certain countries ignoring the OPEC+ agreement and aiming for more, much-needed revenues.
Could the loonie enjoy another rally against the US dollar?
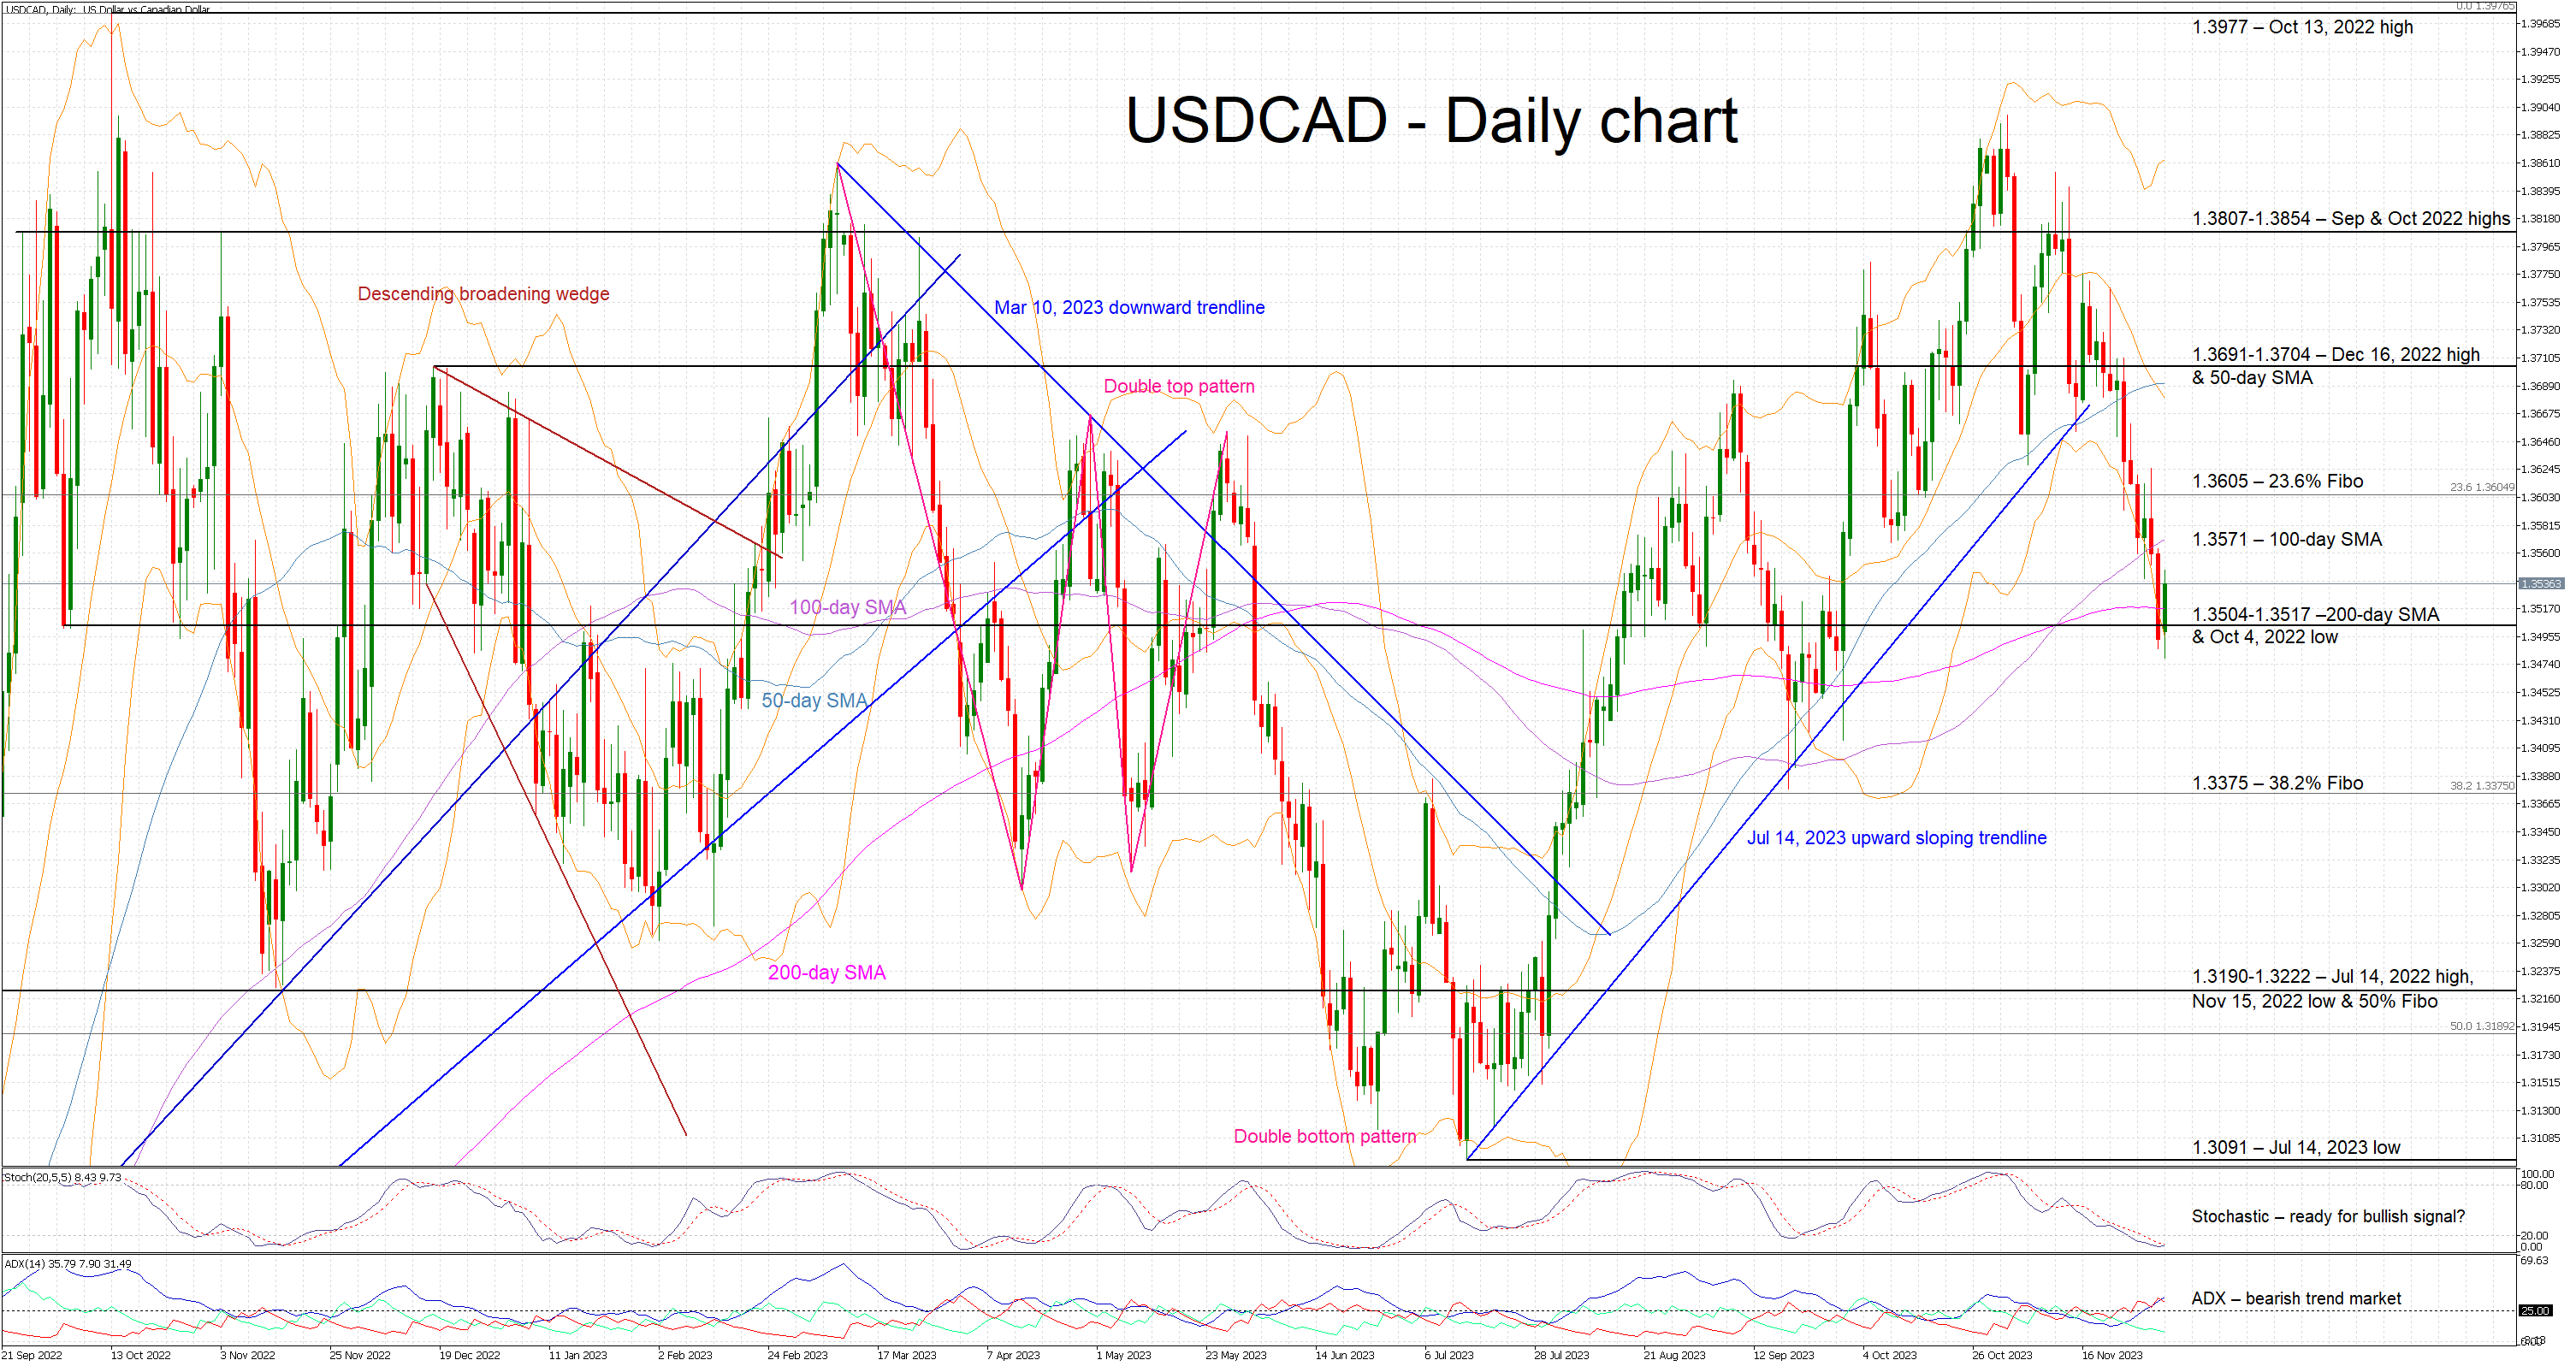
The loonie has managed to outperform the US dollar since the October 25 BoC meeting. This move was predominantly driven by the US leg, but the recent data releases from Canada and the hawkish BoC minutes also played a role. The market expects a quiet and balanced meeting, which if confirmed, will probably allow USD bulls to stage a small upleg above the 100-day SMA at 1.3571.
However, if Macklem et al decide to keep their hawkish stance unchanged and send a message to the market that they could further tighten the current restrictive monetary policy stance, the US dollar-loonie pair could enjoy another sell-off towards the 1.3375 level.
Gold’s Monumental Surge to All-Time Highs
On Friday and Monday, we saw legendary moves in gold. On Friday evening, the price rose to $2075 on the background of risk appetite with reduced liquidity in the instrument. On Monday, the price of gold reached $2145, a new historical price maximum.
The nature of the movement on Friday and Monday morning suggests that we have seen the bears in gold wash out of the market. As liquidity returned, the price pulled back to $2060. This is still extreme territory, as the price only spent a few hours above.
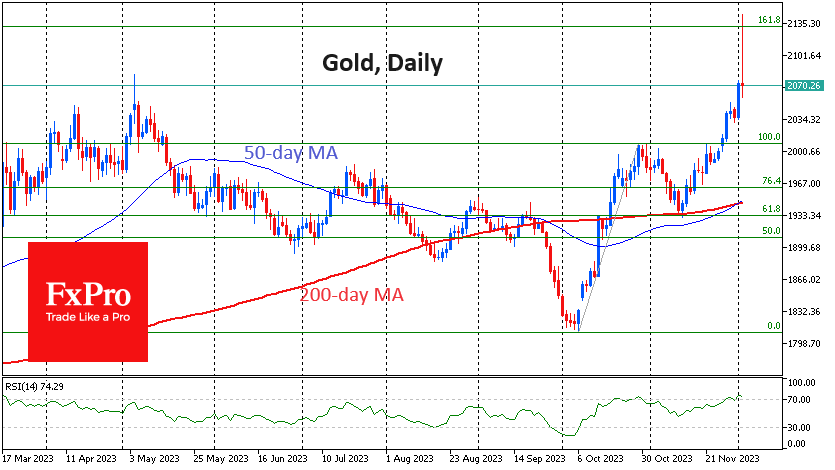
Among the bullish technical signals, we note the Golden Cross formed when the 50-day moving average exceeded the 200-day moving average. In addition, the price is above this crossover, which also strengthens the bullish signal.
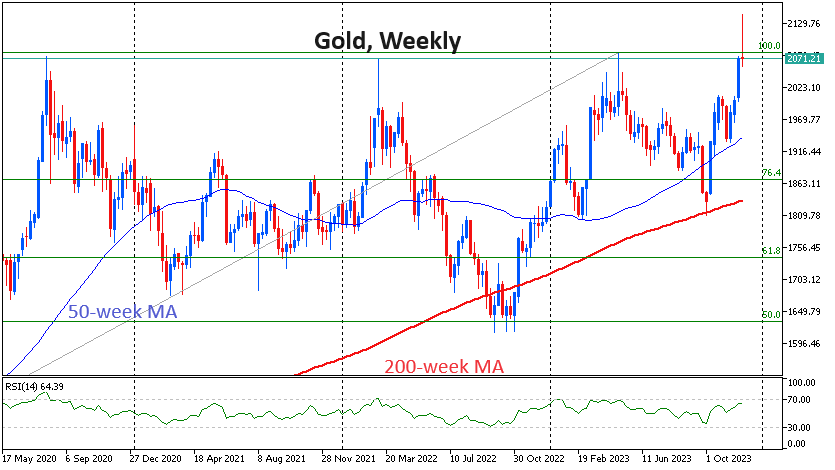
Still, joining the upward move in gold may be too dangerous right now. On the daily charts, the RSI is flirting with overbought territory, creating correction risks. The upward movement generally fits into a Fibonacci pattern with an initial impulse from $1810 to $2007, followed by a correction to $1932. The realisation of this pattern suggests a 161.8% retracement of the initial rise to 2129. This is a fairly accurate execution of the pattern, given the low-liquidity trading hours and historical highs.
The next few days for gold are decisive for the subsequent trend. The ability to hold above $2050 will point to continued extreme bullish sentiment in the precious metals market.
The previous three times that gold made highs – in 2011 and three times in the last three years – it went into a sharp and deep correction that lasted for years in the first case and months in the aftermath of the pandemic.
The latter scenario looks more likely, given lower inflation fears and attractive yields in bonds, gold’s main competitor.
XAU/USD: Gold Hit New All-time High, Bullish Bias Above $2000
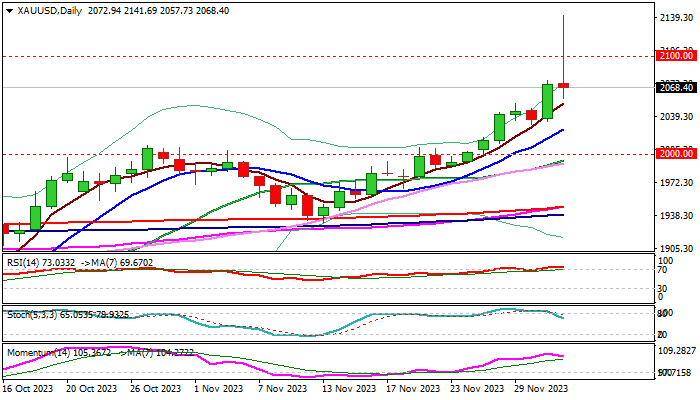
Gold spiked to new record high above $2100 in early Monday, in reaction to the comments from Fed Chair Powell on Friday, who said that current level of interest rates is sufficient to complete the task in putting inflation under control and pushing it towards 2% target.
Although the job was not done yet and Powell left the door open for further tightening, as uncertainty in the economic outlook is still elevated, prevailing tone was more dovish and pointing to a likely end of tightening cycle, with growing speculations about rate cuts.
Although the fresh rally which spiked to $2141, was not sustained, as metal’s price subsequently returned below $2100 marks, suggesting that traders may not be fully convinced yet, the upside prospects remain high.
The price holds strong positive momentum and overall picture regarding geopolitical uncertainty and Fed’s rate outlook remains supportive for further advance.
November’s monthly close above $2000 (the first one on record) was initial bullish signal, with rise well above former all-time high, adding to bullish outlook.
Close above former top ($2080) is seen as minimum requirement to keep fresh bulls intact, with deeper dips to hold above rising 10DMA ($2025) and guard lower pivot at $2000, loss of which will be bearish.
Regaining of new record high will open way for extension towards targets at $2177 (Fibo 123.6% projection of the upleg from $1614) and $2200 (psychological barrier).
Res: 2080; 2100; 2141; 2177.
Sup: 2057; 2025; 2009; 2000.
US Jobs Data Eyed Ahead of Next Week’s Fed Rate Decision
The next couple of weeks could be massive for financial markets going into 2024, with a range of data from the US in the coming days setting us up nicely for the Fed meeting on the 13th.
The standout event is the jobs report on Friday, with the Fed still seemingly of the view that getting inflation back sustainably to target will require some more slack in the labor market. Another weaker report, especially one paired with 0.2% monthly wage growth, could further fuel the belief that not only is the tightening cycle over but rate cuts may not be far away.
Fed Chair Jerome Powell's comments on Friday ahead of the start of the blackout period appeared to suggest the central bank needs no more convincing. In a short time, the narrative has shifted from further tightening likely being necessary and rates remaining higher for longer to being prepared to tighten further if it becomes appropriate, suggesting the view on the FOMC is that it no longer is.
The dot plot next week is now far less about whether the committee is anticipating another hike, rather when they expect the first cut. Markets are pricing a March cut as slightly more likely than not and by May as almost certain. Even with a late pivot, that doesn't leave the Fed much time so we'll need to see a stark difference in next week's forecasts compared with September and an acknowledgement of a rate cut soon.
There are plenty of other US releases this week including JOLTS job openings and the ISM services PMI tomorrow, ADP employment figures on Wednesday, and jobless claims on Thursday. Today is quieter with markets a little subdued so far in Europe.
Oil prices decline further after OPEC+ "deal"
The OPEC+ "deal" last week was unconvincing, to say the least, and oil prices have been in decline ever since. Brent crude is off around 8% from Thursday's highs and not trading far from the November lows. There's clearly a lack of unity around the recent cuts so compliance is going to be a major issue.
And with markets seemingly anticipating more of an economic slowdown next year, the announcement simply doesn't go far enough. It's another large cut but how much will actually be delivered on? And are we at the limits of what the alliance is willing to achieve to balance the markets?
Gold hits new record high in style
Gold entered record territory in style in early trade this week, bursting through the previous peak before exploding higher to reach $2,135, and then giving it all back over the next few hours. Perhaps the combination of pending orders above the previous high and an illiquid moment in the markets contributed to the extremely volatile move, with the yellow metal now trading back around the previous record highs.
Bitcoin hits 19-month highs
Bitcoin is also enjoying a very strong start to the week, breaking above $40,000 and up more than 7% on the day. A 19-month high and backed by excitement over an ETF approval, which has been a long time coming. And we still don't quite know when it will but there's a strong belief it will and soon.
AUD/USD Slips Ahead of RBA Decision
- AUD/USD lower on Monday
- RBA likely to maintain rates on Tuesday
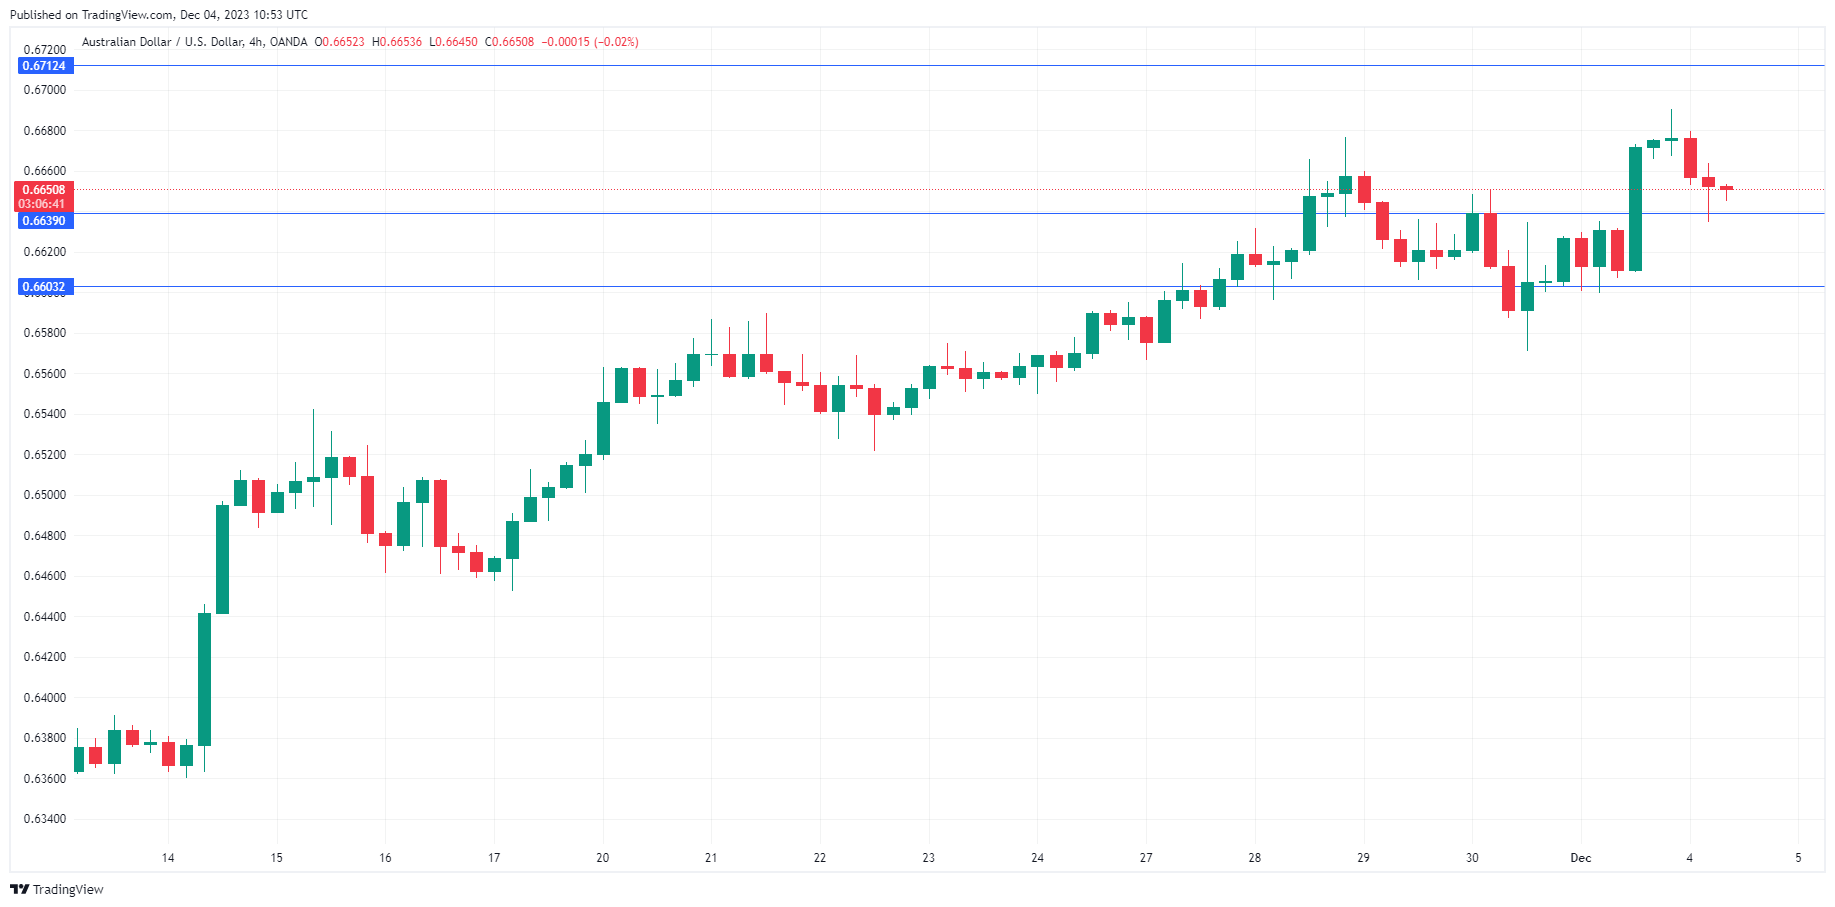
The Australian dollar has started the week in negative territory. In the European session, AUD/USD is trading at 0.6648, down 0.40%. The Australian dollar is coming off a strong week, with gains of 1.38%.
RBA expected to hold rates
The Reserve Bank of Australia is expected to hold rates at 4.35% at its Tuesday rate meeting. The central bank has paused for four straight months and the markets don’t expect any further hikes. Still, the RBA could send a hawkish message along with the pause to dampen speculation about a rate hike in 2024, with inflation still high at 4.9%, which is well above the 2% target.
Powell sends mixed message, dollar slumps
Federal Reserve chair Jerome Powell spoke on Friday, and his split message sent the US dollar sharply lower against most of the majors, including the Australian dollar which jumped 1.06%.
Powell noted that monetary policy is “well into restrictive territory” and that inflation is “moving in the right direction”. The markets interpreted these remarks as signals that the Fed is done with rate tightening. Although Powell warned that it was premature to assume that the Fed had achieved a “sufficiently restrictive stance”, investors viewed the remarks as dovish and the US dollar fell sharply.
The futures markets have priced in a rate cut in March at 59% and in May at 87%, according to the CME FedWatch tool. The Fed clearly doesn’t share this stance, as most Fed members who spoke last week supported the case for holding rates at current levels for some time.
This disconnect between the Fed and the markets is likely to continue as the Fed is unlikely to discuss rate cuts while inflation remains above the 2% target. The markets are looking at a rate cut in late 2024, but a lot could happen until then. If the economy cools more quickly than expected, the RBA would have to give thought to cutting rates in order to boost growth.
AUD/USD Technical
- AUD/USD tested support at 0.6639 earlier. Below, there is support at 0.6603
- 0.6712 and 0.6748 are the next resistance lines
Bitcoin Surpasses $40,000 Per Coin
December begins extremely optimistically for the cryptocurrency market, resembling:
→ December 2020, when bitcoin grew by 46.9%;
→ December 2017, when bitcoin grew by 38.9%;
→ December 2016, when bitcoin grew by 30.8%.
If there are psychological patterns in the increase in demand on the eve of the holidays, then perhaps they come into force, since on the morning of December 4, the price of Bitcoin exceeded the psychological barrier of 40k and reached 41,700 per coin — for the first time since April 2022.
Fundamentally, demand is based on expectations of the approval of several Bitcoin ETFs. The fear and greed index reached a value of 74, indicating growing greed. Another driver is expectations of Fed rate cuts, which leads to more affordable loans and, accordingly, increased demand for risky assets.
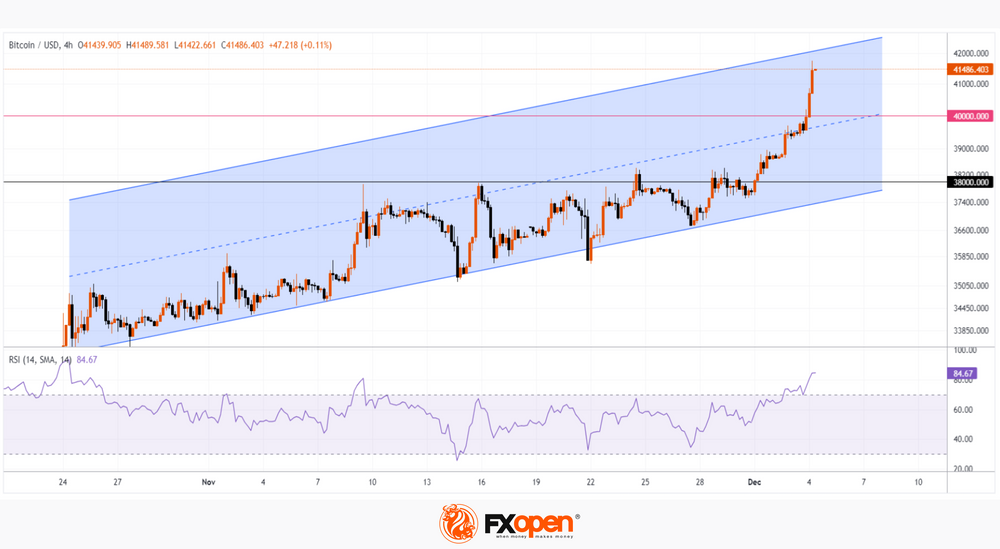
Technically, the price was in a consolidation zone in November. Buyers overcame resistance around the level of 38,000. The pressure of demand is evidenced by growing lows. When the resistance was behind, buyers did not encounter any tangible obstacles, which is noticeable in the width of the bullish candles.
Presumably, the price of bitcoin may consolidate near the upper boundary of the parallel channel — bulls will be motivated to take profits. But buying bitcoin now may mean trying to jump on a ship that has sailed away too far.
It is acceptable to assume that the market is in an overbought state, judging by the readings of the RSI indicator. Therefore, it is possible that the price of bitcoin may reach the upper limit of the channel and then correct.
This article represents the opinion of the Companies operating under the FXOpen brand only. It is not to be construed as an offer, solicitation, or recommendation with respect to products and services provided by the Companies operating under the FXOpen brand, nor is it to be considered financial advice.
Eurozone Sentix rose to -16.8, cautious optimism amid inflation outlook
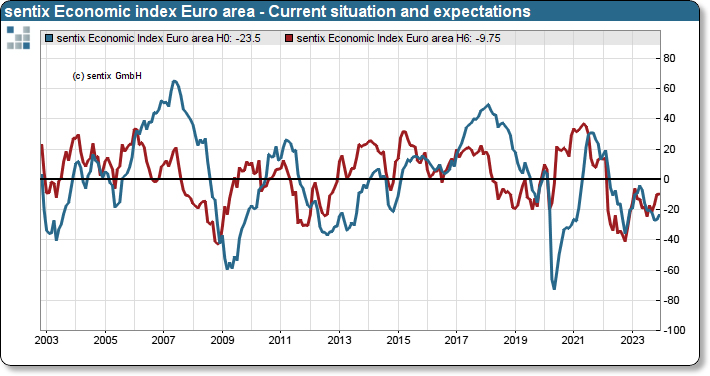
Eurozone Sentix Investor Confidence Index's latest update offers a mixed but cautiously optimistic view of the region's economic outlook. In December, the index rose from -18.6 to -16.8, slightly below the expected -16 but marking its highest level since May. Current Situation Index improved from -26.8 to -23.5. More notably, the Expectations Index inched higher from -10.0 to -9.8, reaching its peak since February.
The consecutive rise in the Expectations Index for the third month is a signal that some economists might interpret as the beginning of a trend reversal. However, Sentix cautions against over-optimism, noting "The still weak overall momentum and the lack of a certain amount of international support speak against this."
Despite these reservations, Sentix identifies potential for significant improvement at the start of the new year, largely due to positive shifts in the inflation outlook. The Sentix inflation barometer, which tracks expectations about inflation, has shown improvement for the fifth consecutive time, reaching 16.25.
Sentix elaborated on this, stating, "From this positive view of inflation, investors not only deduce an end to the central banks' prolonged cycle of interest rate hikes, but now also expect positive support from monetary policy." The corresponding theme barometer, reflecting this optimism, has ascended to 14.25, the highest since April 2021.
Gold Storms to Record High Before Surrendering Intraday Gains
- Gold posts a fresh all-time peak of 2,142 on Monday
- But fails to hold onto its gains, falling back below April high
- Momentum indicators point at an overstretched advance
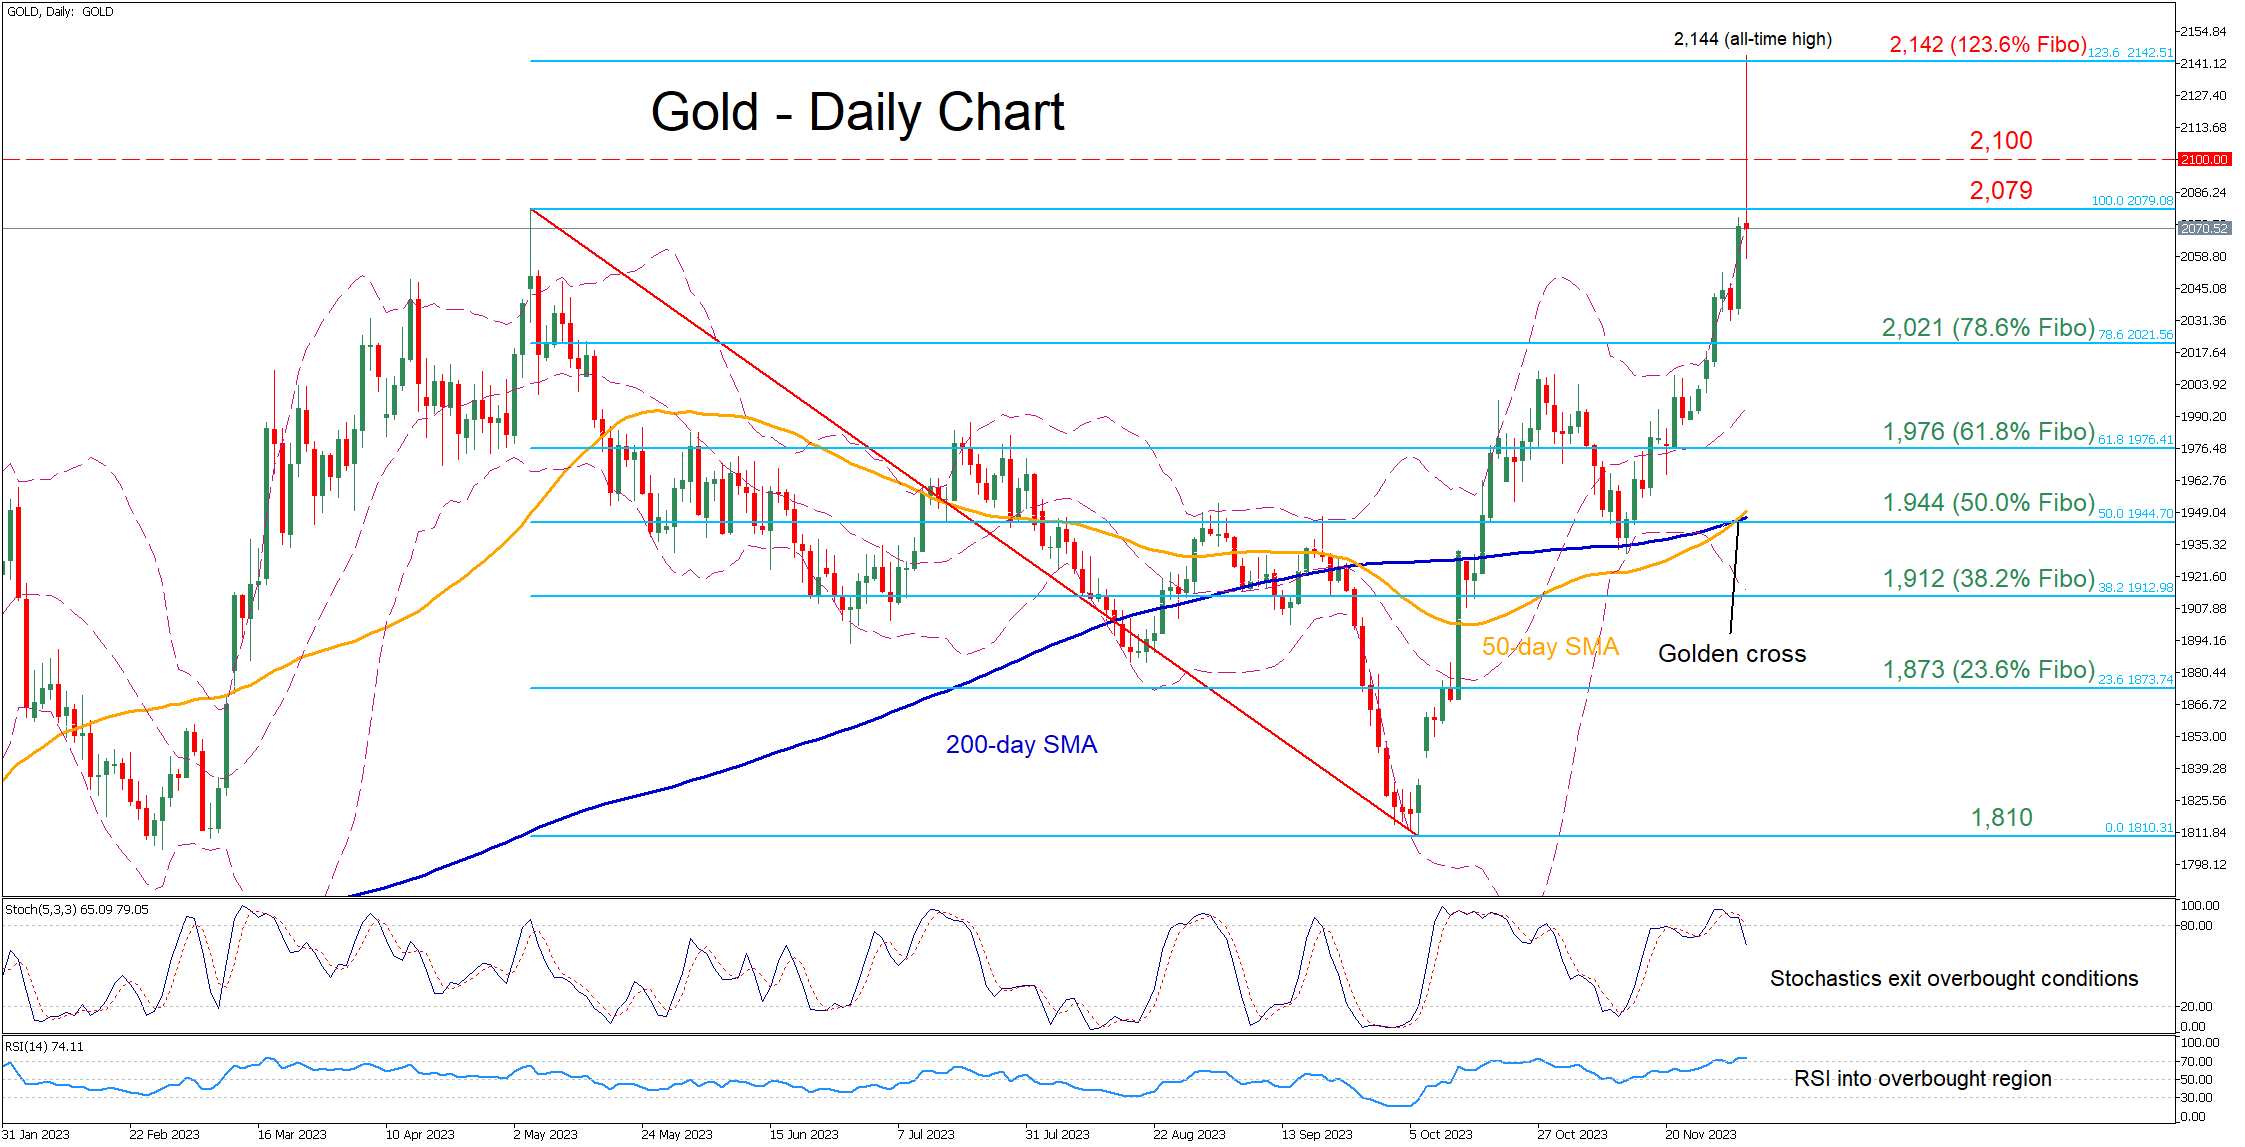
Gold had been in a steep uptrend since November 10, when the price bounced off the crucial 200-day simple moving average (SMA). On Monday, bullion recorded a fresh all-time high of 2,144 before erasing all its intraday rally, with the price reversing back below its previous record peak.
Given that the momentum indicators are starting to ease from overbought conditions, gold could pull back towards 2,021, which is the 78.6% Fibonacci retracement of the 2,079-1,810 downleg. Sliding beneath that floor, the price may challenge the 61.8% Fibo of 1,976. Even lower, the 50.0% Fibo of 1,944 could provide downside protection.
On the flipside, should the bulls attempt to propel the price higher, the April peak of 2,079 could act as the first line of resistance. A violation of that zone could set the stage for the 2,100 psychological mark. Failing to halt there, the price could revisit its recent all-time high of 2,144, which lies very close to the 123.6% Fibonacci extension.
In brief, gold surged to an all-time high in today’s session, but has already surrendered all its daily gains. Can the recent completion of a golden cross between the 50- and 200-day SMAs refuel the rally?
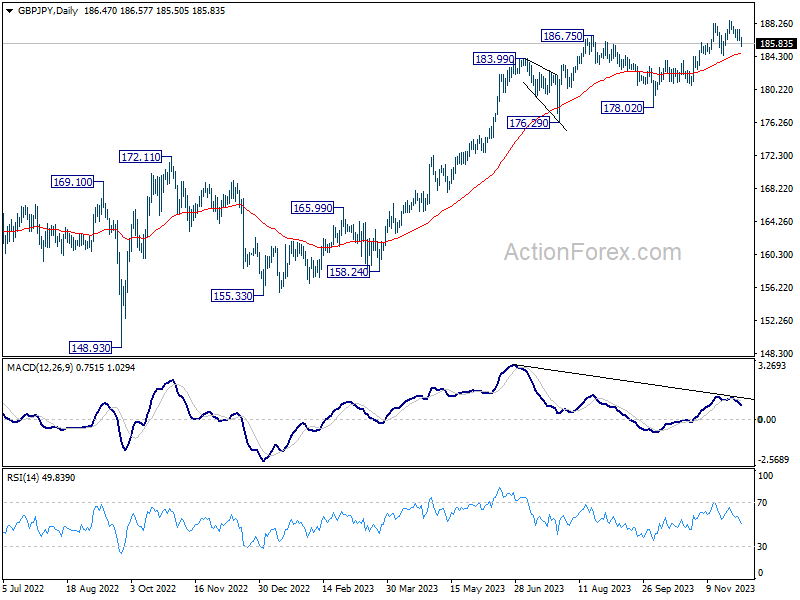
GBP/JPY Daily Outlook
Daily Pivots: (S1) 186.03; (P) 186.77; (R1) 187.35; More...
Intraday bias in GBP/JPY remains neutral first. Price actions from 188.63 short term top is seen as a near term consolidation pattern for now. As long as 184.44 support holds, further rally is expected. Decisive break of 188.63 will resume larger up trend.
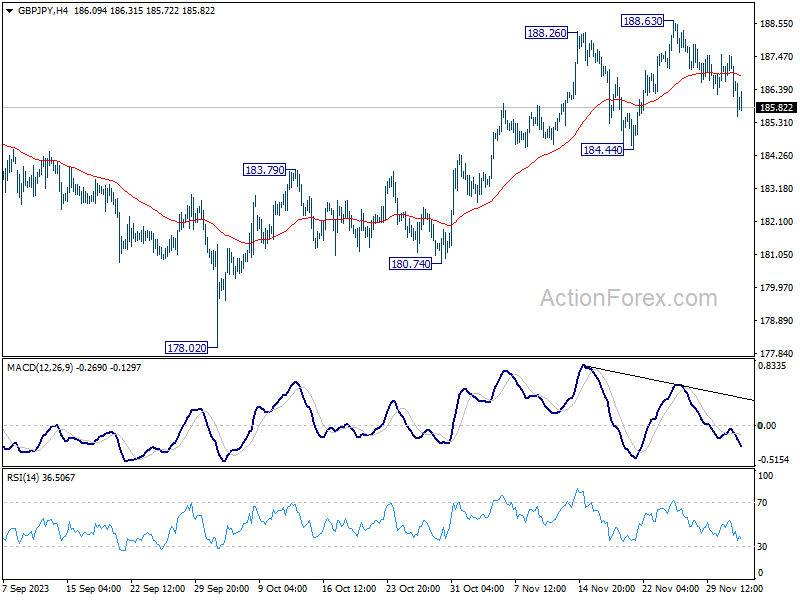
In the bigger picture, as long as 184.44 support holds, larger up trend from 123.94 (202 low) should still be in progress, next target is 195.86 (2015 high). However, firm break of 184.44 will now argue that a medium term top is formed, possibly in bearish divergence condition in D MACD, and bring deeper fall back to 178.02 support.