

Sample Category Title
Gold Advanced to 2072.22
Markets
The November yield correction found an easy way in at the start of the final month of the year through a disappointing US manufacturing ISM. The headline figure stabilized at 46.7 instead of improving to an expected 47.8. New orders fell though less rapidly (48.3 vs 45.5) while employment dropped to 45.8. Actual output fell sub 50 again after expanding for some months. Prices paid ticked higher to 49.9 though, potentially signaling that the strongest disinflationary pressures in the sector are easing. In Powell’s anticipated speech a bit later the Fed chair warned against speculating for rate cuts. But an otherwise balanced tone was not nearly enough to shift market thinking, especially after Waller’s comments earlier last week. Fed’s Goolsbee (“no evidence we stalled at 3% inflation”) and ECB’s Villeroy (“disinflation is even faster than expected”) all talked in the same direction. US yields hit a new correction low with daily changes varying between -10.6 (30-y) and -14.5 (5-y) bps. The 2-y (-14.2 bps) yield lost support at 4.60% (38.2% retracement on the 2023 yield rally). German yields followed their US peers lower with losses of 5.3 to 13.4 bps with similar outperformance of the front end. EUR/USD erased much of the earlier accumulated losses, rebounding from a low of 1.0829 to 1.0884 in the close. Stocks rallied. The EuroStoxx50 (4418) closed above resistance around 4400 and surpassed the 2021 recovery high. The only remaining reference standing in the way for a return to the pre-GFC high of 4572.82 is the current YtD high of 4491.51. US indices rallied 0.55-0.82%. The S&P500 came close to a test of the 2023 high (4607.07). Risk-on supported the likes of GBP. EUR/GBP tumbled to 0.8564 after testing support at the 76.4% GBP recovery on the H2 decline (0.85576). The hefty yield drop pushed the yen higher. USD/JPY closed at the lowest level since early September (146.82) while EUR/JPY lost the 160 mark. Gold advanced to 2072.22. The shiny metal hit a record high this morning by abruptly surging towards 2135.39 in a move that looks like stop-loss in a thin market. It pared gains to 2079.09, above the pandemic high of 2075.47 nonetheless. Today’s economic calendar is razor thin. ECB’s Lagarde appears at a conference today. She will touch on monetary policy in a last chance to do so before the blackout period kicks in later this week. We don’t expect her to turn the tide on markets. US yields recover a few bps this morning (5.5 bps at the front) but that’s merely stabilizing at the current levels. The dollar seeks to further capitalize on HICP-driven euro weakness by pushing the EUR/USD pair further south to 1.0868. Support at 1.0862 (50% retracement on the Oct-Nov rally) may soon break, introducing the next reference at 1.0764. The pound’s technical picture improved materially last week with the earlier mentioned resistance the only level standing in the way for a return to the YtD high (0.8492).
News & Views
After the S&P’s upgrade last month, rating agency Fitch on Friday also raised the credit long term foreign credit rating of Greece from BB+ to BBB- with a stable outlook. The agency sees the government debt to GDP ratio to ‘remain on a sharp downward trend, thanks to solid nominal growth, budget over-execution and a favourable debt servicing structure’. Fitch expects the country’s debt ratio to decline to 152.3% of GDP in 2024. The process is supported by ongoing solid growth expected at 2.9% next year after 2.4% this year. To support the fiscal consolidation process, the government also committed to further increase the primary budget surplus (balance excluding interest rate payments) from 1.1% this year to 2.1% next year.
The Hungarian debt agency AKK on Friday published its 2024 financing plan. The total net funding requirement for 2024 is HUF 2.515 billion, to be financed by a net issuance of HUF 2.643 billion. Contribution to the net issuance is expected to be HUF 1.528 billion in HUF retail securities and HUF 987 billion in FX financing. AKK plans a net negative institutional HUF bond issuance for 2024 with an average term-to-maturity of almost 7 years. On foreign currency financing, the 30% upper bound regarding the share of FX debt remains unchanged for 2024. AKK plans the issuance of an international USD bond with a volume of up to USD 2 billion and a benchmark sized green EUR bond in case of favourable market conditions in H1 2024. AKK also plans Samurai and Panda bond issuances in the second half of 2024 to further strengthen presence in Asian markets. FX project loans (e.g.: EIB, CEB, etc.) and other types of FX financing (e.g.: private placements, ECP) based on circumstances are also possible in 2024.
Gold Technical: Medium-Term Uptrend Remains Intact But Risk of Minor Pull-back
- Today’s early Asian session’s swift rally to a fresh all-time high is likely to be driven by a thin liquidity trading environment rather than the Israel-Hamas geopolitical war risk premium.
- Spot Gold’s portfolio hedging role may gain traction as global recession risk resurfaces.
- Medium-term uptrend phase remains intact but may shape a minor pull-back below US$2,152 key short-term pivotal resistance with immediate supports at US$2,032/2,018.
The price actions of Spot Gold (XAU/USD) have continued to push higher since our last analysis where it clear above the short-term resistance zone of US$2,028/2,037and rallied to retest its current all-time high level of US$2,075 (printed in August 2020) on last Friday, 1 December 2023.
In today’s (4 December) early Asian session before the opening of Tokyo trading hours, Spot Gold spurted upwards to hit a fresh intraday all-high of around US$2,148 before it almost gave up all its gains to trade at US$2,083 at this time of the writing.
Despite an uplift in geopolitical tensions in the Middle Eastern region after Israel resumed its offensive operations against Hamas in Gaza over the weekend, the geopolitical war risk premium is not being priced in the current price actions of oil where WTI crude remained soft ex-post OPEC+ meeting and it traded lower in today’s Asian session with an intraday loss of -1.10%.
Hence today’s intraday swift rally that lasted for around thirty minutes towards a fresh all-time high is likely to be driven by a thin liquidity environment at the start of the week rather than fundamental catalysts.
Potential global recession scenario is supporting a medium-term uptrend
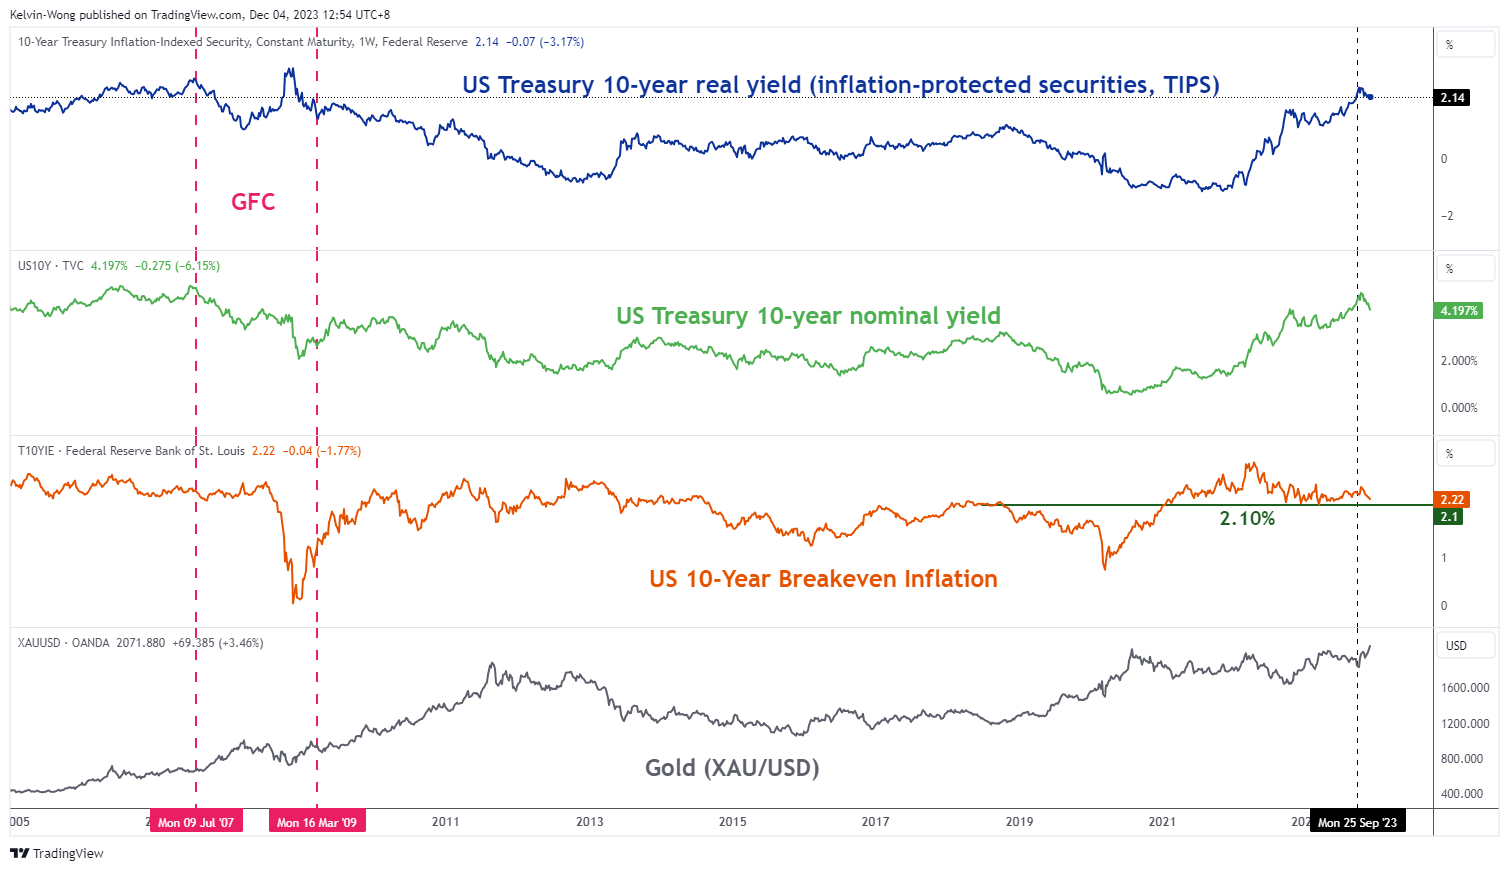
Fig 1: US 10-year Treasury real yield medium-term trend with breakeven inflation as of 4 Dec 2023 (Source: TradingView, click to enlarge chart)
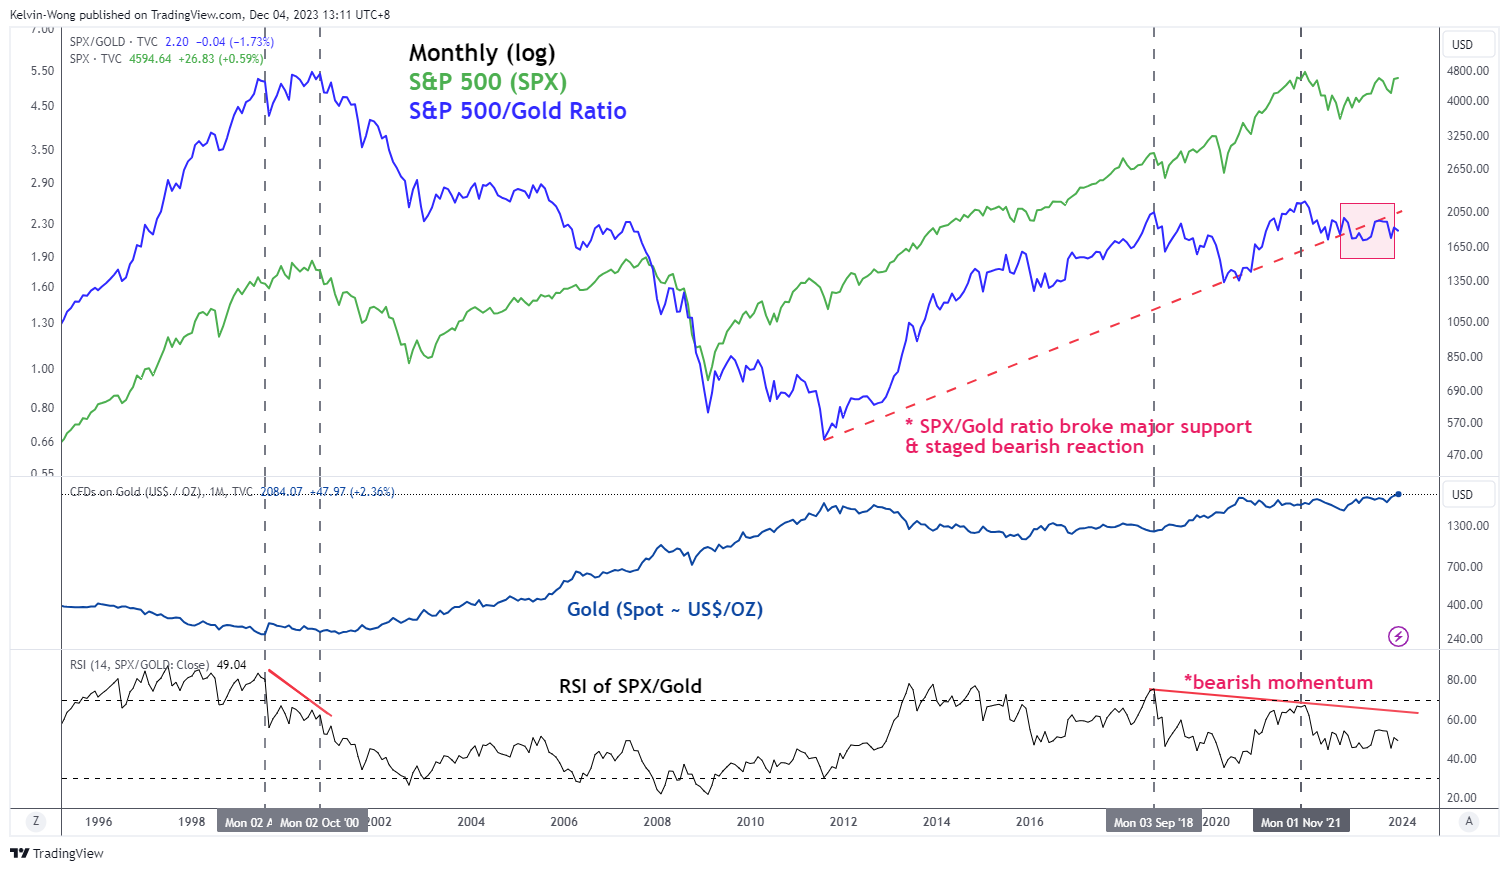
Fig 2: S&P 500 – Spot Gold ratio as of 4 Dec 2023 (Source: TradingView, click to enlarge chart)
The next golden question will be is the current medium-term uptrend for Spot Gold sustainable after a rally of +18% from its 6 October 2023 low, and a third major retest on the US$2,075 high printed on 7 August 2020?
Using an intermarket analysis approach (see Fig 1 & 2), the medium-term uptrend phase low of 6 October 2023 seen in Spot Gold has coincided closely with the recent softness of the US 10-year Treasury real yield as it has declined by 47 basis points from 2.47% printed on 6 October 2023.
Also, the US 10-year breakeven rate (market-based implied US inflation rate 10 years from today) is looking vulnerable for a bearish breakdown below 2.10% suggesting that the US 10-year Treasury real yield still has room for further potential downside that in turn lowers the opportunity costs of holding gold.
Secondly, the long-term monthly ratio chart of the US S&P 500 against Spot Gold has continued to exhibit potential S&P 500 underperformance against Spot Gold as it has remained below a former major ascending support from August 2011 low with bearish momentum reading seen in the monthly RSI indicator of the S&P 500 – Spot Gold ratio; a sign of a potential imminent US recession.
Therefore, these two intermarket analyses suggest an increasing risk of a global recession which in turn may allow the current medium-term uptrend phase of Spot Gold to remain intact via its portfolio hedging role.
Overextended short-term rally in Spot Gold
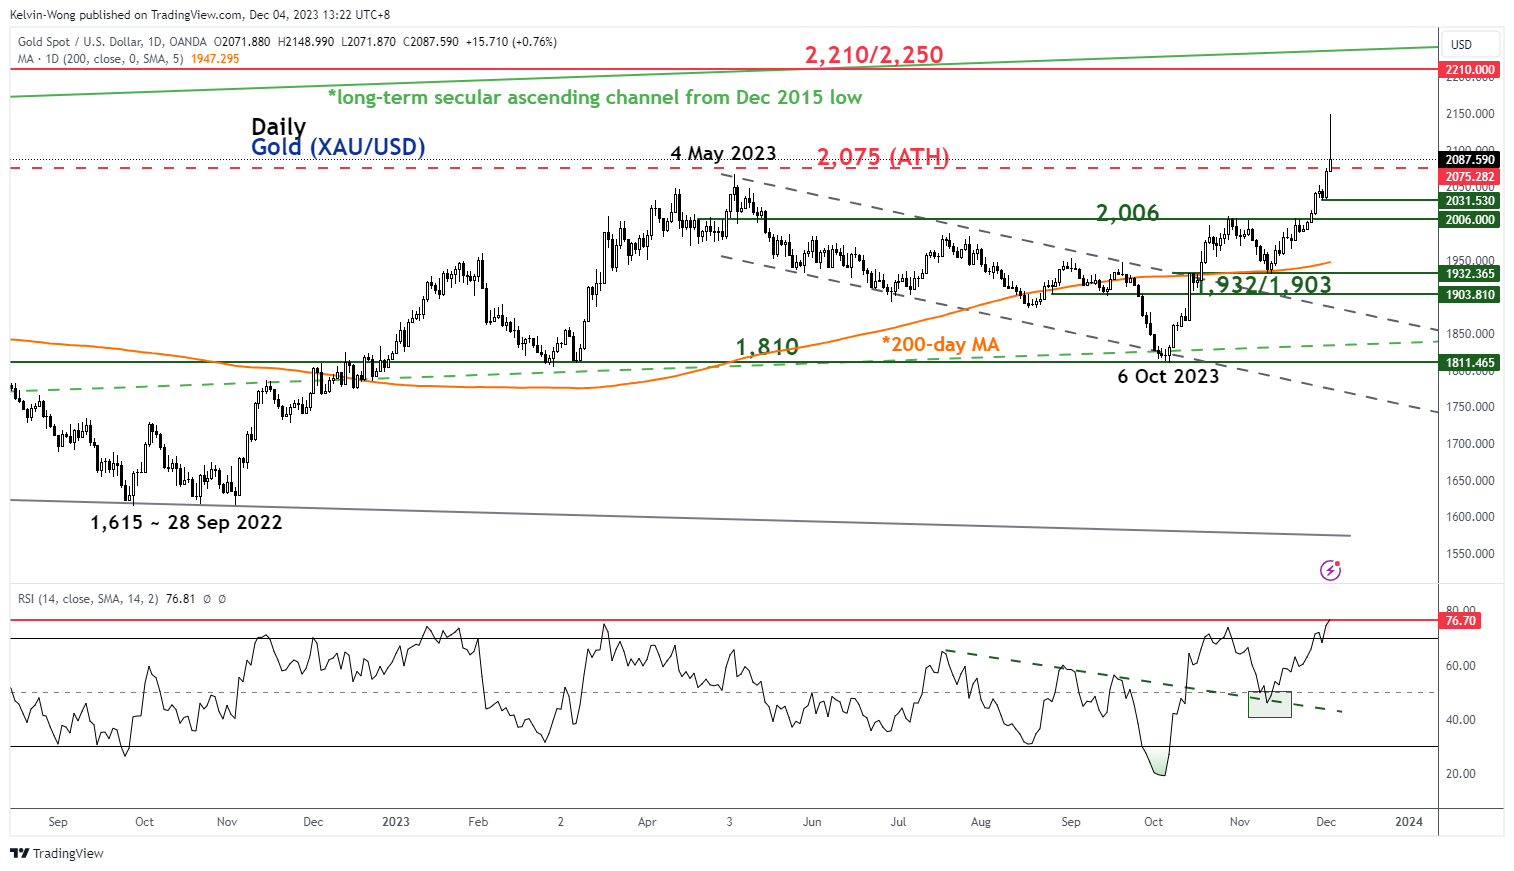
Fig 3: Spot Gold (XAU/USD) medium-term trend as of 4 Dec 2023 (Source: TradingView, click to enlarge chart)
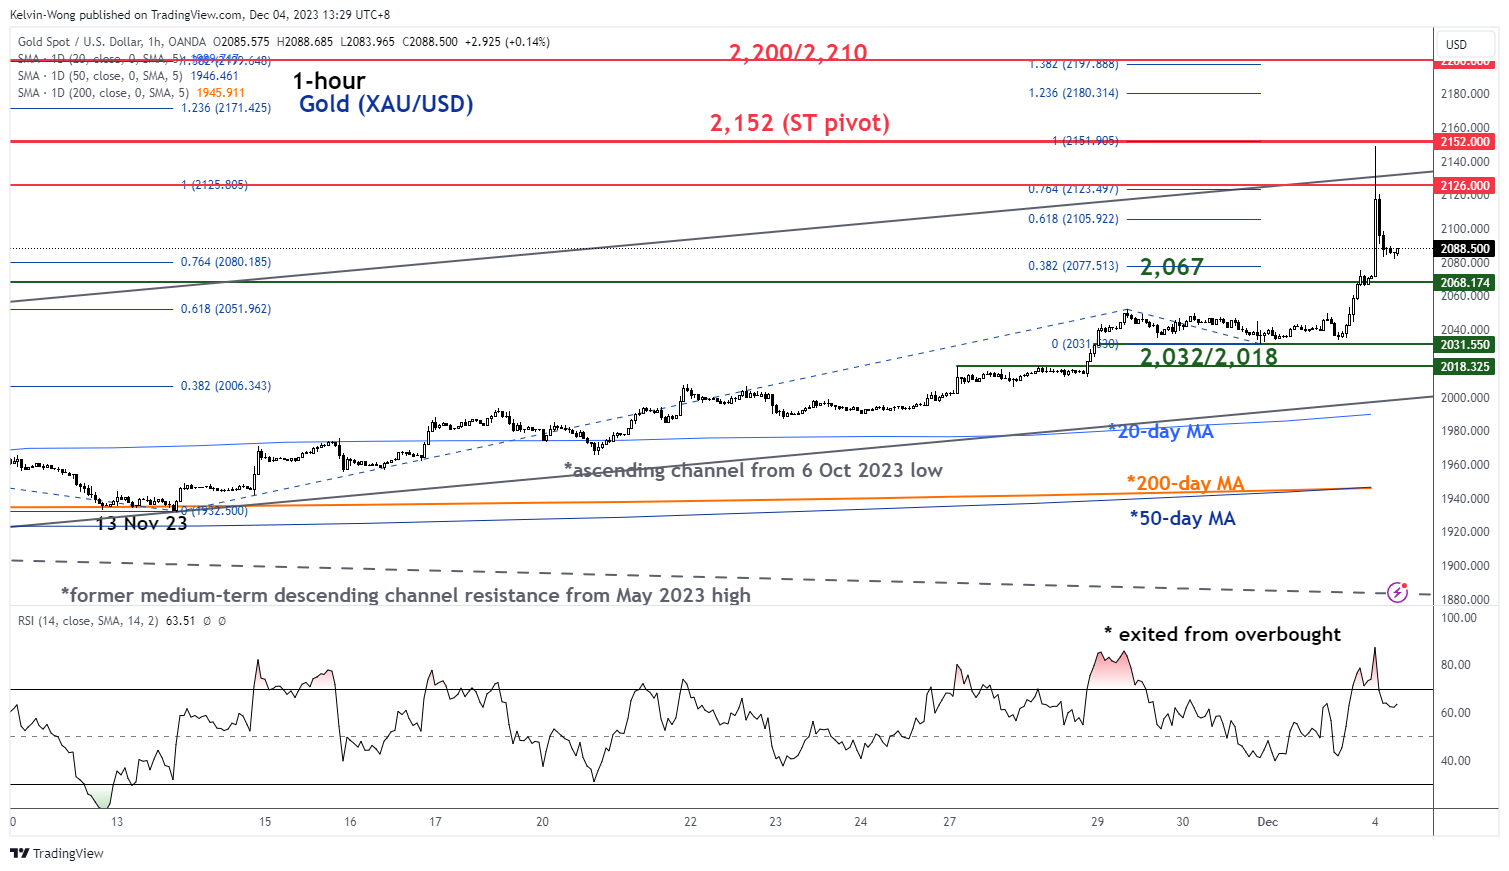
Fig 4: Spot Gold (XAU/USD) minor short-term trend as of 4 Dec 2023 (Source: TradingView, click to enlarge chart)
In the lens of technical analysis, price actions of highly liquid traded instruments and assets do not move in vertical up or down movements but rather oscillate within their trends as market participants react to the ebbs and flows of new catalysts.
Today’s swift rally has led Spot Gold (XAU/USD) to hit an extremely overbought level where the current daily RSI momentum is at 76.70, its highest level so far since the current medium-term uptrend started on 6 October 2023 low.
On the hourly short-term chart, the price actions of XAU/USD have reacted off the upper boundary of the ascending channel from the 6 October 2023 low now acting as a near-term resistance of US$2,126.
In addition, the hourly RSI momentum indicator has just exited from its overbought region which increases the risk of a minor-pull back scenario within an ongoing medium-term uptrend phase.
Watch the US$2,152 key short-term pivotal resistance on XAU/USD and a break below US2,067 near-term support (former swing high areas of 4 May 2023/28 March 2023) exposes the next immediate support zone of US$2,032/2,018.
On the other hand, a clearance above US$2,152 sees a major resistance zone coming in at US$2,200/2,210.
Mixed Feelings
The Federal Reserve (Fed) President Jerome Powell pushed back against the rate cut bets at his speech given in Atlanta last Friday. He is of course playing the card of ‘high for long’ rates to tame inflation, yet he hinted that the Fed will probably not hike rates when it meets this month. He said that the US monetary policy is ‘well into restrictive territory’ and that the fell of effect of higher rates to combat inflation is working its way through economy. ‘We are getting what we wanted to get,’ said Powell. And indeed, inflation is cooling, people start to spend less, and the job market loosens. But in parallel, the financial conditions are loosening fast, as well. Hence the market optimism and stocks/bond gains become increasingly vulnerable to hawkish Fed comments, and/or strong economic data. The US jobs data will take the center stage this week. Investors expect further fall in US jobs openings, less than 200’000 job additions last month with slightly higher pay on month-on-month basis. The softer the data, the better the chances of keeping the Fed hawks away from the market.
Unsurprisingly, the part of Powell’s speech where he pushed back against rate cut expectations went fully unheard by investors on Friday. On the contrary, the Fed rate cut expectations went through the roof when it became clear that the Fed will stay pat again this month. The US 2-year fell to nearly 4.50% on Friday, the 10-year yield tipped a toe below the 4.20% mark. The S&P500 flirted with the summer peak, flirted with the 4600 level and closed the week a touch below this level, while the rate sensitive Nasdaq closed a few points below the 16000 and iShares core US REIT ETF jumped nearly 2.70% last Friday.
The SPDR’s energy ETF, on the other hand, barely closed above its 200-DMA, as last week’s OPEC decision to cut the production supply by another 1mbpd and to extend the Saudi cuts into next year barely impressed oil bulls – even less so given the apparent frictions at the heart of the group regarding this supply cut strategy when prices keep falling. The decline in oil prices continues this Monday. The barrel of US crude remained aggressively sold near the 200-DMA last week, and we are about to step into the $70/73pb region which should give some support to the market. With the clear deterioration of the positive trend, and the lack of any apparent boost to the oil market following last week’s OPEC meeting, there is a chance that we will see oil finish the year below the $70pb mark. An increasingly shaky OPEC unity, record US production, a slowing global economy, deteriorating global demand outlook and efforts to shift toward cleaner energy sources weigh heavier than the supply worries. As such, the $100pb level becomes an increasingly difficult target to reach. And even though the COP28 president Mr. Al Jaber said last weekend that there is ‘no science’ behind demands for phase-out of fossil fuels – yes 70’000 people flew to Dubai to hear that there is no evidence that fossil fuel is destroying climate – efforts to phase-out fossil fuel continues at full speed with solar panel installation surpassing the most optimistic estimates according to Climate Analytics.
In the FX, the US dollar’s positive attempt above the 200-DMA was halted by Powell’s speech on Friday – or more precisely by investors’ careful extraction of all the dovish elements in that Powell speech. Both the Reserve Bank of Australia (RBA) and the Bank of Canada (BoC) will likely keep their rates unchanged this week, but the RBA will certainly sound hawkish faced with worries of ‘home-grown’ inflation. The AUDUSD stepped into the bullish consolidation zone following a 6+% jump since the October dip and could gather further strength this week. The EURUSD, on the other hand, remains under growing selling pressure despite FX traders’ hesitancy regarding what to do with the US dollar. The pair sank to 1.0830 on Friday and is preparing to test the 200-DMA, which stands near 1.0820, to the downside. The easing Eurozone inflation, along with slowing European economies, boost the dovish ECB expectations. The final PMI data will confirm further contraction in the Eurozone last month, as the Eurozone GDP read will likely confirm a 0.1% contraction last quarter. Coming back to the EURUSD, the pair will likely see a solid support near 1.0800/1.0820, which includes the 200-DMA and the major 38.2% Fibonacci retracement on October – November rebound. And clearing this support should pave the way for an extended selloff toward 1.0730.
Investor Confidence Grows Amid Dropping Yields
Market movers today
There are no market movers today in the calendar.
This week focus will be on US data releases with both the November jobs report, ISM services, and the University of Michigan survey scheduled. We expect a further cooling in non-farm payrolls on Friday to +140k and see average hourly earnings growth stable at 0.2%. Markets will keep a close eye on the Michigan survey on Friday after two consecutive months of rising short-term inflation expectations.
We have several central bank meetings this week in Poland, Canada, and Australia. We expect unchanged policy rates from all three.
The 60 second overview
Market focus and overnight: On Friday, both the S&P 500 and Nasdaq marked a fifth consecutive week of gains, underscoring sustained positive momentum in the market. US Treasury yields experienced a notable sell-off across the curve, triggered by cooler-than-expected inflation data and dovish remarks from the Federal Reserve. The 10-year yield saw a significant decline, reaching a three-month low. Notably, the market is currently pricing in the anticipation of over 100 basis points of Federal Reserve cuts in 2024, with the possibility of an initial move as early as March, aligning with our expectations of the first Fed cut in March. Federal Reserve Chair Jerome Powell tempered these expectations in a speech on Friday, suggesting it would be "premature" to speculate on the timing of any easing of monetary policy. Elsewhere, gold prices surged to record levels, achieving their highest close on record, reflecting a shift in investor preferences. EUR/USD is consolidating below the 1.09 mark. This morning, yields are somewhat rebounding while gold is declining from highs. Oil is trading lower as Brent fell below USD80/bbl. Asian markets are mixed together with European futures. US futures are a tad lower as we start the week.
US manufacturing ISM: The US November ISM manufacturing stayed at 46.7 (consensus: 47.8, prior: 46.7). The details were mixed. Prices paid rose to 49.9 from 45.1, the highest since April 2023. Additionally, new orders rose to 48.3 from 45.5. However, employment fell to 45.8 from 46.8.
Equities: Global equities rose on Friday, thereby securing a five-week winning streak. Last week was in some sense even more interesting than some of previous weeks where equities rose more than last. The reason is the underlying rotation where the soft-landing narrative is super visual. Thinking being: lower inflation, central bank losing is coming, lower yields, lower risk of recession, massive defaults in CRE avoided. Hence, REIT, small caps and banks (not least US regionals) performing very strongly although yields are moving lower. Again, the "inflation-normalization" trade has come a long way and we need to start seeing the "good data/bad data" differently as we move in 2024. To a large extent, this also means an end to the positive correlation for bonds and equities. Only caveat is inflation data where bonds and equities will still be positive-correlated at least in the beginning of 2024. US major indices on Friday: Dow +0.8%, S&P 500 +0.6%, Nasdaq +0.6%, Russell 2000 +3.0%. Asian markets are mixed this morning together with European futures. US futures are a tad lower as we start the week.
FI: Comments from Villeroy on Friday afternoon staged a massive rally led by the front end to end a week which was mostly a one-way trend for lower rates. With Villeroy saying that rate hikes are over and 'The question of a cut may arise when the time comes during 2024, but not now', 2y German yields dropped 10bp. 10y German yields are now trading at 2.36%. Markets added 13bp to the ECB rate cut expectations for 2024 and now points to 127bp. The awaited speech from Powell on Friday afternoon did not provide signals ahead of the blackout period that started this weekend.
FX: EUR and USD were the big losers on Friday, where in particular NOK, JPY and AUD saw strong gains. EUR/USD traded close to the 1.09 level. EUR/NOK fell to around 11.60 and EUR/SEK just below 11.30.
Credit: iTraxx Main traded again tighter on Friday and closed 13.2bp tighter than the week before at 65.9bp, while Xover tightened 57.3bp during the week to close at 363.8bp. The week was characterized by high activity in the primary market, sentiment remains constructive in credit and investor appetite for new deals continues to look solid.
Nordic macro
The Riksbank is publishing the minutes from the November monetary policy meeting today at CET 9:30. Interesting to see what the most hawkish members, Thedéen och Jansson, focused on in the latest decision. After the publication of the minutes Anna Breman will discuss 'the economic situation and current monetary policy' at CET 11:00. Governor Thedéen will follow up (on Tuesday) and the remaining three board members will speak on the same topic on Wednesday, Thursday and Friday, respectively.
USD/JPY Daily Outlook
Daily Pivots: (S1) 146.20; (P) 147.27; (R1) 147.88; More...
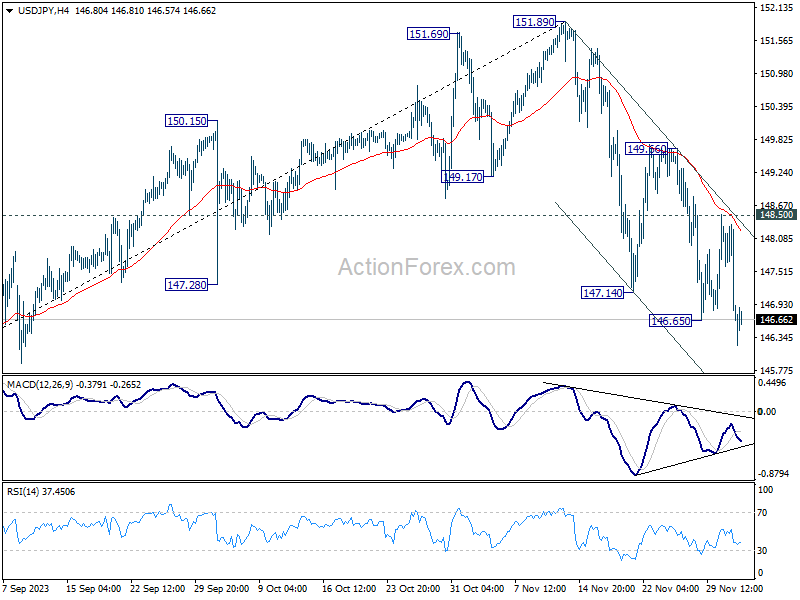
Intraday bias in USD/JPY is back on the downside with break of 146.65 temporary low. Fall from 151.89 is in progress and should target 145.06 key support level. On the upside, break of 148.50 resistance is needed to indicate short term bottoming. Otherwise, further decline with remain in favor in case of recovery.
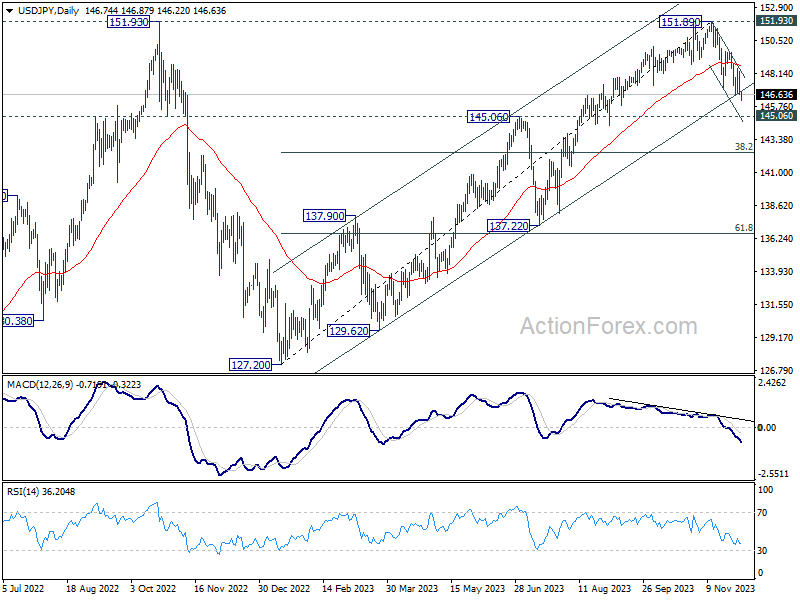
In the bigger picture, rise from 127.20 (2023 low) is seen as the second leg of the pattern from 151.93 (2022 high). Decisive break of 145.06 resistance turned support will confirm that this second leg has completed, after rejection by 151.93. Deeper fall would be seen through 38.2% retracement of 127.20 to 151.89 at 142.45 to 61.8% retracement at 136.63. Nevertheless strong bounce from 145.06 will retain medium term bullishness for another test on 151.93 at a later stage.
Gold and Bitcoin Lead Market Frenzy, Yen Jumps While Others Tread Cautiously
Gold and Bitcoin are leading the charge in Asian markets today, with Gold breaking to a new record high and Bitcoin surpassing the 40000 mark. This surge contrasts with the mixed performance of Asian equity markets, where indices like Japan's Nikkei and Hong Kong's HSI experienced some pressure. The varied market reactions come at a time when traders are bracing themselves for a week packed with high-profile economic events, including key central bank decisions from RBA and BoC, along with pivotal US non-farm payrolls data. Such anticipation is prompting a more cautious approach among traders, who are likely weighing the potential outcomes and their impacts on various asset classes.
In the realm of currency markets, Japanese Yen trading broadly higher, largely riding on the back of a global dip in benchmark yields, coupled with growing expectations that the BoJ would exit its negative rate policy next year. The forthcoming Tokyo CPI and Japan's wage growth data are set to offer critical inputs for BoJ's policy deliberations, potentially influencing the Yen's path further. Dollar and Euro are both showing signs of recovery, attempting to pare back some of the significant losses witnessed last week. Despite this rebound, there remains a lack of clear indicators signaling a long-lasting shift in the fortunes of Dollar and Euro yet.
On the other hand, Australian Dollar showing mild weakness as the market anticipates upcoming RBA rate decision and Australian GDP data release later in the week. British Pound and New Zealand Dollar are also dipping, while Canadian Dollar and Swiss Franc are showing mixed performances. These movements in the currency markets are reflective of the overall cautious sentiment that seems to be prevailing among investors at the moment.
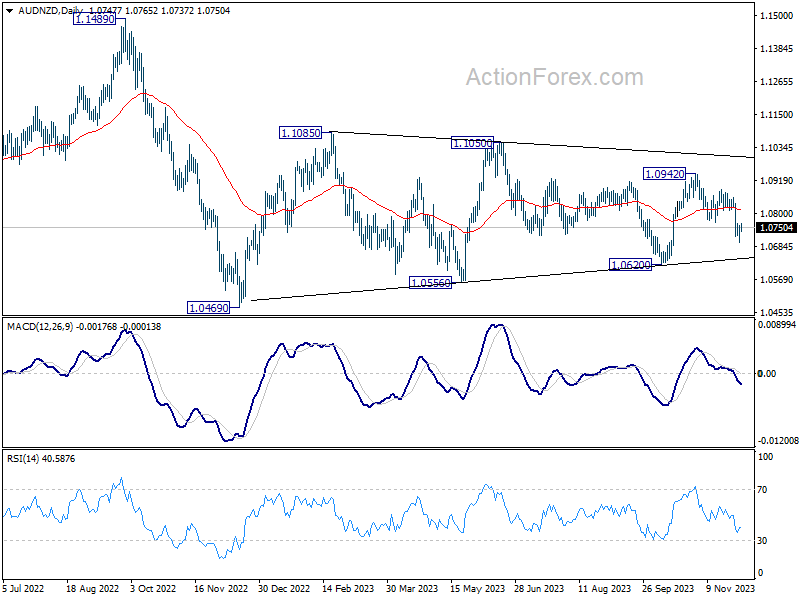
Technically, AUD/NZD is a pair to watch this week. Fall from 1.0942 is in progress and break of last week's low at 1.0700 will resume the decline to 1.0620 support. Decisive break there will argue that consolidation pattern from 1.0469 has completed, and the down trend from 1.1489 is ready to resume. In case of a bounce on RBA or Australia GDP, sustained break of 55 D EMA (now at 1.0814) is need to confirm that fall from 1.0942 has finished. Otherwise, outlook will stay bearish.
In Asia, Nikkei closed down -0.60%. Hong Kong HSI is down -0.47%. China Shanghai SSE is down -0.17%. Singapore Strait Times is up 0.38%. Japan 10-year JGB yield fell -0.0080 to 0.692.
Bitcoin shatters 40K barrier, path to 50K now open?
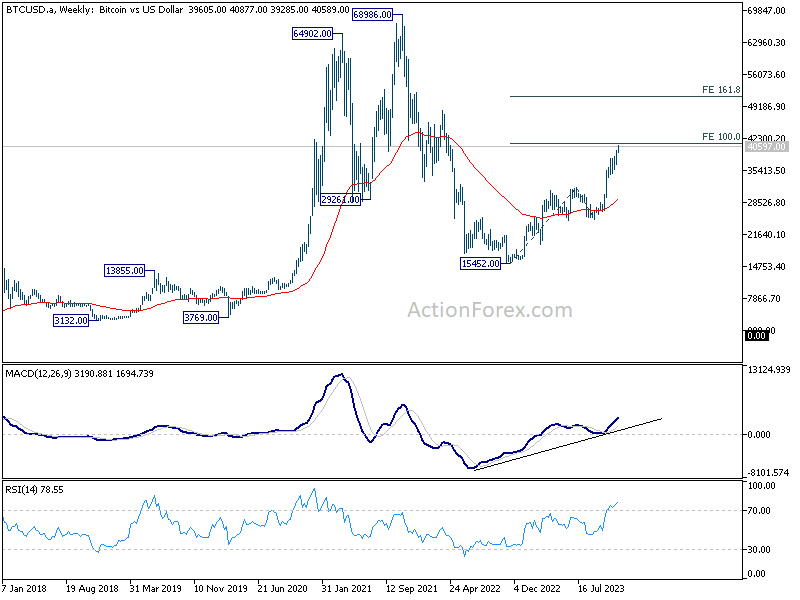
Bitcoin's surged over the weekend, breaking the 40K barrier for the first time since May 2022, has brought a fresh wave of optimism and focus in the cryptocurrency market. The immediate attention is now on the key level of 41259, a significant Fibonacci projection level. Decisive break through this level could set the stage for a climb through 50K handle.
The surge is largely driven by growing optimism surrounding the approval of Bitcoin ETF by the SEC. Bloomberg's expectation of a batch of such funds gaining SEC approval by January adds to this sentiment. This development signifies a major shift towards mainstream acceptance of Bitcoin, fulfilling a long-awaited milestone for many investors and traders.
Another contributing factor is the anticipated Bitcoin halving event scheduled for May next year. Historically, Bitcoin halvings, which occur every four years, have been associated with bullish market trends. Market participants are eyeing a potential bull run post-halving, with some traders positioning themselves early in anticipation of both the halving and the ETF approval.
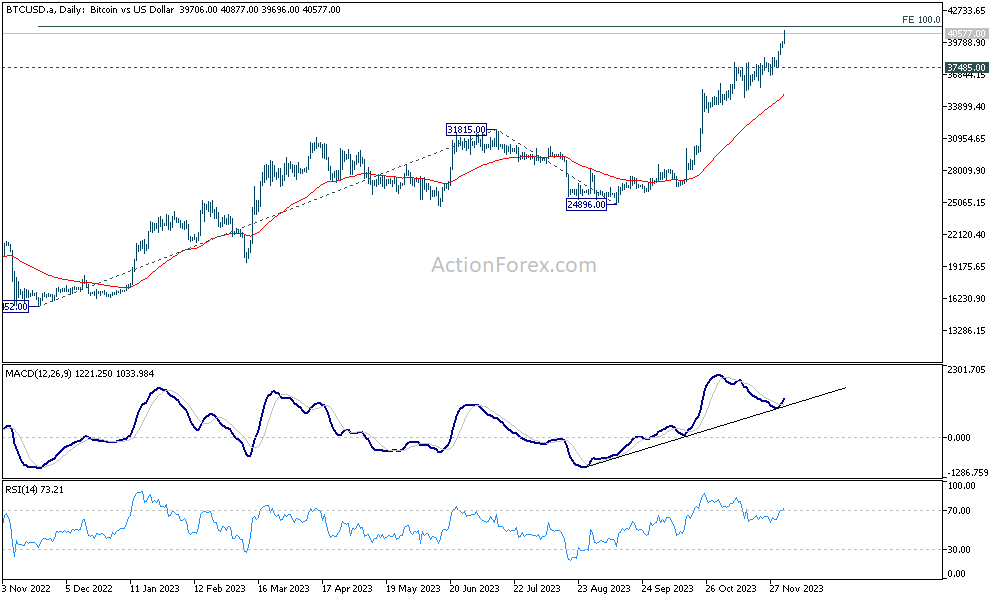
Technically, D MACD suggests that Bitcoin is now in a re-acceleration phase. Immediate focus is on 100% projection of 15452 to 31815 from 24896 at 41259. Decisive break there will pave the way to 161.8% projection at 51371 next.
There might be some initial resistance from 41259 to limit upside at the first attempt. Break of 37485 support will bring consolidations in Bitcoin first. But pull back should be contained by 31815 resistance turned support to bring another rally.
Surging to new record, can gold maintain momentum towards 2500?
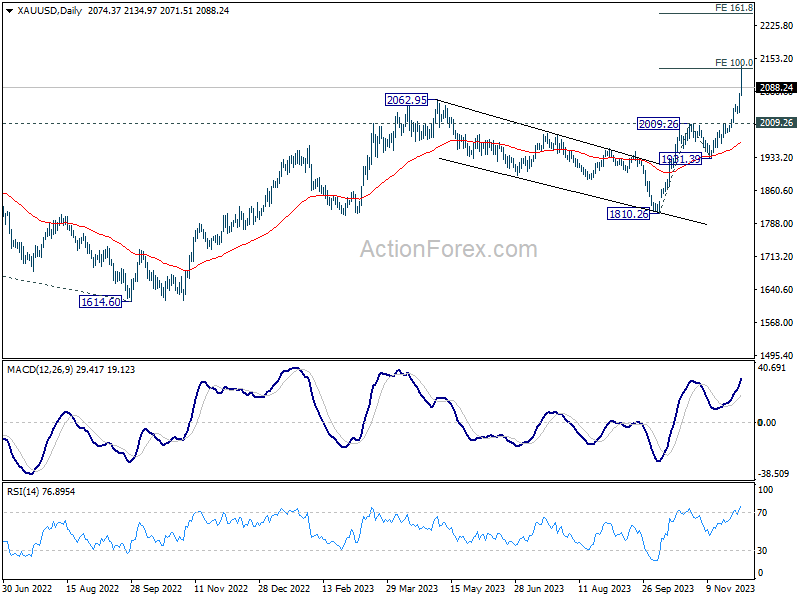
Gold prices reached a new record high today, surpassing 2,110, before experiencing a slight pullback. This surge represents an extension of the recent two-month rally, initially sparked by the Israel-Hamas conflict,which heightened global geopolitical tensions and triggered a flight to safety among investors, bolstering demand for Gold.
The upsurge in gold's value is further fueled by growing expectations of monetary easing by key global central banks. Fed, along some other major global central banks like ECB are anticipated to implement interest rate cuts in the coming year. This speculation is a critical factor in the current Gold price dynamics, as lower interest rates typically decrease the opportunity cost of holding non-yielding assets like Gold, making it more attractive to investors.
Technically, initial resistance is seen at 100% projection of 1810.26 to 2009.26 from 1931.39 at 2130.39. Some consolidations might be seen first, and volatility could be high due to near term profit taking around prior record high of 2074.
Nevertheless, outlook will stay bullish as long as 2009.26 resistance turned support holds, and further rally is expected. Sustained break above 2130.39 will pave the way to 161.8% projection at 2253.37.
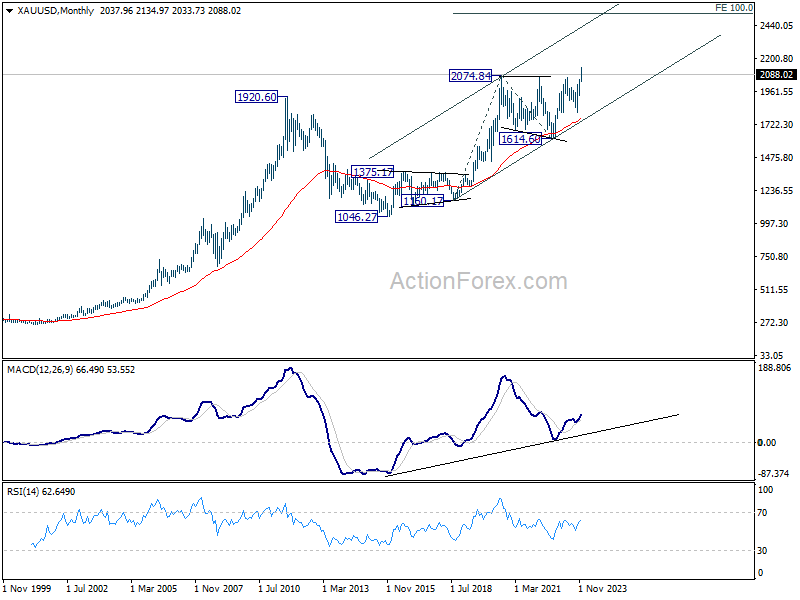
However, the broader picture for Gold's long-term trend revolves around whether it can maintain enough buying momentum to reach 100% projection of 1160.17 to 2704.84 from 1614.60 at 2529.27, surpassing 2500 mark. The potential to achieve this ambitious target hinges on whether there will be a global loosening of monetary policy next year and if geopolitical tensions persist or escalate further.
BoJ's Noguchi: Just only beginning to envision inflation target achievement
BoJ board member Asahi Noguchi emphasized the need for continuing ultra-loose monetary policy in Japan.
Noguchi acknowledged on Saturday the impact of global inflation on Japan, stating, "It's true the impact of elevated global inflation is reaching Japan's economy with consumer inflation exceeding the BOJ's 2% target since the spring of 2022."
However, Noguchi differentiated the nature of Japan's inflation from that of the West, pointing out that, "the rise is mostly due to cost-push factors amid higher import prices," contrasting with the wage-driven price increases in US and Europe. This distinction is crucial in understanding BoJ's monetary policy approach.
To effectively meet the BoJ's inflation target, Noguchi emphasized "we must see price rises backed by sustained wage increases."
Despite significant wage hikes in this year's spring wage negotiations, Noguchi believes that Japan is only at the beginning of its journey to reach its inflation target, stating, "we've only just reached a stage where the possibility of achieving our target has come into sight."
The week ahead in Forex: RBA & BoC, US NFP as pivotal drivers
Attention is squarely focused on the upcoming meetings of two major central banks: RBA and BoC, as well as heavy weight economic data from the US including ISM services and non-farm payroll employment.
RBA is widely expected to hold interest rate unchanged at 4.35%. November meeting minutes hinted at the possibility of one to two rate hikes in the forthcoming quarters. With one hike already executed, the market is rife with speculation about another one increase in February. Although recent CPI data did not meet expectations, the missing key components in this data make the set less important. It is anticipated that RBA will hold off on any significant policy announcements or indications until Q4 data is assessed, rendering the upcoming meeting more of a procedural event than a groundbreaking one.
The BoC, on the other hand, is widely believed to have concluded its tightening cycle, especially in light of Governor Tiff Macklem's recent remarks suggesting that the current interest rates might be sufficiently restrictive. The key question now is whether BoC is prepared to signal a shift towards easing. While there is chatter about a potential rate cut in Q2, it seems premature for BoC to make a pronounced shift in tone at this juncture. However, even a slight dovish tilt in the statement could stir significant reactions in the Canadian Dollar.
Parallel to these developments, the U.S. economic indicators, notably the ISM services data and non-farm payrolls, are also key factors influencing market sentiment. Fed is closely monitoring these indicators for signs of cooling in the services sector and loosening in the employment market, which are prerequisites for any softening in their stance on further rate hikes. Conversely, investors are seeking a delicate balance in the data - a "goldilock" scenario where the economy shows signs of slowing but not alarmingly so. The market's response to data falling outside this ideal range remains unpredictable, potentially leading to heightened volatility.
Here are some highlight for the week:
- Monday: Japan monetary base; Australia MI inflation gauge; Germany trade balance; Swiss CPI; Eurozone Sentix investor confidence; US factory orders.
- Tuesday: Japan Tokyo CPI; China Caixin PMI services; RBA rate decision; Eurozone PMI services final, PPI; UK PMI services final; US ISM services.
- Wednesday: Australia GDP; Germany factory orders; UK PMI construction; Eurozone retail sales; US ADP employment, trade balance; Canada BoC rate decision, trade balance, Ivey PMI.
- Thursday: Australia trade balance; China trade balance; Swiss unemployment rate, foreign currency reserves; Germany industrial production; Eurozone GDP revision; Canada building permits; US jobless claims.
- Friday: New Zealand manufacturing sales; Japan average cash earnings, household spending, current account, GDP final; Canada capacity utilization; US non-farm payrolls, U of Michigan consumer sentiment.
USD/JPY Daily Outlook
Daily Pivots: (S1) 146.20; (P) 147.27; (R1) 147.88; More...
Intraday bias in USD/JPY is back on the downside with break of 146.65 temporary low. Fall from 151.89 is in progress and should target 145.06 key support level. On the upside, break of 148.50 resistance is needed to indicate short term bottoming. Otherwise, further decline with remain in favor in case of recovery.
In the bigger picture, rise from 127.20 (2023 low) is seen as the second leg of the pattern from 151.93 (2022 high). Decisive break of 145.06 resistance turned support will confirm that this second leg has completed, after rejection by 151.93. Deeper fall would be seen through 38.2% retracement of 127.20 to 151.89 at 142.45 to 61.8% retracement at 136.63. Nevertheless strong bounce from 145.06 will retain medium term bullishness for another test on 151.93 at a later stage.
Economic Indicators Update
| GMT | Ccy | Events | Actual | Forecast | Previous | Revised |
|---|---|---|---|---|---|---|
| 21:45 | NZD | Terms of Trade Index Q3 | -0.60% | -2.10% | 0.40% | 0.30% |
| 23:50 | JPY | Monetary Base Y/Y Nov | 8.90% | 9.50% | 9.00% | |
| 00:00 | AUD | TD Securities Inflation M/M Nov | 0.30% | -0.10% | ||
| 07:00 | EUR | Germany Trade Balance (EUR) Oct | 17.0B | 16.5B | ||
| 07:30 | CHF | CPI M/M Nov | -0.10% | 0.10% | ||
| 07:30 | CHF | CPI Y/Y Nov | 1.60% | 1.70% | ||
| 09:30 | EUR | Eurozone Sentix Investor Confidence Dec | -16 | -18.6 | ||
| 15:00 | USD | Factory Orders M/M Oct | -2.50% | 2.80% |
Technical Outlook and Review
DXY:
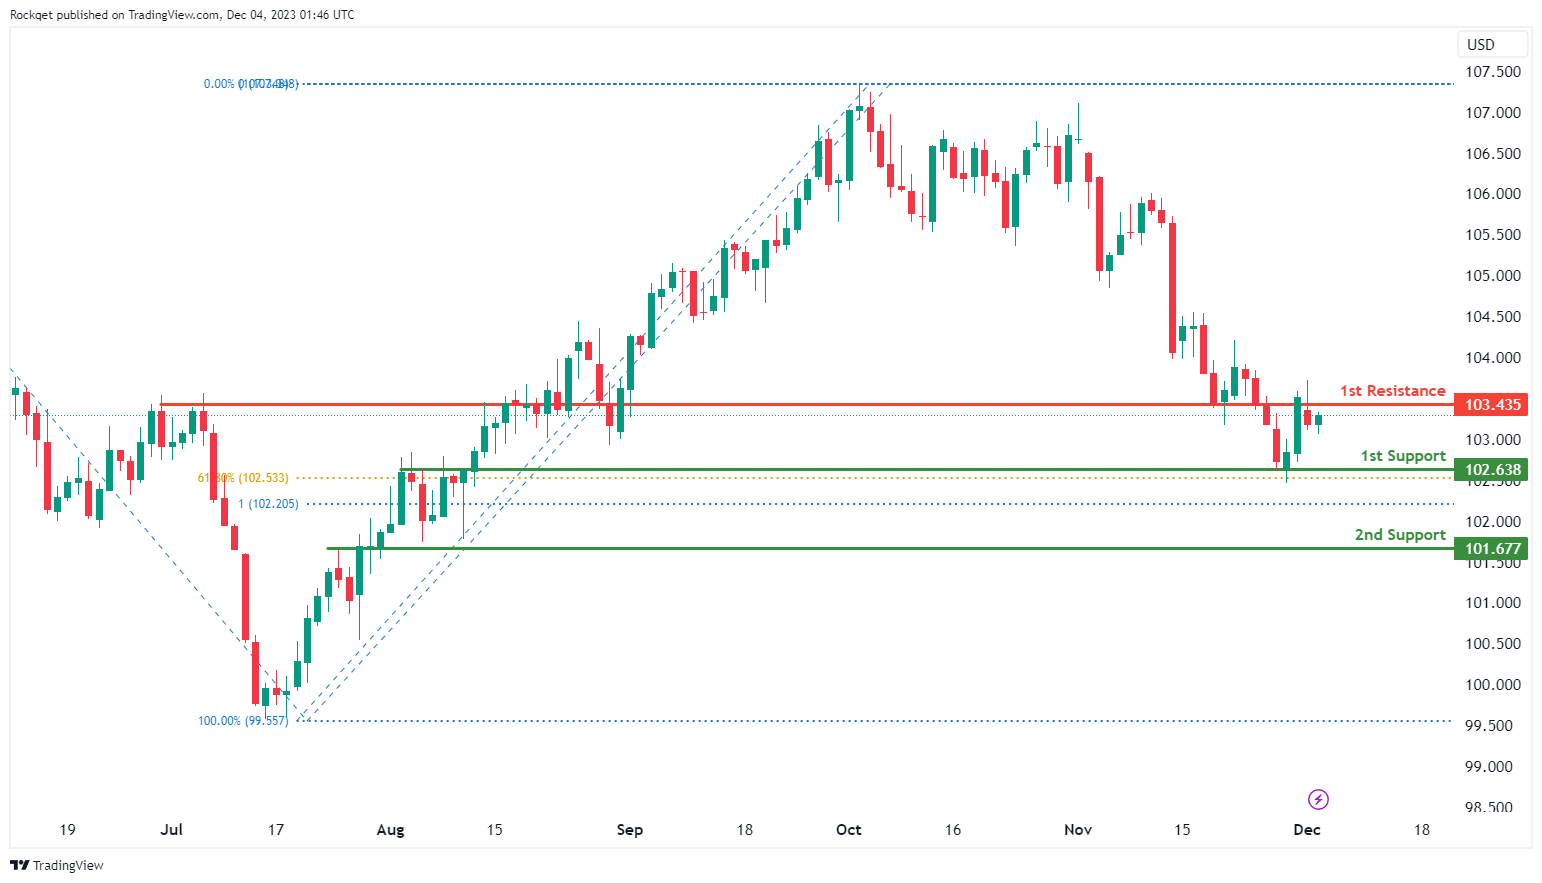
The DXY (US Dollar Index) chart currently maintains a bearish overall momentum, indicating the potential for a bearish continuation towards the 1st support.
The 1st support at 102.63 is identified as an overlap support with a 61.80% Fibonacci retracement, signifying its importance as a significant level where buying interest may emerge. This level adds to its significance as a potential area for buyer activity, providing potential support for the US Dollar Index.
The 2nd support at 101.67 is categorized as pullback support, reinforcing its importance as a level where buying interest may intensify.
On the resistance side, the 1st resistance at 103.43 is noted as an overlap resistance, representing a notable barrier where selling interest could intensify, potentially hindering DXY’s upward movement.
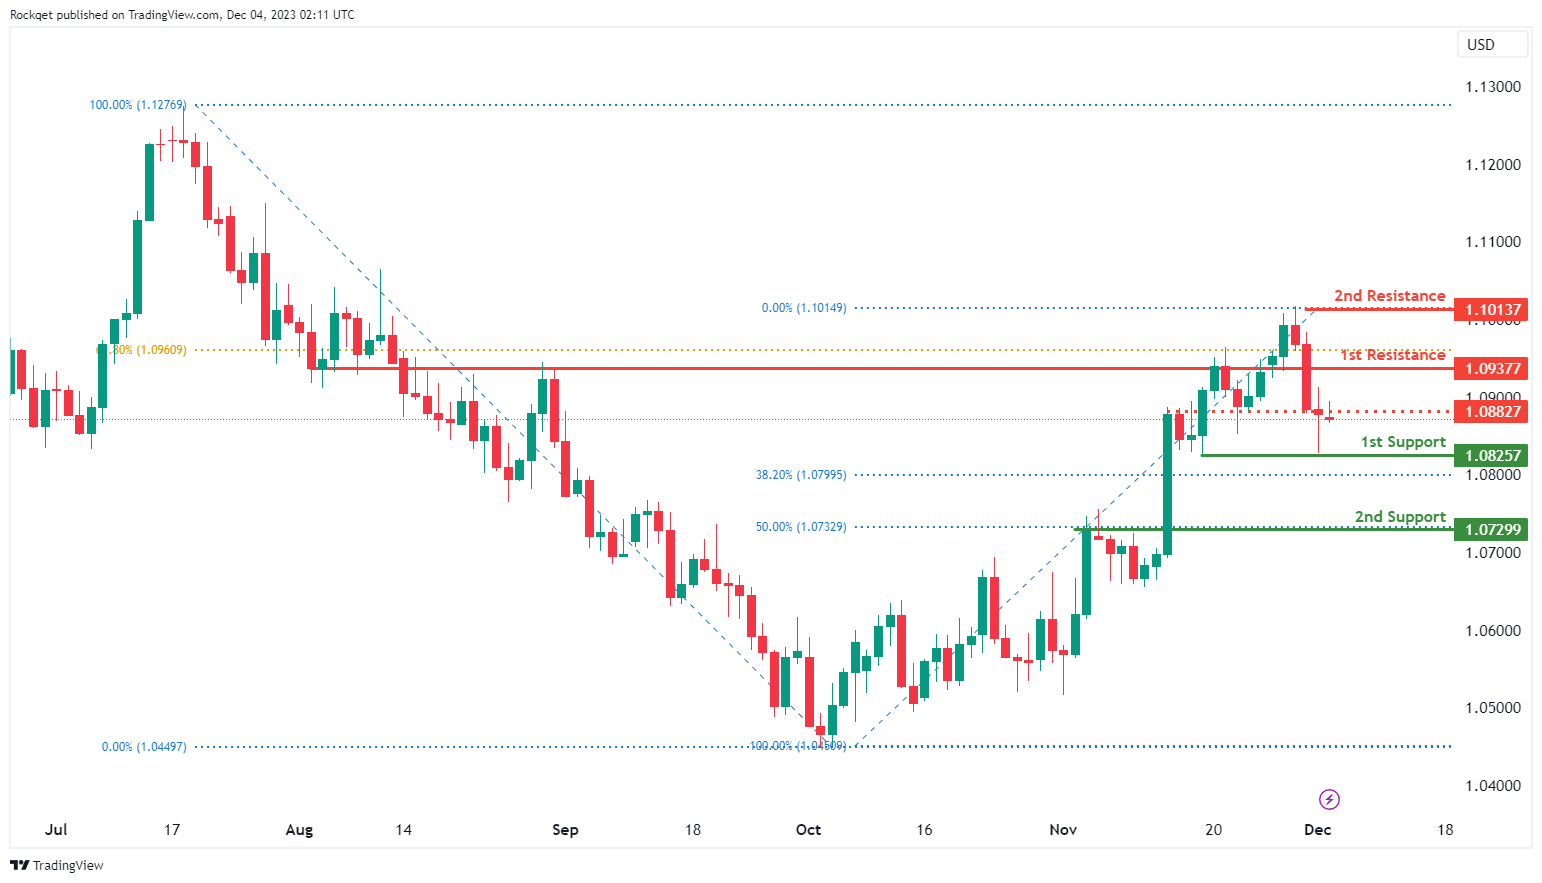
EUR/USD:
The EUR/USD chart currently exhibits a bullish overall momentum, suggesting potential price action where it may experience a bullish bounce off the 1st support and move towards the 1st resistance.
The 1st support at 1.0825 is identified as an overlap support, signifying its importance as a significant level where buying interest may emerge, potentially providing essential support for EUR/USD.
The 2nd support at 1.0729 features a 50% Fibonacci retracement, adding to its significance as a potential area for buyer activity, strengthening the support.
On the resistance side, the 1st resistance at 1.0937 is categorized as a pullback resistance, representing a notable barrier where selling interest could intensify, potentially hindering EUR/USD’s upward movement.
Additionally, there is a 2nd resistance at 1.1013, noted as a swing high resistance, further reinforcing potential resistance factors for the currency pair.
Furthermore, an intermediate resistance level at 1.0882 is identified as a pullback resistance, adding to its significance as a potential resistance level.
EUR/JPY:
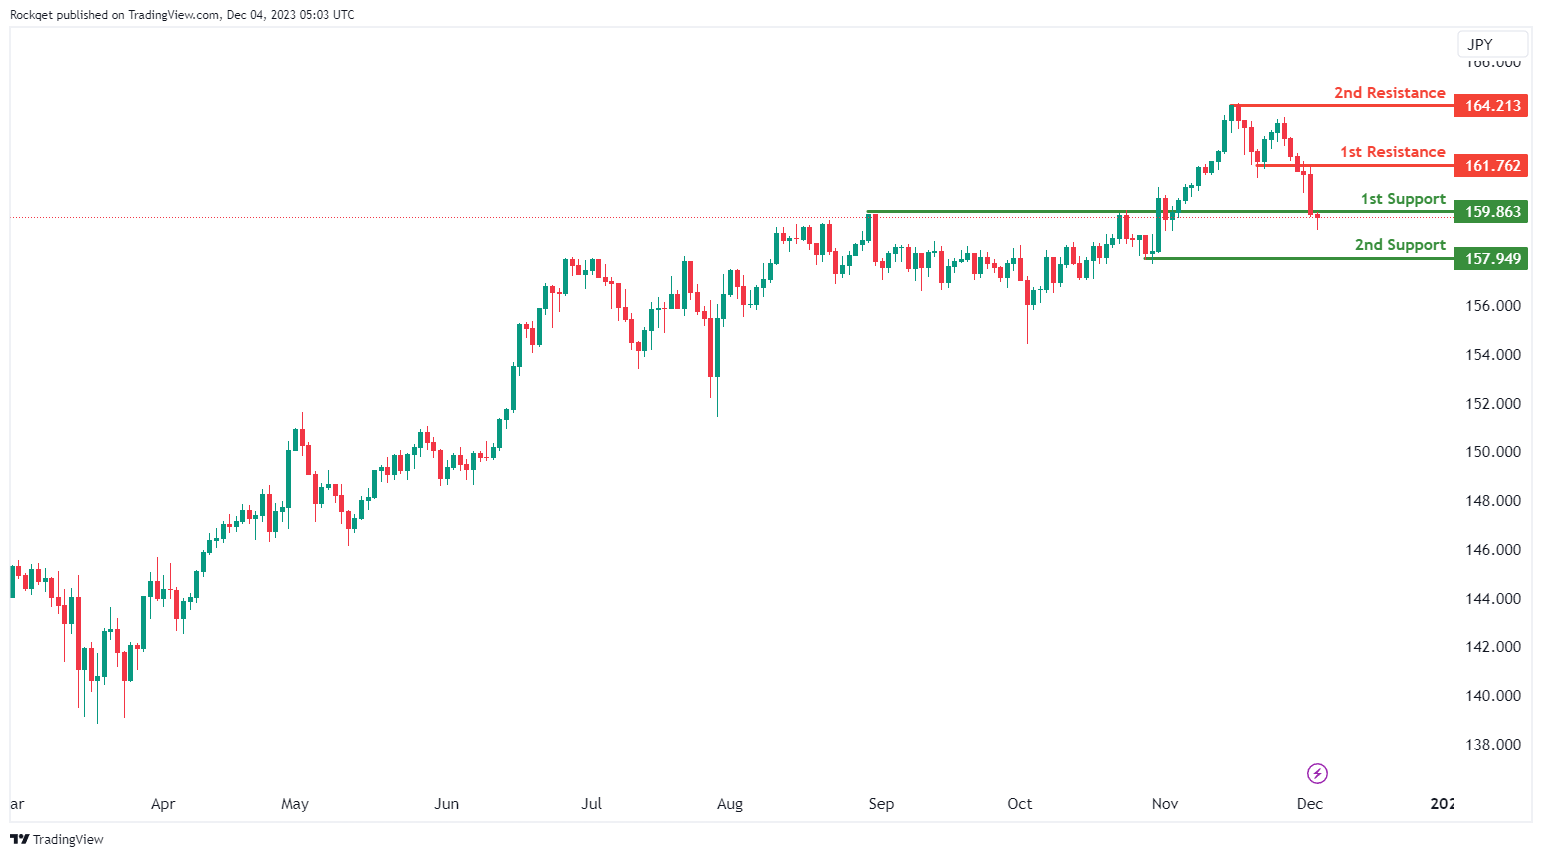
The analyzed instrument is EUR/JPY, and the overall momentum of the chart is currently bearish.
There is a potential for the price to make a bearish break off the 1st support and drop towards the 2nd support.
The 1st support level is identified at 159.86, and its favorable characteristic is attributed to being an overlap support.
The 2nd support level is situated at 157.94, and its favorable aspect is derived from being a swing low support.
On the resistance side, the 1st resistance is positioned at 161.76, and it is considered significant due to being a pullback resistance.
The 2nd resistance is located at 164.21, and its significance is derived from being a swing high resistance.
EUR/GBP:
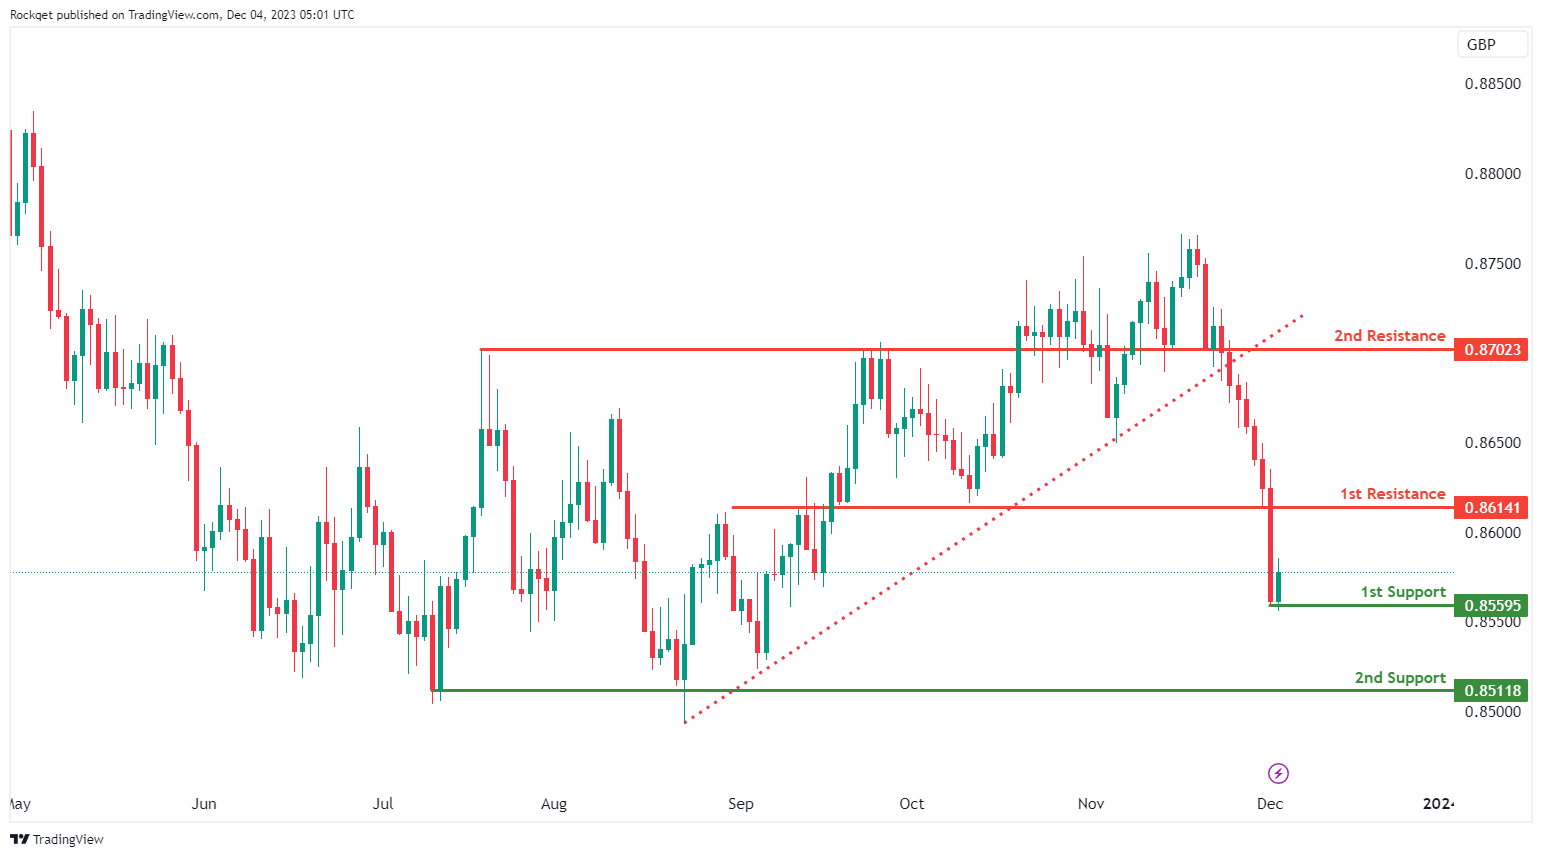
The analyzed instrument is EUR/GBP, and the overall momentum of the chart is currently bearish. This bearish momentum is attributed to the fact that the price broke below an ascending support line, triggering a potential bearish move.
There is a potential for the price to make a rise towards the 1st resistance in the short term before reversing off it and dropping towards the 1st support.
The 1st support level is identified at 0.8559, and its favorable characteristic is attributed to being a swing low support.
The 2nd support level is situated at 0.8511, and its favorable aspect is derived from being a multi-swing low support.
On the resistance side, the 1st resistance is positioned at 0.8614, and it is considered significant due to being a pullback resistance.
The 2nd resistance is located at 0.8702, and its significance is derived from also being a pullback resistance.
GBP/USD:
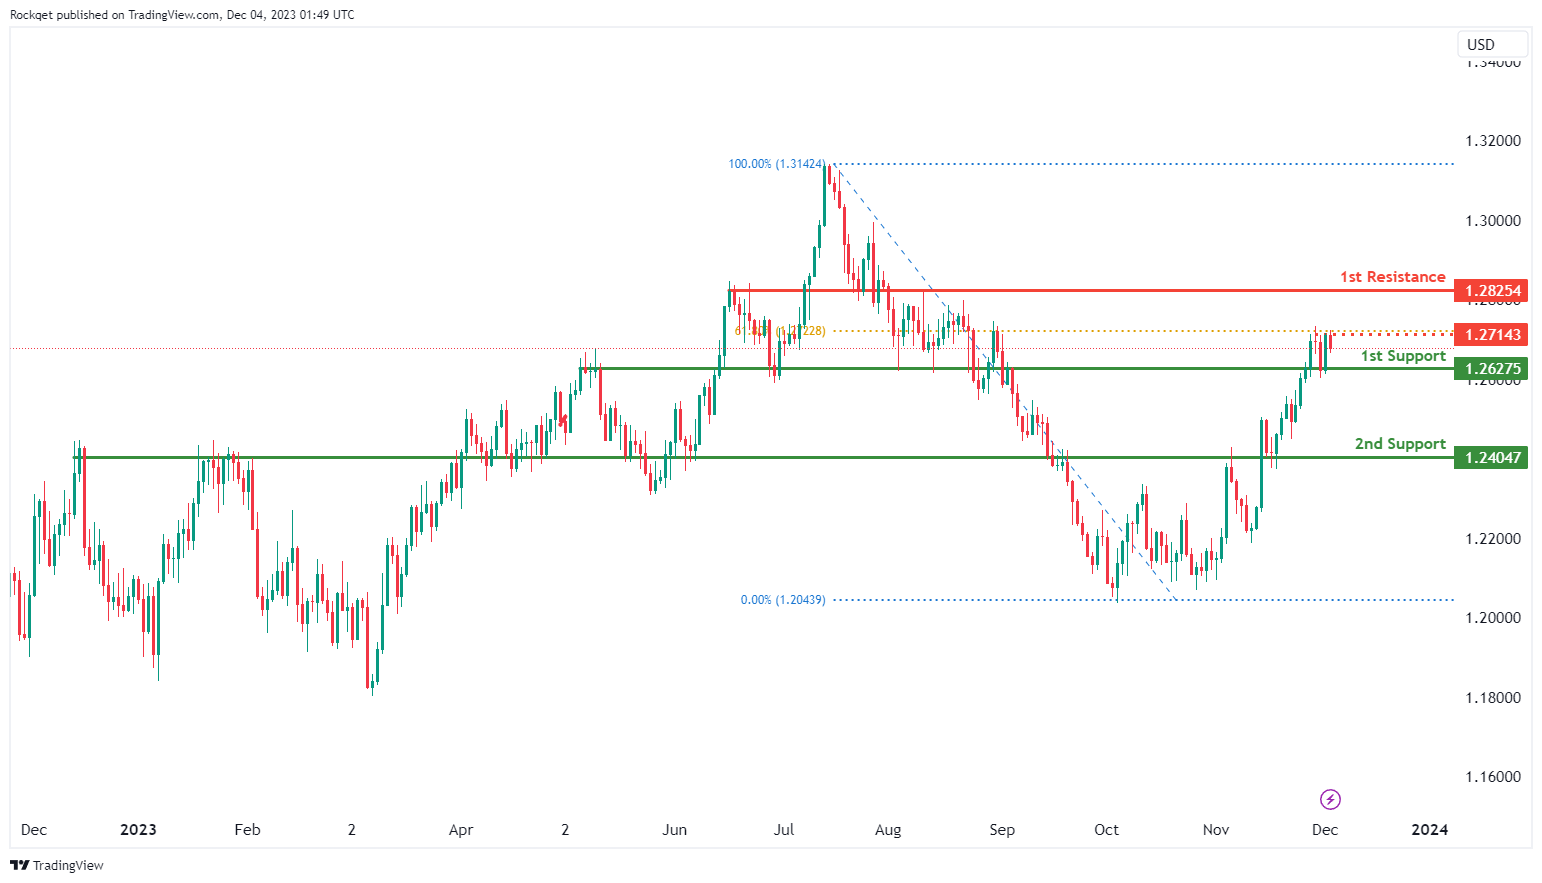
The GBP/USD chart currently maintains a bullish overall momentum, suggesting potential price action where it may continue its bullish movement towards the 1st resistance.
The 1st support at 1.2627 is identified as an overlap support, signifying its importance as a significant level where buying interest may emerge, potentially providing essential support for GBP/USD.
The 2nd support at 1.2404 is also noted as an overlap support, reinforcing its significance as another potential area for buyer activity.
On the resistance side, the 1st resistance at 1.2825 is categorized as an overlap resistance, representing a notable barrier where selling interest could intensify, potentially hindering GBP/USD’s upward movement.
Furthermore, an intermediate resistance level at 1.2714 is identified as an overlap resistance with a 61.80% Fibonacci retracement, adding to its significance as a potential resistance level.
GBP/JPY:
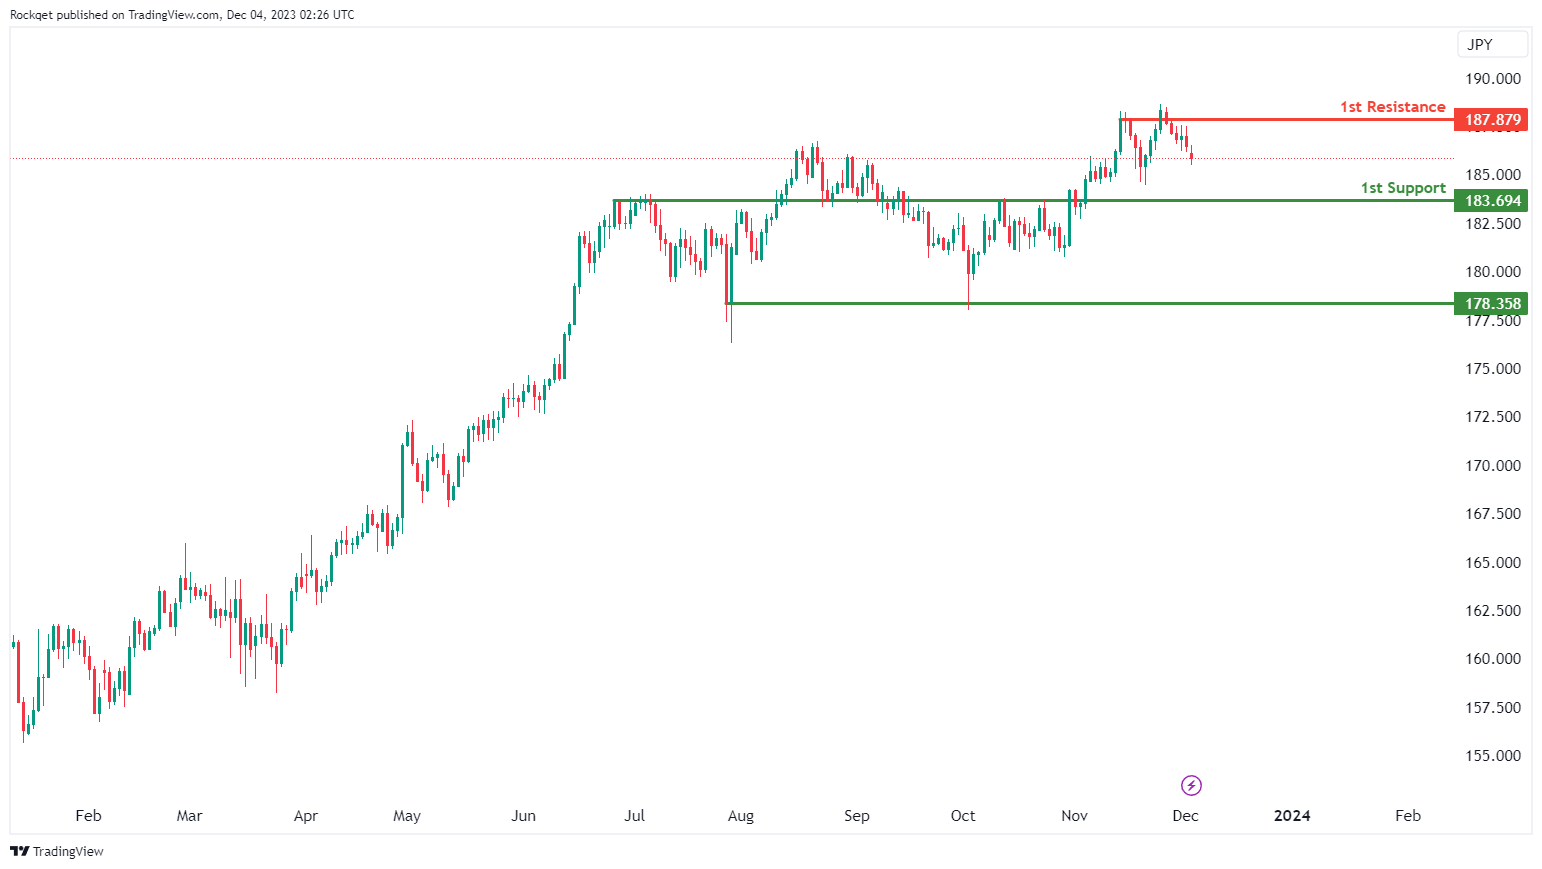
The overall momentum of GBP/JPY is bearish. There is potential bearish continuation towards the 1st support at 183.69. If this support level is breached, the 2nd support at 178.36 could be the next significant level to watch for potential price reactions. Conversely, if there’s a reversal in the price, the 1st resistance at 187.88 may act as a barrier to any bullish movement.
1st support at 183.69: This level is considered a pullback support, and it may provide a potential area where buyers could step in, leading to a temporary halt or bounce in the bearish trend.
2nd support at 178.36: This level is identified as a multi-swing low support, indicating that it has held as a significant support level multiple times in the past. If the price continues to move lower, this level could act as a stronger support area.
1st resistance at 187.88: This level is seen as a pullback resistance, and it may serve as a point where sellers could become active, potentially causing the price to reverse or consolidate.
USD/CHF:
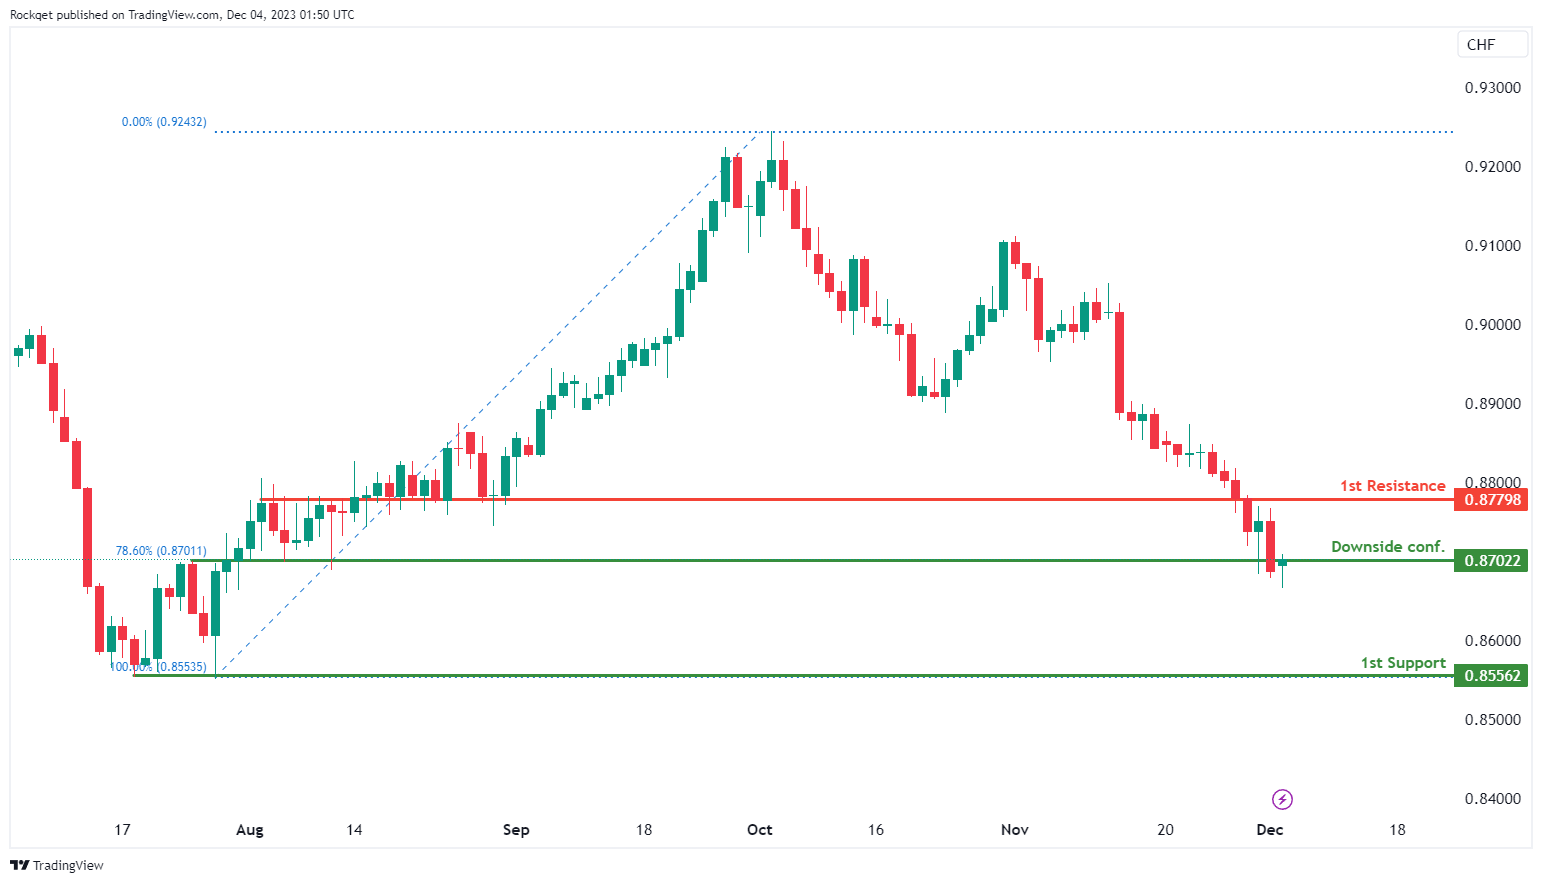
The USD/CHF chart currently exhibits a bearish overall momentum, suggesting potential price action where it may continue its bearish movement towards the 1st support.
The 1st support at 0.8556 is identified as a multi-swing low support, signifying its importance as a significant level where buying interest may emerge, potentially providing essential support for USD/CHF.
Additionally, traders may await downside confirmation around 0.8702, which is noted as an overlap support with a 78.60% Fibonacci retracement, further strengthening the support zone.
On the resistance side, the 1st resistance at 0.8778 is categorized as an overlap resistance, representing a notable barrier where selling interest could intensify, potentially hindering USD/CHF’s upward movement.
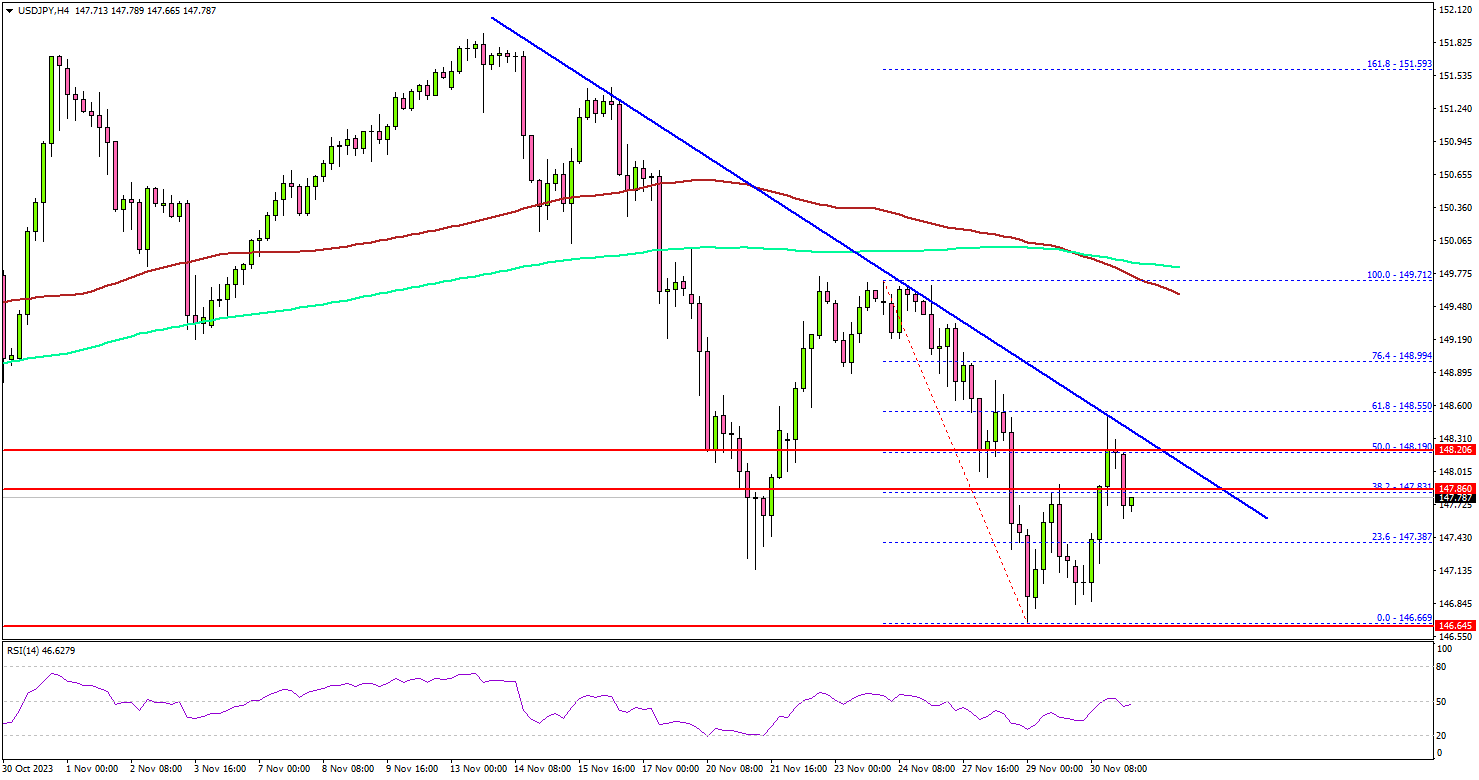
USD/JPY:
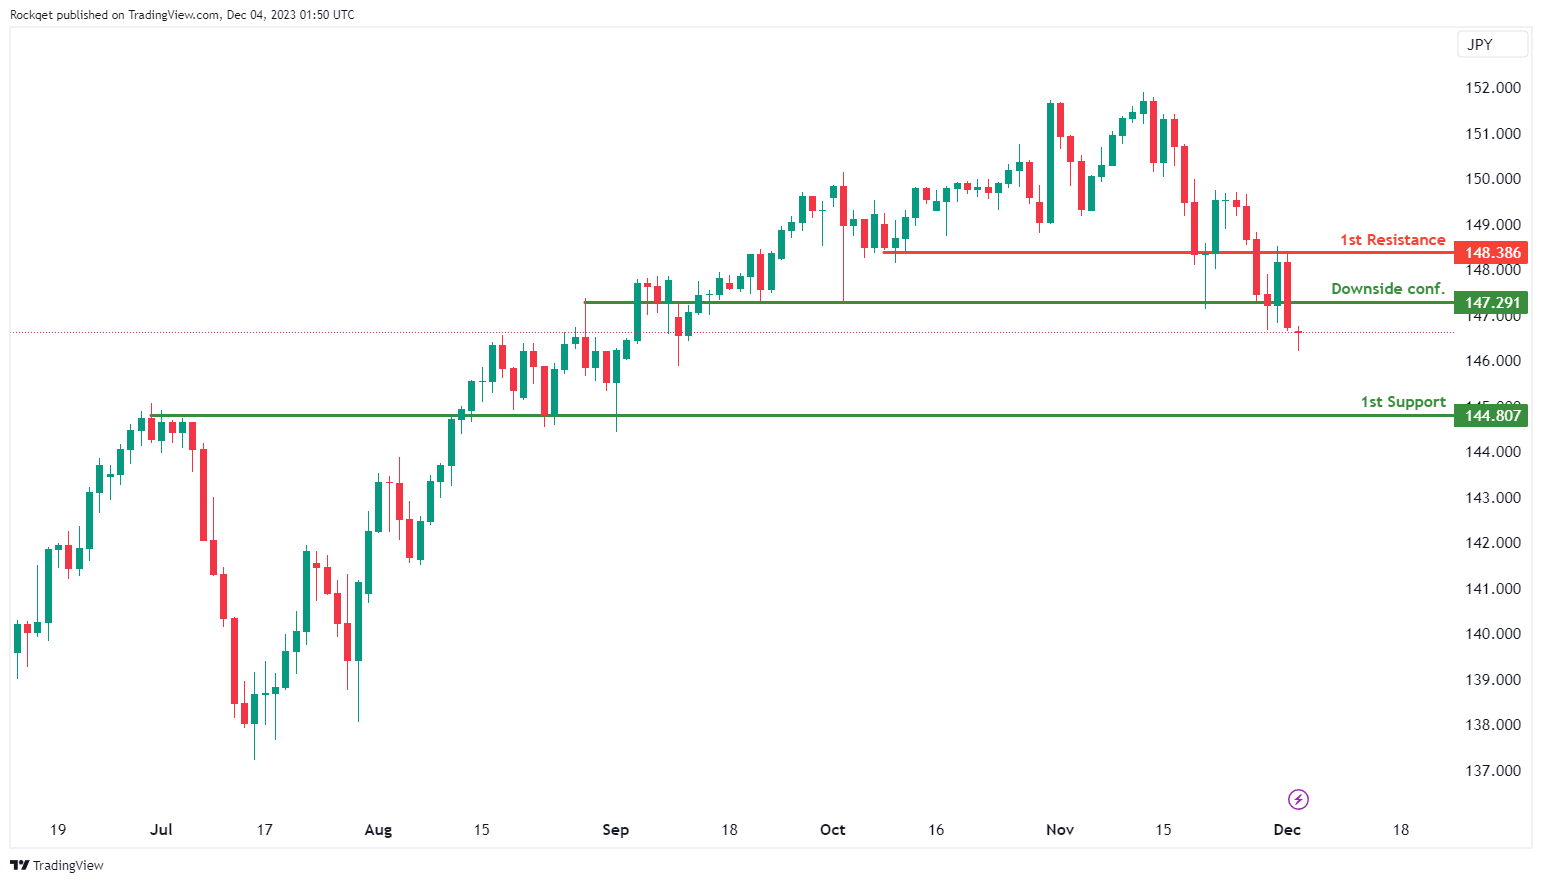
The USD/JPY chart currently exhibits a bearish overall momentum, suggesting potential price action where it may continue its bearish movement towards the 1st support.
The 1st support at 144.80 is identified as an overlap support, signifying its importance as a significant level where buying interest may emerge, potentially providing essential support for USD/JPY.
Additionally, traders may await downside confirmation around 147.29, which is noted as an overlap support, further strengthening the support zone.
On the resistance side, the 1st resistance at 148.38 is categorized as an overlap resistance, representing a notable barrier where selling interest could intensify, potentially hindering USD/JPY’s upward movement.
USD/CAD:
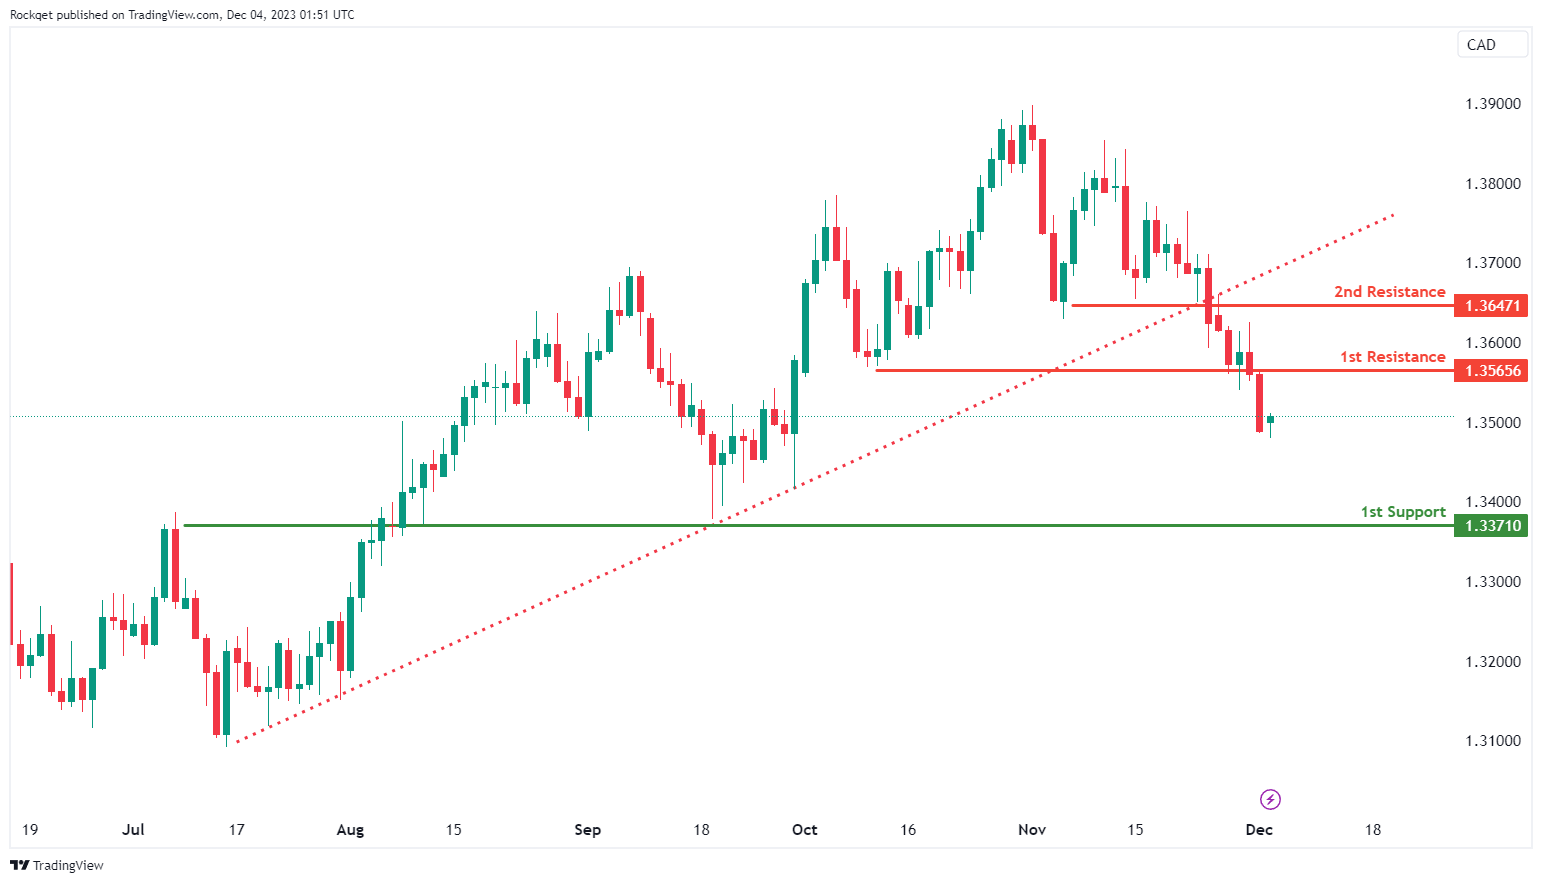
The USD/CAD chart currently has a bearish overall momentum, which has been fueled by a break below an ascending support line, suggesting a potential bearish move.
The price could potentially continue its bearish movement towards the 1st support at 1.3371. This support level is identified as a pullback support, indicating its significance as a potential level where buying interest may emerge, providing some support for USD/CAD.
On the resistance side, the 1st resistance at 1.3565 is categorized as an overlap resistance, which suggests it’s a significant level where selling interest may intensify, acting as a potential barrier to further upward price movement. The 2nd resistance at 1.3647 is noted as a pullback resistance, adding to the potential resistance factors for the pair.
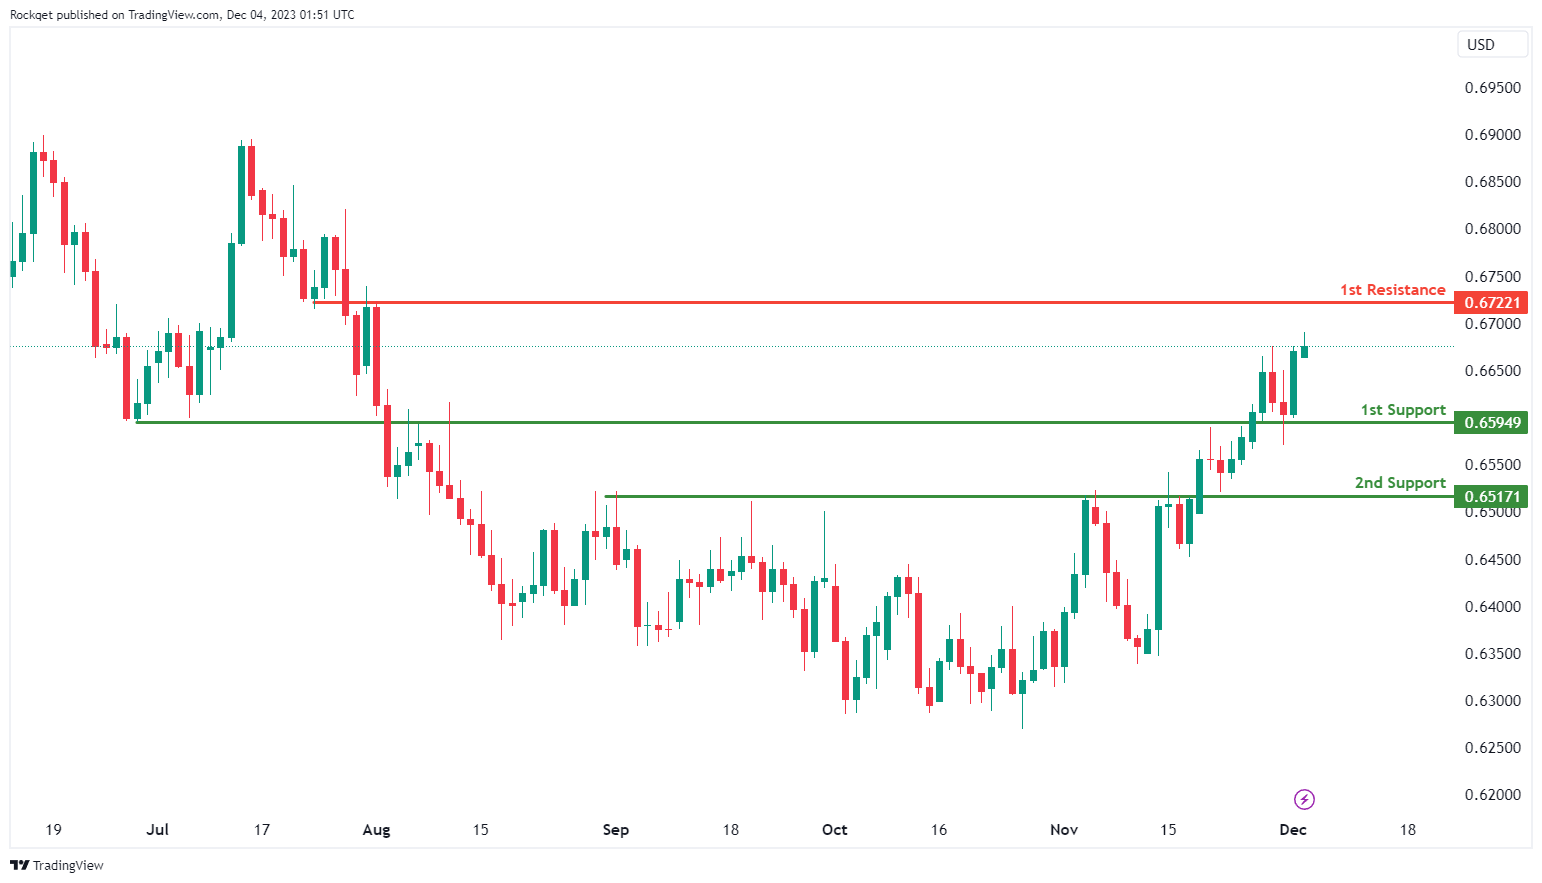
AUD/USD:
The AUD/USD chart currently exhibits a bullish overall momentum, suggesting the potential for a bullish continuation towards the 1st resistance.
The 1st support at 0.6594 is identified as an overlap support level, indicating its significance as a potential level where buying interest may emerge and provide support for the AUD/USD pair.
Similarly, the 2nd support at 0.6517 is another overlap support level, adding to its importance as a potential area where buyers might become active.
On the resistance side, the 1st resistance at 0.6722 is categorized as an overlap resistance, suggesting that it’s a significant level where selling interest may intensify, potentially acting as a barrier to further upward price movement.
NZD/USD
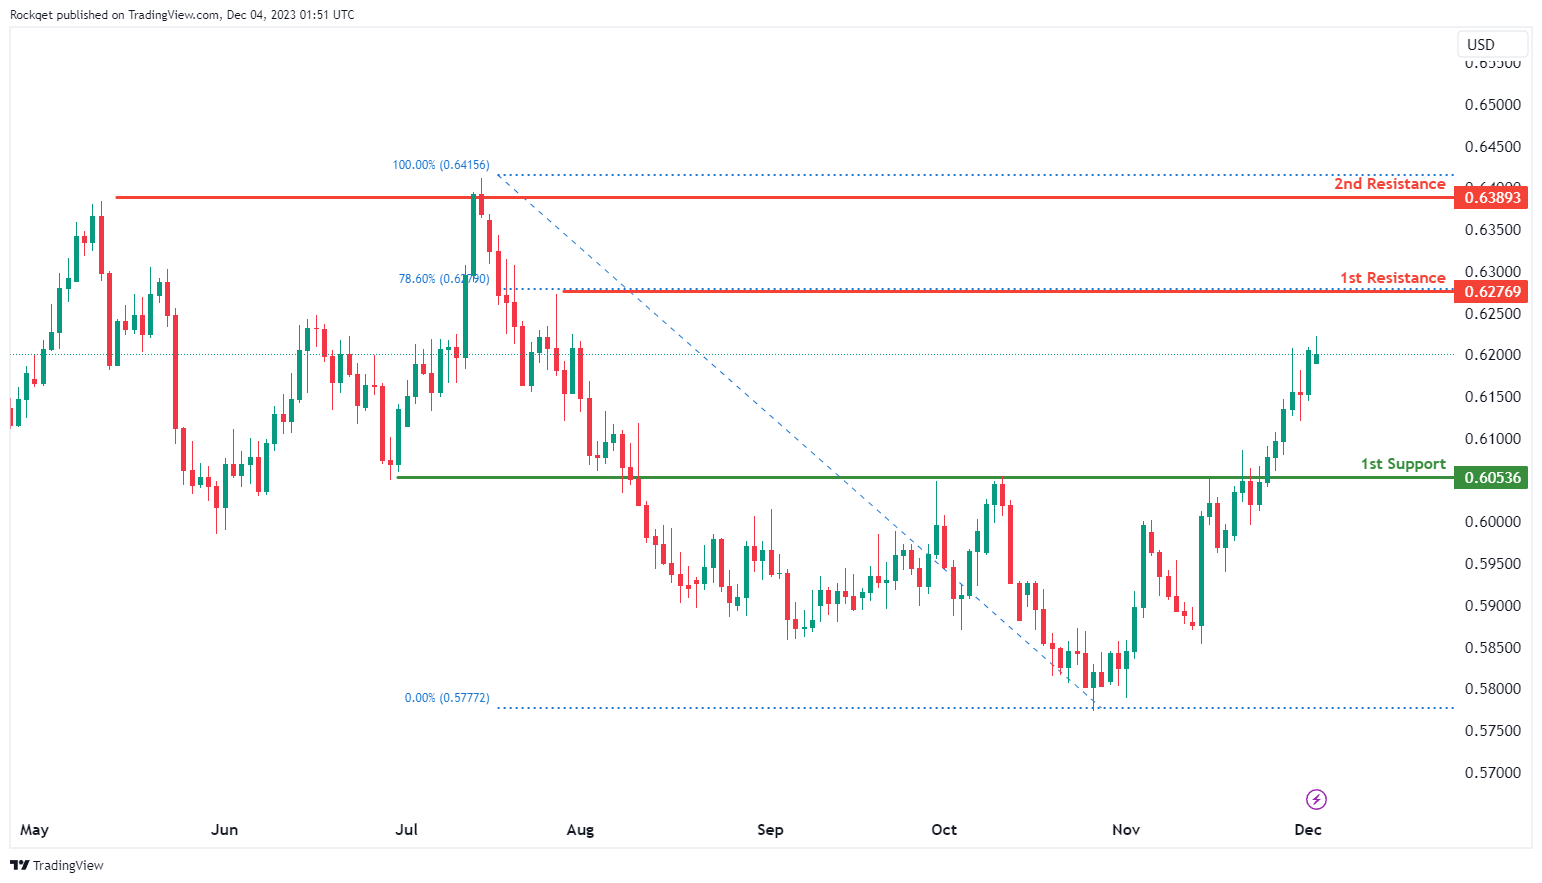
The NZD/USD chart currently exhibits a bullish overall momentum, suggesting the potential for a bullish continuation towards the 1st resistance.
The 1st support at 0.6053 is identified as a pullback support level, indicating its significance as a potential level where buying interest may emerge and provide support for the NZD/USD pair.
On the resistance side, the 1st resistance at 0.6276 is categorized as a swing high resistance, and it aligns with the 78.60% Fibonacci Retracement level, adding to its importance as a potential barrier where selling interest may intensify.
Additionally, the 2nd resistance at 0.6389 is noted as a multi-swing high resistance, further reinforcing its role as a significant level where selling pressure could potentially increase.
DJ30:
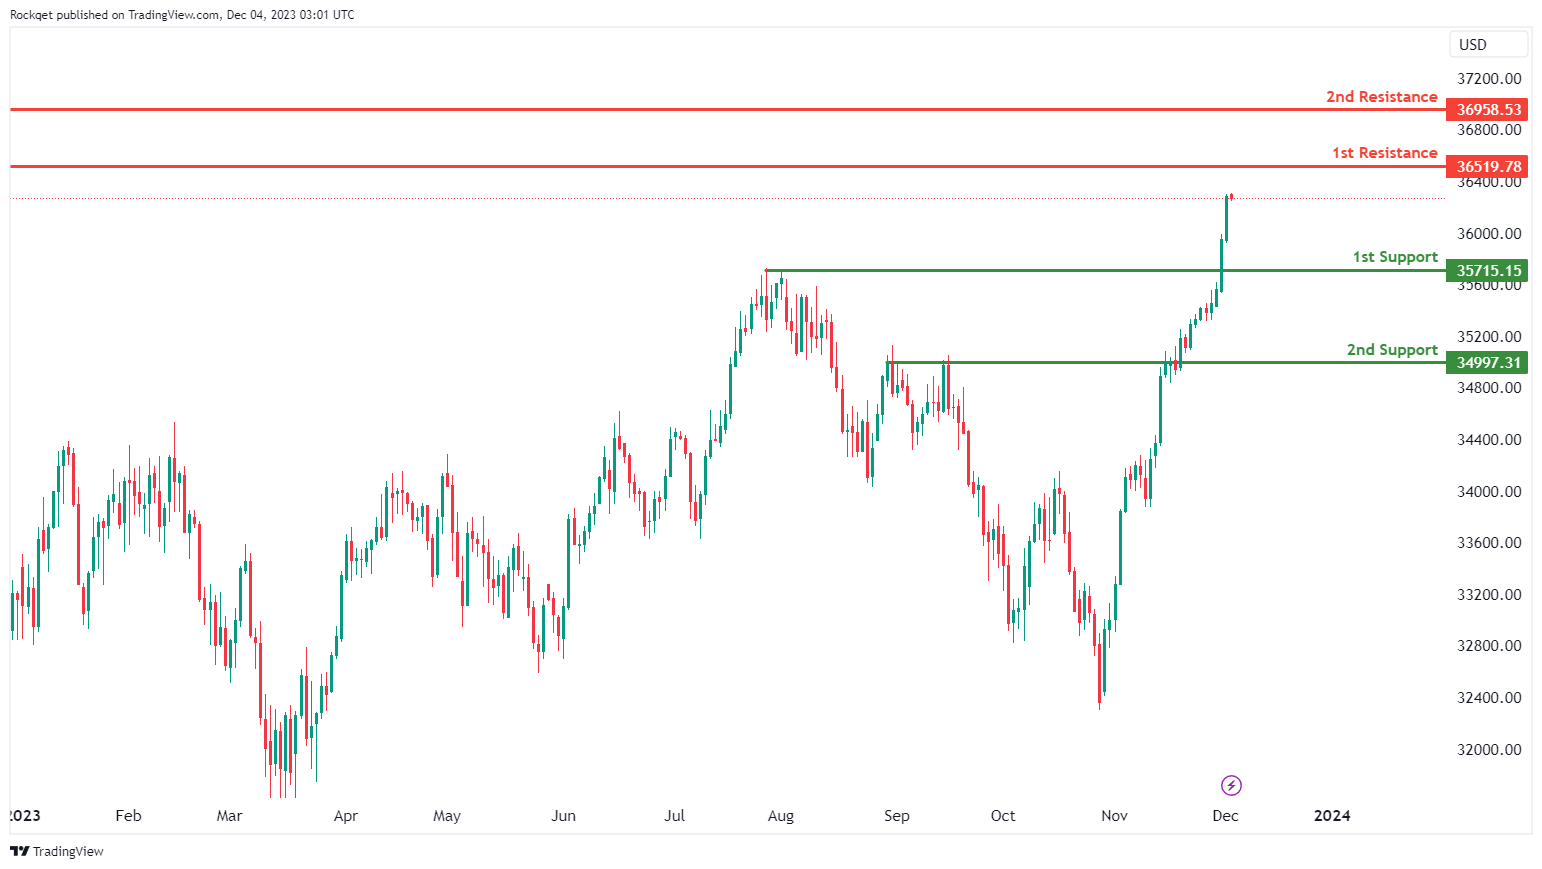
The DJ30,the momentum of the chart is the overall momentum of the chart is bullish. In this scenario, there is a potential short-term bearish move followed by a bounce.
1st support at 35,713.98: This level is identified as a multi-swing low support, suggesting that it aligns with historical swing lows and is likely to be a strong support level. Traders may expect the price to find buying interest near this level.
2nd support at 34,997.31: The 2nd support level is marked as a pullback support, indicating that it may provide additional support if the price experiences a short-term pullback. It reinforces the potential for a bounce from lower levels.
Intermediate resistance at 36,519.78: This intermediate resistance level may act as a barrier to further upward movement. Traders should watch for signs of a breakout above this level for a potential bullish continuation.
2nd resistance at 36,958.53: The 2nd resistance level is marked as a swing high resistance, suggesting that it could be a point where selling pressure may increase temporarily.
GER40:
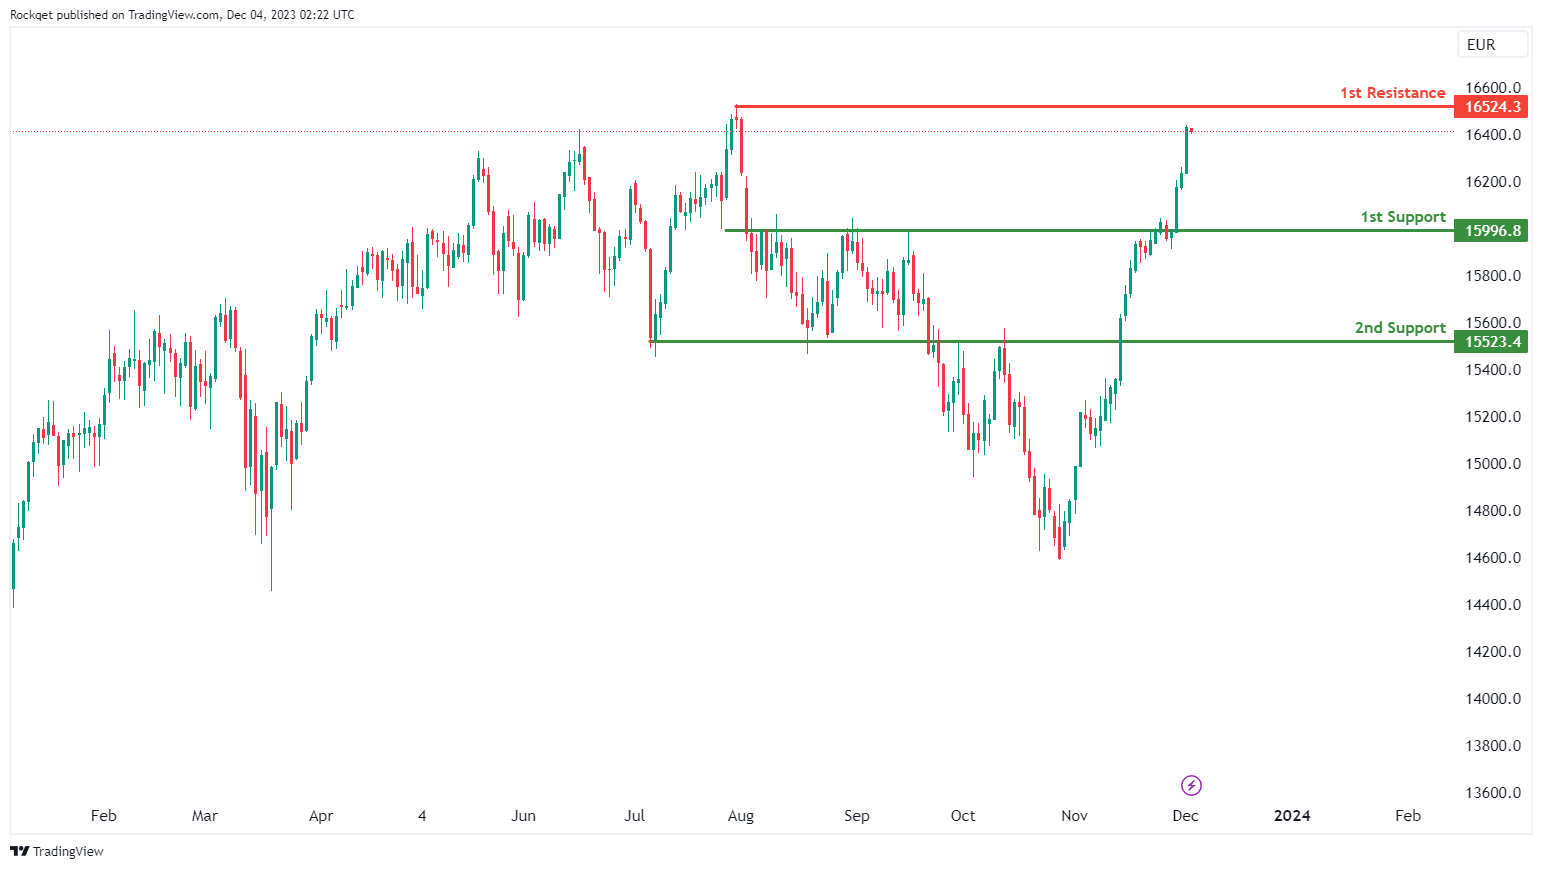
The GER40 overall momentum is the overall momentum of the chart is bearish. There is a potential rish price movement with a focus on key support and resistance levels:
1st sbeaupport at 15,996.8: This level is identified as a pullback support, indicating that it may serve as a significant support level where buyers could potentially step in to prevent further downside movement.
2nd support at 15,523.4: The 2nd support level is considered a multi-swing low support, suggesting that it has historical significance as a support level. Traders should monitor this level for potential buying interest.
1st resistance at 16,524.3: The 1st resistance level is marked as a pullback resistance, signifying that it could act as a barrier to further upward movement. Traders may expect selling pressure to potentially increase near this level.
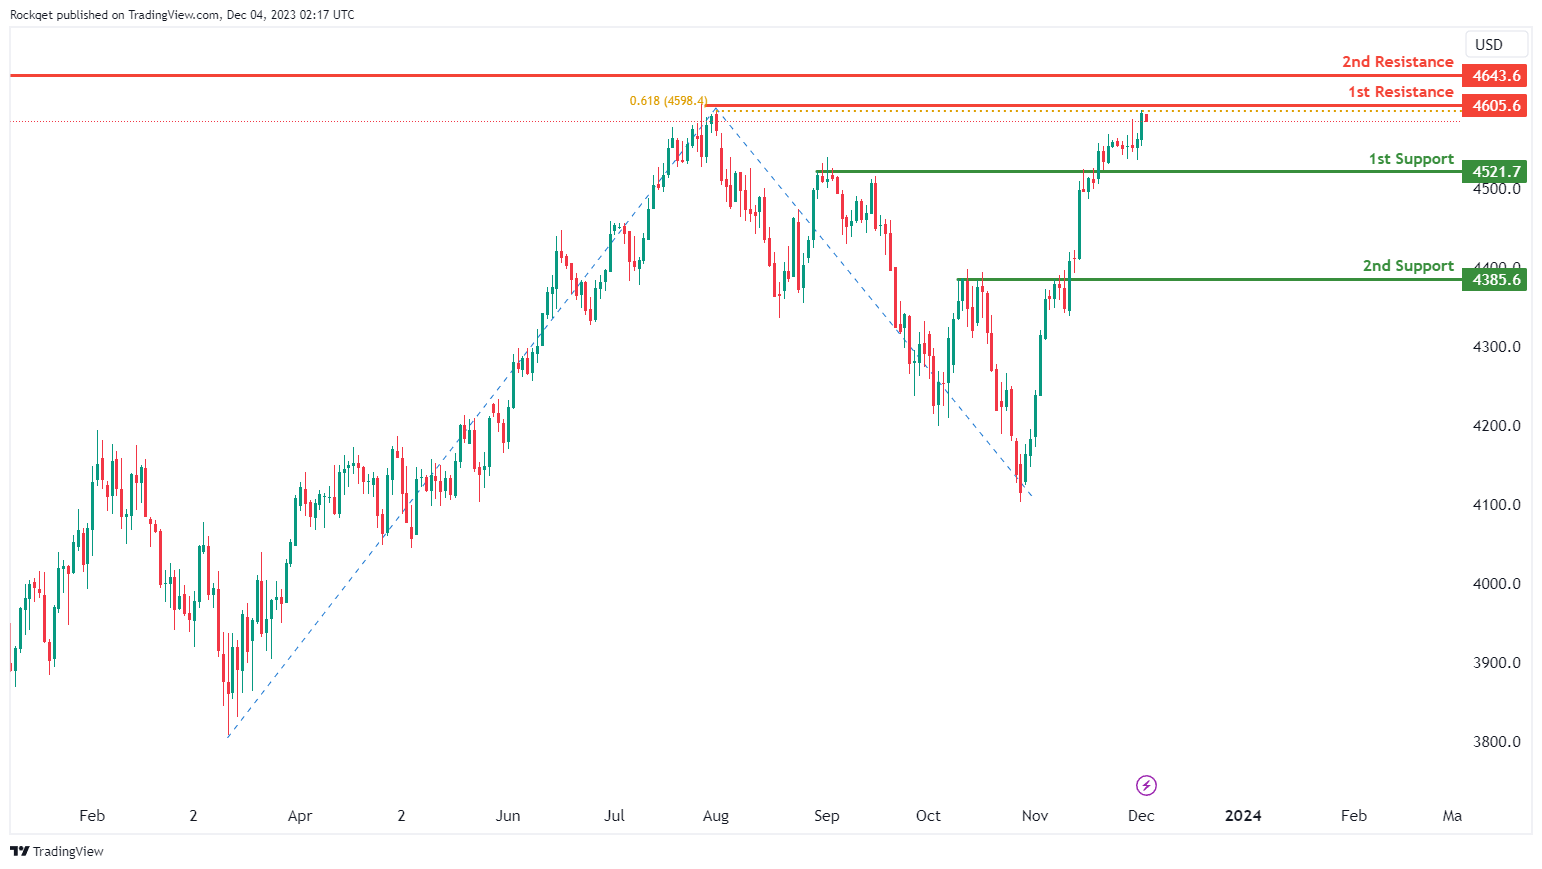
US500:
The overall momentum of US500 is the overall momentum of the chart is bearish. There is a possibility of a bearish reaction off the 1st resistance level, with a potential drop towards the 1st support.
1st support at 4,521.7: This level is identified as a pullback support and may act as a significant support level where buyers could potentially step in to prevent further downside movement.
2nd support at 4,385.6: The 2nd support level is also considered a pullback support, suggesting that it has historical significance as a support level. Traders should monitor this level for potential buying interest.
1st resistance at 4,605.6: The 1st resistance level is marked as a pullback resistance and is associated with the 61.80% Fibonacci Projection, indicating that it could act as a barrier to further upward movement. Traders may expect selling pressure to potentially increase near this level.
2nd resistance at 4,643.6: The 2nd resistance level is identified as a swing high resistance, which suggests that it has previously acted as a significant barrier to price advancement.
BTC/USD:
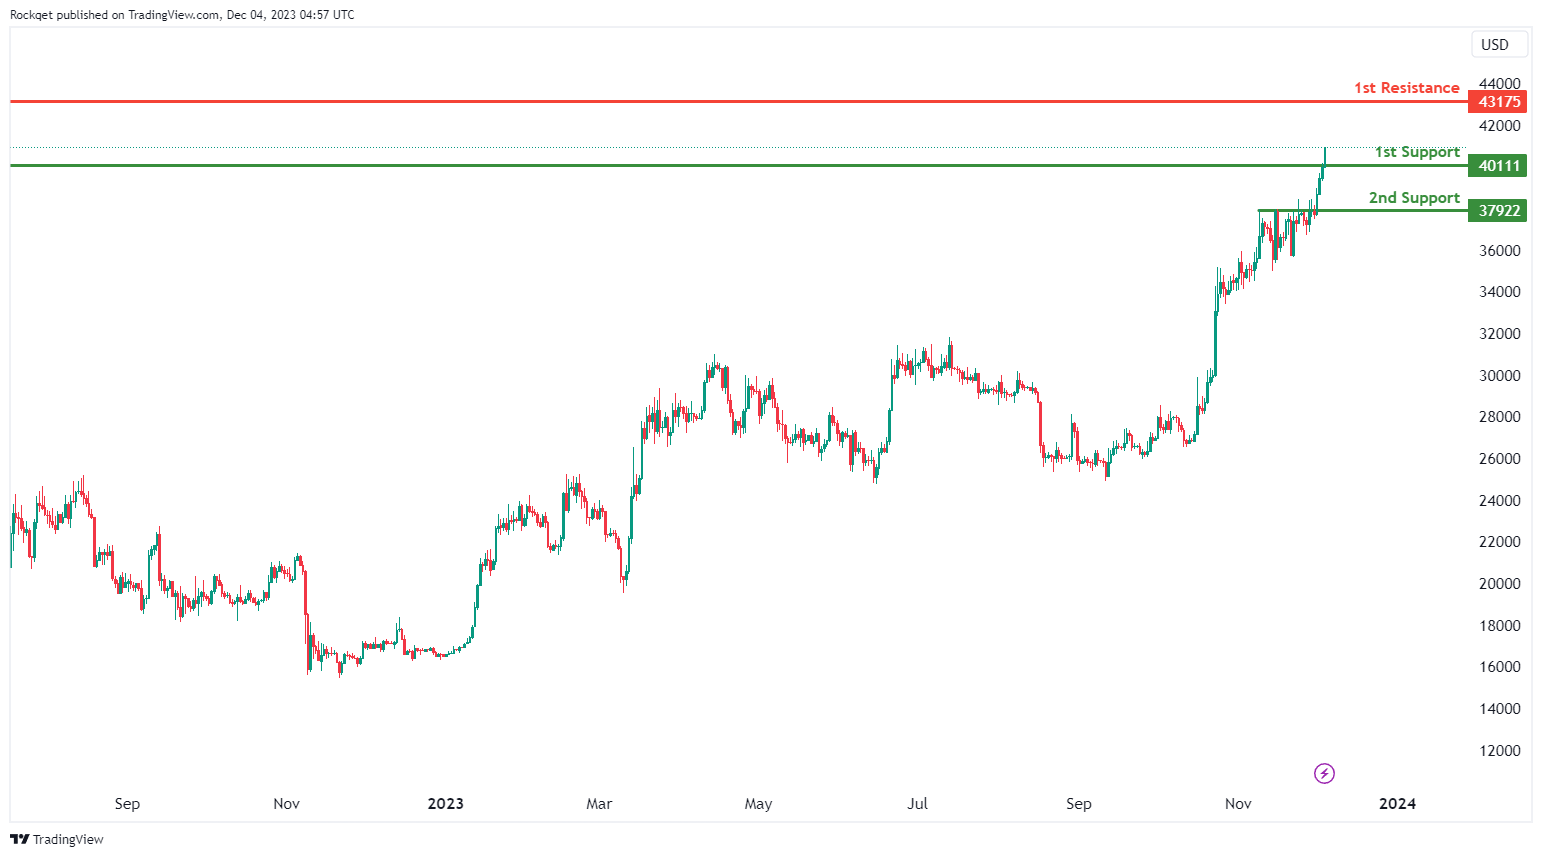
The analyzed instrument is BTC/USD, and the overall momentum of the chart is currently bullish.
There is a potential for the price to make a bullish continuation towards the 1st resistance.
The 1st support level is identified at 40111, and its favorable characteristic is attributed to being a pullback support.
The 2nd support level is situated at 37922, and its favorable aspect is derived from also being a pullback support.
On the resistance side, the 1st resistance is positioned at 43175, and it is considered significant due to being a swing high resistance.
ETH/USD:
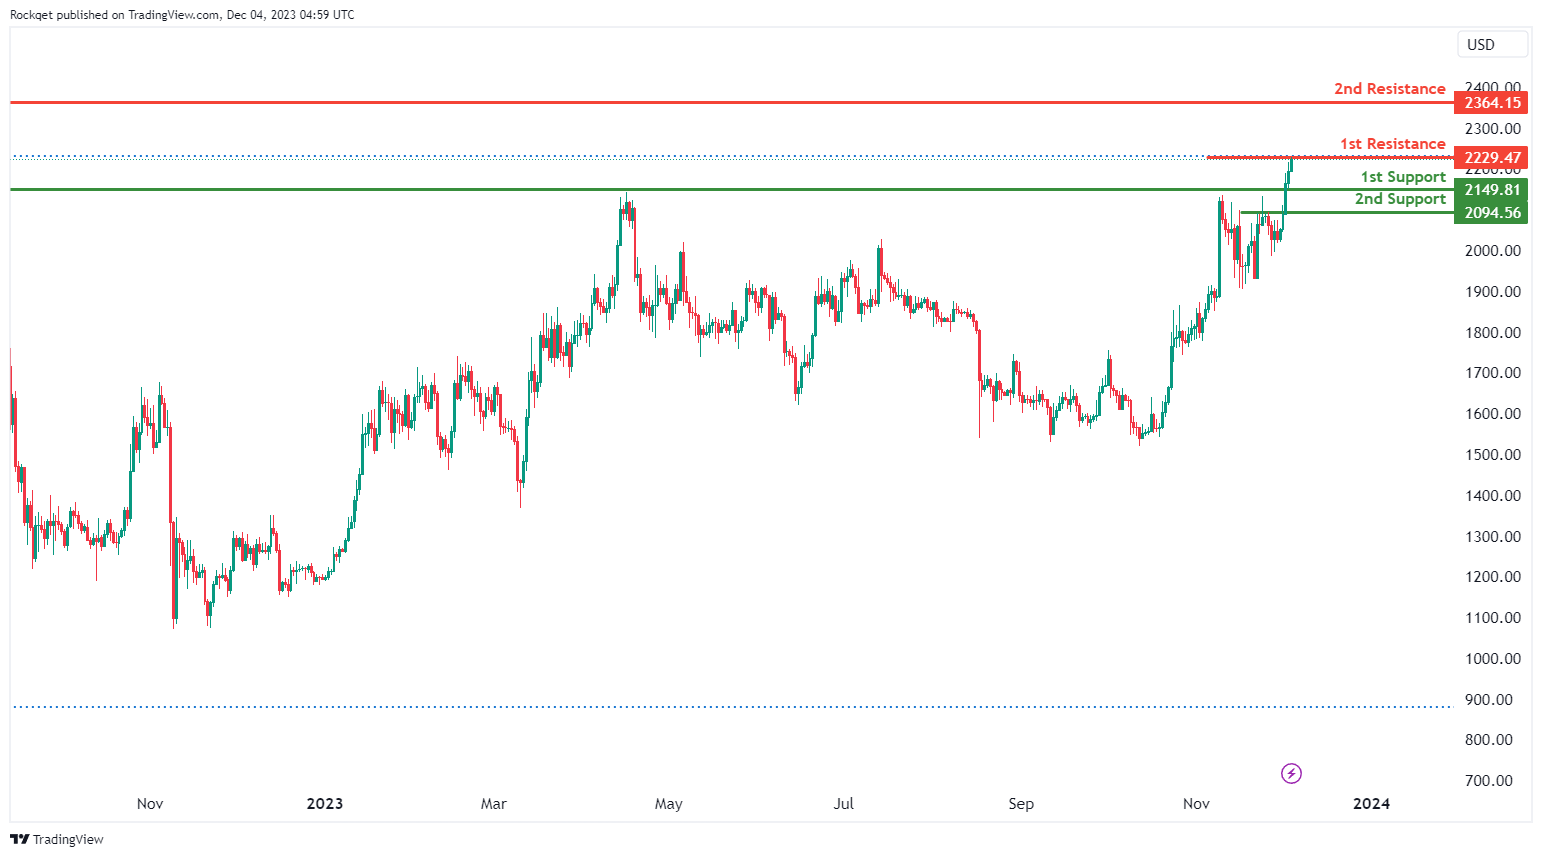
The analyzed instrument is ETH/USD, and the overall momentum of the chart is currently bullish.
There is a potential for the price to make a bullish breakthrough of the 1st resistance and rise to the 2nd resistance.
The 1st support level is identified at 2149.81, and its favorable characteristic is attributed to being a pullback support.
The 2nd support level is situated at 2094.56, and its favorable aspect is derived from also being a pullback support.
On the resistance side, the 1st resistance is positioned at 2229.47, and it is considered significant due to being associated with the 50% Fibonacci Retracement.
The 2nd resistance is located at 2364.15, and its significance is derived from being a pullback resistance.
WTI/USD:
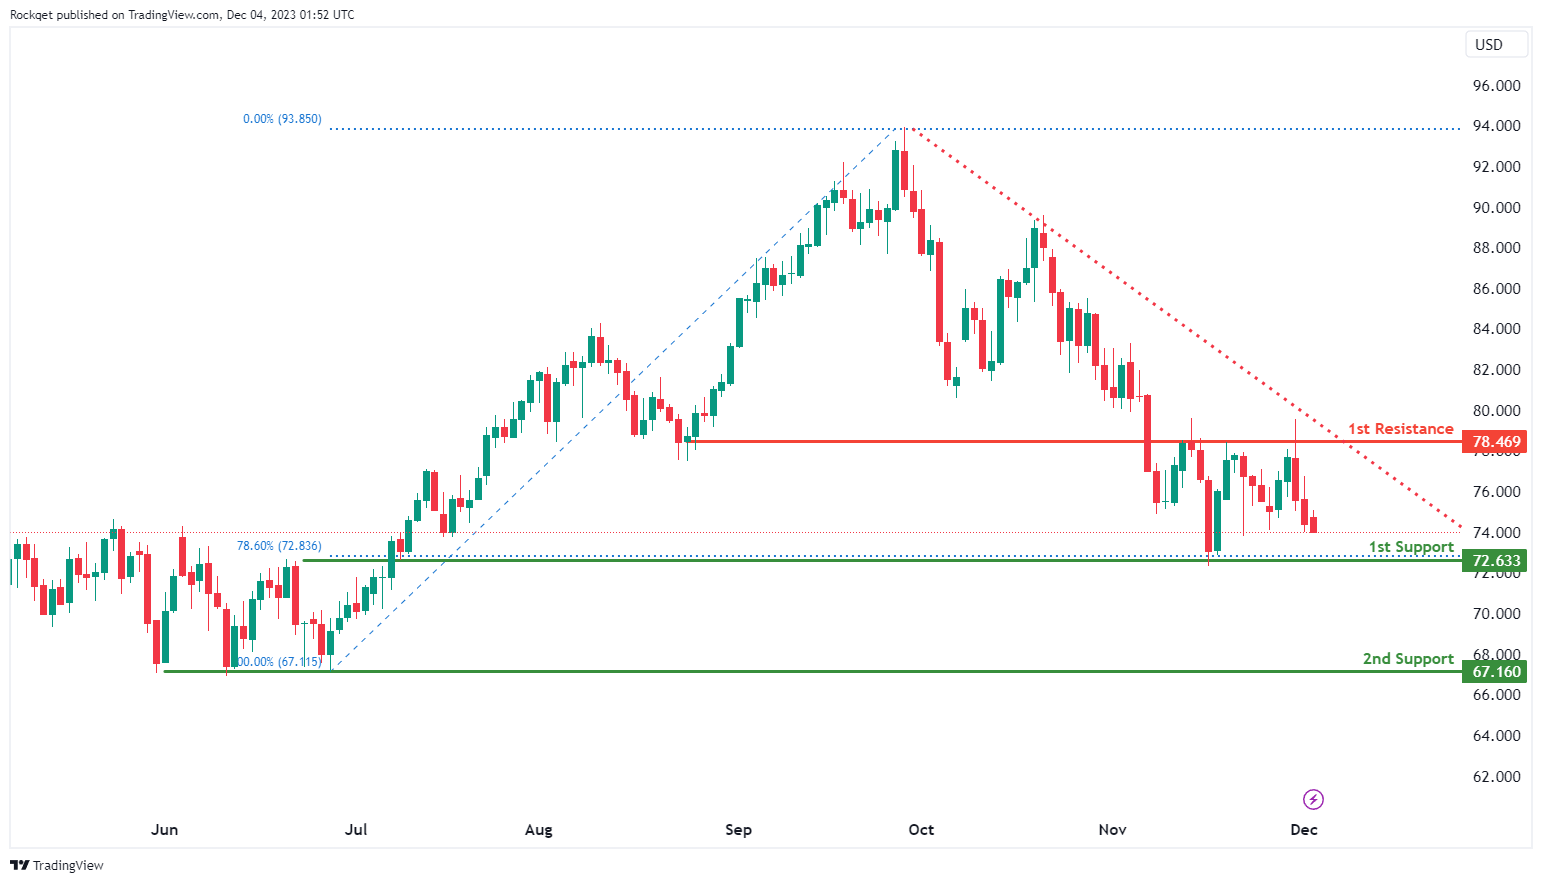
The WTI (West Texas Intermediate) chart currently exhibits a bearish overall momentum, driven by its position below a major descending trend line, indicating a continuation of the bearish sentiment.
The 1st support at 72.63 is identified as a multi-swing low support and coincides with a 78.60% Fibonacci Retracement level, adding significant weight to its role as a crucial support level for WTI.
Furthermore, the 2nd support at 67.16 is another multi-swing low support level, reinforcing its importance in potentially providing support for WTI.
On the resistance side, the 1st resistance at 78.46 is categorized as an overlap resistance, representing a significant barrier where selling interest could intensify, potentially hindering WTI’s upward movement.
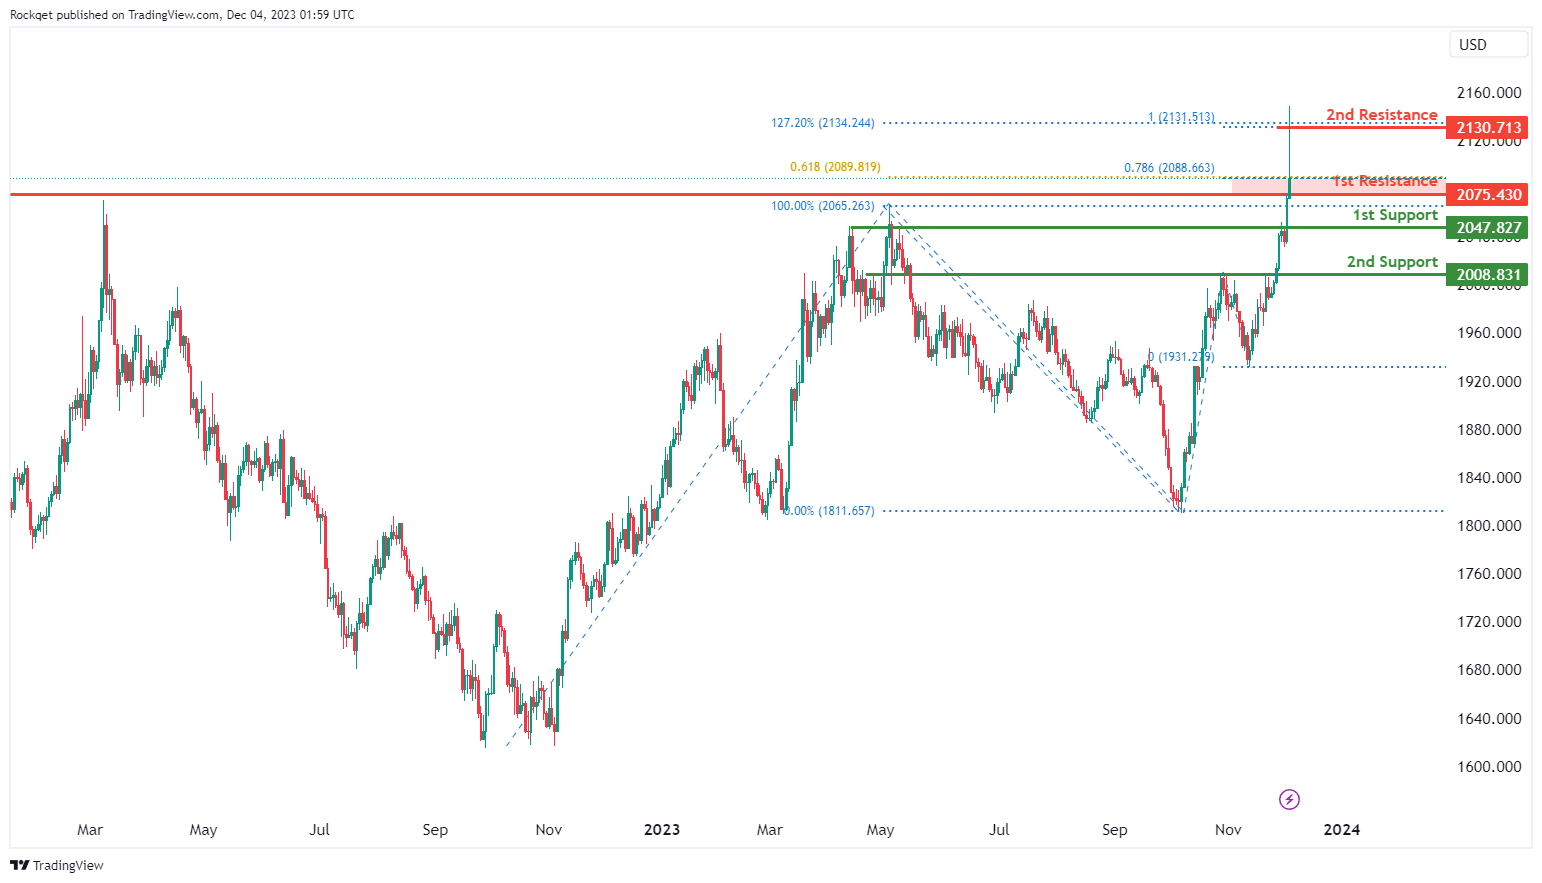
XAU/USD (GOLD):
The XAU/USD (Gold) chart currently maintains a bullish overall momentum, indicating potential price action where it may experience a bullish bounce off the 1st support.
The 1st support at 2047.82 is categorized as a pullback support, signifying its importance as a significant level where buying interest may emerge, potentially providing crucial support for XAU/USD.
Moreover, the 2nd support at 2008.83 is also identified as a pullback support, adding further significance to this support level.
On the resistance side, the 1st resistance at 2075.43 is characterized as a swing high resistance with a 61.80% Fibonacci Projection and a 78.60% Fibonacci Projection, indicating Fibonacci confluence, making it a formidable barrier where selling interest could intensify.
Additionally, the 2nd resistance at 2139.71 is noted for its 127.20% Fibonacci Extension and 100% Fibonacci Projection, further reinforcing its potential as a strong resistance level.
EUR/USD Holds Support But Can It Increase Again?
Key Highlights
- EUR/USD rallied toward 1.1020 before it corrected lower.
- A major bullish trend line is forming with support near 1.0880 on the 4-hour chart.
- GBP/USD is consolidating gains above the 1.2650 level.
- Gold prices surged higher above $2,100 and $2,120.
EUR/USD Technical Analysis
The Euro started a strong increase above the 1.0820 resistance against the US Dollar. EUR/USD even spiked above 1.1000 before the bears appeared.
Looking at the 4-hour chart, the pair above the 1.0850 pivot level, the 100 simple moving average (red, 4 hours), and the 200 simple moving average (green, 4 hours).
A high was formed near 1.1017 before the pair corrected lower. There was a move below the 1.0950 and 1.0920 level. It is now testing the 1.0880 support. There is also a major bullish trend line forming with support near 1.0880 on the same chart.
The next key support is near 1.0825 or the 38.2% Fib retracement level of the upward move from the 1.0516 swing low to the 1.1017 high.
The next key support sits at 1.0765, below which the pair could test the 1.0720 pivot level in the near term. Any more losses might call for a move toward 1.0660.
On the upside, immediate resistance is near the 1.0900 level. The next key resistance is near the 1.0920 level. A close above the 1.0920 zone could open the doors for more upsides. The next stop for the bulls might be 1.1020.
Looking at Gold, there was a strong increase above the $2,100 resistance before the bears appeared and there was a downside correction.
Economic Releases
- ECB's President Lagarde speech.
Surging to new record, can gold maintain momentum towards 2500?
Gold prices reached a new record high today, surpassing 2,110, before experiencing a slight pullback. This surge represents an extension of the recent two-month rally, initially sparked by the Israel-Hamas conflict,which heightened global geopolitical tensions and triggered a flight to safety among investors, bolstering demand for Gold.
The upsurge in gold's value is further fueled by growing expectations of monetary easing by key global central banks. Fed, along some other major global central banks like ECB are anticipated to implement interest rate cuts in the coming year. This speculation is a critical factor in the current Gold price dynamics, as lower interest rates typically decrease the opportunity cost of holding non-yielding assets like Gold, making it more attractive to investors.
Technically, initial resistance is seen at 100% projection of 1810.26 to 2009.26 from 1931.39 at 2130.39. Some consolidations might be seen first, and volatility could be high due to near term profit taking around prior record high of 2074.
Nevertheless, outlook will stay bullish as long as 2009.26 resistance turned support holds, and further rally is expected. Sustained break above 2130.39 will pave the way to 161.8% projection at 2253.37.
However, the broader picture for Gold's long-term trend revolves around whether it can maintain enough buying momentum to reach 100% projection of 1160.17 to 2704.84 from 1614.60 at 2529.27, surpassing 2500 mark. The potential to achieve this ambitious target hinges on whether there will be a global loosening of monetary policy next year and if geopolitical tensions persist or escalate further.
Bitcoin shatters 40K barrier, path to 50K now open?
Bitcoin's surged over the weekend, breaking the 40K barrier for the first time since May 2022, has brought a fresh wave of optimism and focus in the cryptocurrency market. The immediate attention is now on the key level of 41259, a significant Fibonacci projection level. Decisive break through this level could set the stage for a climb through 50K handle.
The surge is largely driven by growing optimism surrounding the approval of Bitcoin ETF by the SEC. Bloomberg's expectation of a batch of such funds gaining SEC approval by January adds to this sentiment. This development signifies a major shift towards mainstream acceptance of Bitcoin, fulfilling a long-awaited milestone for many investors and traders.
Another contributing factor is the anticipated Bitcoin halving event scheduled for May next year. Historically, Bitcoin halvings, which occur every four years, have been associated with bullish market trends. Market participants are eyeing a potential bull run post-halving, with some traders positioning themselves early in anticipation of both the halving and the ETF approval.
Technically, D MACD suggests that Bitcoin is now in a re-acceleration phase. Immediate focus is on 100% projection of 15452 to 31815 from 24896 at 41259. Decisive break there will pave the way to 161.8% projection at 51371 next.
There might be some initial resistance from 41259 to limit upside at the first attempt. Break of 37485 support will bring consolidations in Bitcoin first. But pull back should be contained by 31815 resistance turned support to bring another rally.