Sample Category Title
USD/JPY Mid-Day Outlook
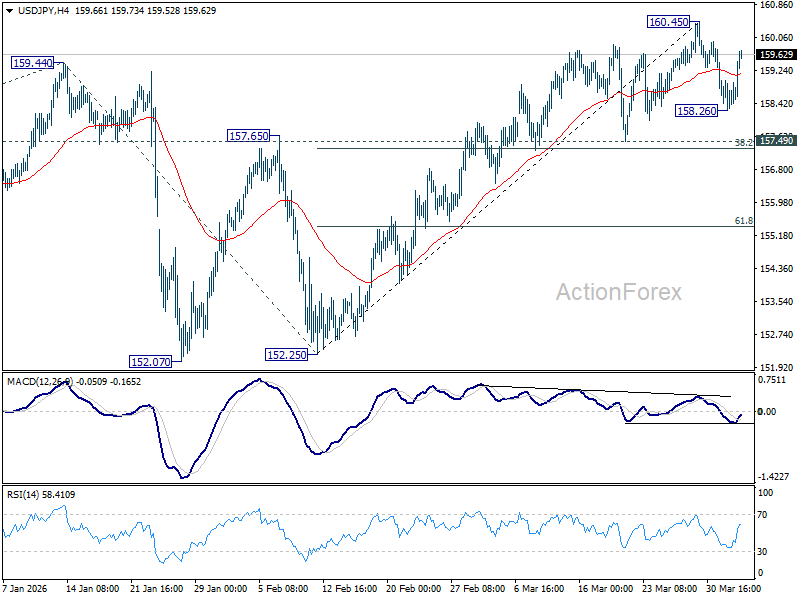
Daily Pivots: (S1) 158.33; (P) 158.67; (R1) 159.12; More...
Range trading continues in USD/JPY and intraday bias remains neutral .Consolidations from 160.45 could extend further with another falling leg. But overall outlook will remain bullish as long as 157.49 cluster support (38.2% retracement of 152.25 to 160.45 at 157.31) holds. Firm break of 160.45 will resume the rise from 152.25 to retest 161.94 high.
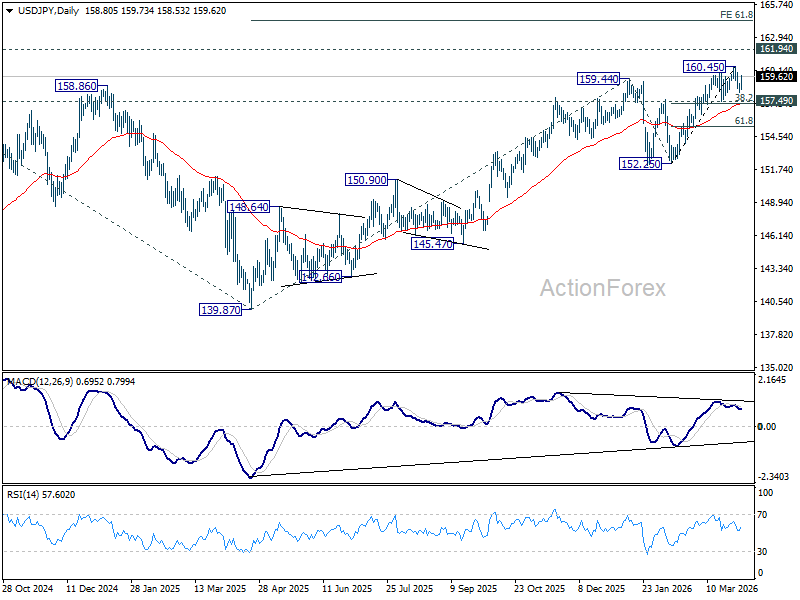
In the bigger picture, outlook is unchanged that corrective pattern from 161.94 (2024 high) should have completed with three waves at 139.87. Larger up trend from 102.58 (2021 low) could be ready to resume through 161.94. This will remain the favored case as long as 55 W EMA (now at 152.97) holds. Firm break of 161.94 will pave the way to 61.8% projection of 102.58 to 161.94 from 139.87 at 176.75.
USD/CHF Mid-Day Outlook
Daily Pivots: (S1) 0.7895; (P) 0.7953; (R1) 0.8001; More….
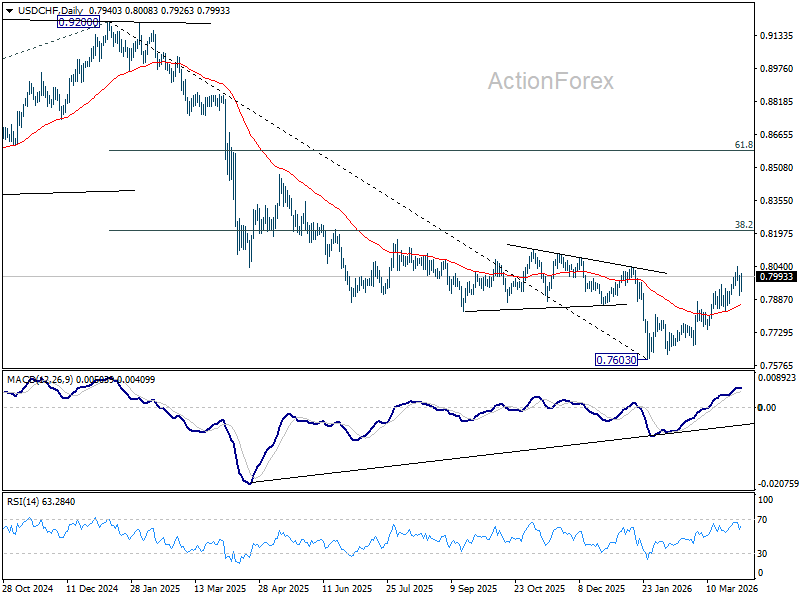
Range trading continues in USD/CHF below 0.8041 temporary top and intraday bias stays neutral. Further rally is expected with 0.7833 support intact. On the upside, break of 0.8041 will resume the whole rally from 0.7603, and target 38.2% retracement of 0.9200 to 0.7603 at 0.8213. However, decisive break of 0.7833 support will argue that the rebound has completed, and turn bias back to the downside for deeper fall.
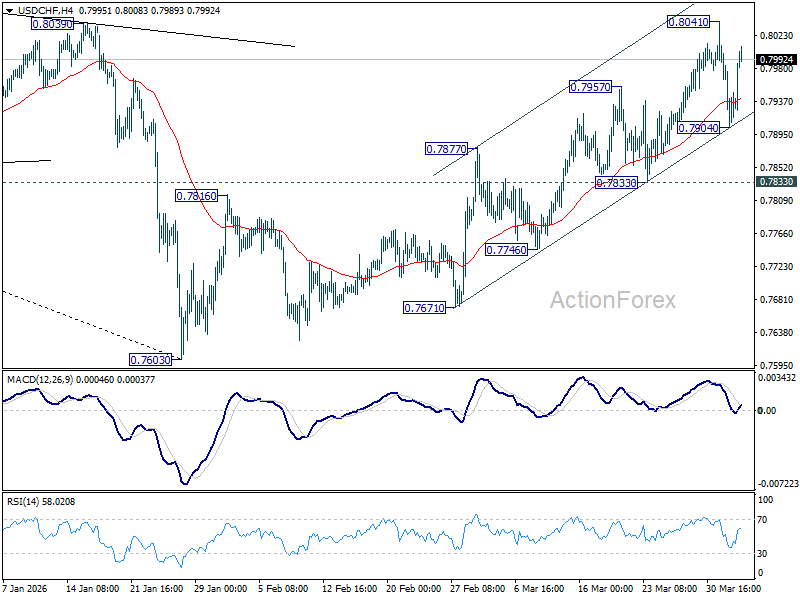
In the bigger picture, a medium term bottom should be in place at 0.7603 on bullish convergence condition in D MACD. Rebound from there is seen as correcting the fall from 0.9200 only. However, decisive break of 55 W EMA (now at 0.8088) will suggest that it's probably correcting the larger scale down trend from 1.0146 (2022 high). On the other hand, rejection by the 55 W EMA will setup down trend resumption to 100% projection of 1.0146 (2022 high) to 0.8332 from 0.9200 at 0.7382 at a later stage.
Brent-WTI Spread Collapse Signals Shift from War Premium to Supply Breakdown
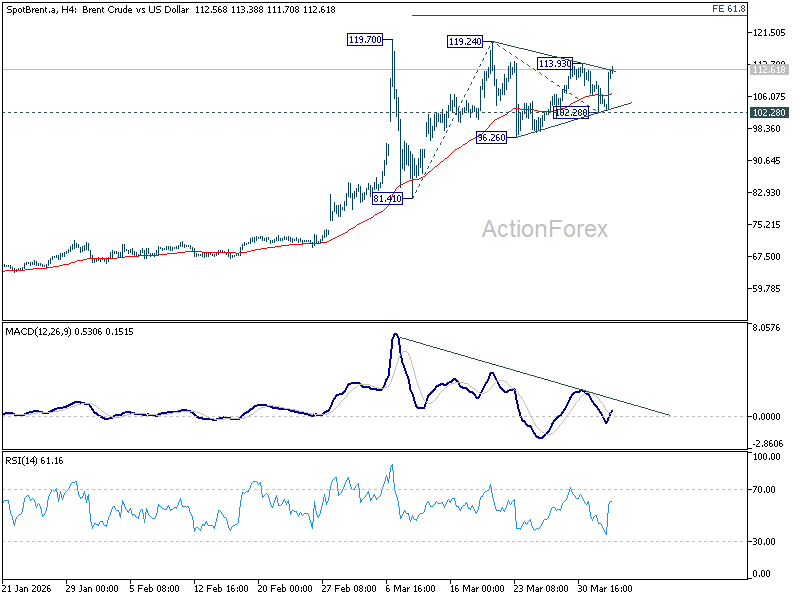
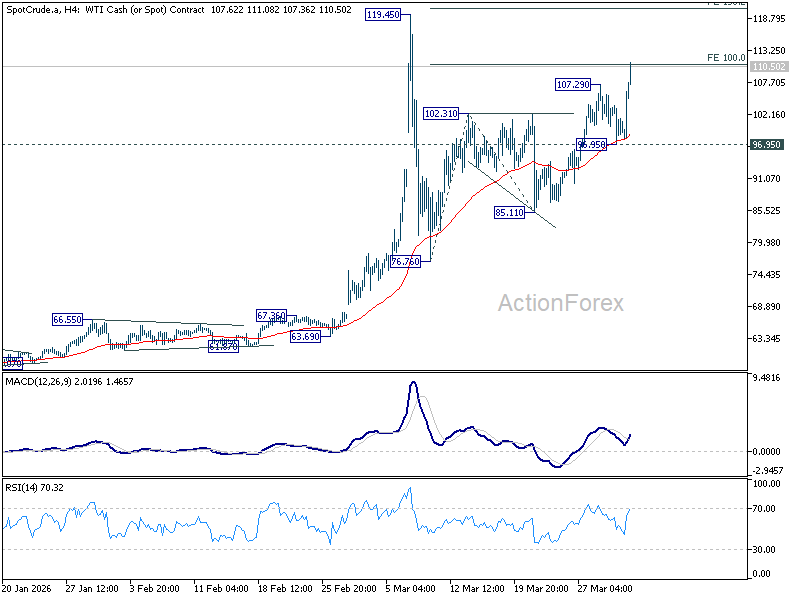
Risk aversion has returned to global markets following US President Donald Trump’s escalation signals on the Iran war, but a more important shift is unfolding in oil markets. While oil prices surged after the address, the internal dynamics are far more telling: Brent is struggling below key resistance at $113.93, while WTI has broken through $107.29 and pushed above $110, driving a sharp collapse in the Brent-WTI spread into what can be described as a "stress signal" zone.
This development suggests that the market could now be pricing a "supply shift", not just a price spike. For the past month, Brent has carried the "war premium" as a regional benchmark for the Middle East conflict. However, the current catch-up play in WTI indicates that traders are beginning to discount the availability of waterborne crude entirely. This is no longer about the cost of oil; it is about the deliverability risk associated with barrels that must transit increasingly contested maritime corridors.
In the past decade, Brent maintains a $3–$6 premium over WTI, reflecting transportation costs and its role as the global seaborne benchmark. This spread has only briefly flipped or hit parity during periods of acute disruption—such as the 2011 US shale bottlenecks and isolated logistical dislocations.
What makes the current episode different is the underlying driver. This is not a demand shock or pipeline bottleneck—it is a "deliverability crisis" in the making. The spread compression is acting as a "stress signal" that markets are beginning to prioritize access and security of supply over geographic benchmarks.
At the core is what can be described as the “safety of the barrel” theory. Brent represents waterborne crude, much of it tied to supply routes vulnerable to disruption in the Strait of Hormuz. In a scenario involving tanker attacks or a full blockade, the value of Brent as a tradable asset becomes uncertain—not just in price, but in physical delivery. Traders holding Brent are not just exposed to price volatility but to the possibility that cargoes cannot be delivered safely or on time. This is fundamentally different from traditional war premium pricing.
By contrast, WTI could be increasing treated as the "safe supply" benchmark. US crude, produced and stored domestically, is insulated from direct geopolitical disruption in the Middle East. As a result, traders are rotating into WTI as triggered by positioning ahead of potential weekend escalation. With Trump signaling an intensified campaign that would bring Iran back to "Stone Age", and markets heading into a long weekend, traders are front-running massive weekend disruption. The logic is straightforward: if supply routes are hit while markets are closed, the scramble for alternative supply will begin immediately.
In such a scenario, global buyers—particularly in Asia—would pivot toward US exports, driving demand for WTI-linked barrels. The result would be further spread compression, and potentially a full inversion where WTI trades above Brent. If that flip on spread occurs, it would mark a profound shift in market structure. It would signal that oil is no longer being priced based on origin, but on security and deliverability. In effect, WTI would replace Brent as the global reference for “reliable” supply.
An even more extreme scenario cannot be ruled out. If WTI were to break above 120 ahead of Brent, it would indicate that the crisis has moved beyond regional disruption into a global supply breakdown. This would suggest that US spare capacity—the world’s safety valve—is being overwhelmed too. In that case, the implications would be severe. The global oil market would lose its stabilizing anchor, raising the risk of a systemic energy shock reminiscent of past crises. The current spread compression may therefore be more than a technical move—it may be an early warning of deeper structural stress.
In the currency markets, Dollar is currently the best performer for the day so far, followed by Loonie, and then Yen. Aussie is the worst, followed by Kiwi, and then Sterling. Euro and Swiss Franc are positioning in the middle.
In Europe, at the time of writing, FTSE is down -0.72%. DAX is down -2.59%. CAC is down -1.54%. UK 10-year yield is up 0.083 at 4.859. Germany 10-year yield is up 0.060 at 3.049. Earlier in Asia, Nikkei fell -2.38%. Hong Kong HSI fell -0.70%. China Shanghai SSE fell -0.74%. Singapore Strait Times fell -0.57%. Japan 10-year JGB yield rose 0.091 to 2.395.
US Jobless Claims Fall to 202k, Labor Market Remains Tight
US jobless claims fell to 202k, beating expectations and signaling a still-tight labor market. While continuing claims edged higher, the broader trend remains stable, pointing to resilience in employment conditions. Read more.
Swiss CPI Rises to 0.3% yoy, But Underlying Inflation Stays Soft
Swiss inflation remained subdued in March, with CPI missing expectations and core prices flat. While imported costs rose on higher energy prices, weak domestic inflation continues to cap overall price pressures. Read more.
USD/CHF Mid-Day Outlook
Daily Pivots: (S1) 0.7895; (P) 0.7953; (R1) 0.8001; More….
Range trading continues in USD/CHF below 0.8041 temporary top and intraday bias stays neutral. Further rally is expected with 0.7833 support intact. On the upside, break of 0.8041 will resume the whole rally from 0.7603, and target 38.2% retracement of 0.9200 to 0.7603 at 0.8213. However, decisive break of 0.7833 support will argue that the rebound has completed, and turn bias back to the downside for deeper fall.
In the bigger picture, a medium term bottom should be in place at 0.7603 on bullish convergence condition in D MACD. Rebound from there is seen as correcting the fall from 0.9200 only. However, decisive break of 55 W EMA (now at 0.8088) will suggest that it's probably correcting the larger scale down trend from 1.0146 (2022 high). On the other hand, rejection by the 55 W EMA will setup down trend resumption to 100% projection of 1.0146 (2022 high) to 0.8332 from 0.9200 at 0.7382 at a later stage.
US Jobless Claims Fall to 202k, Labor Market Remains Tight
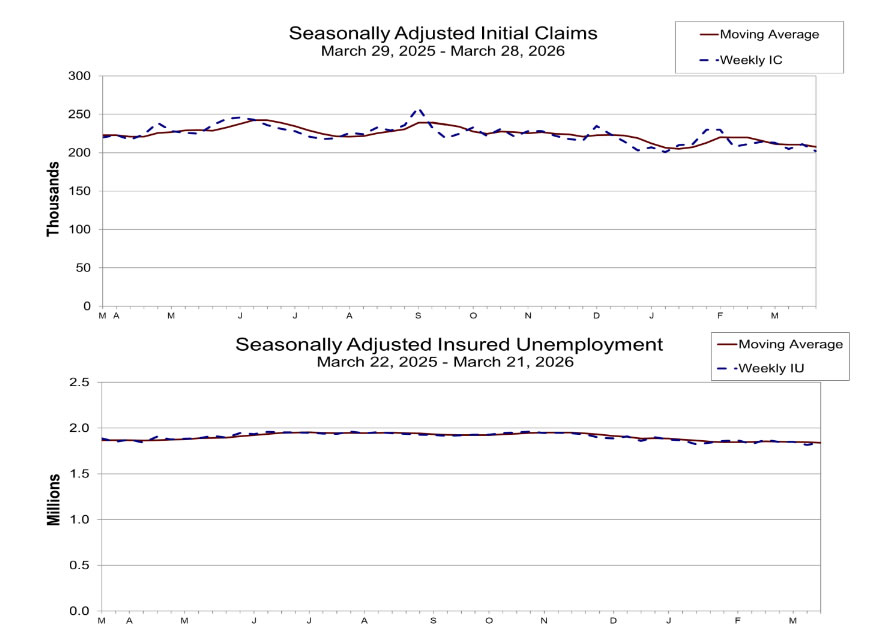
US initial jobless claims fell -9k to 202k in the week ending March 27, coming in below expectations of 215k and reinforcing the picture of a still-tight labor market. The four-week moving average also declined -3k to 207.75k.
However, continuing claims painted a slightly softer picture, rising 25k to 1.841m in the week ending March 21. This suggests that while layoffs remain limited, it is taking slightly longer for displaced workers to find new employment.
Still, the broader trend remains constructive. The four-week average of continuing claims fell -7.5k to 1.839m, the lowest level since late September 2024.
USD/JPY – Yen Weakens Amid Geopolitical Uncertainty
USD/JPY rose to 159.39 on Thursday, as the yen weakened amid conflicting signals from Donald Trump on a possible de-escalation of the Middle East conflict. The situation continues to support the US dollar while weighing on the yen.
The US currency strengthened following reports that the operation in Iran is “close to completion” and could achieve its goals in the coming weeks. However, these statements were accompanied by warnings of a potential escalation in hostilities. At the same time, Trump emphasised that diplomatic contacts are ongoing, keeping investors cautious and maintaining heightened attention to geopolitical risks.
For Japan, the situation remains sensitive: the country relies heavily on oil imports from the Middle East, and fuel prices reached record levels in March, although they have since eased slightly supported by government subsidies.
New Bank of Japan board member Toichiro Asada has signalled a preference for a cautious, data-driven approach. He joins the council ahead of the 27–28 April meeting, where markets currently price in a probability of a rate hike at approximately 70%.
Technical Analysis
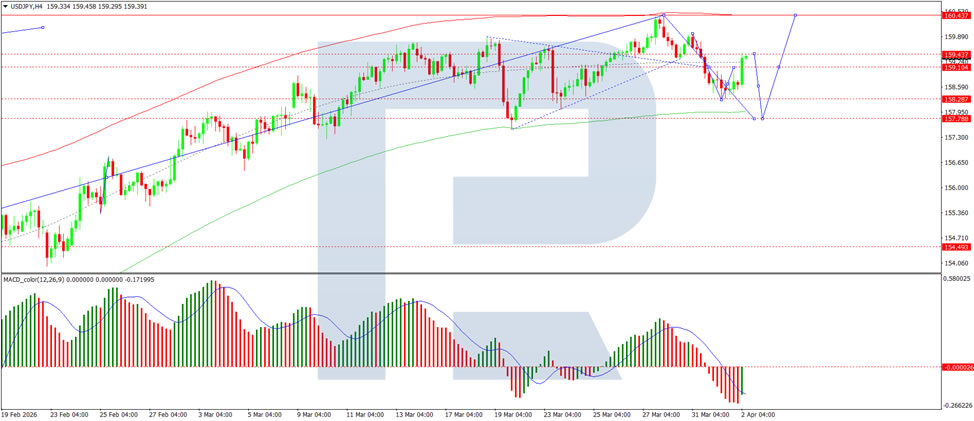
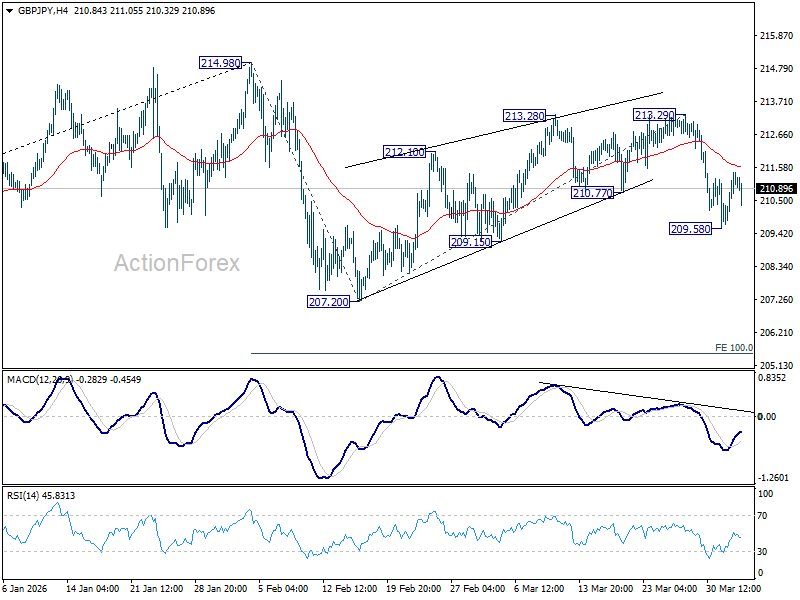
On the H4 chart, USD/JPY is forming a consolidation range around 159.10. The range is expected to expand to 159.50 today, followed by a decline to 157.70. An upside breakout could lead to a correction to 160.40, after which a new downward impulse to 157.70 is anticipated, with the prospect of a continued move towards 156.00. The MACD indicator confirms this scenario, with its signal line below zero and pointing firmly downwards, supporting the potential for the downtrend to continue.
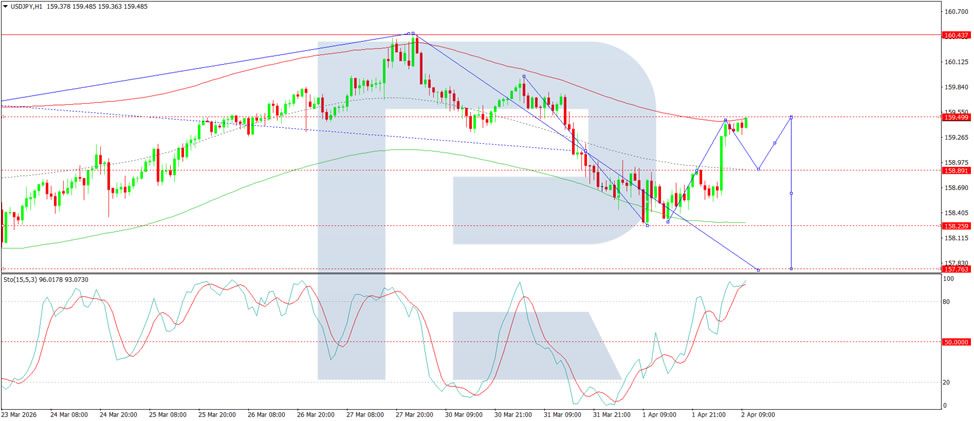
On the H1 chart, the market is forming an advance towards 159.50 and is likely to reach the target today. Following this, a downward wave to 157.70 (testing from below) is possible. The Stochastic oscillator confirms this structure, with its signal line above 80 and pointing firmly downwards, indicating continued short-term downside potential.
Conclusion
USD/JPY remains in positive territory, with conflicting signals from the US over Middle East de-escalation creating an uncertain backdrop that favours the dollar over the yen. While reports of progress in the Iran operation have supported the greenback, ongoing diplomatic contacts and warnings of escalation keep markets on edge. Japan's sensitivity to oil price fluctuations adds to yen pressure, although government subsidies provide partial relief. With a new BoJ board member advocating a cautious approach and markets pricing in a 70% probability of a rate hike at the April meeting, the yen's near-term trajectory will likely depend on both geopolitical developments and upcoming policy signals from Tokyo. Technical indicators point to a possible short-term correction lower.
Dollar Has Regained Upper Hand
- Following Trump’s speech, markets are bracing for an escalation over Iran.
- Japan’s failure with currency interventions could push USDJPY to 175.
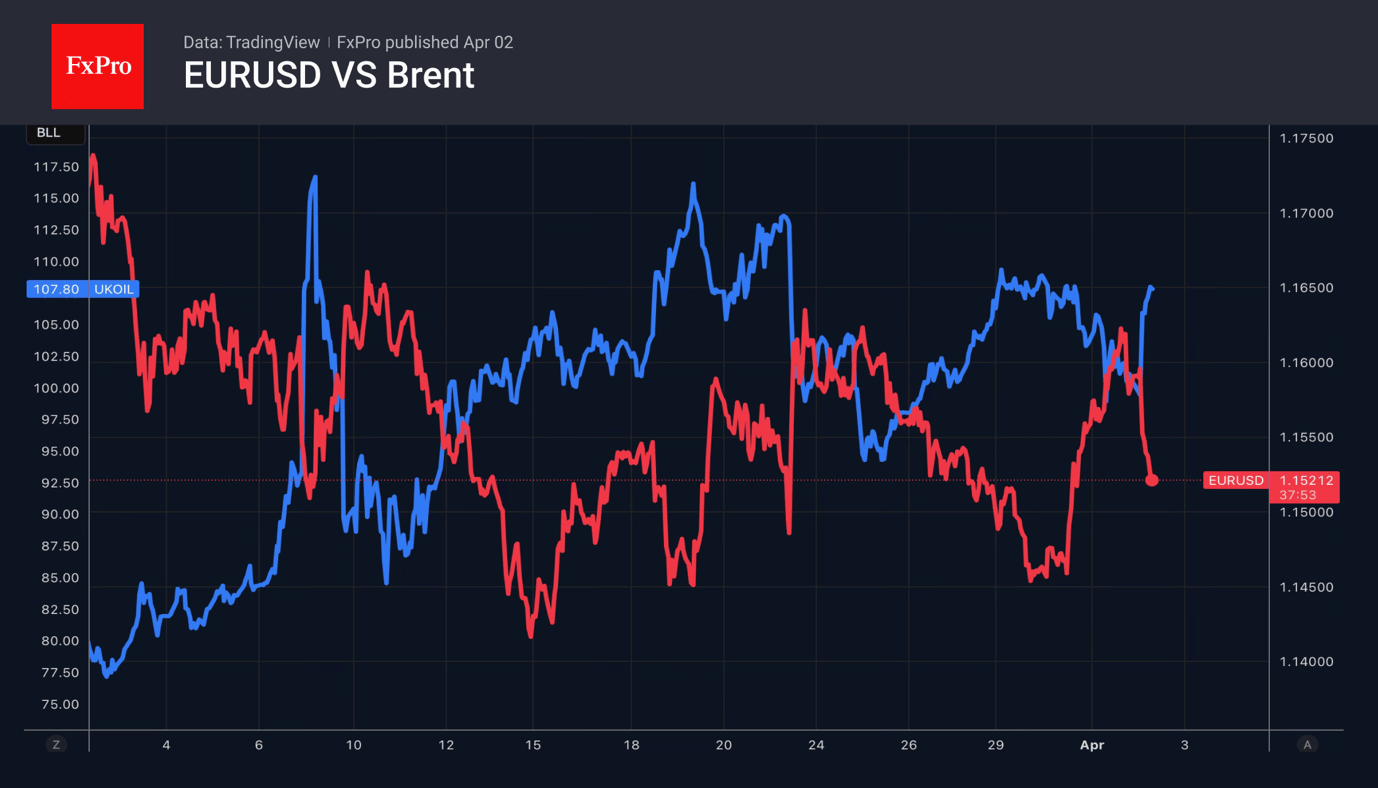
The US dollar quickly recouped its losses thanks to Donald Trump’s comments. He threatened Iran with air strikes on its energy infrastructure if the Strait of Hormuz is not opened. The promise to send Iran back to the Stone Age contrasted with his previous statement about ending the conflict within 2–3 weeks amid successful negotiations. This caused EURUSD to plummet after the rally of the previous two days.
Polymarket participants estimate the chances of the war between the US and Iran ending by the end of June at 65%. A closure of the Strait of Hormuz before then would be a real disaster for the global economy. The IEA warns that the oil market deficit will continue to widen. In March, the market remained stable due to the supply from February. However, in April, conditions risk deteriorating rapidly, suggesting that additional releases from strategic reserves may be required.
The euro is gradually losing its key support from expectations of aggressive monetary tightening. Investors are beginning to question the ECB’s past decisions. Was the biggest mistake in 2022, when it underestimated the inflationary impact of the energy crisis, or in 2011, when it raised rates in response to rising prices? That earlier tightening weakened the eurozone economy and ultimately forced the ECB to cut rates more aggressively than before.

Growing risks of a conflict escalation in the Middle East have halted the USDJPY correction and handed the initiative to the bulls. UBS forecasts that the US dollar will rise to ¥175 by the end of the year. A surge in Brent to $150 per barrel will render Japan’s currency interventions ineffective. The Ministry of Finance’s spending will merely create more favourable entry points for speculators to sell the yen. As a result, Sanae Takaichi will begin to curb inflation through fiscal measures. This will signal to hedge funds that the government is no longer concerned about USDJPY. They will step up their purchases of the pair.
Gold took a hit following disappointment with Donald Trump’s rhetoric. The precious metal failed to hold $4,800 and is set to return to March lows amid central banks, led by the Fed, keeping interest rates at high levels for an extended period. India has begun to defend its currency against depreciation by selling US Treasury bonds and continuing to accumulate gold. At the very least, this provides some support for gold. However, India may very soon follow Turkey’s lead by selling off its metal reserves.
Crypto Market Has Lost 3% But Has Not Broken Through Support
Market Overview
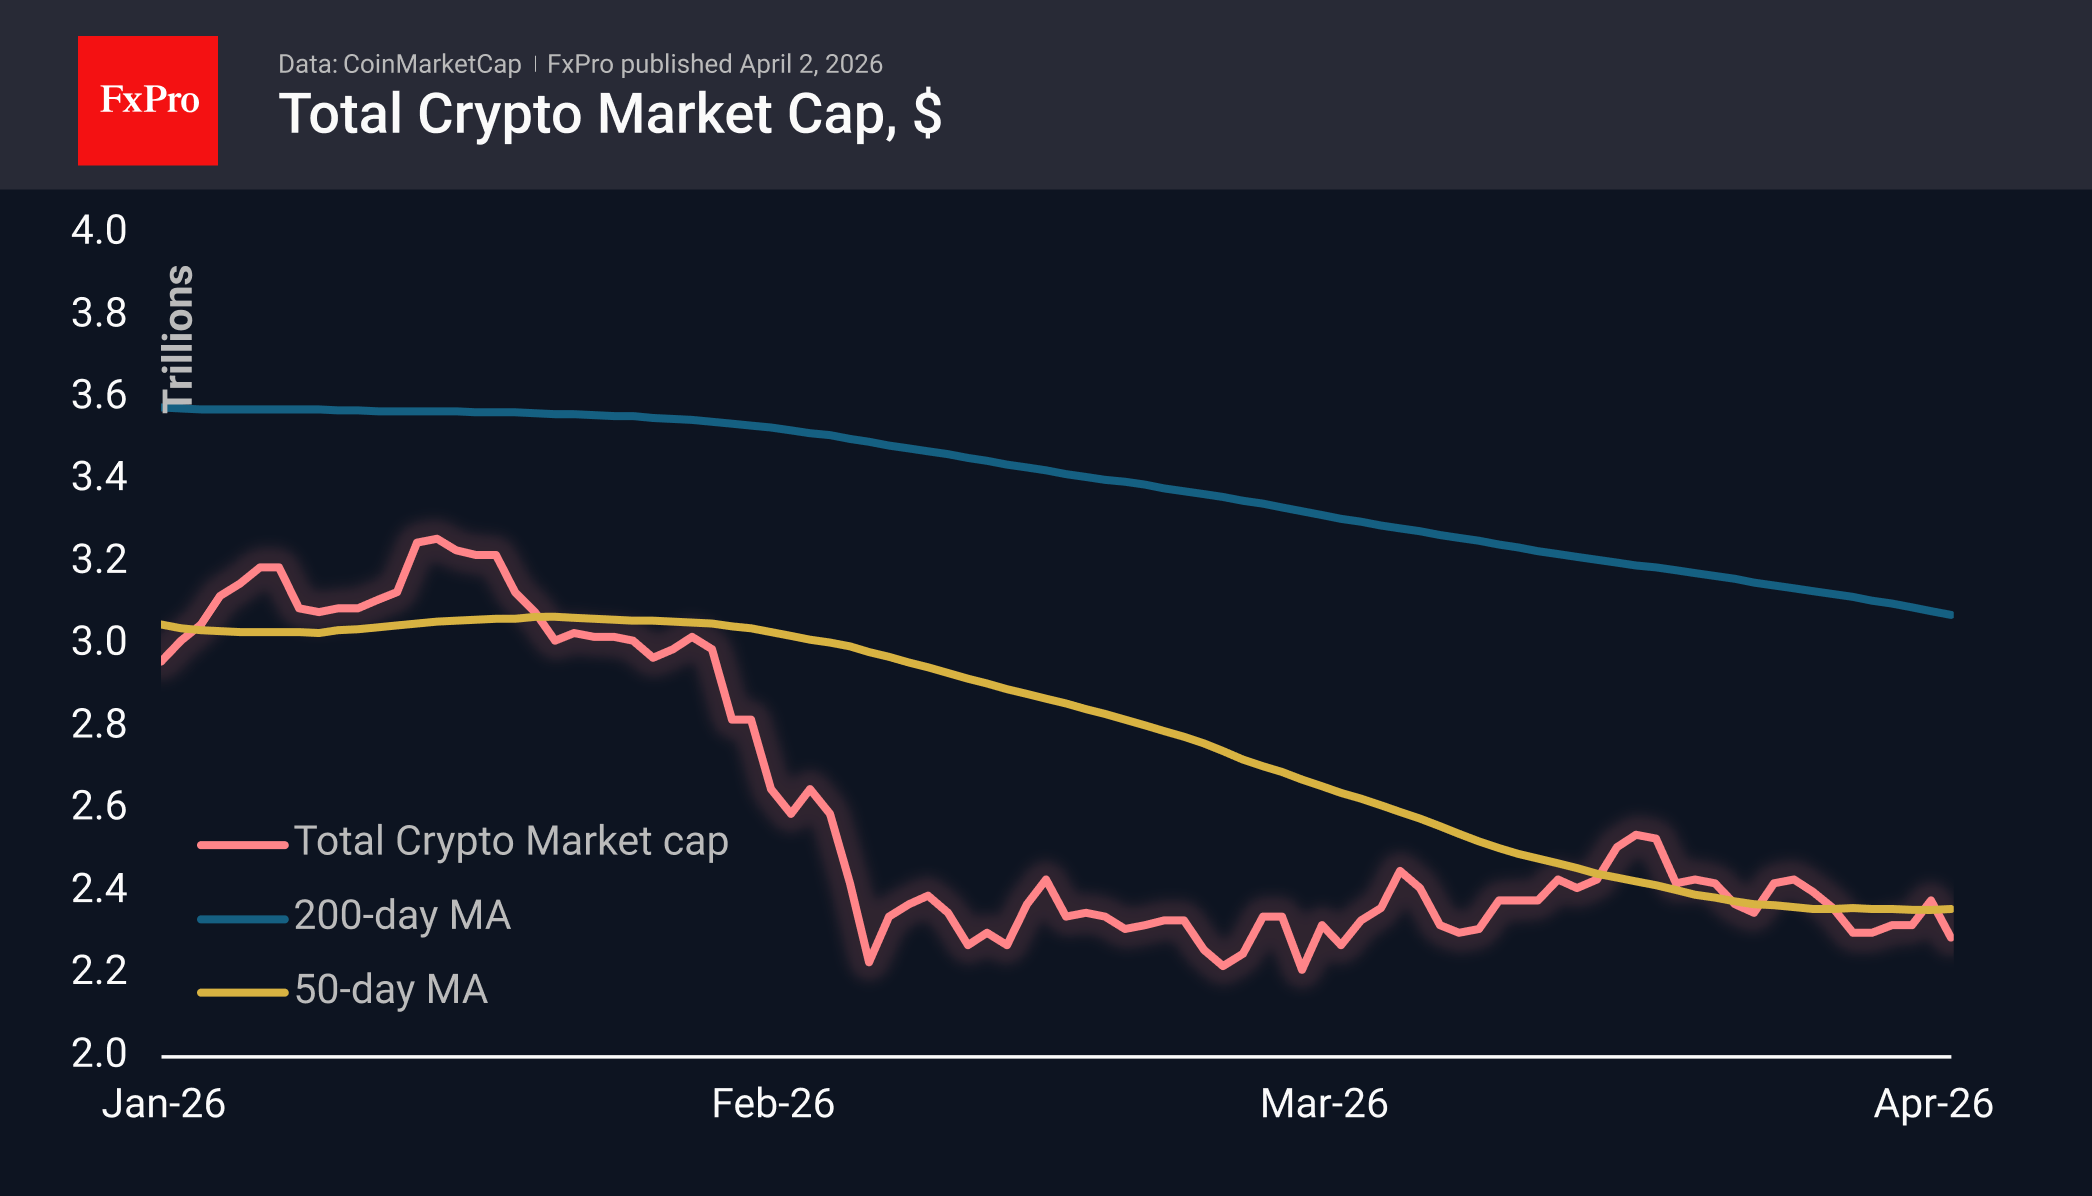
The crypto market has lost approximately 3% of its market capitalisation, falling back to $2.29T and returning to the lower boundary of the trading range seen over the last seven days. Trump’s latest comments on the war with Iran triggered a sharp sell-off amid a lack of de-escalation signs. TRON (−0.2%), Toncoin (−0.9%) and Neo (−1.3%) appear relatively stable. Dash (−8.6%), Uniswap (−8.0%) and Solana (−5.9%) have been hit hardest.
The Fear and Greed Index rose by 4 points today to 12, partially recovering from yesterday’s drop to 8 — the lowest level in recent weeks. Nevertheless, the index remains deep in the extreme fear zone, where it has been virtually uninterrupted for the past month.
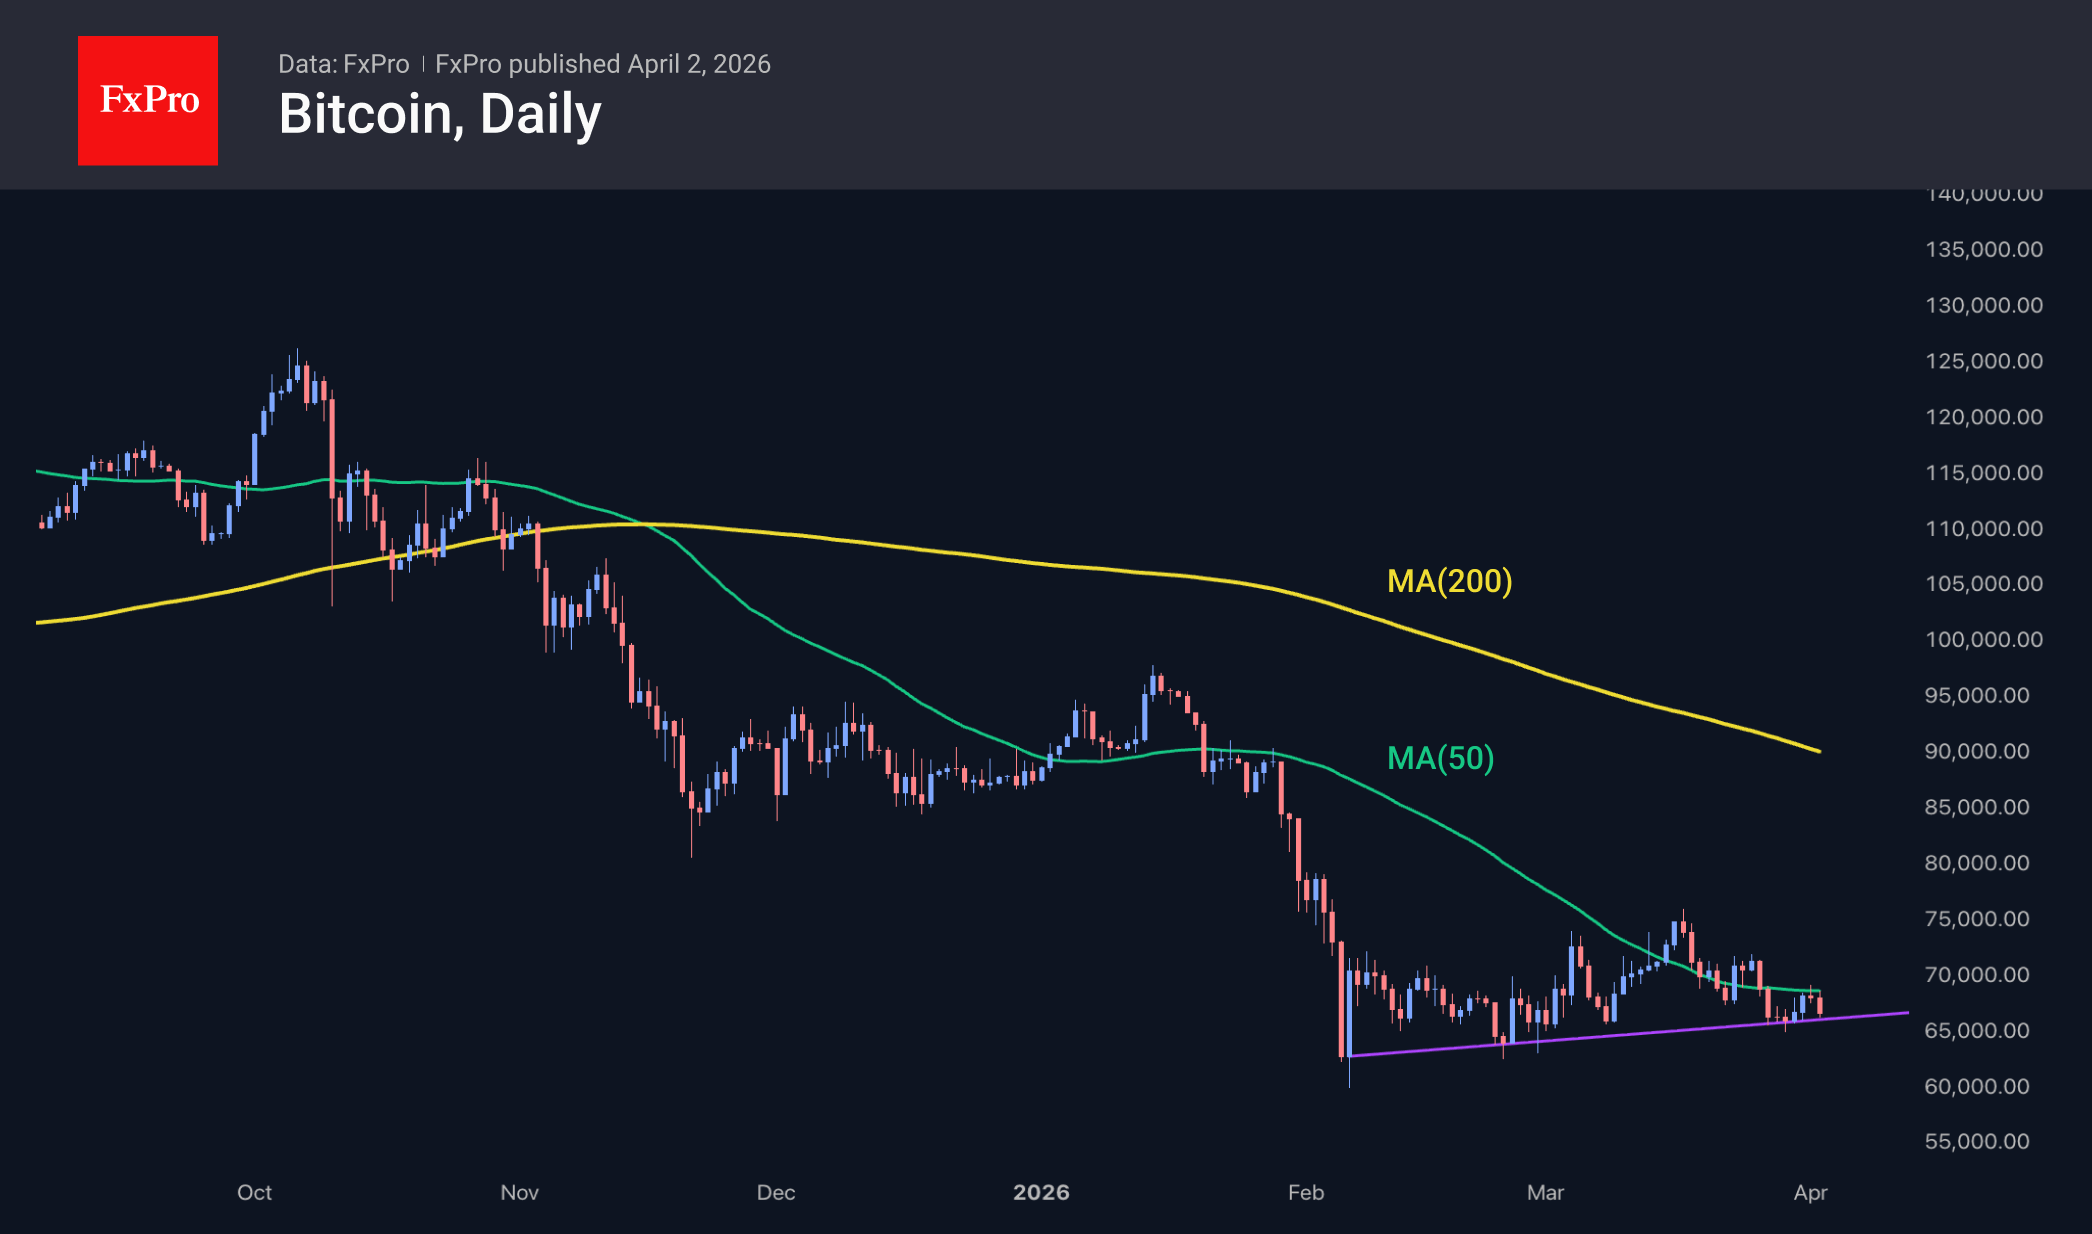
Bitcoin lost 2.8% over the day, returning to levels near $66.2K. Once again, the 50-day moving average acted as resistance, preventing the price from consolidating above it. The leading cryptocurrency quickly swung to the other extreme and is now testing the support of the uptrend. Key support ($66K) and resistance ($69K) levels are converging, bringing the moment of a definitive trend decision closer.
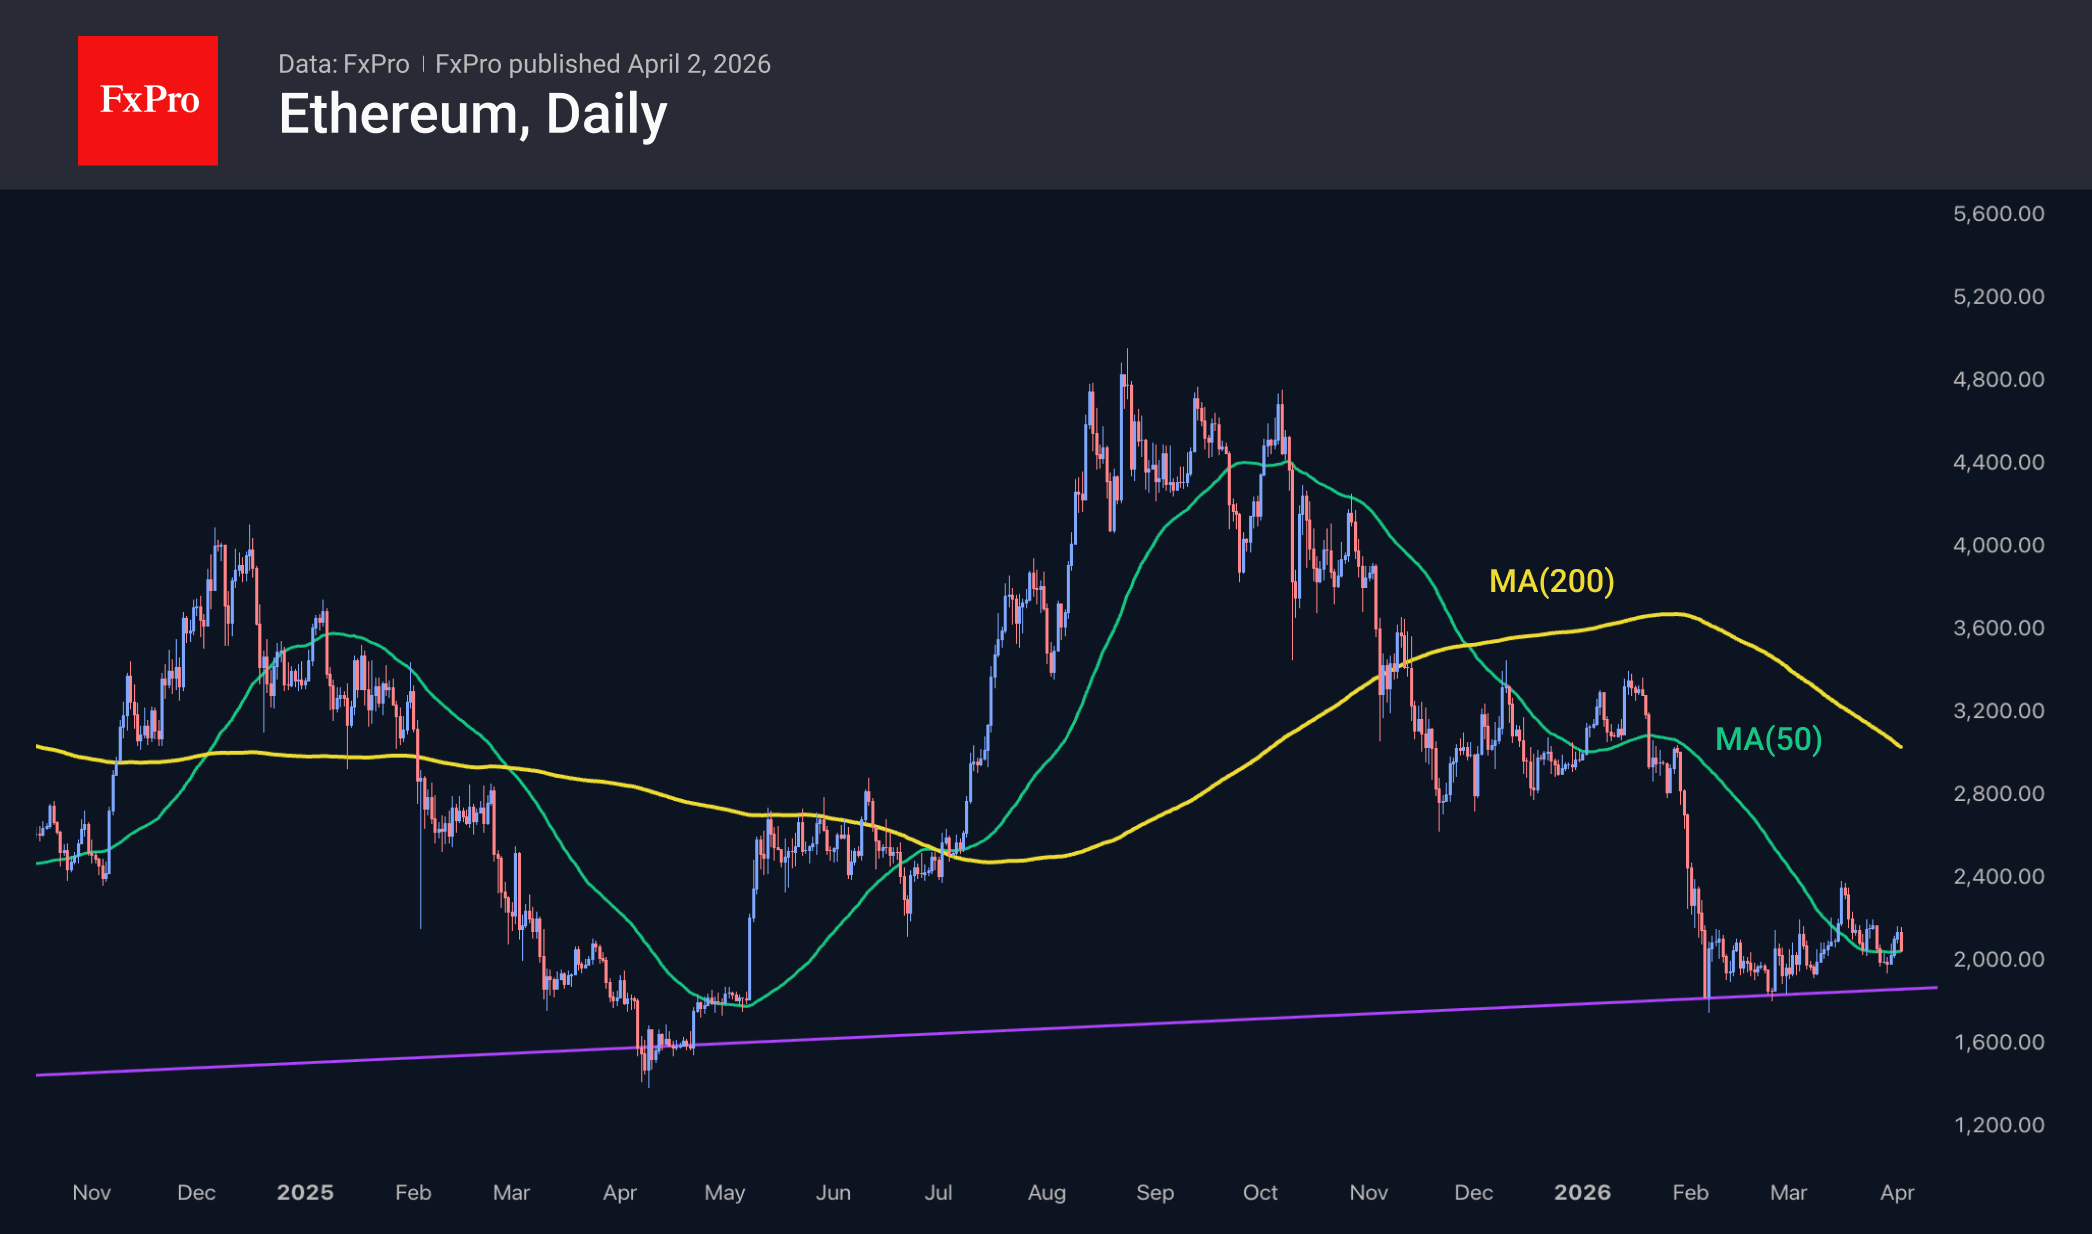
Ethereum looks slightly more confident, remaining above the $2K round figure, above the 50-day MA and the support line of the multi-year trend. Should pressure on the crypto market intensify, it will be worth monitoring whether the second-largest cryptocurrency can hold above $1.8K. A break below this level would be a significant bearish signal, potentially triggering sell-offs across a wider range of coins and bringing an end to the crypto market’s recent resilience to external threats.
News Background
The fall in Bitcoin during the current market cycle has been significantly less severe than in previous periods, notes Fidelity Digital Assets. While February saw a potential bottom for the current cycle around $60K, this represents a decline of just 52% from the peak, rather than 80–90% as previously seen.
The gap between BTC’s spot and realised prices has narrowed from 120% at the end of 2024 to the current 21%, CryptoQuant points out. However, the asset needs to fall a further 20% to reach the accumulation zone where bottoms have historically formed. Other on-chain signals also indicate that the decline is not yet over.
Canadian mining company Bitfarms has announced a change in strategy and a rebrand under the new name Keel Infrastructure. The company plans to relocate its headquarters to the US and focus on developing infrastructure for artificial intelligence.
The CLARITY Act, a bill on the structure of the crypto market, is unlikely to be passed, as the US Senate will fail to secure the necessary number of votes, said Anthony Scaramucci, managing partner at SkyBridge Capital. According to him, the key obstacle remains the requirement to secure the support of at least 60 senators.
GBP/JPY Daily Outlook
Daily Pivots: (S1)210.26; (P) 210.88; (R1) 211.92; More...
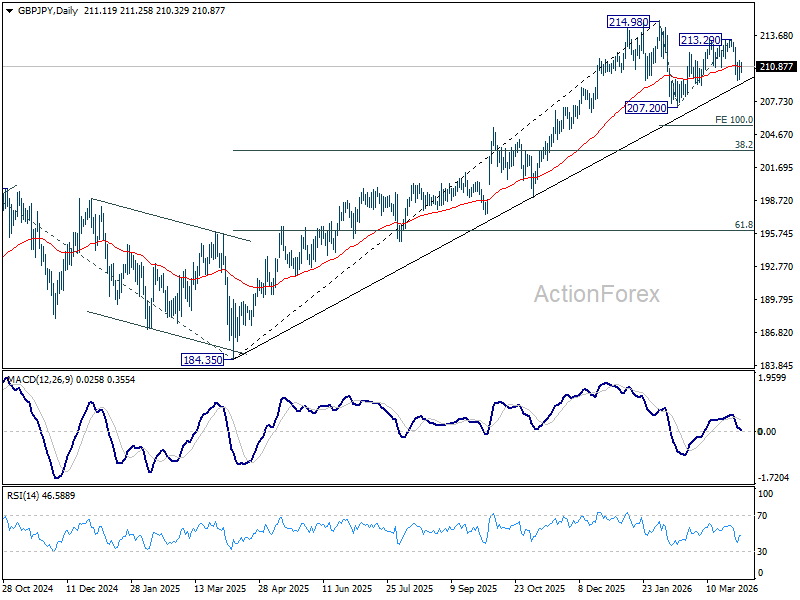
Intraday bias in GBP/JPY is turned neutral with current recovery, and some consolidations could be seen. Risk will stay on the downside as long as 213.29 resistance holds. Corrective pattern from 214.98 should be in the third leg. Brea of 209.15 will target 207.20 and below.
In the bigger picture, up trend from 123.94 (2020 low) is still in progress. Firm break of 214.98 will target 61.8% projection of 148.93 (2022 low) to 208.09 (2024 high) from 184.35 at 220.90. This will remain the favored case as long as 55 W EMA (now at 203.13) holds, even in case of another deep pullback.
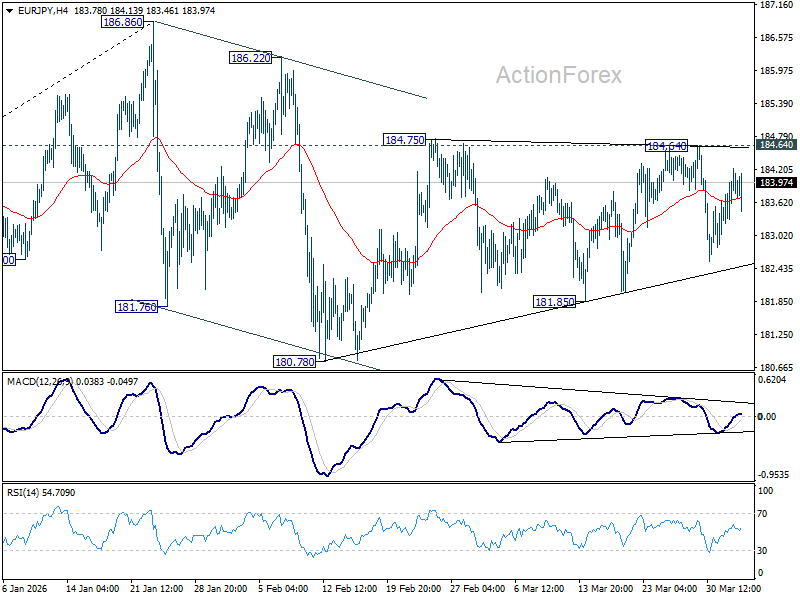
EUR/JPY Daily Outlook
Daily Pivots: (S1) 183.48; (P) 183.89; (R1) 184.48; More...
Intraday bias in EUR/JPY stays neutral as sideway trading continues. On the downside, firm break of 181.85 support should confirm that the correction from 186.86 is already in the third leg. Deeper fall should be seen to 180.78 and below. For now, risk will stay on the downside as long as 184.86 resistance holds.
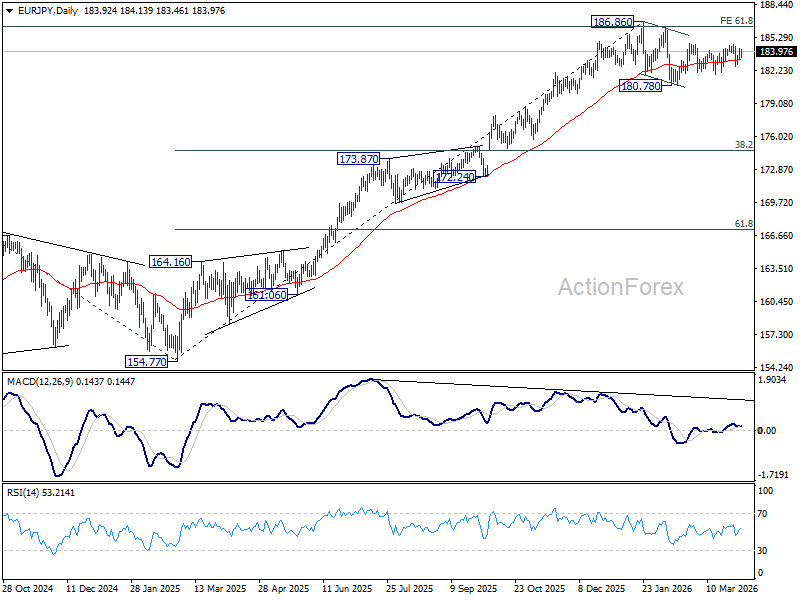
In the bigger picture, a medium term top could be in place at 186.86 and some more consolidations would be seen. Nevertheless, as long as 55 W EMA (now at 175.93) holds, the larger up trend from 114.42 (2020 low) remains intact. Firm break of 186.86 will pave the way to 78.6% projection of 124.37 (2022 low) to 175.41 (2025 high) from 154.77 at 194.88 next.
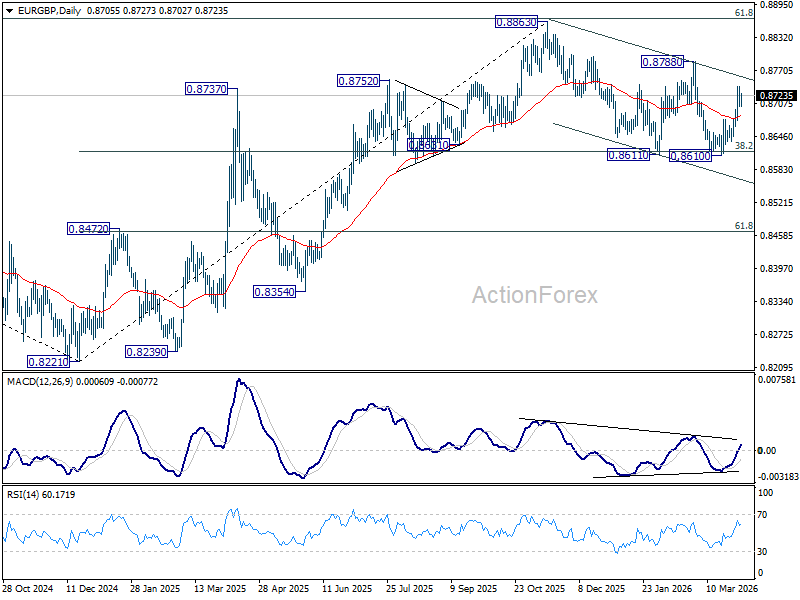
EUR/GBP Daily Outlook
Daily Pivots: (S1) 0.8696; (P) 0.8720; (R1) 0.8737; More…
Intraday bias in EUR/GBP is turned neutral first with current retreat, and further rally remains in favor. On the upside, above 0.8740 will resume the rebound from 0.8610 short term bottom to 0.8788 resistance next. However, break of 0.8675 will bring retest of 0.8610 low instead.
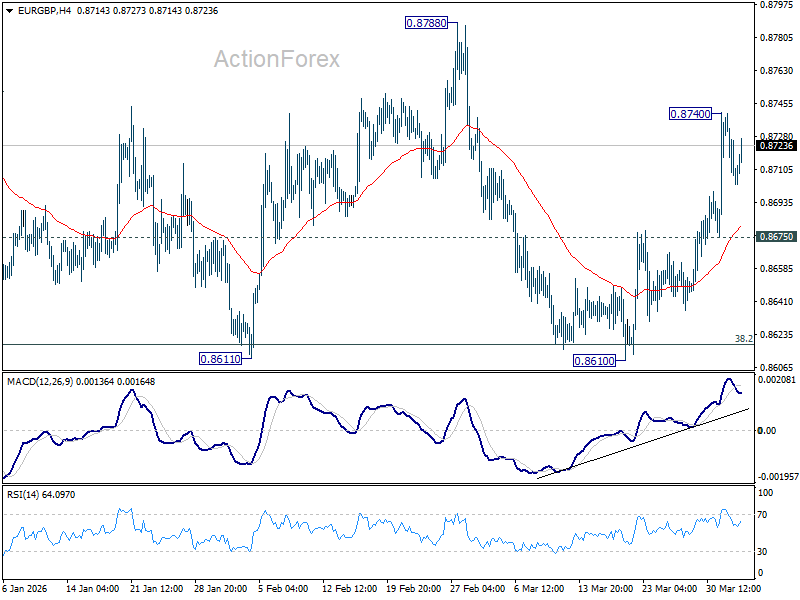
In the bigger picture, strong support was seen again from 38.2% retracement of 0.8821 to 0.8863 at 0.8618. Break of 0.8788 resistance will argue that larger rise from 0.8221 might be resume to resume through 0.8863. Nevertheless, sustained trading below 0.8618 should confirm reversal, and bring deeper fall to 61.8% retracement at 0.8466 at least.