Sample Category Title
Oil Surges to a New High of the Year
As the chart shows, the day before yesterday, a barrel of WTI cost USD 87.87, but this morning, the price exceeded the level of USD 93. That is, the growth was more than 6% in just 2 days.
The main driver of such growth remains the voluntary reduction in oil production by OPEC+ countries. Added to this was the market's reaction to yesterday's news about the reduction in oil reserves in the United States (expected = -0.7 million barrels, actual = -2.2 million). Inventories are approaching historical lows, according to Reuters. Probably, the US authorities, by releasing oil from storage, are trying to reduce the impact of its high price on inflation, but the graph shows that these efforts are unlikely to give the desired result.
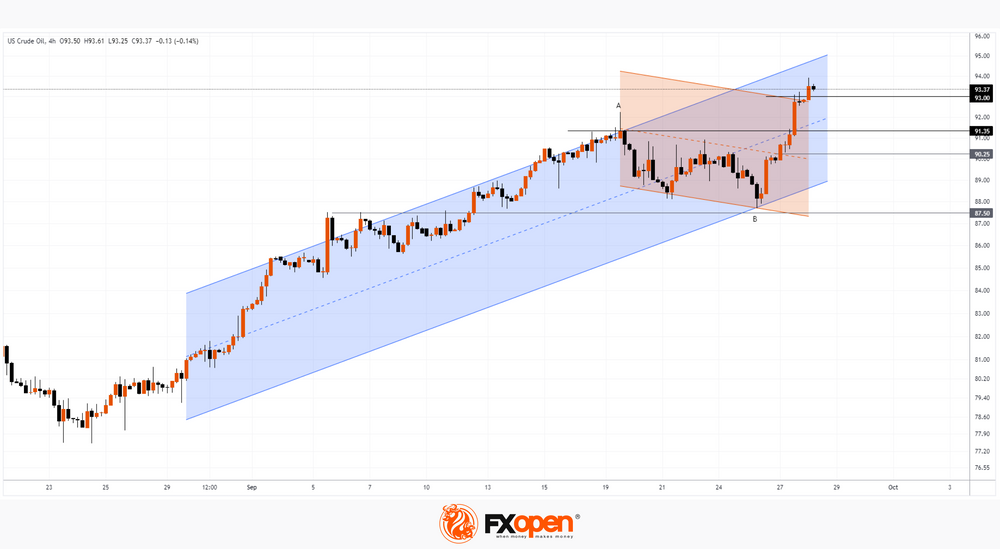
The A→B decline in oil prices observed since September 19 was merely a correction (shown in red) within a longer-term uptrend (shown in blue). Wherein:
→ the price sharply pushed off from the lower border of the blue channel around 87.5 - we wrote about this scenario earlier;
→ after a short respite, it broke through the median line of the red channel at around 90.25;
→ confidently overcame the level of 91.35, where growth clearly slowed down 10 days ago when approaching point A;
→ exceeded the upper limit of the red channel.
Now it is important for the bulls to gain a foothold at the achieved highs around USD 93. But if the upward impulse has not exhausted itself, then we may witness continued growth towards the upper border of the blue channel.
On the other hand: overbought market, the desire to lock in profits from long positions before the weekend, a possible reaction at the level of statements from the US authorities — all these can become factors contributing to the formation of a correction (for example, to the median line of the blue channel).
This article represents the opinion of the Companies operating under the FXOpen brand only. It is not to be construed as an offer, solicitation, or recommendation with respect to products and services provided by the Companies operating under the FXOpen brand, nor is it to be considered financial advice.
GBP/JPY Daily Outlook
Daily Pivots: (S1) 181.10; (P) 181.39; (R1) 181.89; More...
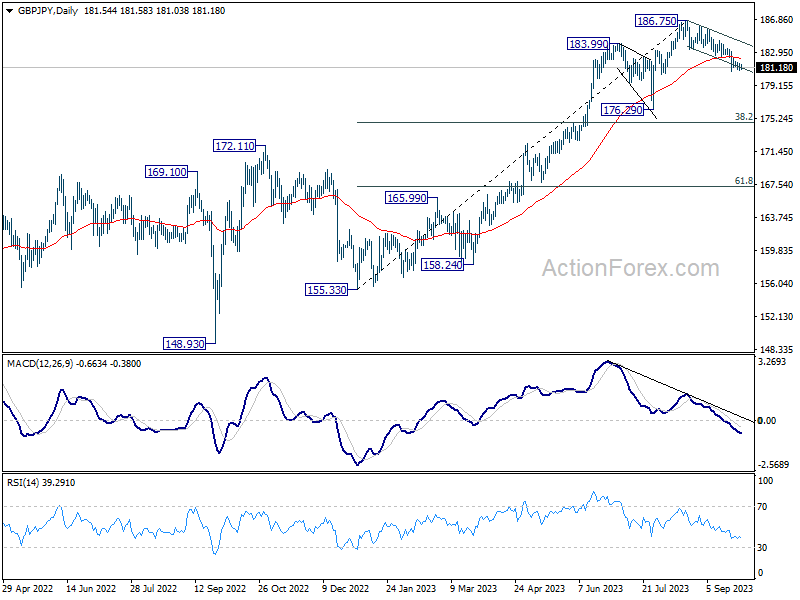
GBP/JPY is staying in consolidation above 180.78 and intraday bias stays neutral. With 183.34 resistance intact, further decline is expected. On the downside, break of 180.78 will resume the fall from 186.75 to 176.29 support next.
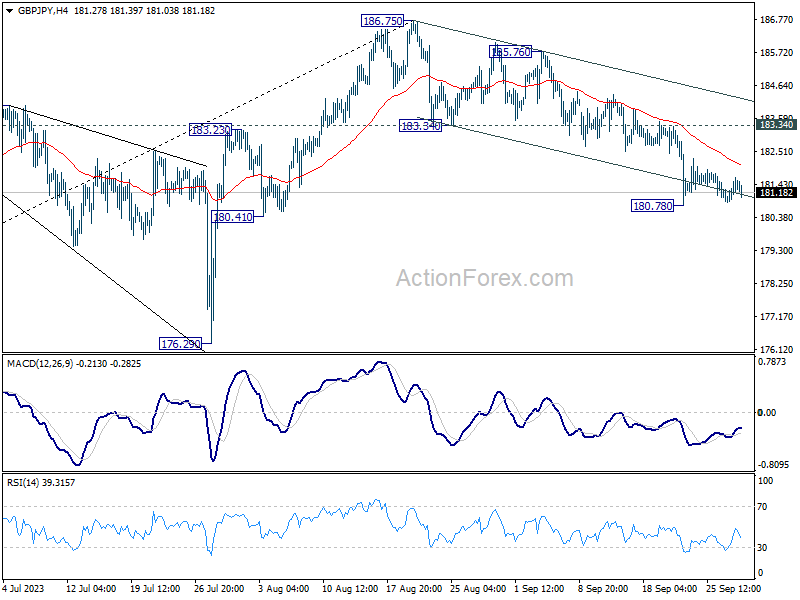
In the bigger picture, fall from 186.75 is currently seen as a corrective move only. As long as 176.29 support holds, larger up trend from 123.94 (202 low) should still be in progress. Break of 186.75 will target 195.86 (2015 high). Nevertheless, firm break of 176.29 will confirm medium term topping, and bring lengthier and deeper consolidations.
EUR/JPY Daily Outlook
Daily Pivots: (S1) 156.89; (P) 157.25; (R1) 157.55; More....
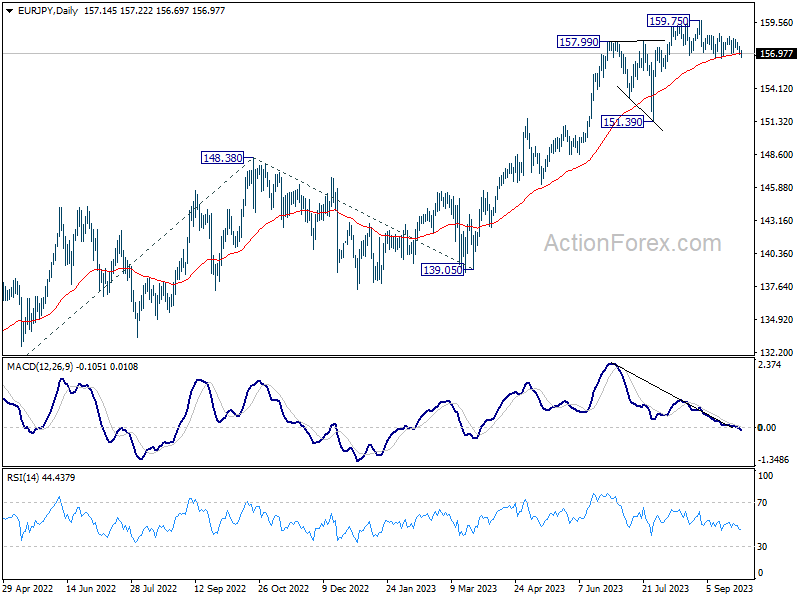
Intraday bias in EUR/JPY remains neutral as range trading continues. Risk stays on the downside with 158.64 resistance intact. On the downside, break of 156.57 support, and sustained trading below 55 D EMA (now at 156.96) will argue that fall from 159.75 is a larger scale correction. Deeper decline would be seen back towards 151.39 support. Nevertheless, above 158.64 would bring retest of 159.75 high instead.
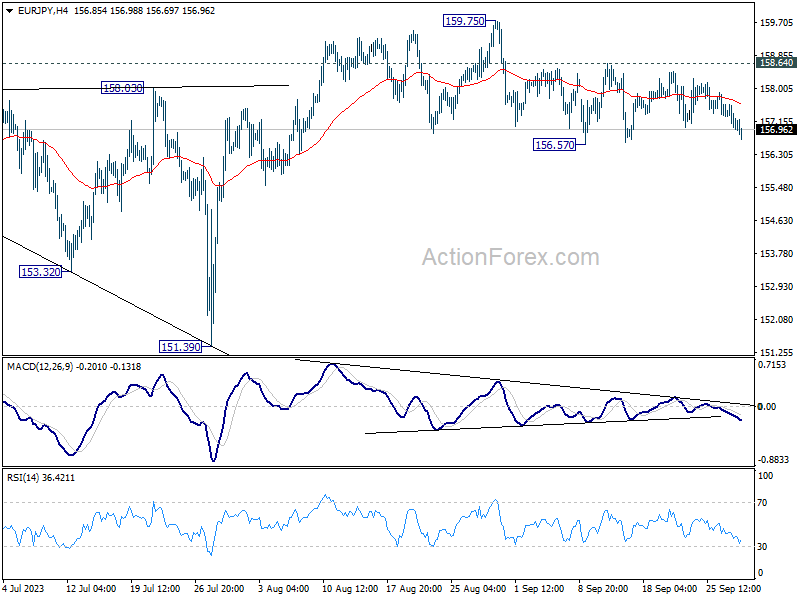
In the bigger picture, as long as 151.39 support holds, rise from 114.42 is still expected to continue. Next target is 100% projection of 124.37 to 148.38 from 139.05 at 163.06. Sustained break there will pave the way to retest long term resistance at 169.96.
EUR/AUD Daily Outlook
Daily Pivots: (S1) 1.6476; (P) 1.6528; (R1) 1.6586; More...
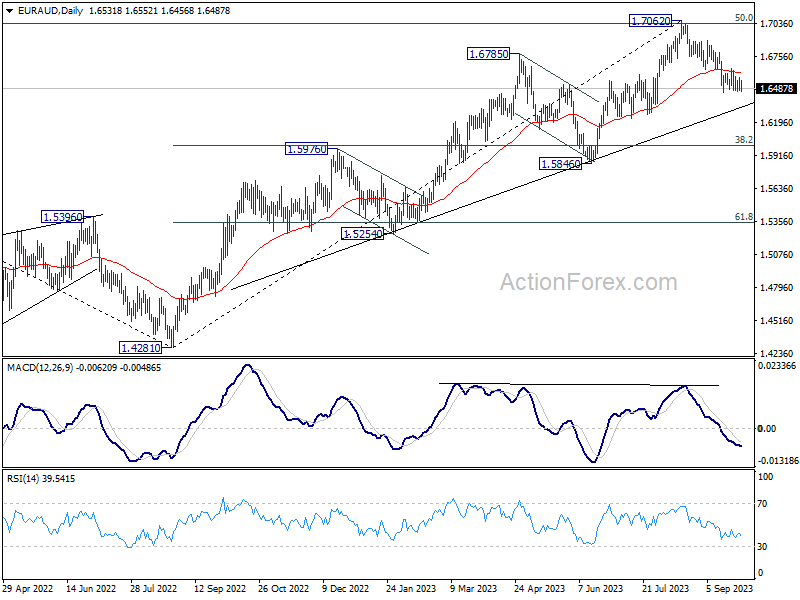
Range trading continues in EUR/AUD and intraday bias stays neutral. Deeper decline is expected with 1.6793 resistance intact. On the downside, break of 1.6452 will resume the fall from 1.7062, as a larger scale correction, to 1.6000 fibonacci level. Nevertheless, firm break of 1.6793 will dampen this view and bring retest of 1.7062 instead.
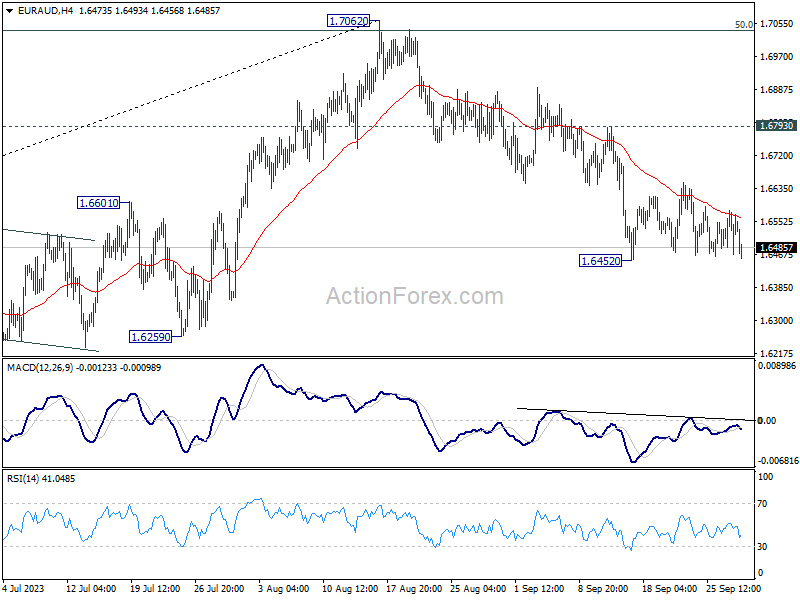
In the bigger picture, fall from 1.7062 is probably correcting whole up trend from 1.4281 (2022 low). Deeper decline would be seen to 38.2% retracement of 1.4281 to 1.7062 at 1.6000. Strong support should be seen there to bring rebound, at least on first attempt.
EUR/GBP Daily Outlook
Daily Pivots: (S1) 0.8638; (P) 0.8670; (R1) 0.8688; More....
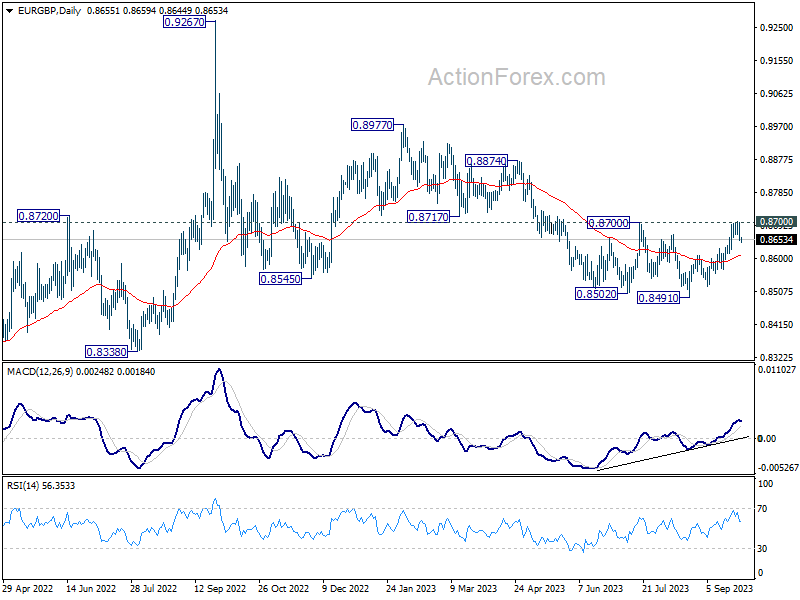
Intraday bias in EUR/GBP remains neutral for the moment. On the upside, decisive break of 0.8700 resistance will carry larger bullish implication and bring stronger rally to 0.8874 resistance next. Nevertheless, rejection by this resistance will maintain bearish outlook that larger down trend is not over. Break of 0.8629 resistance turned support will turn bias back to the downside for 0.8568 support first.
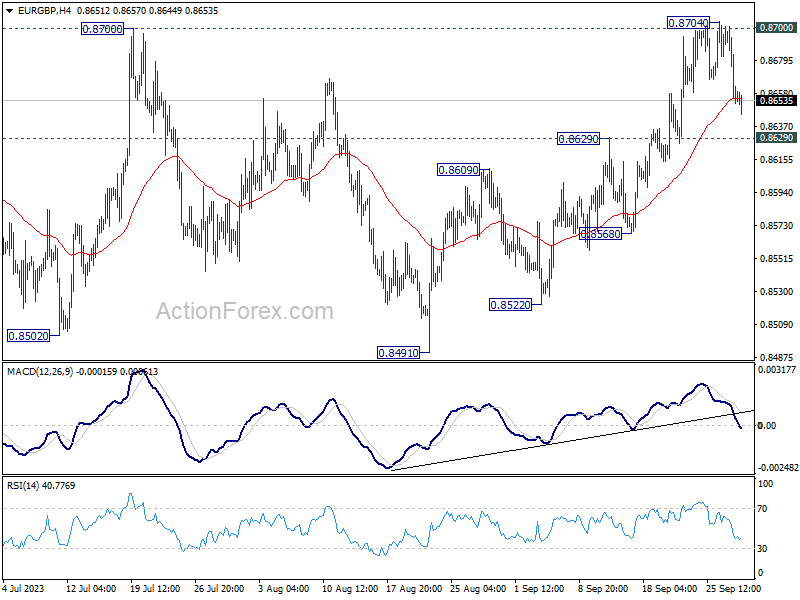
In the bigger picture, the down trend from 0.9267 (2022 high) is seen as part of the long term range pattern from 0.9499 (2020 high). Decisive break there will argue that this decline has completed with three waves down to 0.8491. Rise from 0.8491 could then be another leg inside the pattern that targets 0.8977 and above. However, rejection by 0.8700 will keep the down trend alive for another fall through 0.8491 at a later stage.
EUR/CHF Daily Outlook
Daily Pivots: (S1) 0.9658; (P) 0.9676; (R1) 0.9694; More...
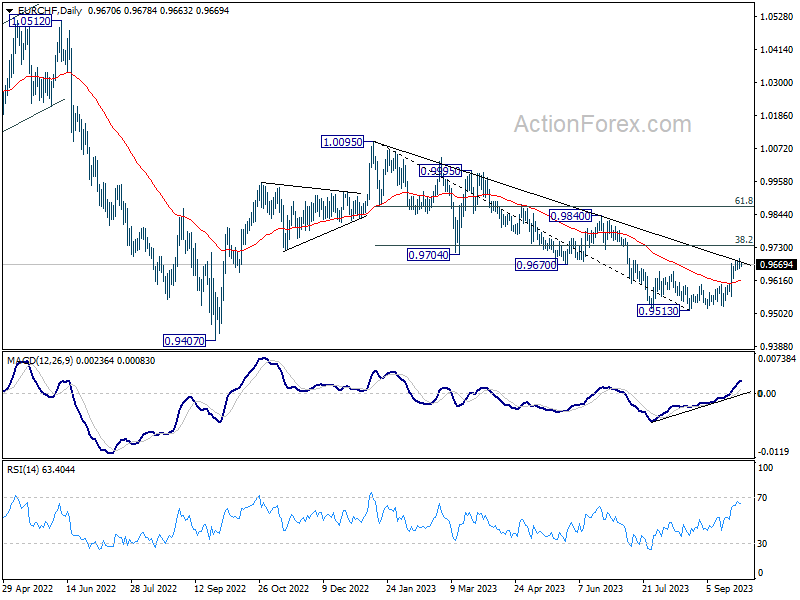
Intraday bias in EUR/CHF is turned neutral again as it retreated again after edging higher to 0.9691. For now, further rally will stay in favor as long as 0.9617 support holds. Above 0.9691 will resume the rise from 0.9513 to 38.2% retracement of 1.0095 to 0.9513 at 0.9735. However, firm break of 0.9617 will turn bias back to the downside for retesting 0.9513 low.
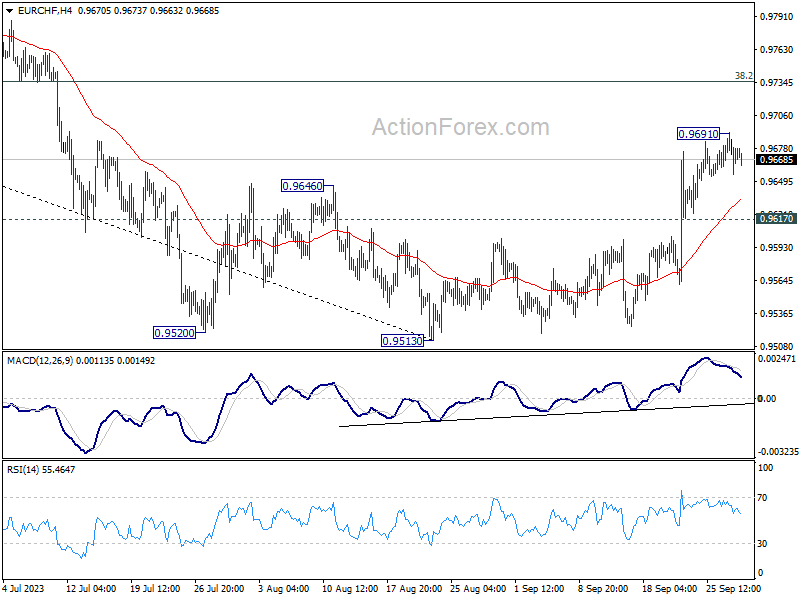
In the bigger picture, medium term outlook will stay bearish as long as the cross is capped well below falling 55 W EMA (now at 0.9799). That is, down trend from 1.2004 (2018 high) could still resume through 0.9407 (2022 low). However, sustained trading above the 55 W EMA will raise the chance that 0.9470 is already a long term bottom. Further rise would then be seen to 1.0095 resistance to indicate bullish trend reversal.
WTI Oil Futures Hit an 11-month High
- WTI futures climb to their highest level since August 2022
- Advance shows no signs of easing so far, bulls eye crucial 100 psychological mark
- But RSI, stochastics and Bollinger bands point at overbought conditions
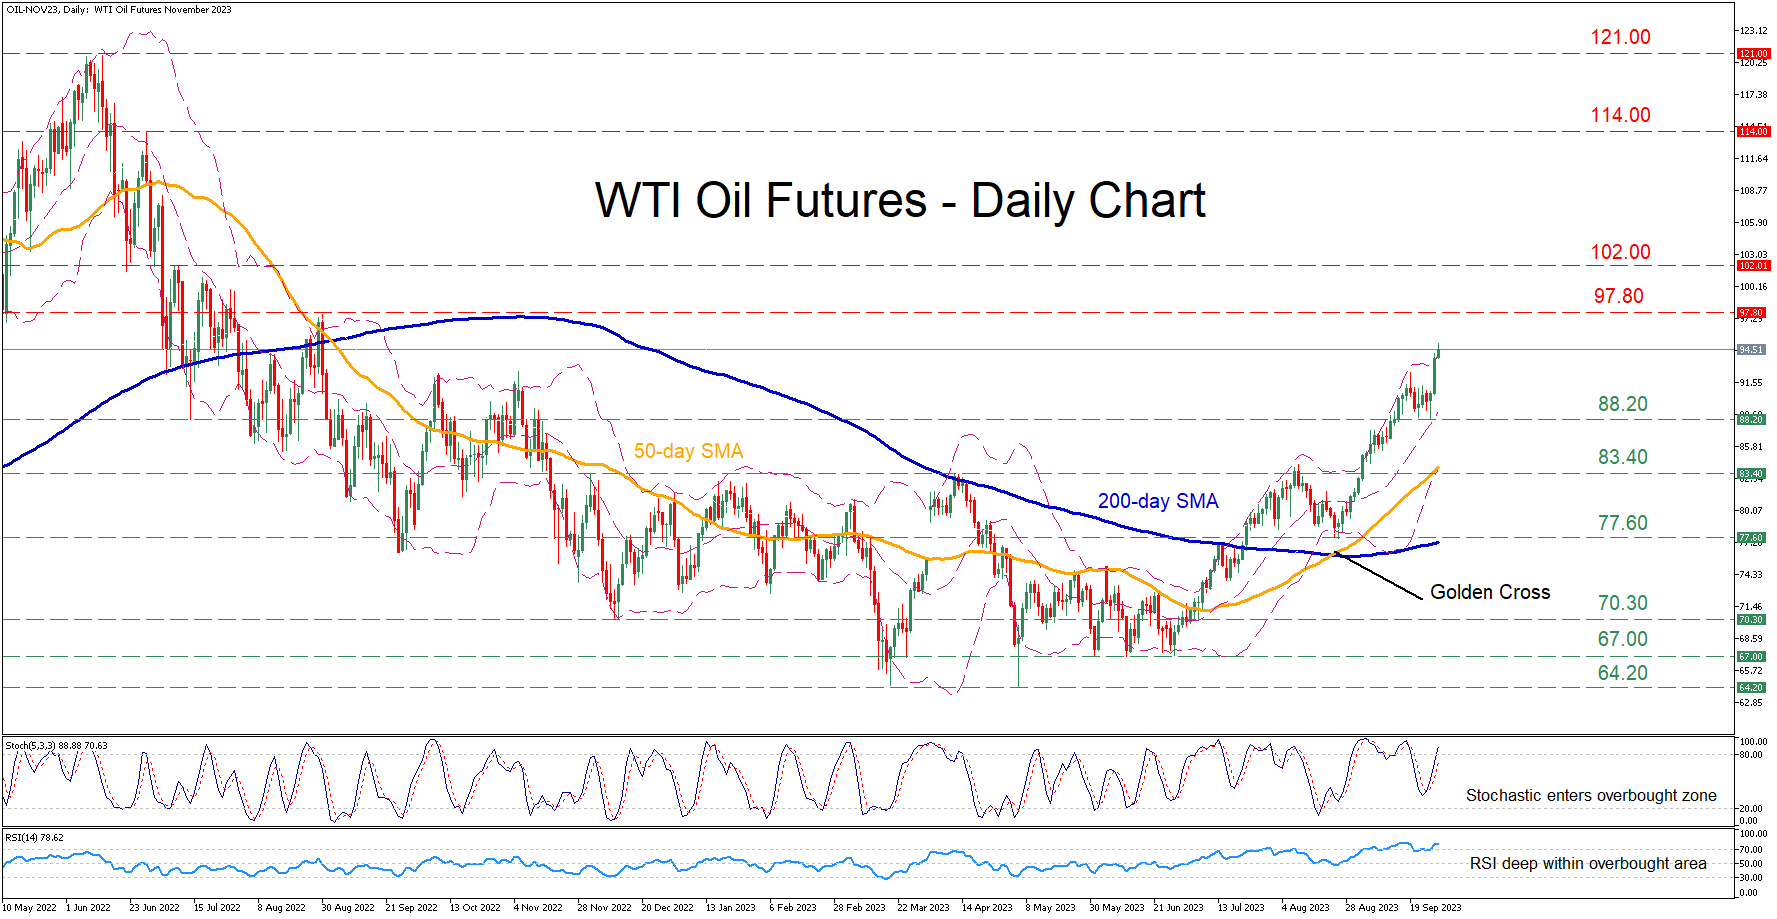
WTI oil futures (November delivery) have been in a steady advance since July, climbing to an 11-month peak of 95.02 in today’s session before paring some gains. However, the momentum indicators are currently deep in their overbought territories, suggesting that the recent rally could be overstretched.
Should the bulls attempt to push the price higher, initial resistance could be found at the August 2022 peak of 97.80. Further advances could then cease at the July 2022 resistance of 102.00. Piercing through that wall, oil prices may then challenge the June 2022 hurdle of 114.00.
On the flipside, if the bears emerge and push the price lower, the recent support of 88.20 could act as the first line of defence. Sliding beneath that floor, the commodity could decline towards the April resistance of 83.40, which may serve as support in the future. A violation of that territory could open the door for the August low of 77.60.
In brief, WTI oil futures have been exhibiting persistent strength, recording consecutive multi-month peaks. Nevertheless, a downside correction should not be ruled out as the latest advance has reached overbought conditions.
USD/CAD Daily Outlook
Daily Pivots: (S1) 1.3480; (P) 1.3512; (R1) 1.3528; More....
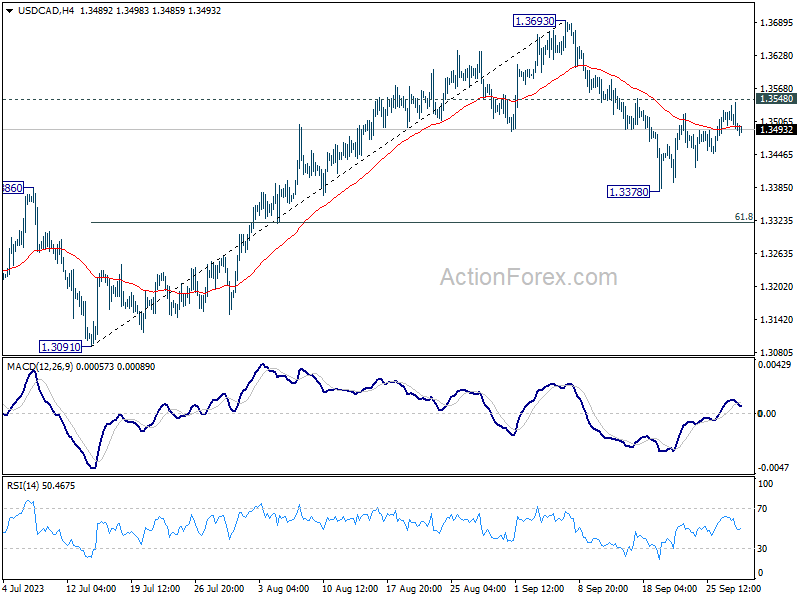
Outlook in USD/CAD remains unchanged as consolidation from 1.3378 is in progress. Further decline remains mildly in favor. Break of 1.3378 will resume the fall from 1.3693, as another leg in the corrective pattern from 1.3976 high, to 61.8% retracement of 1.3091 to 1.3693 at 1.3321. However, firm break of 1.3548 will turn bias back to the upside for retesting 1.3693 instead.
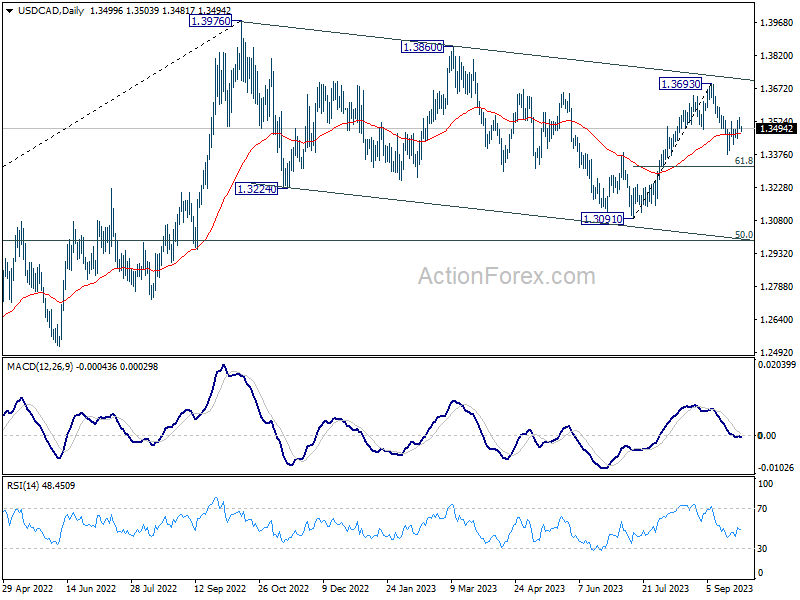
In the bigger picture, price actions from 1.3976 are viewed as a corrective pattern to the up trend from 1.2005 (2021 low). Deeper decline could be seen as the pattern is now extending. But downside should be contained by 50% retracement of 1.2005 to 1.3796 at 1.2991. Rise from 1.2005 is still expected to resume after the correction completes.
AUD/USD Daily Report
Daily Pivots: (S1) 0.6320; (P) 0.6365; (R1) 0.6397; More...
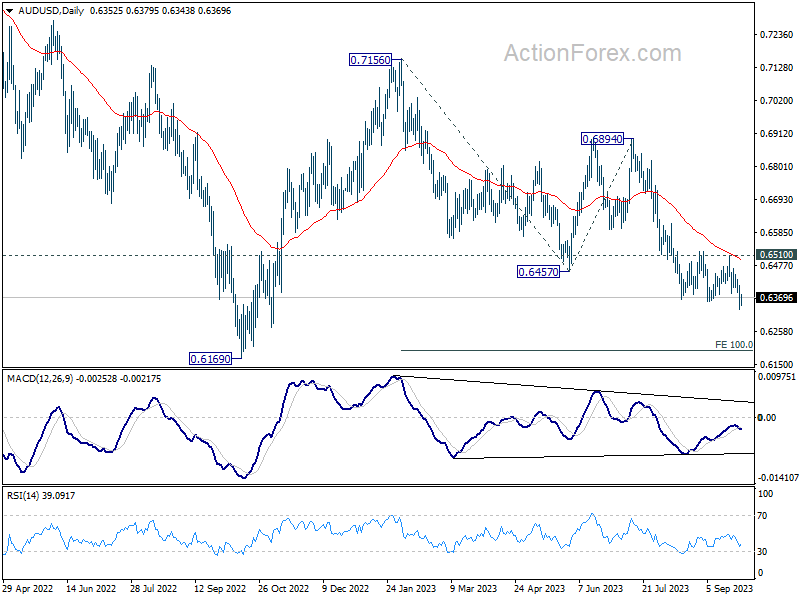
AUD/USD's down trend from 0.7156 resumed by breaking through 0.6356 and intraday bias is back on the downside. Current fall should target 100% projection of 0.7156 to 0.6457 from 0.6894 at 0.6195 next. On the upside, break of 0.6510 resistance is needed to indicate short term bottoming. Otherwise, outlook will stay bearish in case of recovery.
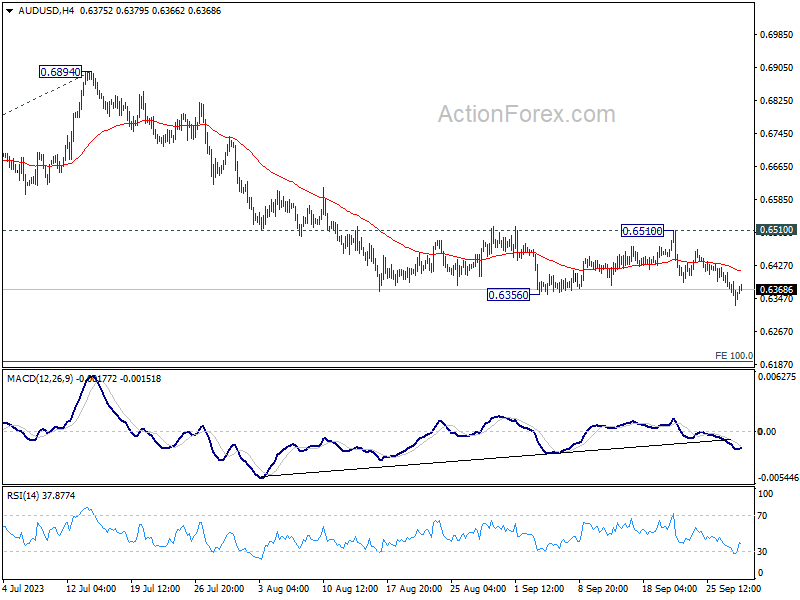
In the bigger picture, down trend from 0.8006 (2021 high) is possibly still in progress. Decisive break of 0.6169 will target 61.8% projection of 0.8006 to 0.6169 to 0.7156 at 0.6021. This will now remain the favored case as long as 0.6894, in case of strong rebound.
EUR/USD Daily Outlook
Daily Pivots: (S1) 1.0468; (P) 1.0523; (R1) 1.0558; More...
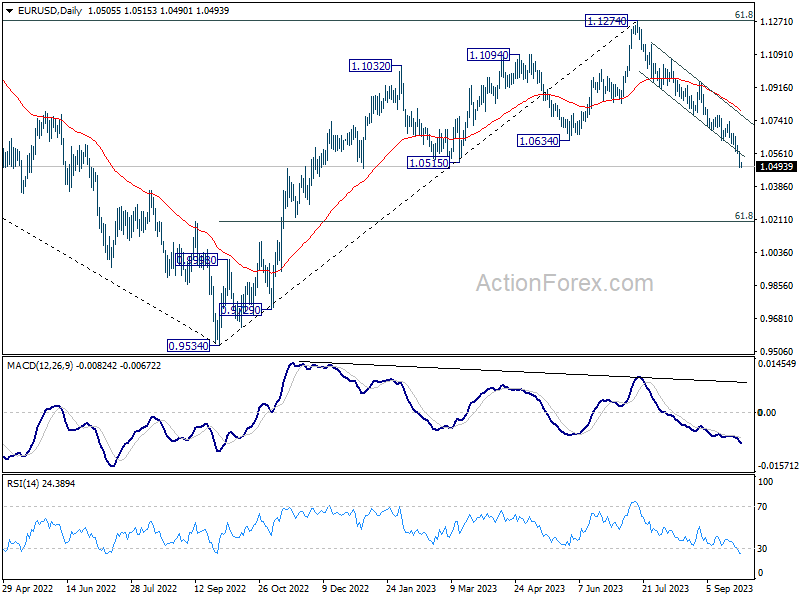
Intraday bias in EUR/USD stays on the downside at this point, as fall from 1.1274 is in progress. Break of the near term falling channel indicates downside acceleration. Next target is 1.0199 fibonacci level. On the upside, above 1.0573 minor resistance will turn intraday bias neutral and bring consolidations. But outlook will stay bearish as long as 1.0764 support turned resistance holds.
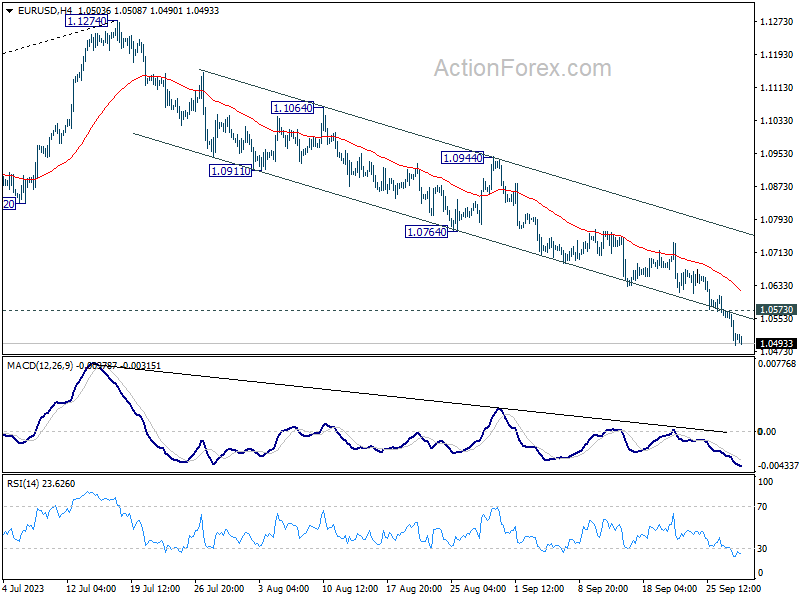
In the bigger picture, fall from 1.1274 medium term top could still be a correction to rise from 0.9534 (2022 low). But chance of a complete trend reversal is rising. In either case, firm break of 1.0515 support will target 61.8% retracement of 0.9534 to 1.1274 at 1.0199. For now, risk will stay on the downside as long as 55 D EMA (now at 1.0786) holds, in case of rebound.