Sample Category Title
GBP/JPY Marks a Major Top – Will It Revert to 200.00?
GBP/JPY is a historically popular pair in Forex trading, as it is one of the most volatile products to trade and captures geographic dynamics and risk-on/risk-off flows.
The pair once again stands at a key inflection point, right after a historic run back to 2008 levels, and can offer quite interesting setups amid elevated market volatility.
It can be affected by recent tariff developments, as GBP has a historical correlation with Equity markets. Hence, if Markets rally after the tariff cancellation, GBP/JPY can retest recent highs.
However, bearish Stock Markets could bring the pair back to 200.00, a 9,000-pip move from current levels, if geopolitical developments sour sentiment.
After an insane run on the Yen throughout the latter part of 2025, the landmark victory in Japanese snap elections brought some confidence in the currency and calmed the spikes in long-end yields.
On the other hand, Sterling could be facing some weakness ahead. The UK reported the highest unemployment rate since 2021, and with a relatively cooling Inflation Rate (still too elevated for the Bank of England), the Central Bank might be inclined to cut.
With Rate differentials converging and sentiment souring, GBP/JPY could be facing a significant reversal in the coming times. The challenge for FX traders will be to capture the trade optimally.
Let's dive into a multi-timeframe analysis and technical levels for GBP/JPY, which could soon be subject to intense volatility.
GBP/JPY Multi-timeframe Technical Analysis
Daily Chart
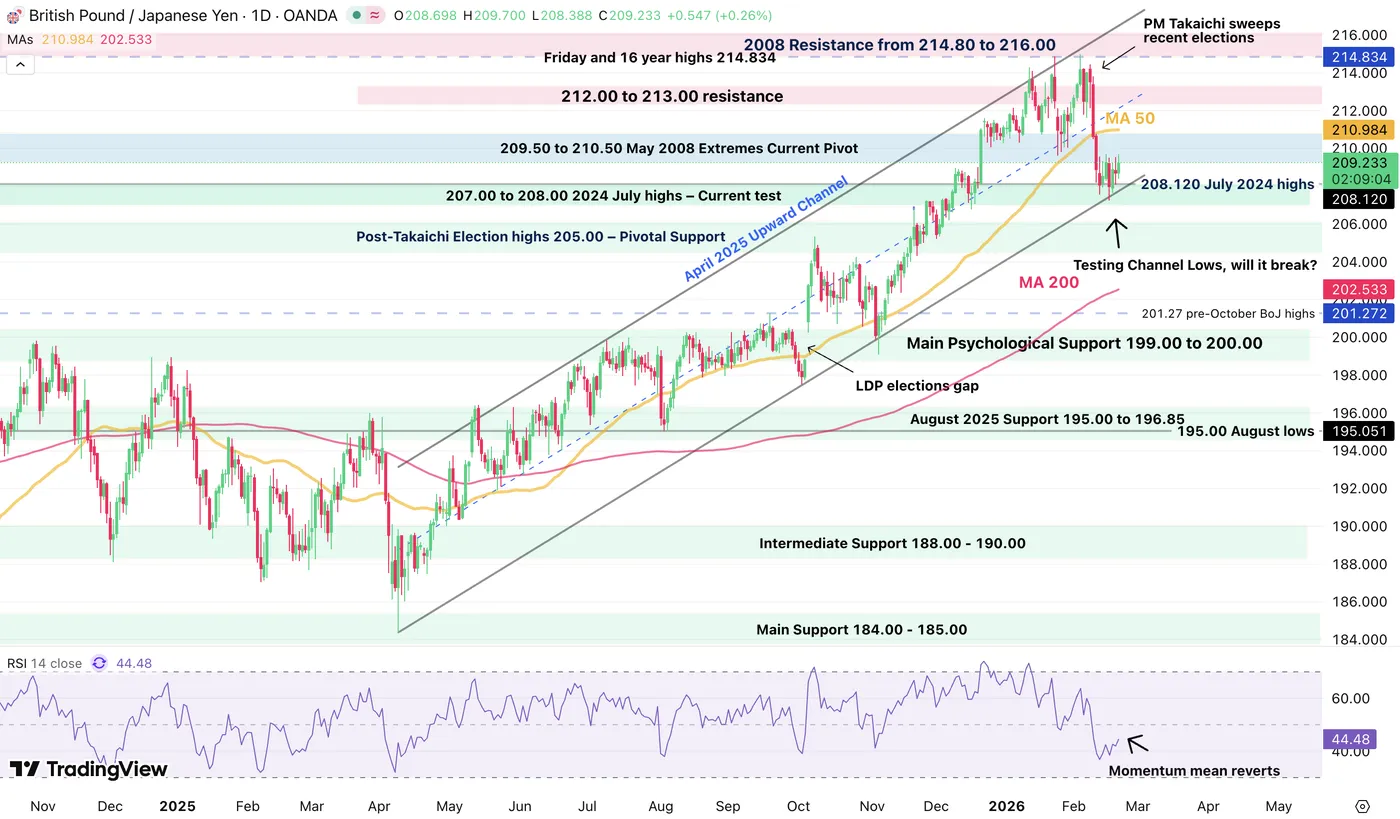
GBP/JPY Daily Chart, February 20, 2026 – Source: TradingView
The pair is consolidating at the lows of its Mid-2025 channel that took the pair back to 2008 highs.
Momentum cool downs are common after such gigantic moves, but with recent Market developments, the action could soon get spicy.
As GBP/JPY tests its Pivot Zone, let's take a look closer at what could tilt the scales.
4H Chart and Technical Levels
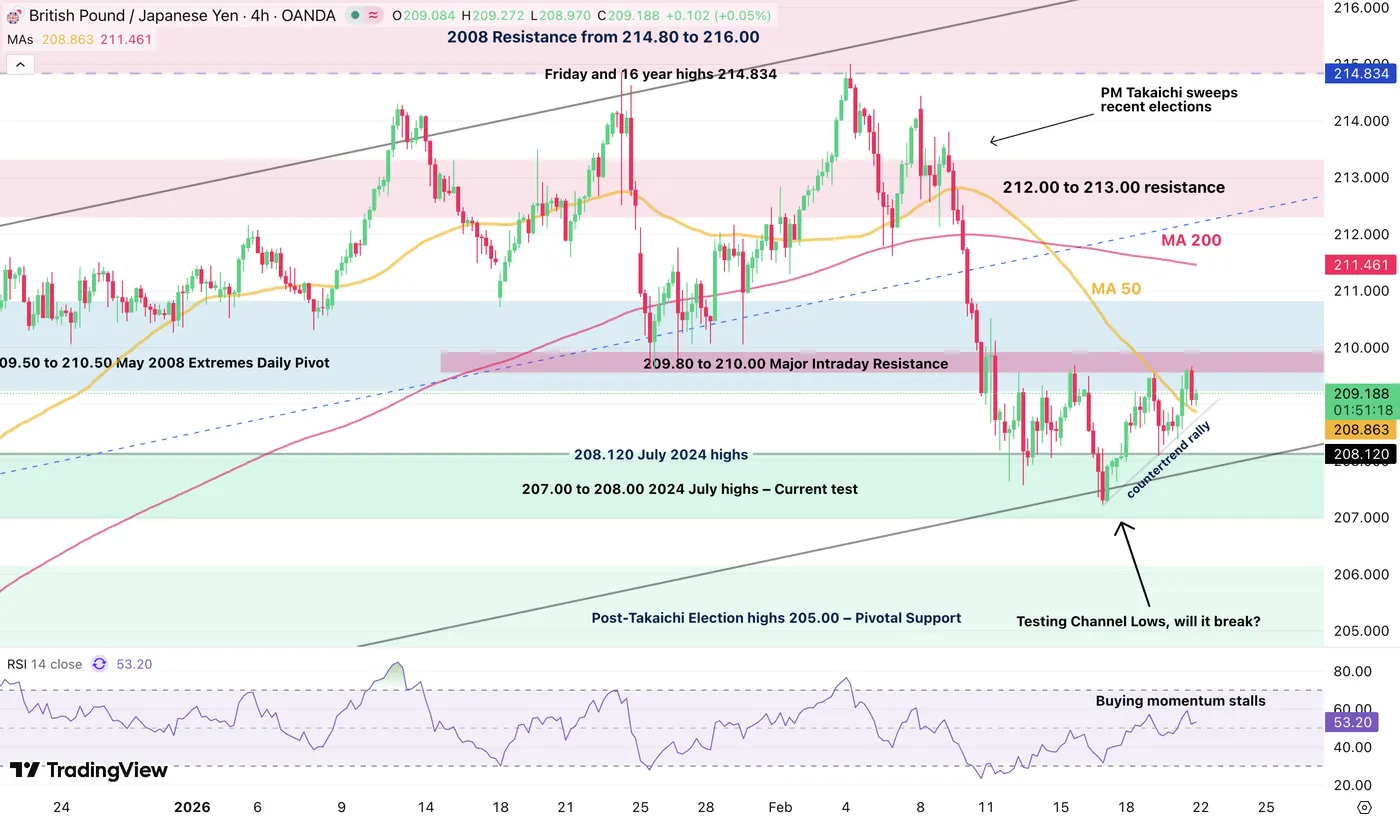
GBP/JPY 4H Chart, February 20, 2026 – Source: TradingView
The action recently formed a major intraday resistance (209.50 to 210.00) right at the beginning of its Pivot zone, leaving two potential scenarios:
- With recent rejection of resistance, sellers are attempting to take the upper hand
- Look for a break of the intraday upward trendline.
- Closing below the trendline should see a swift test of February lows at 207.240.
- Breaking this could see acceleration towards the 205.00 Pivotal Support.
- Watch out as these targets are quite far and closer profit-taking could maximize the chance to secure trading profits.
- Any break and session close above 210.00 will give more chances to test the 50-Day MA and top of the Daily Pivot Zone (210.90 to 211.00) – Lower probabilities in the current course of action
Levels to watch for GBP/JPY trading:
Support Levels:
- 208.80 Countertrend micro-support (if break, bears take the hand)
- 208.120 July 2024 highs mini-support
- 207.50 to 208.00 2024 July highs – recent test
- Post-Takaichi Election highs 205.00 – Pivotal Support (breaking this opens the door to 200.00
Main Key Support 199.00 to 200.00
Resistance Levels:
- 209.50 to 210.00 Major Intraday Resistance
- 210.90 50-Day MA
- 212.00 to 213.00 resistance
- Early February 16 year highs 214.834
1H Chart
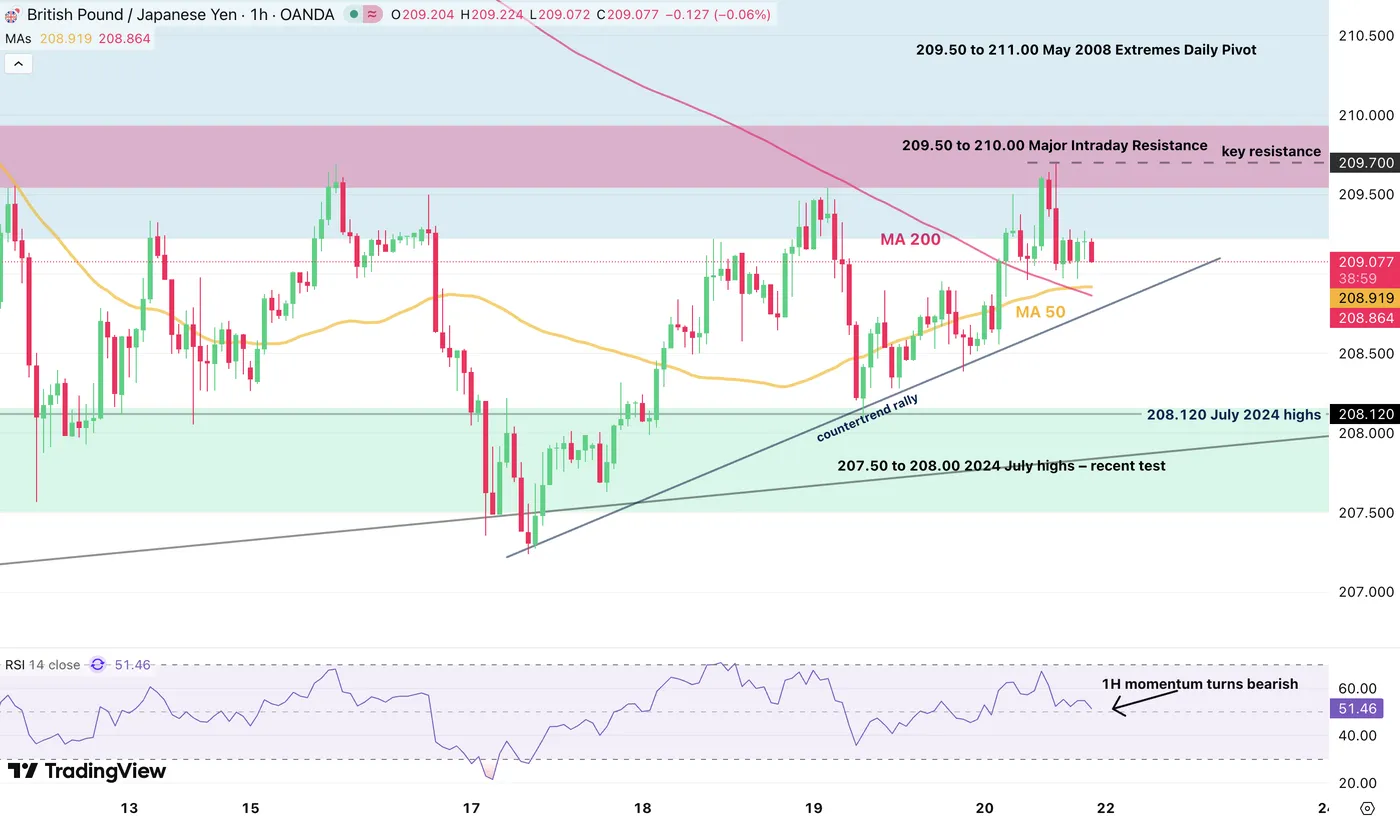
GBP/JPY 1H Chart, February 20, 2026 – Source: TradingView
With recent rejection of the intraday resistance, a bearish move could appear.
- Watch out for weekend volatility which could lead to spikes at the Sunday Globex open (hence requiring larger stops, make sure to respect your risk-tolerance in that aspect).
To confirm the reversal, traders will want to see a break of the trendline.
- On the other hand, bouncing higher from here and closing above the Intraday resistance would point to higher odds of testing the 50-Day MA.
Safe Trades!
US Supreme Court Strikes Down Trump Tariffs
The U.S. Supreme Court has officially struck down the Trump administration’s global tariffs, ruling that the executive branch exceeded its authority under the IEEPA.
For now, the action remains very muted across FX, Stocks, and Crypto Markets, which are all close to unchanged on the session.
Only Metals are rallying, but that would mainly reflect weekend risk, if anything, and they actually faded their up-move on the Decision.
You can get access to the Full text of the Supreme Court decision right here.
Stocks spiked on the announcement, but the move isn't looking like it will sustain, at least for now.
Overall, Markets are not reacting much for now because the Decision was largely priced in.
What could affect flows going forward is how the Trump Administration responds – they have been prepared for this issue, so what's coming next is still uncharted territory.
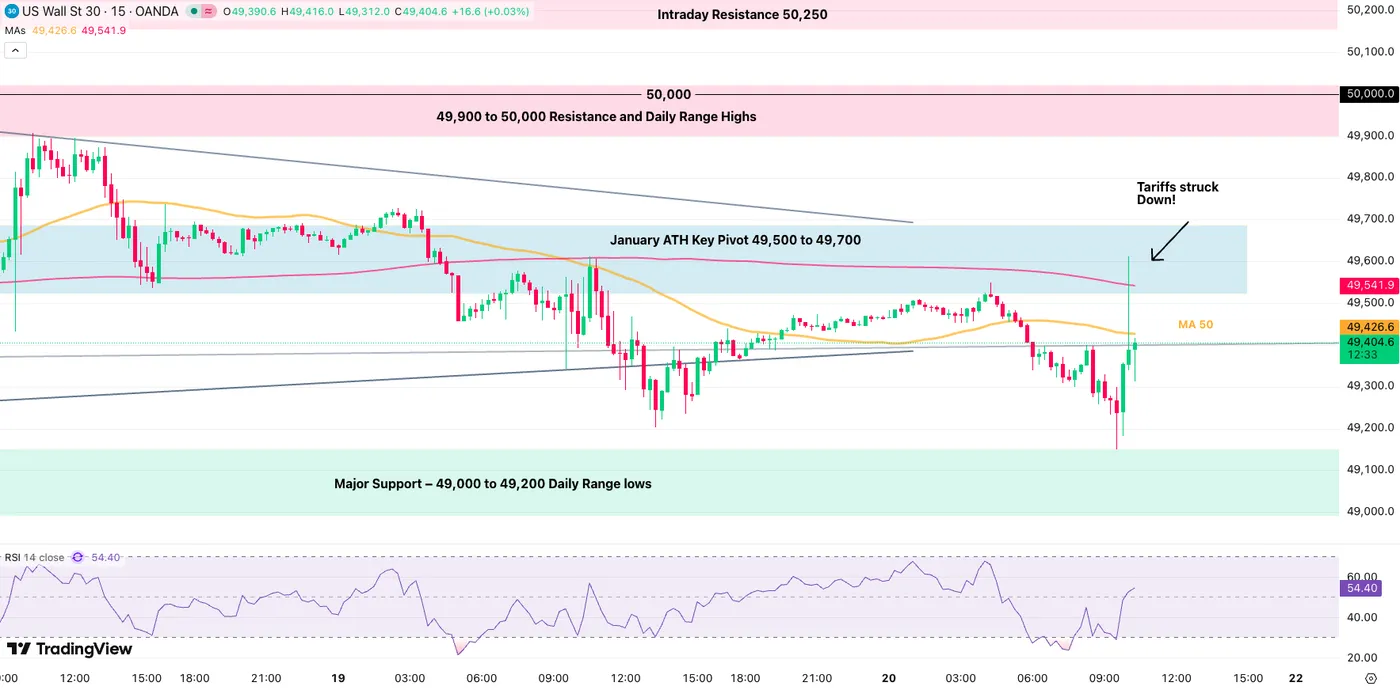
Dow Jones 15M Chart – Source: TradingView. February 20, 2026
Safe Trades!
Silver (XAG/USD) Rallies Back Above $80, More Incoming? – Technical Outlook
Metals are slowly recovering after their high-paced deleveraging from late January trading.
Establishing consolidative ranges and holding tight right around their 2026 opening levels, the Precious Commodities are facing key technical tests in their historic runs.
Indeed, after their shocking up-and-down performances in the first two months of the year, it is even more astonishing to see that they are mostly back to where they were before year-end, with Gold leading the pack with more modest 16% gains (check out their yearly performance right here).
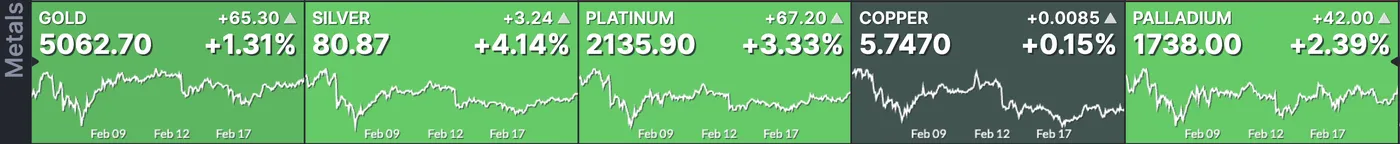
Metals performance in today's session – Source: Finviz. February 20, 2026
As speculation tones down, up sessions have been much more contained, which bodes well for a more stable price action ahead. Ranging between 2% and 3%, the daily rally in metals changes from the +10% ranges that almost became the new normal throughout January.
Futures Traders are now awaiting deliveries, and the COMEX has sent out notices. Concerns regarding the exchange’s low inventory levels are arising, but the Market hasn’t reacted to such news, so take that with a pinch of salt.
Overall, Metals are still in a rangebound trajectory since their correction, providing non-directional trading opportunities. However, directional traders will have to wait for a further breakout.
What may console Gold and Silver bulls is the heating tone regarding a military intervention in Iran, which would create a spike in Safe-Haven demand. Nevertheless, Gold would be more inclined to rally than the more volatile Silver, and with heavy positioning, any rally could see its potential capped.
Still, flight to quality may push Silver higher.
We will dive into a Silver multi-timeframe analysis to identify where the next breakout could occur and whether anything tilts the scales in favor of the Commodity. Let's get right into it.
Silver (XAG/USD) Multi-timeframe Technical Analysis
Daily Chart
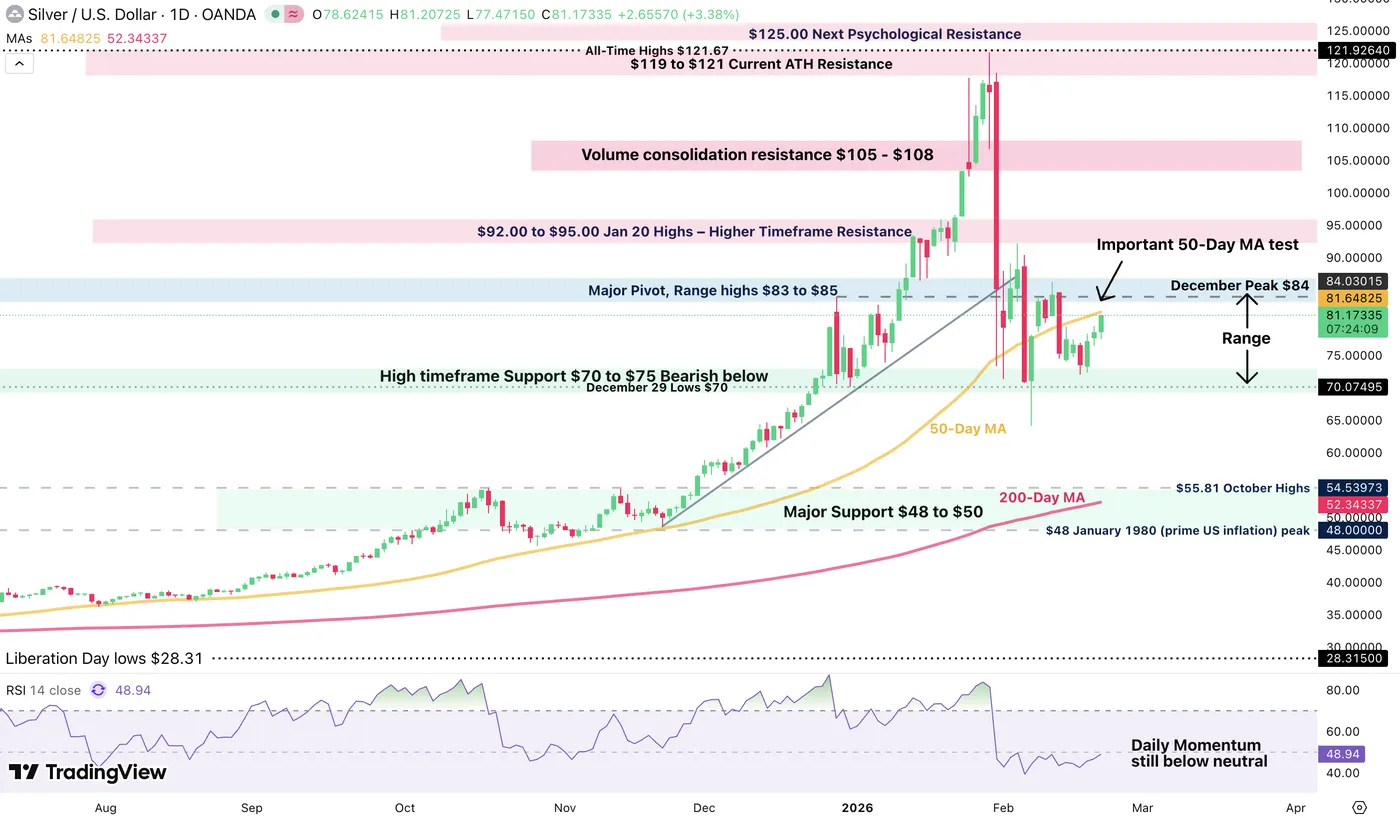
Silver Daily Chart, February 20, 2026 – Source: TradingView
The current price action in Silver is one of hesitant recovery as prices maintain solidly between $70 and $84, a major range.
RSI Momentum is still below neutral territory, indicating a higher potential for correction, particularly as the 50-Day Moving Average is coming at resistance.
Take a close look to reactions if and when trading reaches that price level ($81.65)
4H Chart and Technical Levels
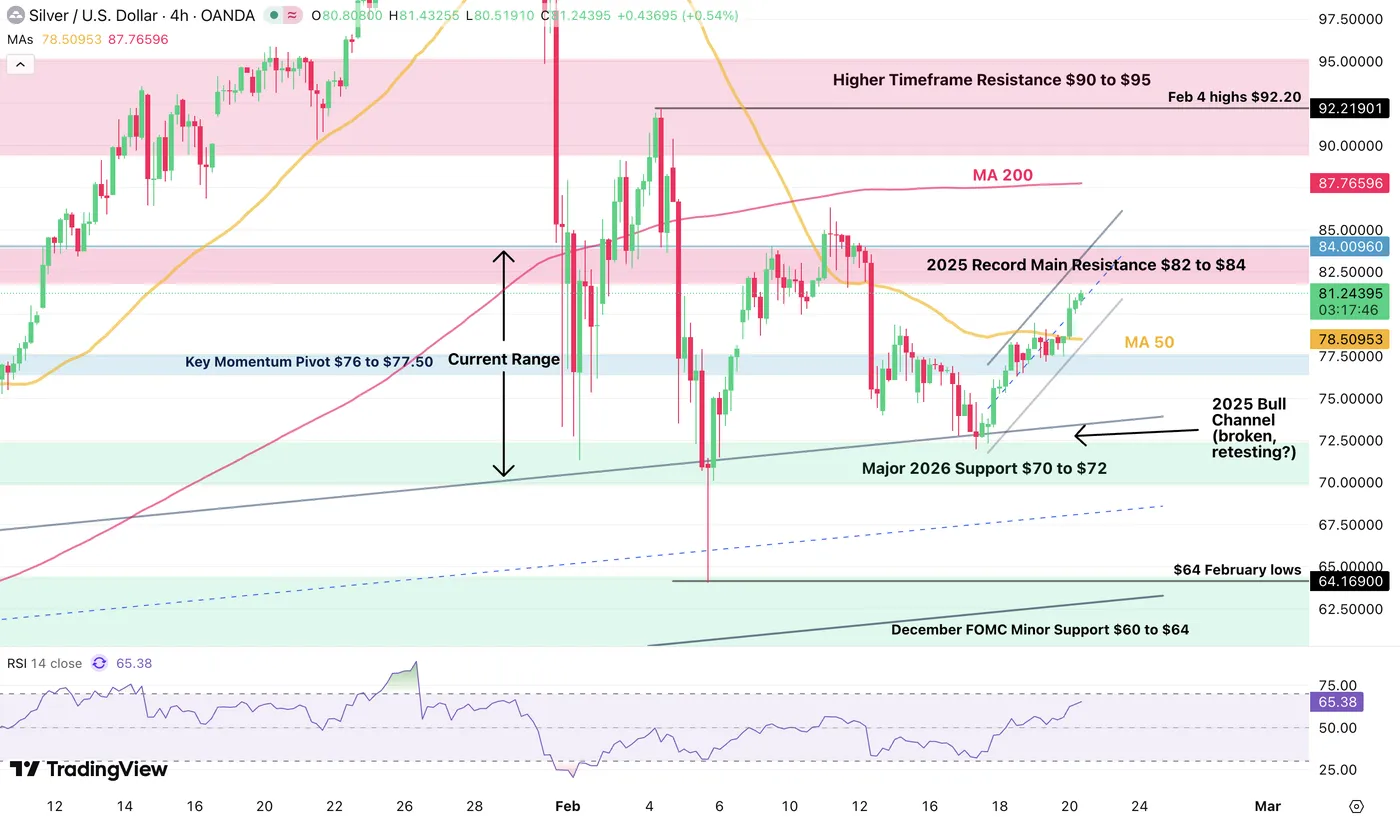
Silver 4H Chart, February 20, 2026 – Source: TradingView
Looking closer, Bulls are attempting to take the advantage, forming a strong rebound after retesting the 2025 broken bull channel and the action is now breaking the 50-Day MA.
If they manage a daily close above the Daily Moving Average (see level above), Silver could see higher chances of an upside breakout. Today's session close and Monday open will be very essential in that aspect.
- Breaking above $84 points to much higher chances to retest the $100 level.
Levels to watch for Silver (XAG) trading:
Resistance Levels:
- Attempting a break above 50-Day MA $81.65 (Watch the close)
- 2025 Record Main Resistance $82 to $84
- 4H 200-MA $87.76
- Higher Timeframe Major Resistance $90 to $95
- Key psychological resistance $100 to $104
Support Levels:
- Key Momentum Pivot $76 to $77.50
- Major 2026 Range Support $70 to $72
- December FOMC Minor Support $60 to $64 (Feb Lows)
- $50 to $54 Major Support
- October FOMC bottom $46.00 to $47.00
1H Chart
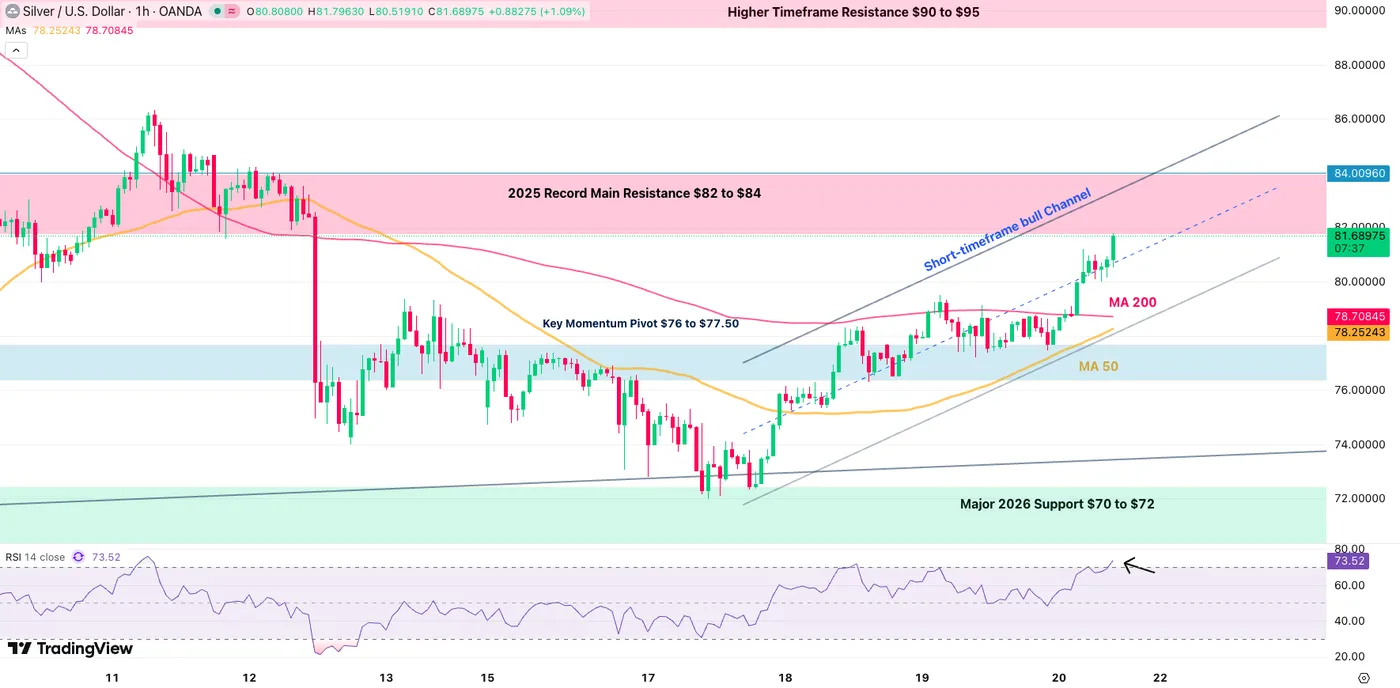
Silver 1H Chart, February 10, 2026 – Source: TradingView
Silver is now evolving well within an intraday bull channel which is the indicator to watch for short-term trading.
- Holding it will be essential to provide a more balanced and sustainable rally ahead.
- Breaking the channel would confirm the $70 to $84 Range which should then hold for longer.
Safe Trades!
Week Ahead – Markets Brace for Heightened Volatility as Event Risk Dominates
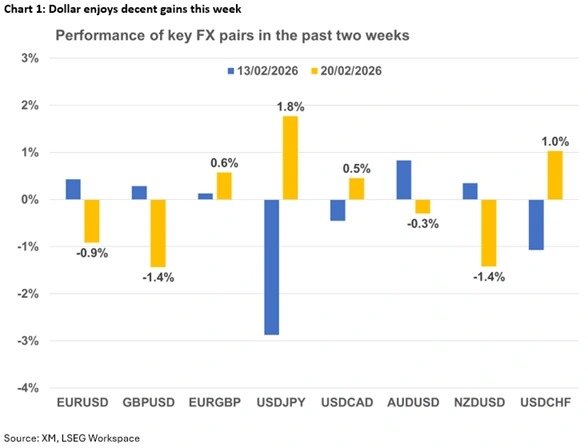
- Dollar strength dominates markets as risk appetite remains subdued.
- A Supreme Court ruling, geopolitics and Fed developments are in focus.
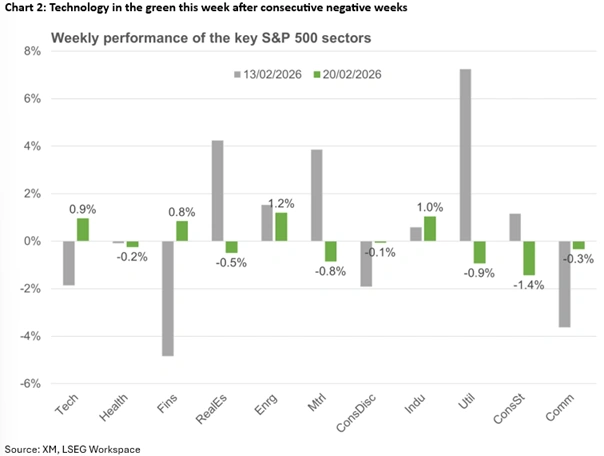
- Pivotal Nvidia earnings on Wednesday as investors question tech sector weakness.
- Yen and aussie diverge; both pound and euro could recoup their losses.
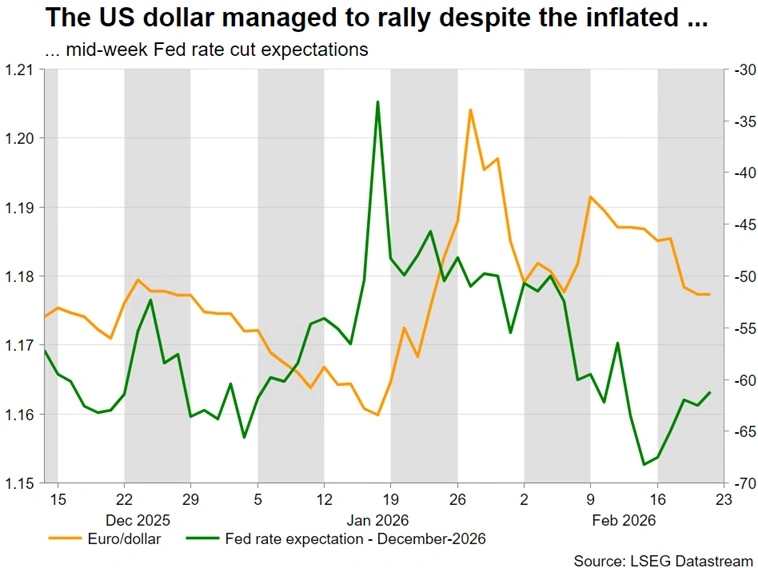
Dollar rally persists
Despite markets pricing in additional easing from the Fed mid-week, the US dollar continues to perform strongly, posting gains across the FX spectrum, partly due to the geopolitical newsflow. Barring a major surprise on Friday with the announcement of the Supreme Court’s ruling on tariffs, this trend is likely to persist into the weekend if Friday’s key US data confirm the US economic strength and the lower inflationary pressures.
At the same, investors are trying to figure out the lingering weakness in US technology stocks. Is this a rotational shift into defensive and value stocks in anticipation of gradual US growth moderation, or just a temporary pause as companies adjust to the AI revolution? This dilemma will be partly answered on Wednesday, when Nvidia reports earnings after the US market closes. Unsatisfactory results and, more importantly, more conservative forward guidance could amplify the current weakness.
Fed in the spotlight, light data calendar
The Fed is unable to support risk appetite as it appears to be stuck in limbo. The chances of a rate cut under Chair Powell have diminished, predominantly due to the recently strong US data releases, and the continued attacks from the US President essentially limiting Powell’s willingness to meet Trump’s demand. This probably means that Fed meetings may lose some of their market-moving potential until June, with investors focusing instead on Kevin Warsh’s nomination hearings.
The process is currently stalled at the Senate Banking Committee, where senators are frustrated about the Fed probe against Powell over the Fed HQ renovation costs. Despite Treasury secretary Bessent’s optimism, no date for Warsh’s hearing has been set, gradually raising the probability of Powell remaining in position beyond May 15, and upsetting the robust rate cut expectations. This may sound far-fetched, but concerns appear credible given that Powell testified at the Senate Committee on Banking three months before taking office in February 2018.
Meanwhile, Fedspeak continues at full throttle. Investors tend to react more favourably to dovish rhetoric, limiting the dollar’s upside momentum. Next week’s data calendar is rather light, with Tuesday’s CB Consumer Confidence and Friday’s Producer Price Index report providing further insight into the economic trends. Interestingly, two-, five- and seven-year US Treasury auctions will take place next week. Investors are focusing on the level of foreign demand, with this week’s moves in US yields suggesting interest in Treasuries.
Wildcards could dent risk sentiment
If the Supreme Court judges refrain from publishing their tariff ruling on Friday, there are two additional ‘decision’ dates next week, Tuesday and Wednesday, February 24 and 25, respectively. The focus here is not just on the fate of tariffs, which if needed will be reimposed using different legislation, but on whether Trump will be allowed to act independently on such issues, ignoring Congress. This is key, since a loss of majority in either chamber at the November midterm elections would complicate Trump’s ability to govern.
Additionally, should the ruling strike down tariffs, the Trump administration might have to return some tariff revenue that has already been collected, which would blow a fresh fiscal hole into an already big federal deficit. Hence, a ruling announcement could prove extraordinarily market-moving across asset classes.
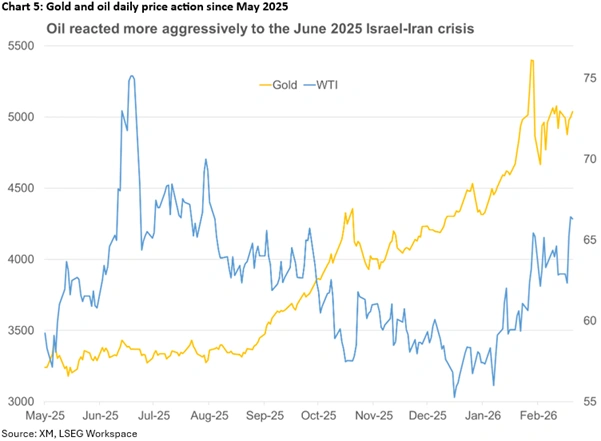
At the same time, there are numerous reports about an imminent US strike on Iran, despite the positive newsflow regarding the ongoing negotiations. Gold and oil are poised to further benefit from an escalation but the aftermath matters. Should Iran retaliate, potentially drawing Israel into the crisis, market reaction could resemble the June 2025 price action, when both the dollar and gold got a sizeable boost, but oil was the clear protagonist, skyrocketing to $80. Interestingly, gold has been struggling to reclaim the $5,000 level, potentially suffering from the Chinese holiday and the persistent strength of the US dollar.
The Yen and the Aussie are under close market scrutiny
Certain currencies could be in the spotlight next week. In particular, the yen continues to attract market interest, as the post-election rally appears to be reversing after testing the 152 zone.
Japanese PM Takaichi is preparing for her second term, with investors gradually questioning the implementation of her pre-election promises and their impact on the debt burden. The leader of Ishin, the junior coalition partner, has touted the idea of using the vast foreign exchange reserves to cover funding needs without tapping the bond market, but the implementation of this idea might not be so straightforward.
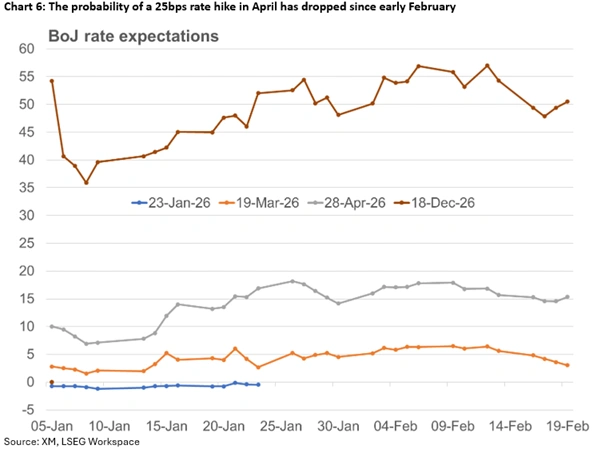
In the meantime, speculation is rife about the timing of the BoJ’s next rate hike. With the data softening lately, a weaker-than-forecast Tokyo CPI on Friday may further dent the chances of a rate move at the April meeting. Notably, it will be interesting to see whether the recent Takaichi-Ueda meeting could alter the BoJ’s current stance going forward. Should this occur, coupled with concerns about the planned aggressive fiscal spending, the door for a dollar/yen rally would be wide open.
Similarly, the aussie remains in the headlines due to the RBA’s hawkish stance and for successfully resisting the current US dollar strength. Following a robust set of labour market prints, the focus shifts to next week’s monthly inflation figures. The last CPI report before the March 17 meeting could go a long way into sealing expectations for a May rate hike, potentially even prompting the RBA to indirectly ‘announce’ this move at the next gathering, and helping aussie/dollar break above the early February 2022 high of 0.7157.
Both the pound and Euro could see increased volatility
Despite the potent retail sales figures, the pound has had a difficult week. Soft data have been added to the recent dovish BoE meeting and last week’s short-term political unrest, pushing the probability of a March rate cut to 78%. That said, despite the myriad of issues, the pound has not fallen off a cliff, partly benefiting from positioning. A potential drop below the 1.3400 zone in pound/dollar, though, could mark the beginning of a sizeable correction.
Positioning appears to be a major issue in euro/dollar as there is an exceptionally large short position against the dollar. This could explain the euro’s recent difficulty in taking advantage of the inflated Fed rate cut expectations.
It has been a quieter period for the eurozone, with data prints unable to materially challenge current ECB rate expectations, keeping the doves quiet. The highlight of next week’s calendar is Friday’s German preliminary CPI report. A very weak print could rejuvenate the ECB doves, mostly to no avail, thereby denting the euro’s appeal.
However, the burning issue appears to be rumours about Lagarde stepping down before November 2027. Could a German finally take the ECB helm, or could a less hawkish option could be explored, ensuring a smooth transition into the new era, and avoiding a rally in the euro? Notably, an early departure by Lagarde would mean that, for the first time ever, both the Fed and ECB heads will be selected/replaced in the same period, adding a rare level of uncertainty to markets.
Weekly Focus – Geopolitics Steals the Spotlight Again
Geopolitical developments in Middle East took centre stage in the markets this week. Despite the slightly optimistic tones of voices after the US-Iran talks ended in Geneva early this week, the US military buildup in the region has continued and the risk of a conflict is hanging in the air. Based on media reports, President Trump has not yet decided whether to attack, but if so, the attack could come soon.
Oil market has started to react to developments in Middle East. This week, Brent broke through USD 70 per barrel level. Unlike in early February, this time around higher oil prices are not driven by a weaker USD. On the contrary, the DXY index rose 1% this week. The fact that implied oil volatility is also up, suggests that this time the price move is primarily driven by a geopolitical risk premium.
In our view, the current market pricing broadly reflects a scenario where Iran's response to any US intervention would remain carefully calibrated - similar to what we saw last June. Thanks to excess supply, the oil market has some buffer against geopolitical shocks for as long as the shocks would be limited in scale and duration. Even limited disruptions in the Strait of Hormuz (SOH) would not devastate markets for as long as oil and gas flows would continue. And for now, tanker traffic seems to have returned to normal levels. That said, in the worst case, a complete closure of the SOH for several days could drive oil price above USD 100 per barrel.
The higher oil price has been one of the factors weighing on euro lately, as Europe's energy imports dependence remains one of its key vulnerabilities. This week, EUR/USD fell below the 1.18 mark. We still think the downside is temporary and now target EUR/USD at 1.25 in 12M.
On data front, focus was on euro area sentiment surveys this week. The German PMIs surprised on the upside, corroborating the story that the German industry is finally recovering. The manufacturing PMI exceeded the watershed 50 level for the first time since June 2022. The French PMI also topped expectations on the composite level, but manufacturing index disappointed by falling back below 50.
The speculation that ECB's President Lagarde would leave office before her term expires also received media attention this week. The rumours have not been confirmed, and in any case, we do not see this as a key market driver.
In the US, we have adjusted our Fed call. We still foresee terminal rate at 3.00-3.25% but have pushed the rate cuts further out, see RtM USD - The Fed will cut in June and September, 17 February. Recent data from the US has again painted a picture of a resilient economy, but while consensus has continued to upgrade GDP projections for this year, we are a bit cautious about whether private consumption can maintain its current strength. This week, we also saw how the economy is starting to rebalance with trade balance re-widening in December as imports volumes are starting to recover from abnormally low levels.
Next week's calendar looks rather empty with the main events being Trump's state of the union speech on Tuesday and EA flash HICP on Friday. Hence, it is more than likely that geopolitics will remain the main market driver.
US: Consumer Spending and Income End 2025 on Softer Footing
Personal income rose 0.3% month-over-month (m/m) in December, in line with market expectations. All gains were in nominal terms, with personal income remaining flat after adjusting for inflation.
Consumer spending was also aligned with market expectations, advancing by 0.4% month-over-month in nominal terms and matching November's pace. Most of the gain, however, was due to higher prices: real spending rose by just 0.1% m/m.
Examining the broad categories, spending on goods declined by 0.5% in real terms, weighed by reduced spending on cars and parts and furniture, while spending on services rose by 0.3% m/m.
With spending slightly outpacing income, the personal saving rate edged lower to 3.6% (down from 3.7% in November and 4.3% a year ago). This marks the lowest level of the saving rate since October 2022.
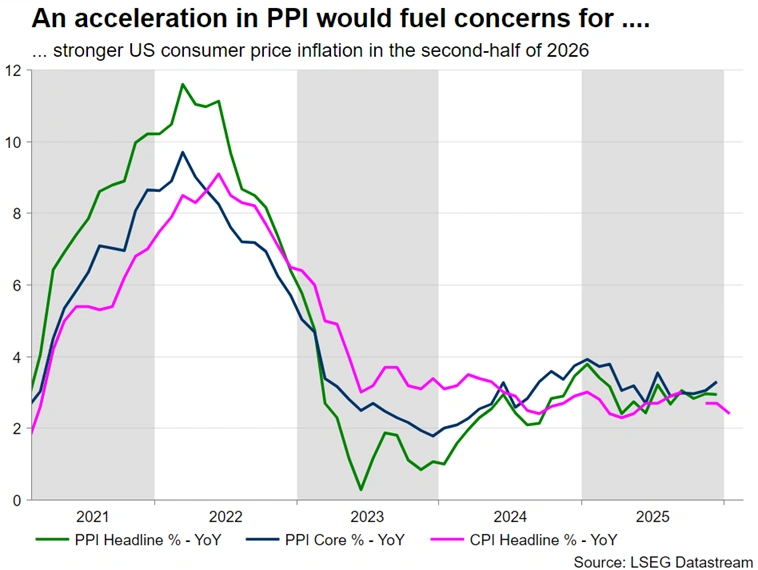
Inflation remains persistently above the Fed's 2% target. Core PCE – the Fed's preferred inflation gauge – rose by 0.4% in December, a notable uptick from 0.2% pace in November. In annual terms, core PCE inflation was up 3.0% year-over-year, up slightly from 2.8% pace seen in November.
Key Implications
Today's release shows that consumers had a bit less spring in their step in the final quarter of 2025 that previously reported. This tells us that while the government shutdown didn't detail consumer spending, it still weighed on activity, with real consumer spending advancing by 2.4% (annualized) in Q4, down from the 3.5% pace seen in Q3. Looking back at 2025, growth in consumer spending averaged 2.7%, down slightly from a 3% pace in 2024, suggesting consumer spending has remained resilient, despite heightened economic uncertainty and slowing labour market.
Looking ahead, we expect consumer spending to remain relatively robust at the start of 2026. Consumers should benefit from past interest rate cuts, some stabilization in the labour market, and wealth gains. The fiscal boost from higher OBBBA-related tax refunds—which could be on average $800–$1,000 higher than last fiscal year—will provide another tailwind to household income and spending (report).
US: Q4 GDP Weaker Than Expected, But Underlying Fundamentals Remain Solid
The U.S. economy expanded by 1.4% quarter-on-quarter (q/q, annualized) in the fourth quarter – below the consensus forecast of 3.0% – and a notable deceleration from Q3's 4.4%.
- The annual average rate of growth for 2025 was 2.2% – down from 2024's 2.8%.
Consumer spending rose by 2.4% q/q, following a stronger gain of 3.5% in Q3. Goods spending was essentially flat on the quarter, while services rose by a healthy 3.4%.
Business investment was up 3.7% q/q, a slight uptick from Q3. In terms of the breakdown, both equipment (+3.2%) and intellectual property products (+7.4%) were higher, while spending on structures (-2.4% q/q) declined for an eighth consecutive quarter. Residential investment (-1.5%) also declined.
Government spending (-5.1%) fell sharply, entirely driven by a pullback in federal outlays (-16.6%) due to the 43-day long government shutdown. Meanwhile, state & local spending rose 2.4%.
International trade had a negligible impact on growth, as a very modest pullback in exports (-0.9%) was largely offset by a similar decline in imports (-1.3%). Inventory investment added a modest 0.2 percentage points to Q4 GDP.
Final sales to private domestic purchasers, a better gauge of underlying demand as it includes only household consumption and fixed investment rose by a healthy 2.4%, following a gain of 2.9% in Q3.
Core PCE inflation – the Fed's preferred gauge – rose 2.7% q/q annualized, down slightly from Q3's 2.9%.
Key Implications
Following a very strong third quarter, economic growth softened by more than expected through the final three months of last year, largely due to a sharp contraction in federal outlays. However, this was a temporary impact related to the government shutdown, and we should see a reversal of those effects in the first quarter. Encouragingly, final sales to private domestic purchasers – a better gauge of underlying demand – still expanded by a healthy 2.4%.
All told, even after accounting for this morning's miss on growth, we still feel that the U.S. economy has entered 2026 with considerable momentum. While headwinds from tariffs and trade policy uncertainty remain, its effects are likely to be eclipsed by fiscal tailwinds from the One Big Beautiful Bill Act, easier financial conditions, and continued investments in AI. Growth is expected to accelerate to 2.7% Q4/Q4 this year – up from 2025's 2.2%.
Canada: Retail Sales End the Year on Weak Footing, Rebound in January
Retail sales fell 0.4% month-on-month (m/m) in December, coming in slightly stronger than Statistics Canada's -0.5% advanced estimate.
In real terms, retail sales volumes were unchanged on the month, indicating December’s headline decline was driven by prices rather than weaker overall activity.
Auto sales were the key swing factor falling 1.6% m/m, with declines across all store types. New car dealers (-1.8% m/m) led the pullback, extending the subsector’s second straight monthly drop.
Receipts at gasoline stations and fuel vendors rose 2.8% m/m in nominal terms, while volumes jumped 4.5% m/m, marking a second consecutive monthly increase and implying stronger demand alongside lower prices.
Core retail sales (excluding motor vehicles and gasoline stations) slipped 0.3% m/m in December, reversing part of November’s 1.5% gain and leaving underlying momentum softer into year-end.
The largest declines were at building material and garden equipment and supplies dealers (-4.0% m/m), following two months of gains. Furniture & home furnishings stores (-1.8%), and electronics & appliance stores (-1.6% m/m) also posted notable declines.
Partially offsetting these losses were gains at miscellaneous retailers (+1.2%), sporting goods, hobby, book & music stores (+0.6%), and general merchandise stores (+0.2% m/m).
Retail e-commerce sales increased 3.6% m/m in December, lifting its share of total retail trade to 6.1% from 5.8% in November.
Statistics Canada’s advance estimate suggests retail sales increased 1.5% m/m in January.
Key Implications
December capped off what was already a soft quarter. The weakness was largely driven by autos, which were a key drag and are likely to weigh on durable goods spending. As we argued in our recent report, new vehicle sales are expected to fall in 2026, as tariff-related supply chains remain a headwind for consumption. Excluding autos, however, sales volumes ended the year on a firmer footing and if the advanced estimate is any guide, the start of the new year could prove fairly strong.
Our outlook for Q4 real consumption growth remains subdued, tracking at a below-trend pace of 0.6% (quarter-on-quarter, annualized). Services are still expected to be the main driver in Q4 and our internal credit and debit card data suggest some year-end momentum spilling into January. That said, the pickup is unlikely to be strong enough to lift overall consumption meaningfully above a below-trend pace.
EUR/USD Mid-Day Outlook
Daily Pivots: (S1) 1.1743; (P) 1.1775; (R1) 1.1809; More….
EUR/USD's fall from 1.2081 is in progress and intraday bias remains on the downside. Sustained trading below 55 D EMA (now at 1.1763) will raise the chance of reversal on rejection by 1.2, and target 1.1576 support for confirmation. On the upside, above 1.1806 minor resistance will turn intraday bias neutral first. But risk will stay mildly on the downside as long as 1.1928 resistance holds, in case of recovery.
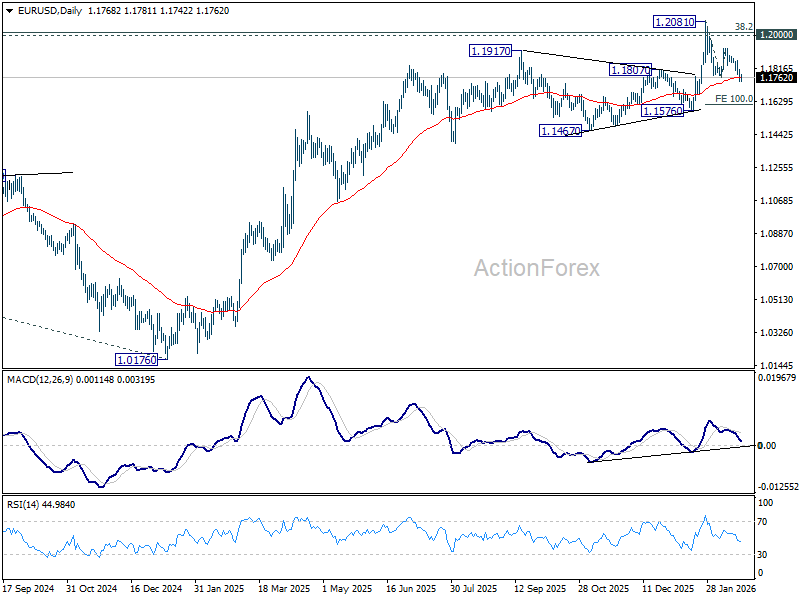
In the bigger picture, as long as 55 W EMA (now at 1.1485) holds, up trend from 0.9534 (2022 low) is still in favor to continue. Decisive break of 1.2 key psychological level will add to the case of long term bullish trend reversal. Next medium term target will be 138.2% projection of 0.9534 to 1.1274 from 1.0176 at 1.2581. However, sustained trading below 55 W EMA will argue that rise from 0.9534 has completed as a three wave corrective bounce, and keep long term outlook bearish.

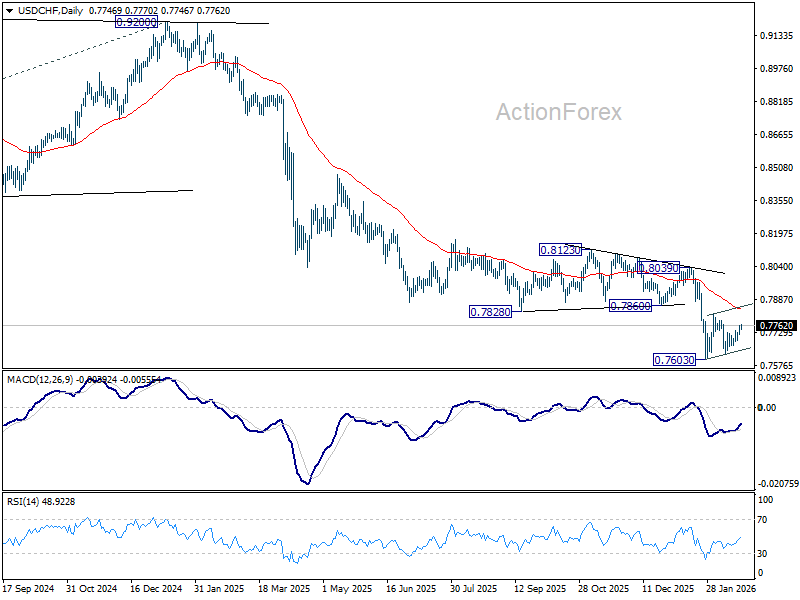
USD/CHF Mid-Day Outlook
Daily Pivots: (S1) 0.7726; (P) 0.7745; (R1) 0.7768; More….
USD/CHF is still extending consolidation pattern from 0.7603 and intraday bias stays neutral. While stronger rebound cannot be ruled out, upside should be limited by 55 D EMA (now at 0.7838) to complete the pattern. On the downside, break of 0.7603 will resume larger down trend, and target 0.7382 projection level next. However, sustained break of 55 D EMA will indicate that a larger scale corrective bounce in underway and target 0.8039 resistance next.
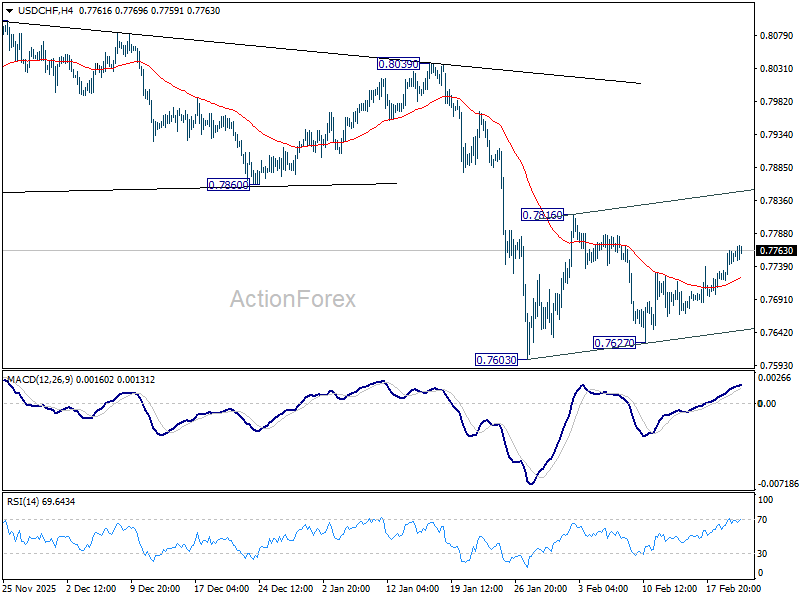
In the bigger picture, down trend from 1.0342 (2017 high) is still in progress. Next target is 100% projection of 1.0146 (2022 high) to 0.8332 from 0.9200 at 0.7382. In any case, outlook will stay bearish as long as 0.8123 resistance holds.