
Sample Category Title
USD/JPY Mid-Day Outlook
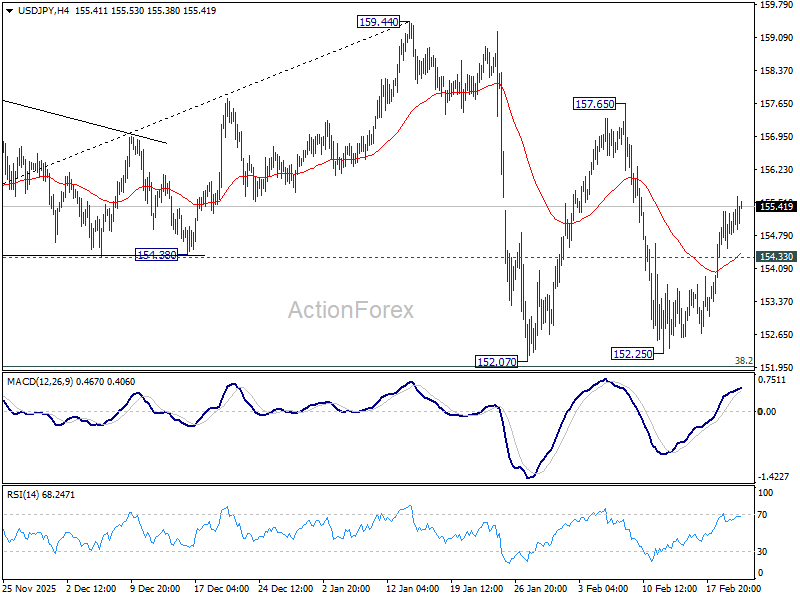
Daily Pivots: (S1) 154.58; (P) 154.96; (R1) 155.38; More...
Intraday bias in USD/JPY remains on the upside at this point, as rise from 152.25 is still in progress to 157.65 resistance. Break there will target a retest on 159.44 high. On the downside, below 154.33 minor support will turn intraday bias neutral and bring consolidations. Overall, with 38.2% retracement of 139.87 to 159.44 at 151.96 intact rise from 139.87 is expected to resume through 159.44 at a later stage.
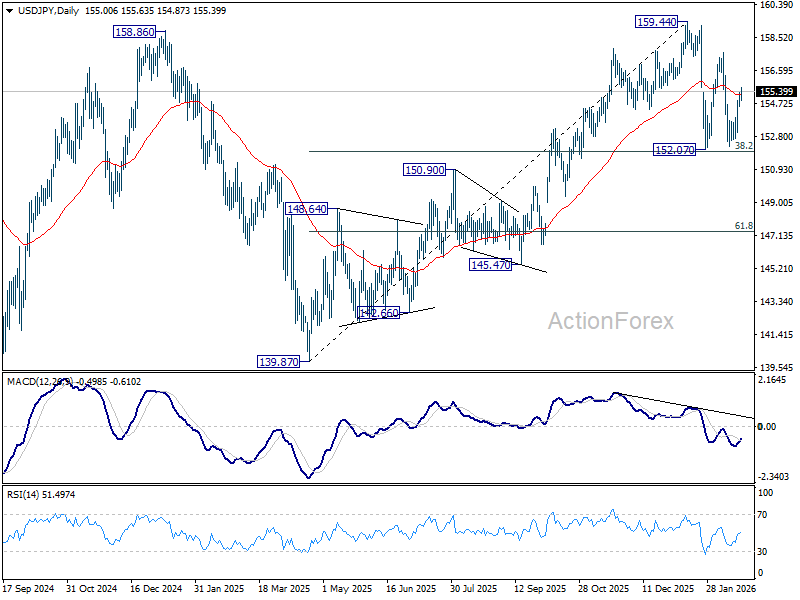
In the bigger picture, outlook is unchanged that corrective pattern from 161.94 (2024 high) should have completed with three waves at 139.87. Larger up trend from 102.58 (2021 low) could be ready to resume through 161.94. This will remain the favored case as long as 55 W EMA (now at 151.77) holds. However, sustained break of 55 W EMA will argue that the pattern from 161.94 is extending with another falling leg.
Sterling Outperforms on PMI Resilience, Dollar Holds Firm Despite Mixed US Data
Sterling leads the currency markets today, buoyed by stronger-than-expected UK PMI and retail sales data that reinforced the narrative of economic resilience. The rebound in business activity helped offset lingering concerns generated earlier in the week by softer labor and inflation figures.
For the BoE this means policy easing can proceed cautiously. A March rate cut remains likely. Yet, a measured pace of one 25bps cut per quarter still appears plausible. There is little evidence that the economy is deteriorating sharply enough to warrant aggressive action. Instead, the BoE may continue to recalibrate policy cautiously as disinflation progresses.
In the US, Dollar remains generally firm, though upward momentum is beginning to lose steam. Earlier gains were fueled by hawkish FOMC minutes and strong jobless claims data, reinforcing expectations that rate cuts are not imminent. The Q4 GDP slowdown to 1.4% was disappointing, but much of the weakness stemmed from the temporary government shutdown and a drop in exports. Underlying domestic demand remained more resilient than the headline suggests.
Personal spending continued to expand steadily, and inflation readings—both headline and core PCE—picked up in December. That combination limits any urgency for the Fed to bring forward rate cuts. As a result, market pricing remains anchored around a likely mid-year easing move rather than an imminent shift. There is little additional pressure on the Fed to accelerate its timeline.
For the week so far, Dollar remains the strongest performer, followed by Aussie and Loonie. Yen sits at the bottom of the table, trailed by Kiwi and Sterling, despite today’s rebound. Euro and Swiss Franc are positioned in the middle.
In Europe, at the time of writing, FTSE is up 0.43%. DAX is up 0.21%. CAC is up 0.71%. UK 10-year yield is down -0.008 at 4.362. Germany 10-year yield is down -0.009 at 2.738. Earlier in Asia, Nikkei fell -1.12%. Hong Kong HSI fell -1.1%. China was still on holiday. Singapore Strait Times rose 0.32%. Japan 10-year JGB yield fell -0.032 to 2.109.
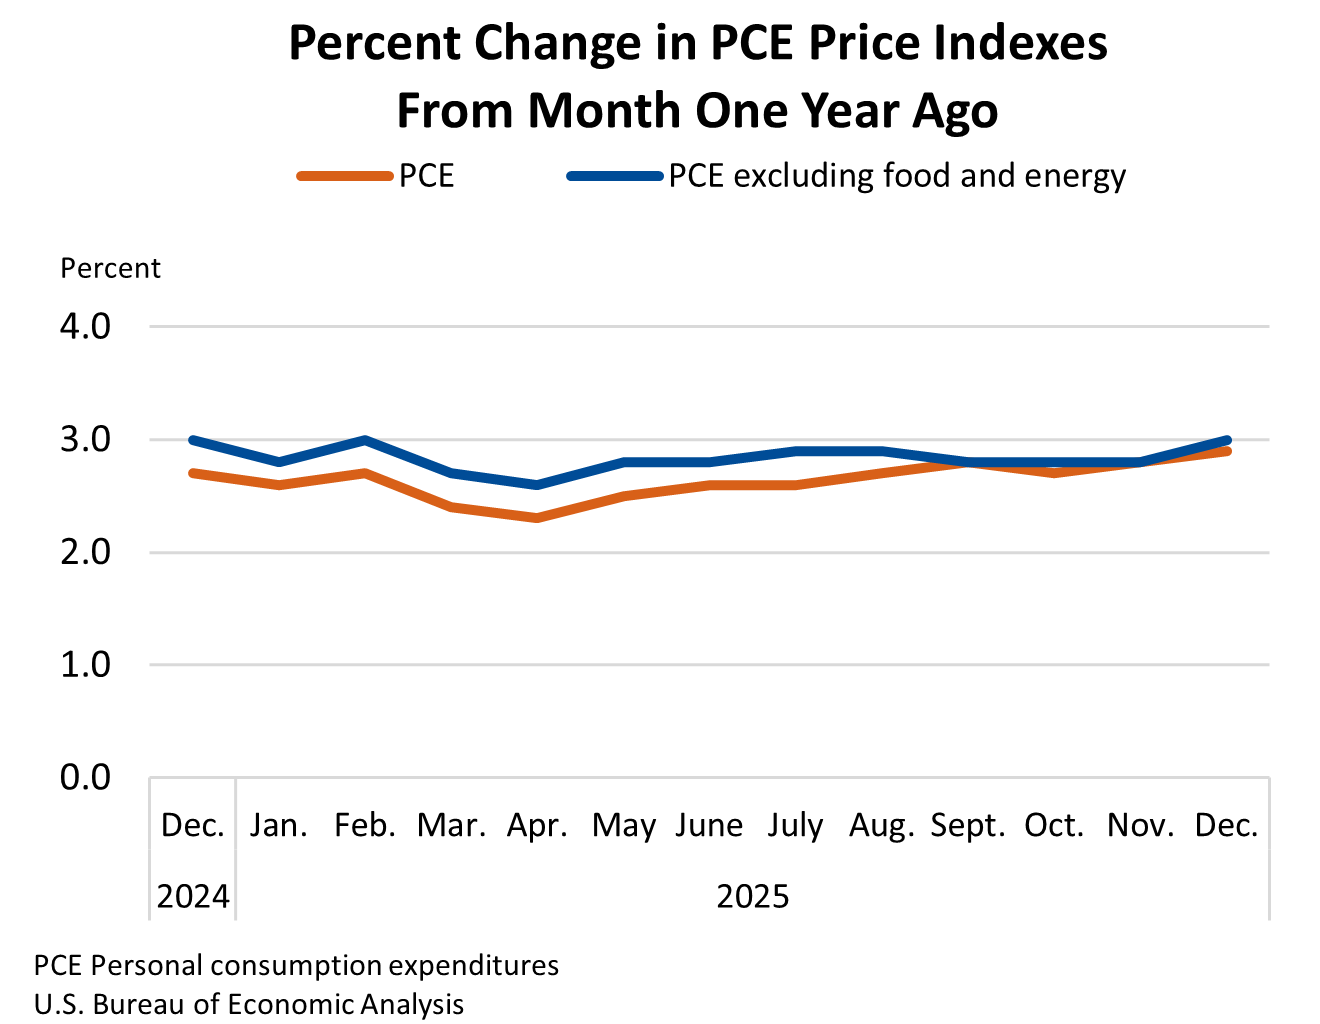
US income and spending rise in December, PCE inflation picks up
US personal income rose by USD 86.2B, or 0.3% mom in December, supported mainly by gains in compensation and higher government social benefits. Personal spending increased by USD 91.0B, or 0.4% mom. The rise was driven by a solid rebound in services outlays (+USD 98.5B), which more than offset a decline in goods spending (-USD 7.5B).
Inflation pressures, however, picked up at the margin. PCE price index rose 0.4% mom, with core PCE also up 0.4% mom. On an annual basis, headline PCE accelerated to 2.9% yoy from 2.8%, well above expectations, while core PCE ticked up from 2.8% yoy to 3.0%. Both matched expectations.
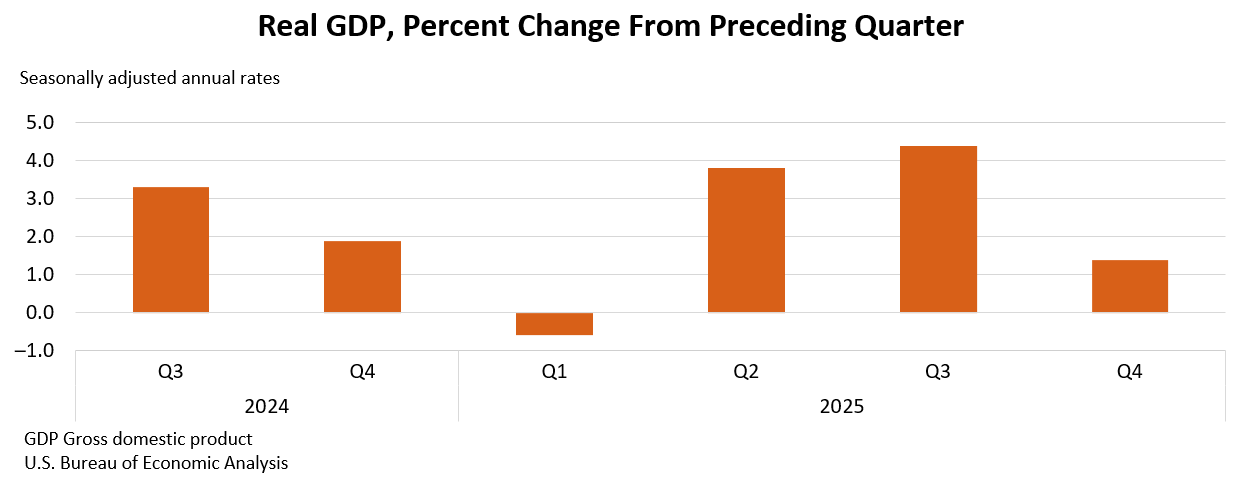
US Q4 GDP growth slows sharply to 1.4% annualized, shutdown and exports weigh
US economic growth decelerated markedly in the Q4 2025, with real GDP expanding at an annualized pace of 1.4%, well below expectations of 2.9%. The slowdown is significant compared with the 4.4% surge recorded in Q3.
Growth was supported by resilient consumer spending, particularly in services such as healthcare, alongside continued business investment. However, these gains were largely offset by sharp declines in federal government spending following the 43-day shutdown, as well as weaker exports.
On inflation, the PCE price index rose 2.9% in Q4, while core PCE increased 2.7%.
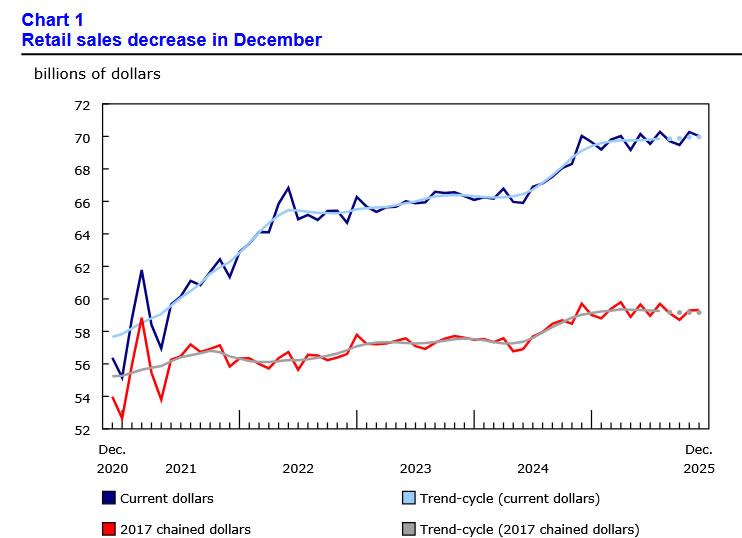
Canada retail sales slip -0.4% mom in December, January rebound expected
Canada’s retail sales declined -0.4% mom in December to CAD 70.0B, slightly better than the -0.5% drop expected. The pullback marks a modest softening in year-end consumer activity, though the headline miss was not as severe as feared.
Core retail sales, which exclude gasoline and motor vehicles, fell -0.3% mom, weighed heavily by a sharp -4.0% contraction in building materials and garden equipment. However, excluding motor vehicle and parts dealers alone, sales edged up 0.1%, suggesting underlying consumer demand was not uniformly weak.
Nevertheless, Statistics Canada’s advance estimate for January points to a strong rebound, with sales projected to rise 1.5% mom.
Eurozone manufacturing returns to growth, PMI hits 44-month high
Eurozone PMI Manufacturing rose from 49.5 to 50.8 in February, moving back into expansion territory and reaching its highest level in 44 months. PMI Services edged up from 51.6 to 51.8. PMI Composite climbed from 51.3 to 51.9.
According to Hamburg Commercial Bank’s Cyrus de la Rubia, this could mark a potential "turning point" for the manufacturing sector. Manufacturing has been a persistent drag since mid-2022, and although the index briefly crossed 50 last August, this time the foundation appears stronger. New business improved across both manufacturing and services, pointing to continued expansion in coming months.
Germany is playing a central role in the improved outlook. Higher public spending on infrastructure and defence, along with firmer external demand, are supporting industrial activity. However, de la Rubia cautioned that overall growth momentum has softened slightly compared with the fourth quarter, suggesting expansion remains moderate rather than accelerating.
Price pressures in services — closely watched by ECB — "relaxed a bit". Nevertheless, service inflation remains elevated enough to discourage a shift in policy stance. With activity stable and inflation not yet fully subdued, ECB appears inclined to keep rates steady for now.
UK PMI composite rises to 53.9, consistent with over 0.3% Q1 GDP growth
UK business activity continued to expand in February, with PMI Manufacturing rising from 51.8 to 52.0, marking an 18-month high. PMI Services edged slightly lower from 54.0 to 53.9. PMI Composite improved from 53.7 to 53.9, reaching its strongest level in 22 months.
According to S&P Global’s Chris Williamson, the data point to an "encouraging start" to the year. Output growth across both manufacturing and services has accelerated in January and February. Current readings are consistent with GDP rising just over 0.3% in the first quarter if momentum carries through March.
For the BoE, while firmer activity will be welcomed, relatively modest price pressures and ongoing labor market weakness may keep pressure on BoE to consider further easing.
UK retail sales surge 1.8% in January, strongest since May 2024
UK retail sales volumes jumped 1.8% mom in January, far exceeding expectations of 0.2% and marking the largest monthly increase since May 2024. The rebound suggests consumers began the year on firmer footing despite broader concerns over slowing growth.
On an annual basis, sales volumes rose 4.5% yoy, pointing to solid underlying demand. Over the three months to January, volumes edged up 0.1% compared with the prior three-month period and were 2.6% higher than a year earlier, indicating steady momentum rather than a one-off spike.
The data offer a counterbalance to recent signs of labor market softening and cooling inflation. While markets continue to price a March rate cut from BoE, resilient consumer spending may temper expectations for an aggressive easing cycle, particularly if inflation remains sticky in services.
Japan's CPI slows to 1.5% in January, core measures ease further
Japan’s headline CPI slowed to 1.5% yoy in January from 2.1%, falling below the BoJ’s 2% target for the first time in 45 months. Core CPI (excluding fresh food) declined to 2.0% from 2.4%, while core-core inflation eased to 2.6% from 2.9%, signaling broader moderation in underlying price pressures.
The slowdown was largely driven by energy, where costs dropped -5.2% yoy after a -3.1% fall in December. Goods inflation cooled sharply from 2.7% to 1.6%. In contrast, services inflation remained steady at 1.4%, suggesting domestic wage-driven price gains have yet to accelerate meaningfully.
Food inflation remains elevated but is gradually cooling. Prices excluding fresh items rose 6.2% yoy, down from 6.7%. Rice inflation slowed for an eighth consecutive month to 27.9%.
Japan PMI composite jumps to 53.8, export demand surges
Japan’s private sector gathered further momentum in February, with PMI Manufacturing rising from 51.5 to 52.8 and PMI Services edging up to 53.8. PMI Composite climbed from 53.1 to 53.8, marking the strongest expansion since May 2023 and signaling a more broad-based recovery.
According to S&P Global’s Annabel Fiddes, the upturn was supported by firmer demand both domestically and overseas. Total new orders expanded at the quickest pace since May 2023, while manufacturers recorded the strongest increase in export work in eight years.
Stronger sales pushed capacity utilization higher, with backlogs rising at a record pace. Firms responded by increasing hiring, while improved demand allowed businesses to regain some pricing power despite persistent cost pressures. Business confidence also strengthened, supported by new product launches, technology demand and optimism following Prime Minister Sanae Takaichi’s landslide election victory.
Australia PMI composite dives to 52.0 in February, cost pressures reaccelerate
Australia’s February flash PMIs signaled a slowdown in private sector momentum. PMI Manufacturing slipped from 52.3 to 51.5, while PMI Services dropped sharply from 56.3 to 52.2. As a result, PMI Composite fell from 55.7 to 52.0, indicating growth continued but at a much more modest pace.
According to S&P Global’s Eleanor Dennison, the private sector was unable to sustain the strong start to the year. Both manufacturing and services recorded softer expansions in output and new orders, with the services sector experiencing the more pronounced pullback.
However, inflationary pressures remain evident. Firms reported elevated wage burdens and higher supplier costs, pushing both input and output price inflation to five-month highs. Despite softer new business growth, job creation accelerated to an 11-month high, underscoring labor market tightness.
RBNZ’s Breman confident inflation will return to target, policy not on preset path
RBNZ Governor Anna Breman said in speech that the central bank remains confident inflation will return to target despite its current 3.1% reading. She expects inflation to move back inside the 1–3% band in the first quarter and ease toward the 2% midpoint over the 12 months. That formed a key basis for the decision to keep the OCR unchanged at 2.25% this week.
Breman stressed that policymakers needed to determine whether the recent uptick in inflation signaled broader price pressures or merely a "temporary bump". She pointed to global factors lifting tradables prices, while non-tradables inflation continues to decline, albeit slowly.
The economy expanded in the September quarter and indicators suggest recovery is continuing into early 2026. With unemployment still elevated and wage growth subdued, the RBNZ sees room for recovery without reigniting inflation.
At the same time, she reiterated that monetary policy is "not on a preset course".
NZ trade deficit at NZD -519m as China flows diverge
New Zealand’s goods exports rose 2.6% yoy in January to NZD 6.2B, up NZD 157m from a year earlier. Goods imports increased 1.9% yoy to NZD 6.7B, up NZD 126m. The result was a monthly trade deficit of NZD -519m.
By destination, export performance was mixed. Shipments to China, New Zealand’s largest trading partner, fell NZD -118m (-7.0%) yoy. In contrast, exports to Australia jumped NZD 134M (+20%), while flows to the EU (+16%) and Japan (+11%) also posted solid gains. Exports to the US were broadly flat.
On the import side, China led the increase, with imports surging NZD 346m (+24%) yoy. South Korea also recorded a strong rise (+36%), while imports from the EU edged higher. Meanwhile, purchases from the US (-17%) and Australia (-8.1%) declined.
The data suggest stable overall trade volumes but highlight shifting bilateral flows, particularly with China, which may have implications for growth in coming months.
GBP/USD Mid-Day Outlook
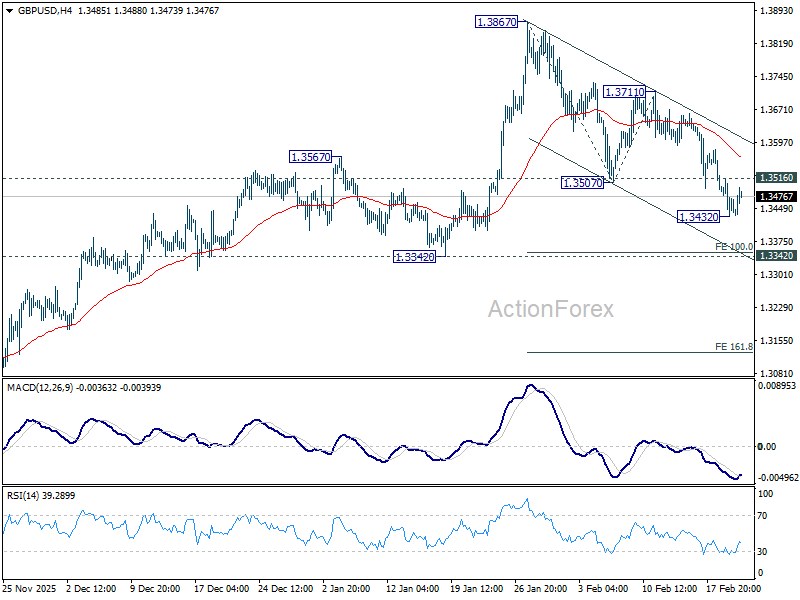
Daily Pivots: (S1) 1.3428; (P) 1.3473; (R1) 1.3511; More...
A temporary low is in place at 1.3432 in GBP/USD with 4H MACD crossed above signal line. Intraday bias is turned neutral for consolidations. But risk will stay on the downside as long as 1.3711 resistance holds. Below 1.3432 will target 1.3342 support next. Current development suggests that the decline is at least correcting the uptrend from 1.2099. Break of 1.3342 support will solidify this case, and target 161.8% projection of 1.3867 to 1.3507 from 1.3711 at 1.3129.
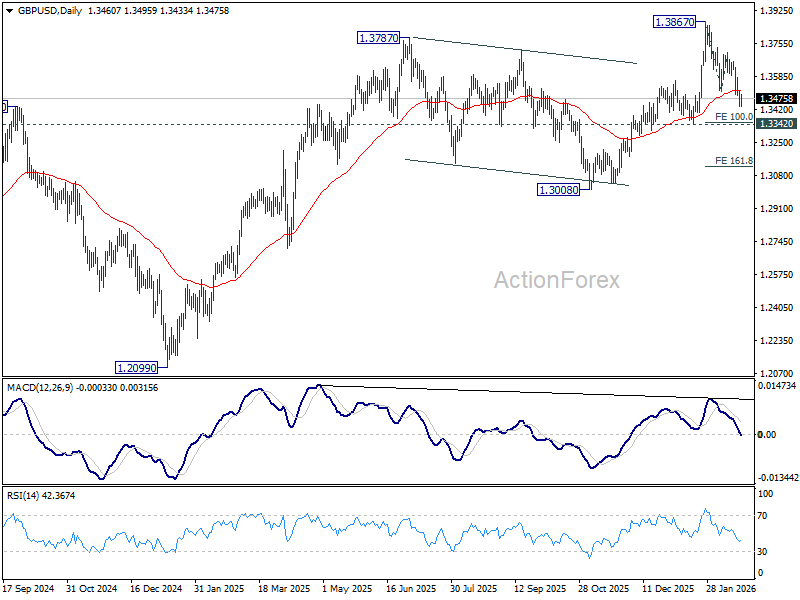
In the bigger picture, rise from 1.0351 (2022 low) still in progress and should target 1.4284 key resistance (2021 high). Decisive break there will add to the case of long term bullish trend reversal. For now, outlook will stay bullish as long as 1.3008 support holds, even in case of deep pullback.

GBP/USD Mid-Day Outlook
Daily Pivots: (S1) 1.3428; (P) 1.3473; (R1) 1.3511; More...
A temporary low is in place at 1.3432 in GBP/USD with 4H MACD crossed above signal line. Intraday bias is turned neutral for consolidations. But risk will stay on the downside as long as 1.3711 resistance holds. Below 1.3432 will target 1.3342 support next. Current development suggests that the decline is at least correcting the uptrend from 1.2099. Break of 1.3342 support will solidify this case, and target 161.8% projection of 1.3867 to 1.3507 from 1.3711 at 1.3129.

In the bigger picture, rise from 1.0351 (2022 low) still in progress and should target 1.4284 key resistance (2021 high). Decisive break there will add to the case of long term bullish trend reversal. For now, outlook will stay bullish as long as 1.3008 support holds, even in case of deep pullback.
Canada retail sales slip -0.4% mom in December, January rebound expected
Canada’s retail sales declined -0.4% mom in December to CAD 70.0B, slightly better than the -0.5% drop expected. The pullback marks a modest softening in year-end consumer activity, though the headline miss was not as severe as feared.
Core retail sales, which exclude gasoline and motor vehicles, fell -0.3% mom, weighed heavily by a sharp -4.0% contraction in building materials and garden equipment. However, excluding motor vehicle and parts dealers alone, sales edged up 0.1%, suggesting underlying consumer demand was not uniformly weak.
Nevertheless, Statistics Canada’s advance estimate for January points to a strong rebound, with sales projected to rise 1.5% mom.
US income and spending rise in December, PCE inflation picks up
US personal income rose by USD 86.2B, or 0.3% mom in December, supported mainly by gains in compensation and higher government social benefits. Personal spending increased by USD 91.0B, or 0.4% mom. The rise was driven by a solid rebound in services outlays (+USD 98.5B), which more than offset a decline in goods spending (-USD 7.5B).
Inflation pressures, however, picked up at the margin. PCE price index rose 0.4% mom, with core PCE also up 0.4% mom. On an annual basis, headline PCE accelerated to 2.9% yoy from 2.8%, well above expectations, while core PCE ticked up from 2.8% yoy to 3.0%. Both matched expectations.
US Q4 GDP growth slows sharply to 1.4% annualized, shutdown and exports weigh
US economic growth decelerated markedly in the Q4 2025, with real GDP expanding at an annualized pace of 1.4%, well below expectations of 2.9%. The slowdown is significant compared with the 4.4% surge recorded in Q3.
Growth was supported by resilient consumer spending, particularly in services such as healthcare, alongside continued business investment. However, these gains were largely offset by sharp declines in federal government spending following the 43-day shutdown, as well as weaker exports.
On inflation, the PCE price index rose 2.9% in Q4, while core PCE increased 2.7%.
Crypto: Bearish Consolidation Continues
Market Overview
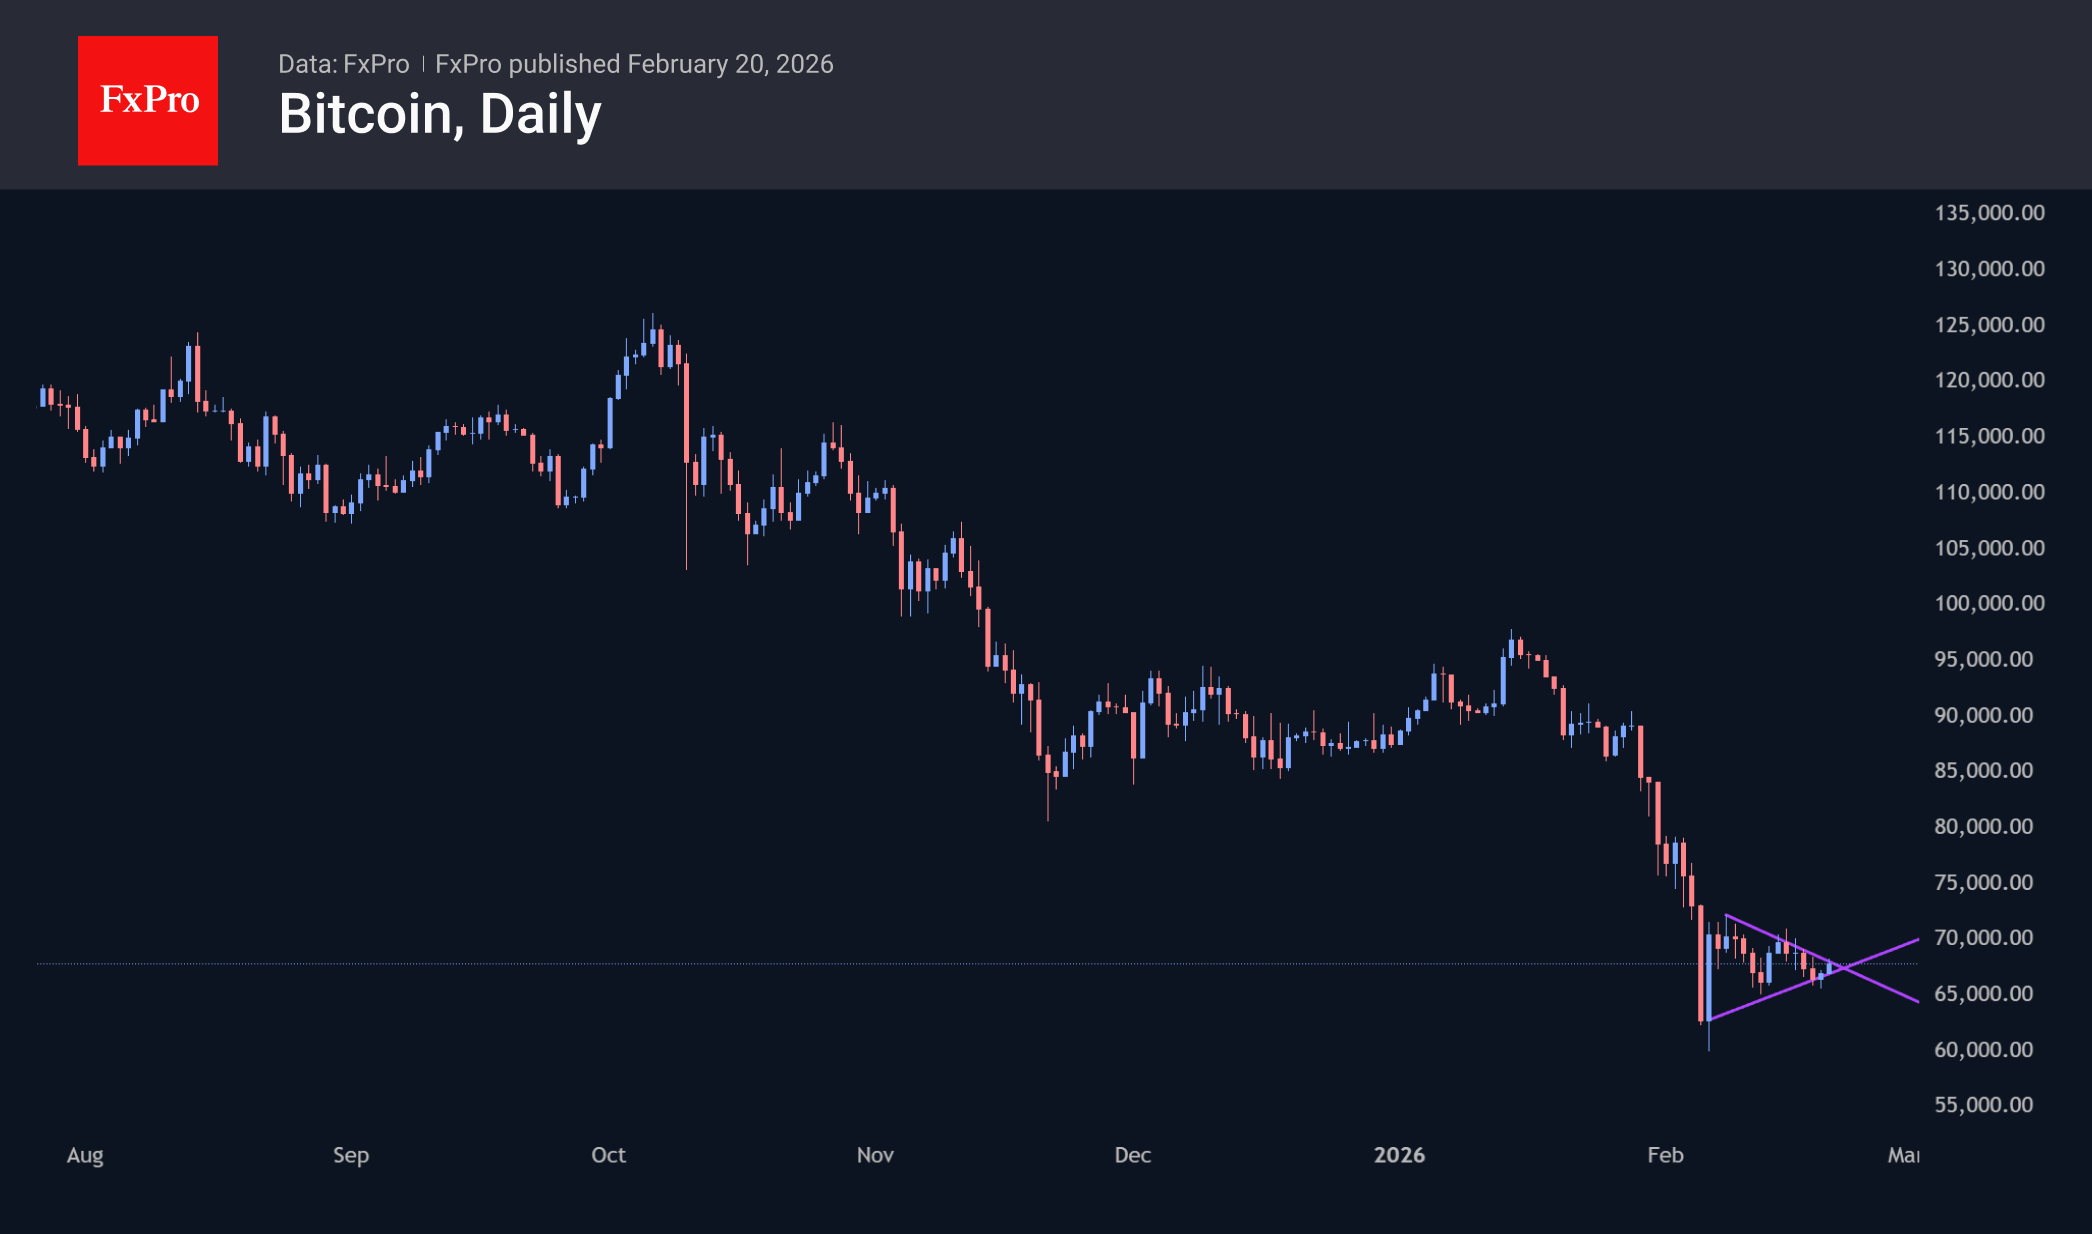
The crypto market has gained 1.3% over the past 24 hours to $2.33T, rebounding from Thursday’s local lows of $2.27T. The range of fluctuations continues to narrow, with a sequence of rising local lows. By contrast, the last two local highs were roughly at the same level of $2.40T. Trump Coin has rallied, gaining nearly 10% in 24 hours, with Solana also performing well (+3.4%). Dash and Toncoin are down 3.4% and 1.5% over the same period, at the other end of the spectrum among top coins.
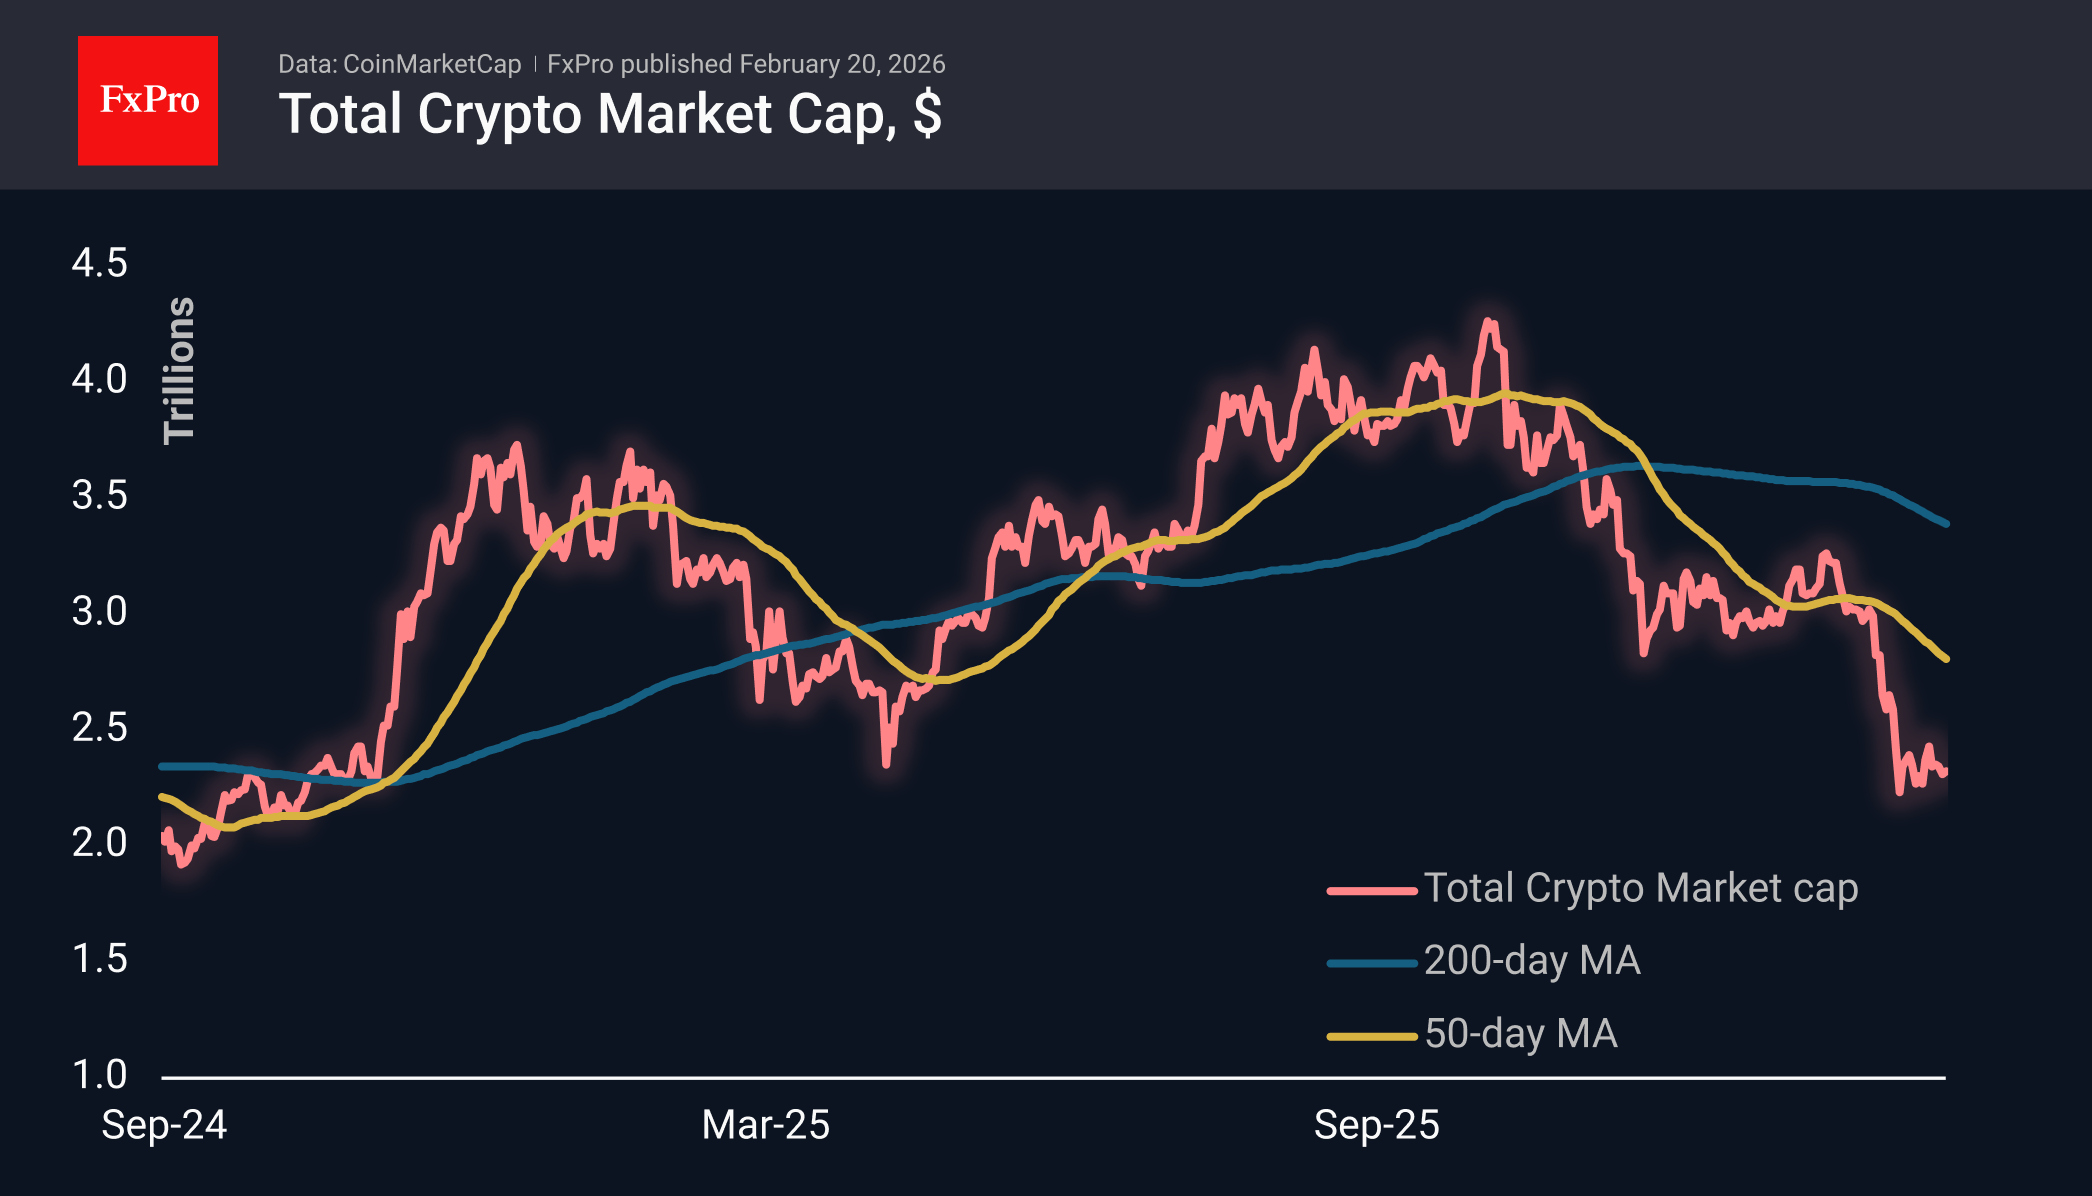
Bitcoin has been gaining since the start of active trading in the US on Thursday, adding just over 3.5% during this time and bringing the price to $67.9K. However, this is only a recovery to the levels seen at the beginning of the week, so it is too early to talk about a confident rebound. A bearish pennant pattern is forming on the daily candlestick chart. It will be confirmed if the price declines below $65.7K and cancelled if it rises above $70K. Taking a step back, the current move appears to be part of a protracted consolidation in the $60-70K range, a critical zone from a historical point of view.
News Background
Ethereum developers have presented an updated development plan for 2026. The Ethereum Foundation is focusing on scaling, improving the user experience and protecting the blockchain. The next major network update will be Glamsterdam, scheduled for the first half of 2026, followed by Hegota.
The Chicago Mercantile Exchange (CME) intends to open round-the-clock trading in cryptocurrency futures and options on 29 May. The expansion of trading is still under review by regulators.
The non-profit organisation Aptos Foundation has announced a significant reform of its tokenomics to strengthen the deflation of the Aptos (APT) cryptocurrency. Among the key initiatives is the introduction of an emission limit of 2.1 billion APT (currently, there is no limit).
The pressure from altcoin sellers has reached a five-year high, according to CryptoQuant. There are simply no buyers for alternative cryptocurrencies.
On 19 February, following another recalculation, the difficulty of mining Bitcoin jumped by 14.73%, a record increase in five years. According to Cloverpool, the indicator rose to 144.40 T. Over the past 10 days, miners in the United States have sharply increased the capacity of equipment connected to mining after previously disconnecting it due to frosty weather.
US Dollar Index Pauses at 98.00 as Key Data Looms
- USDX five‑day winning streak capped between key SMAs.
- Faces strong resistance near 98.00 ahead of GDP and PCE releases.
- Momentum indicators reflect a wait‑and‑see stance.
The US Dollar Index, poised on Friday to record its strongest weekly performance since October – supported by better‑than‑expected economic data, a more hawkish Fed outlook, and simmering tensions between the US and Iran – is posting a fifth consecutive daily gain, hovering just below the four‑week high near the psychologically significant 98.00 level.
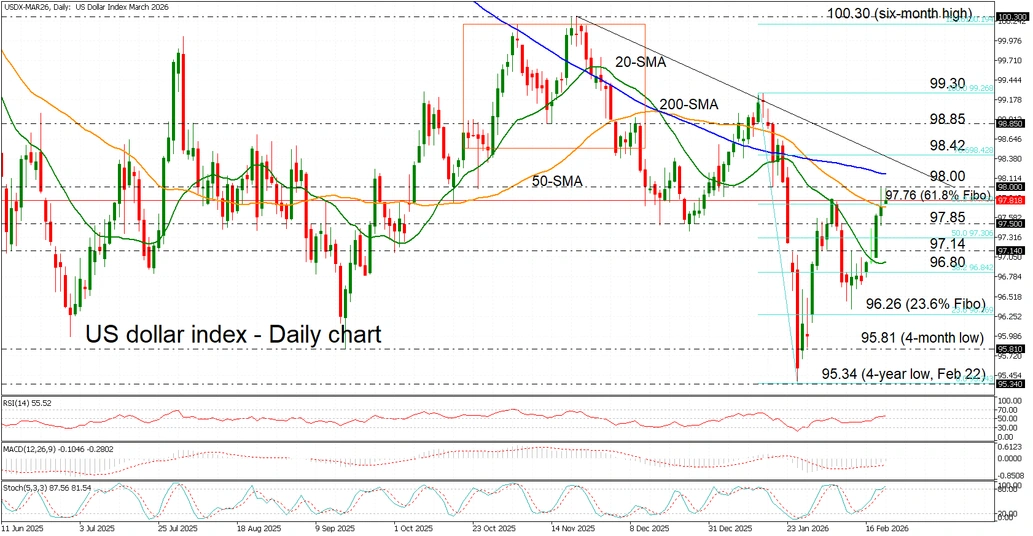
However, the upside has stalled after a close above the 50‑day simple moving average (SMA) as market focus now turns to the release of the US core PCE price index and advance fourth‑quarter GDP figures later in the day, which could determine the next directional move.
The momentum indicators reflect a wait‑and‑see stance, with the RSI flatlining above neutral, the stochastics easing at the overbought threshold, and the MACD edging higher above its signal line but still below zero – collectively warranting near‑term caution.
That said, the index has retraced more than 61.8% of the January 15-27 pullback to multi‑year lows, with price action currently sitting at that key retracement level near 97.76. This area clusters with the 50‑day SMA and has capped gains since late January. Beyond this region, resistance stands between 98.00-98.42, which encapsulates the 200‑day SMA, followed by 98.85 before a full retracement toward the January highs at 99.30.
Conversely, support is found at 97.50, followed by the 20‑day SMA near 97.00, where a doji candle had formed earlier this week before the strong rebound. Further support lies at 96.80 and the 23.6% Fibonacci level at 96.26, positioned just above the monthly lows and helping shield price action from a deeper slide back toward multi‑year lows.
All in all, the US dollar index is clinging to recent gains and on track for its best week in more than four months. However, strong resistance at 98.00 could continue to cap the recovery if the catalysts driving the latest upside begin to lose momentum.
Silver Price Breaks February Resistance Line
As seen on the XAG/USD chart, silver has today breached the upper boundary of the descending channel formed by February’s lower highs and lows.
Bullish sentiment is supported by heightened geopolitical tensions and rising demand for safe-haven assets. According to media reports:
- → On Thursday, US President Donald Trump warned Iran that it must reach an agreement on its nuclear programme, or “really bad things” would happen, setting a 10–15 day deadline.
- → In response, Tehran threatened retaliatory strikes on US bases in the region if attacked.
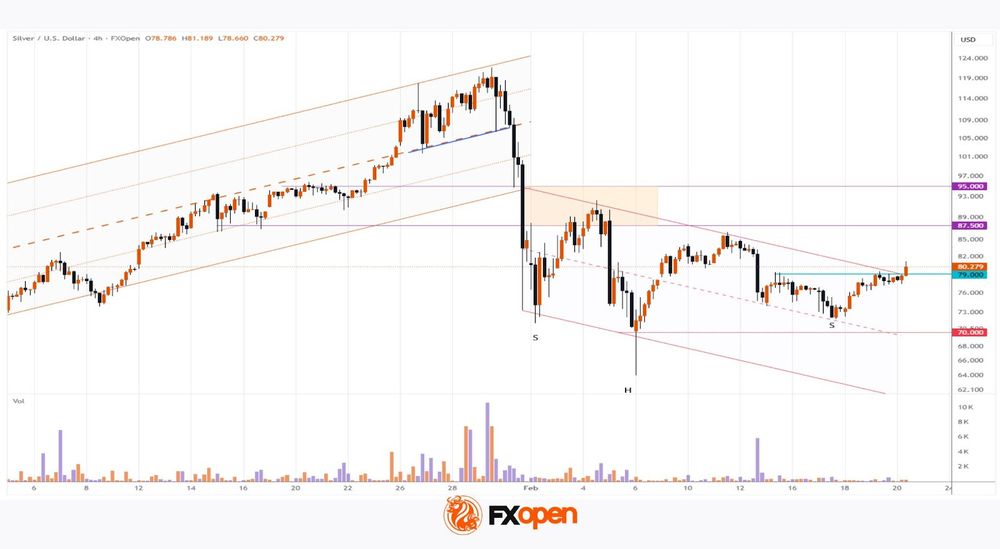
On 11 February, analysing the XAG/USD chart, we noted that silver was consolidating between two key levels:
- → resistance around $87.5–95
- → support near $70
Today’s bullish breakout of the channel’s upper boundary – which acted as resistance in February – can be interpreted as a move towards the $87.5–95 zone.
Confidence for bulls is further reinforced by an inverted head and shoulders (SHS) pattern. If buyers are determined, this should be confirmed by XAG/USD holding above:
- → the channel breakout level near $79
- → the psychological $80 mark.
Start trading commodity CFDs with tight spreads (additional fees may apply). Open your trading account now or learn more about trading commodity CFDs with FXOpen.
This article represents the opinion of the Companies operating under the FXOpen brand only. It is not to be construed as an offer, solicitation, or recommendation with respect to products and services provided by the Companies operating under the FXOpen brand, nor is it to be considered financial advice.
The Market is Seeking a Haven
- JPY and EUR are giving back their safe-haven status to USD.
- USDJPY is rising amid slowing Japan inflation.
Growing geopolitical tensions in the Middle East and the Fed’s reluctance to resume its cycle of monetary expansion are driving the US dollar towards its best weekly performance in four months. According to a Wall Street Journal insider, Donald Trump is weighing a military strike on Iran to force it to sign a nuclear deal. If that doesn’t work, the US will launch a large-scale regime change campaign.
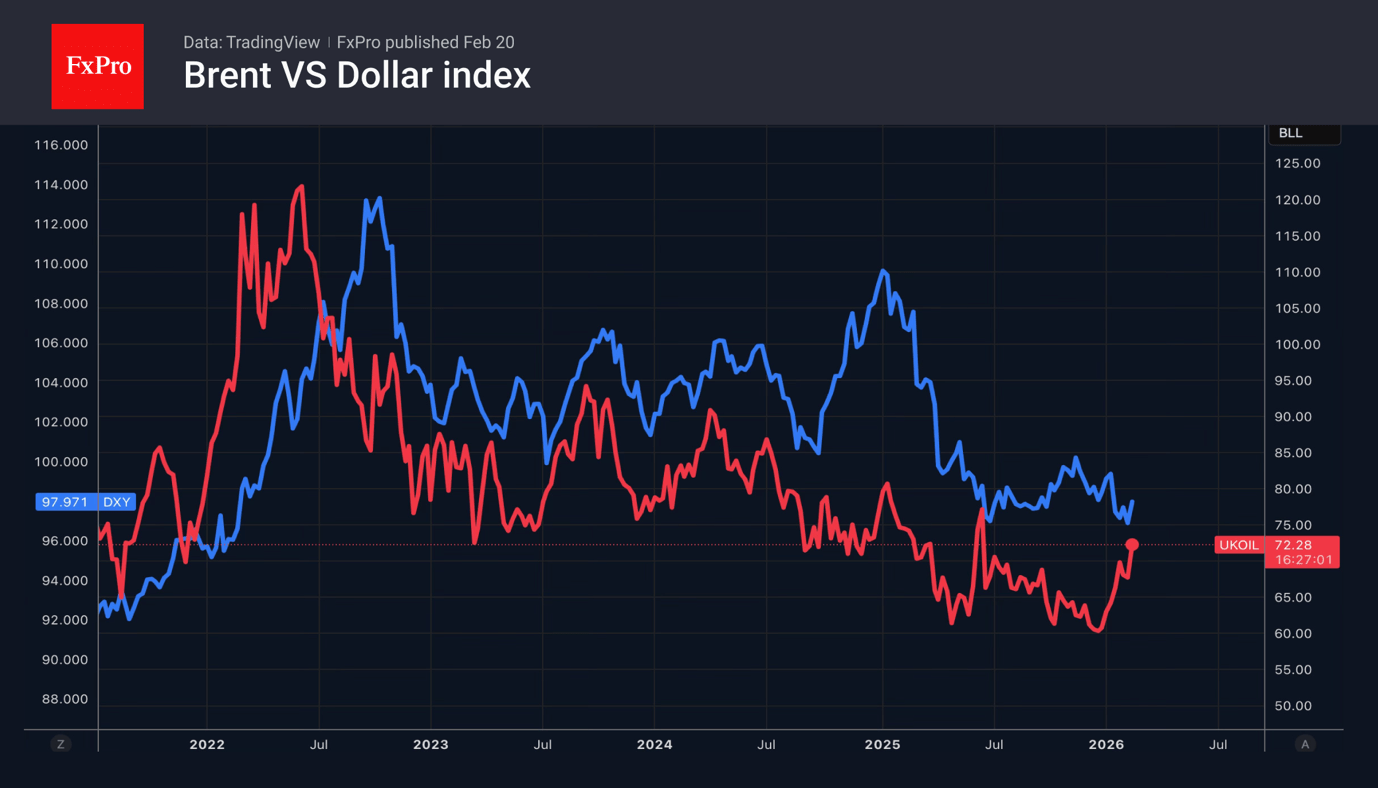
Fears of an escalation of the Middle East conflict have pushed Brent prices to six-month highs. Investors are rushing to buy safe havens. Suddenly, on Forex, one cannot find a better option than the US dollar. The yen and the euro are unable to compete with the greenback. The rise in oil prices will hit Japan and the eurozone, which are heavily dependent on energy imports.
Meanwhile, the drop in jobless claims has become another argument in favour of stabilisation in the US labour market. According to Stephen Mirman, the economy looks better than he had expected, so the Fed might lower rates by 100 bp this year to 2.75%, not by 150 basis points. San Francisco Fed President Mary Daly believes that the Fed should not hold back the economy with high interest rates. However, it should not lower them too much due to still high inflation.
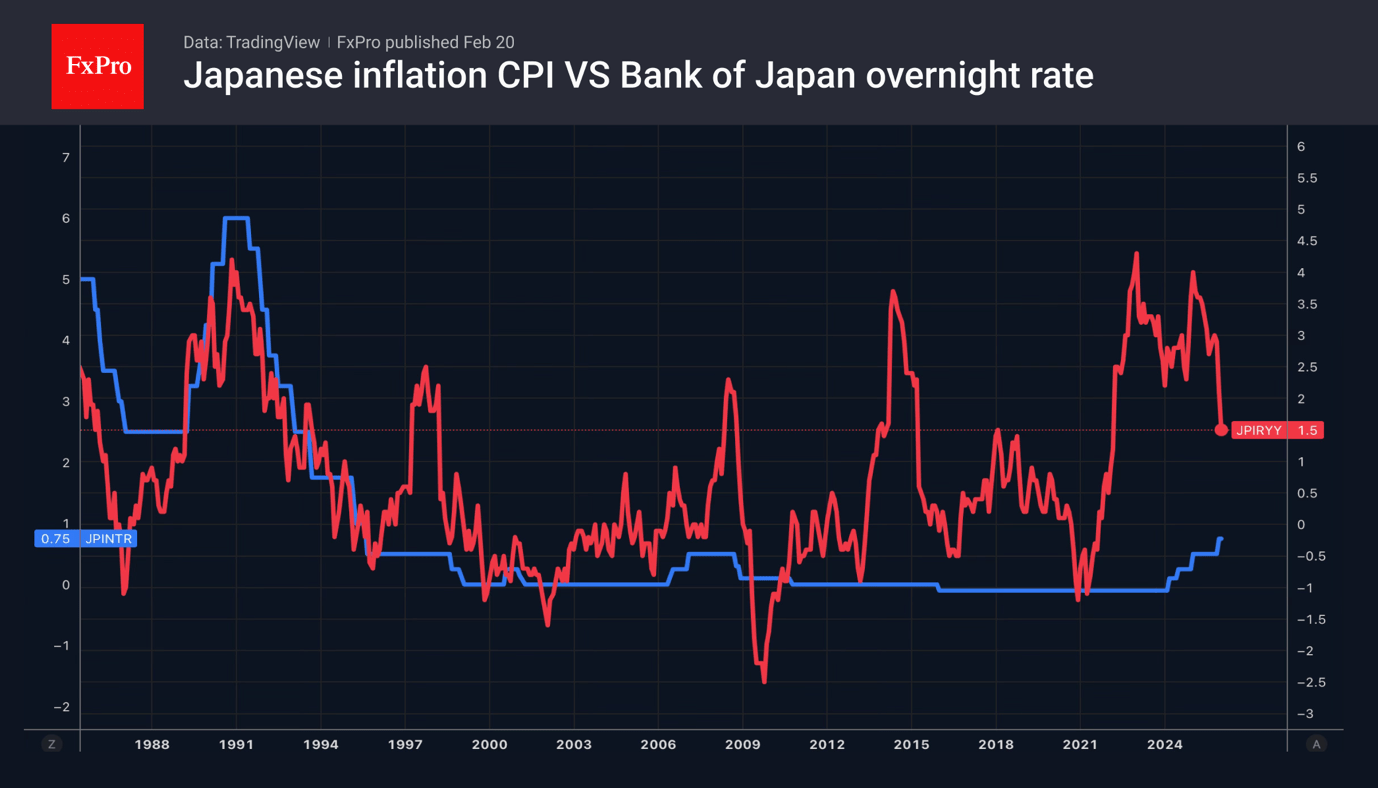
The fall in consumer prices in Japan to 1.5%, the lowest level since March 2022, added fuel to the USDJPY rally. The slowdown in inflation allows the central bank to take its time with raising rates. At the same time, this gives Sanae Takaichi a free hand in expanding fiscal stimulus. The prime minister intends to address parliament and outline her economic policy. Investors fear that excessive stimulus will revive the “Takaichi trade” and sink the yen.
Gold is behaving unusually. It rose on the back of the hawkish surprise in the minutes of the January FOMC meeting, the strengthening of the dollar and the fall in US Treasury bond yields. At the same time, the escalation of the geopolitical conflict in the Middle East is not particularly inspiring for gold bulls.
The volatility of the precious metal remains excessively high, and it is awaiting an influx of speculative demand from China after the Lunar New Year celebrations.