
Sample Category Title
USD/JPY Rebounds From Support, Upside Continuation In Play
Key Highlights
- USD/JPY started a steady increase from the 152.25 support.
- It cleared a key rising channel with resistance at 154.00 on the 4-hour chart.
- EUR/USD is again moving lower below the 1.1800 support.
- Bitcoin at a risk of more downside below $65,000.
USD/JPY Technical Analysis
The US Dollar formed a base above 152.25 against the Japanese Yen. USD/JPY started a fresh increase above 153.50 and 154.00.
Looking at the 4-hour chart, the pair cleared a key rising channel with resistance at 154.00. There was a move above the 50% Fib retracement level of the downward move from the 157.66 swing high to the 152.27 low.
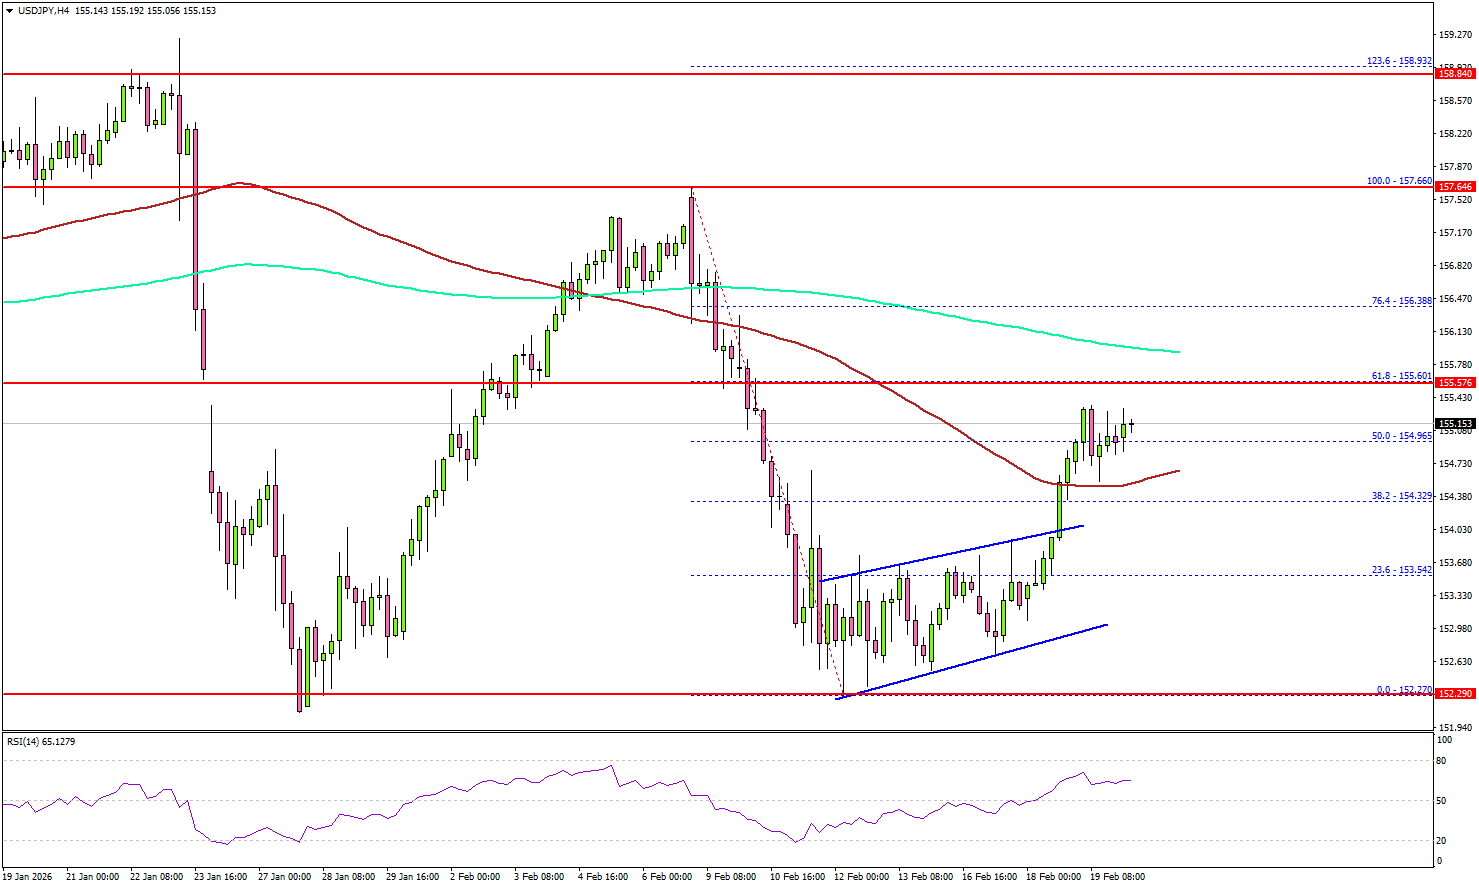
The pair settled above the 100 simple moving average (red, 4-hour). On the upside, the pair is now facing hurdles near 155.60 and the 61.8% Fib retracement level of the downward move from the 157.66 swing high to the 152.27 low.
The next stop for the bulls might be 156.00 and the 200 simple moving average (green, 4-hour). A close above 156.00 could open the doors for more gains. In the stated case, the bulls could aim for a move to 157.50. The main resistance sits near 158.00.
Immediate support could be 154.75. The first major area for the bulls might be near 154.20. The main support sits at 153.50, below which the pair might gain bearish momentum. In the stated case, it could even revisit 152.00.
Looking at EUR/USD, the pair is again moving lower and might continue to move down if there is a close below 1.1720.
Upcoming Key Economic Events:
- Euro Zone Manufacturing PMI for Feb 2026 (Preliminary) – Forecast 50.0, versus 49.5 previous.
- Euro Zone Services PMI for Feb 2026 (Preliminary) – Forecast 52.0, versus 51.6 previous.
- US Gross Domestic Product for Q4 2025 (Preliminary) – Forecast 3.0% versus previous 4.4%.
- US S&P Global Manufacturing PMI for Feb 2026 (Preliminary) – Forecast 52.6, versus 52.4 previous.
- US S&P Global Services PMI for Feb 2026 (Preliminary) – Forecast 53.0, versus 52.7 previous.
RBNZ’s Breman confident inflation will return to target, policy not on preset path
RBNZ Governor Anna Breman said in speech that the central bank remains confident inflation will return to target despite its current 3.1% reading. She expects inflation to move back inside the 1–3% band in the first quarter and ease toward the 2% midpoint over the 12 months. That formed a key basis for the decision to keep the OCR unchanged at 2.25% this week.
Breman stressed that policymakers needed to determine whether the recent uptick in inflation signaled broader price pressures or merely a "temporary bump". She pointed to global factors lifting tradables prices, while non-tradables inflation continues to decline, albeit slowly.
The economy expanded in the September quarter and indicators suggest recovery is continuing into early 2026. With unemployment still elevated and wage growth subdued, the RBNZ sees room for recovery without reigniting inflation.
At the same time, she reiterated that monetary policy is "not on a preset course".
Reflecting on a Dovish RBNZ
The RBNZ’s February economic outlook was a mix of optimism and pessimism. The implications are a higher bar for an early start to OCR increases and a bias towards a weaker exchange rate.
- The RBNZ’s economic outlook was a mix of optimism and pessimism.
- The medium-term growth outlook isn’t boosted much despite low interest rates and stronger recent data.
- Pessimism about the housing market and its impact on consumer spending is prominent in the RBNZ’s concerns.
- The implications are a higher bar for an early start to OCR increases and a bias towards a weaker exchange rate.
This week was dominated by Governor Breman’s inaugural outing at the release of a Monetary Policy Statement (MPS). The general tone of the message was notably more dovish than market expectations, even though the RBNZ still sees a December initial hike as likely (but not certain). But the subtext was a bit pessimistic, indicating the bar for an early rate rise remains high. This implies the balance of risk has tilted away from an interest rate rise ahead of the General Election on 7 November. This also likely embeds a weak tone for the NZD for a while.
In many respects, this week’s MPS was according to expectations. We had anticipated a cautiously optimistic view from the RBNZ on the economic recovery that culminated in a signalled first shift in the OCR towards the neutral zone right at the end of 2026. We didn’t expect the RBNZ to signal any chance of further easing in the interim and we didn’t expect the RBNZ to talk about a pre-election tightening. The RBNZ’s messaging – which was notably much clearer than has sometimes been the case in the past – met those expectations.
However, there were aspects of the RBNZ’s story that remain less optimistic – indeed, in our view, pessimistic given the current low level of interest rates. At a high level the RBNZ presented picture of a solid recovery through the next couple of years. Growth is expected to be around 2.8% over each of 2026 and 2027, which is solidly above trend growth and sufficient to eat up excess capacity eventually. However, the pessimistic overlay is that these forecasts were not any stronger than presented late last year before we saw a run of stronger economic indicators, including Q3 GDP itself.
The stronger growth indications we saw late last year are reflected in the RBNZ’s forecast of solid growth in the first half of 2026 (which was revised up marginally). But the RBNZ has scaled back its forecasts for growth in the second half of 2026 (from 1.5% to 1.2% over H2 2026). This means that although the output gap initially closes a bit more quickly in early 2026, it still doesn’t close fully until the end of 2028. It also means the path to lower unemployment is much slower than previously expected, so that the unemployment rate ends 2026 at a still elevated 5.0%.
This less optimistic view of the future, even given low interest rates, means inflation pressures are not seen as pressing and the urgency to raise interest rates is not great. This is why Governor Breman emphasized that market pricing of at least one OCR increase in 2026 was too aggressive. Indeed, she noted that in the MPC’s eyes, while a rate rise at the end of the year looks likely, it is hardly a done deal.
The key issue weighing on the MPC’s mind is the role that house prices will play in shaping the economic recovery. And this is an area where again the RBNZ took a very pessimistic view. To be certain, house prices have been flat or have fallen in seven of the last eight months. But the RBNZ took the view that recent momentum can be extrapolated into the whole of 2026 with just a marginal improvement in 2027. And that softness in house prices is expected to be a drag on households spending. In a year where economic growth is forecast to run at an above-trend 2.8%, house prices are forecast to be flat in 2026. This is a remarkable assumption remembering that in late 2025 the RBNZ thought house prices would rise around 3.8% in 2026 – even though back then the short-term economic outlook seemed less positive.
If the RBNZ’s scenario comes to pass it will be notable indeed as it’s usually the case that an improving growth path prompted by low interest rates, reduces unemployment and lifts household incomes, increasing the demand for housing and house prices. Considering the trends post the Global Financial Crisis, a year of 2.8% GDP growth would usually see house prices rise at least somewhat. Or looking at it the other way around, zero house price growth would normally reflect a much slower economy and growth closer to 1.5% y/y. If we see another year of growth as weak at 1.5% then it’s likely the output gap won’t close and unemployment rate won’t fall (indeed it could rise).
Such a scenario would ask hard questions of New Zealand’s growth potential and the level of the “neutral” interest rate. We don’t think that this would be consistent with neutral rates sitting in the 3-4% range (which covers the range of RBNZ and private forecasters assumptions) as it would be more likely that even a 2.25% interest rate isn’t really that stimulatory.
All of this is of course assuming no exogenous shock drives another weak growth outcome in 2026. No such shock is currently forecast – and indeed the RBNZ expects global growth over 2026 will be similar to 2025. The Governor did present a laundry list of downside risks coming from global issues. But none of these are impacting on the New Zealand economic recovery right now. And we don’t think they are weighing much on the policy outlook at the minute.
These pessimistic scenarios also ask hard questions of where the exchange rate is heading. As we have noted many times, foreign exchange is a relative game, and right now other countries are moving ahead of New Zealand. We shouldn’t see a very strong exchange rate at all if these more pessimistic scenarios come to pass. The situation seems particularly pressing versus the currently strong Australian dollar where interest rate expectations are firming. We are slightly revising down our view of the NZD/AUD exchange rate for the next 6 months given the RBNZ’s dovish views, to reflect the sense that that balance of risks for New Zealand interest rates have tilted away from a pre-election start to the tightening cycle. Ultimately, we remain optimistic the recovery will be stronger than the RBNZ fears. But this is not going to be settled until the second half of 2026 when the RBNZ and our forecasts start to significantly diverge.
In the meantime, the RBNZ’s focus on housing and the implications for household consumption growth will place a premium on house price data and consumer spending indicators. As noted, this week’s data on house prices confirm still flat prices and unchanged momentum. This week’s electronic card spending data was weaker than expected – but the data appears a lot weaker than card spending data produced by the banks, including our own indicator. Hence, we wonder if the Stats NZ data is somehow missing something as retail trends and the payments marketplace is shifting. Next week’s Retail Trade Survey for the December quarter will be interesting in that regard.
Japan’s CPI slows to 1.5% in January, core measures ease further
Japan’s headline CPI slowed to 1.5% yoy in January from 2.1%, falling below the BoJ’s 2% target for the first time in 45 months. Core CPI (excluding fresh food) declined to 2.0% from 2.4%, while core-core inflation eased to 2.6% from 2.9%, signaling broader moderation in underlying price pressures.
The slowdown was largely driven by energy, where costs dropped -5.2% yoy after a -3.1% fall in December. Goods inflation cooled sharply from 2.7% to 1.6%. In contrast, services inflation remained steady at 1.4%, suggesting domestic wage-driven price gains have yet to accelerate meaningfully.
Food inflation remains elevated but is gradually cooling. Prices excluding fresh items rose 6.2% yoy, down from 6.7%. Rice inflation slowed for an eighth consecutive month to 27.9%.
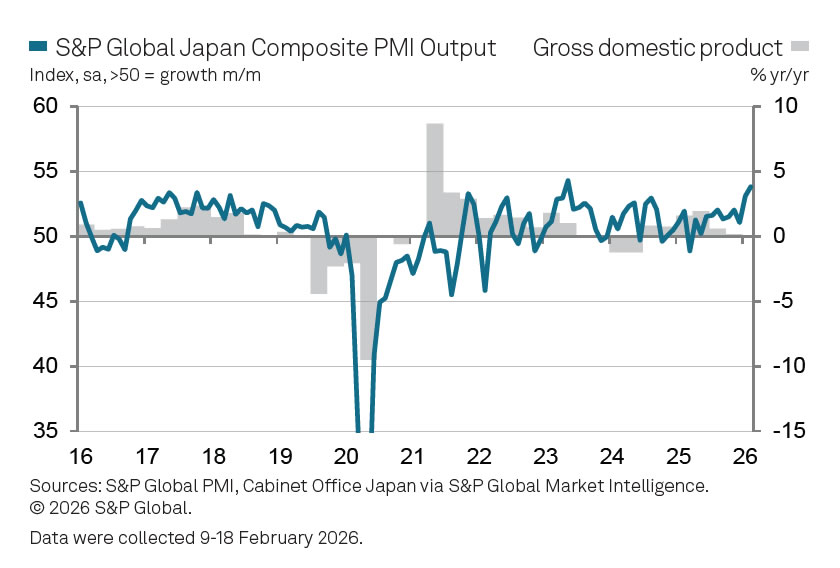
Japan PMI composite jumps to 53.8, export demand surges
Japan’s private sector gathered further momentum in February, with PMI Manufacturing rising from 51.5 to 52.8 and PMI Services edging up to 53.8. PMI Composite climbed from 53.1 to 53.8, marking the strongest expansion since May 2023 and signaling a more broad-based recovery.
According to S&P Global’s Annabel Fiddes, the upturn was supported by firmer demand both domestically and overseas. Total new orders expanded at the quickest pace since May 2023, while manufacturers recorded the strongest increase in export work in eight years.
Stronger sales pushed capacity utilization higher, with backlogs rising at a record pace. Firms responded by increasing hiring, while improved demand allowed businesses to regain some pricing power despite persistent cost pressures. Business confidence also strengthened, supported by new product launches, technology demand and optimism following Prime Minister Sanae Takaichi’s landslide election victory.
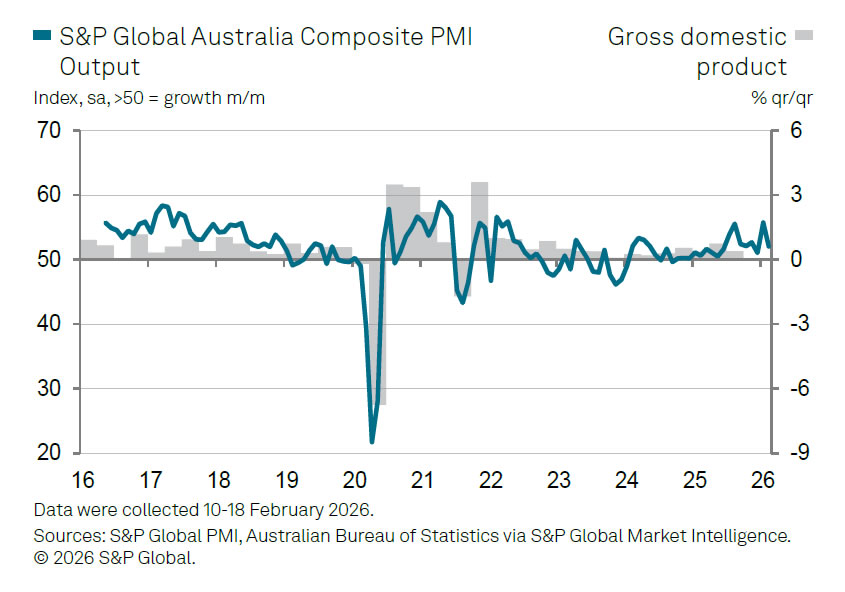
Australia PMI composite dives to 52.0 in February, cost pressures reaccelerate
Australia’s February flash PMIs signaled a slowdown in private sector momentum. PMI Manufacturing slipped from 52.3 to 51.5, while PMI Services dropped sharply from 56.3 to 52.2. As a result, PMI Composite fell from 55.7 to 52.0, indicating growth continued but at a much more modest pace.
According to S&P Global’s Eleanor Dennison, the private sector was unable to sustain the strong start to the year. Both manufacturing and services recorded softer expansions in output and new orders, with the services sector experiencing the more pronounced pullback.
However, inflationary pressures remain evident. Firms reported elevated wage burdens and higher supplier costs, pushing both input and output price inflation to five-month highs. Despite softer new business growth, job creation accelerated to an 11-month high, underscoring labor market tightness.
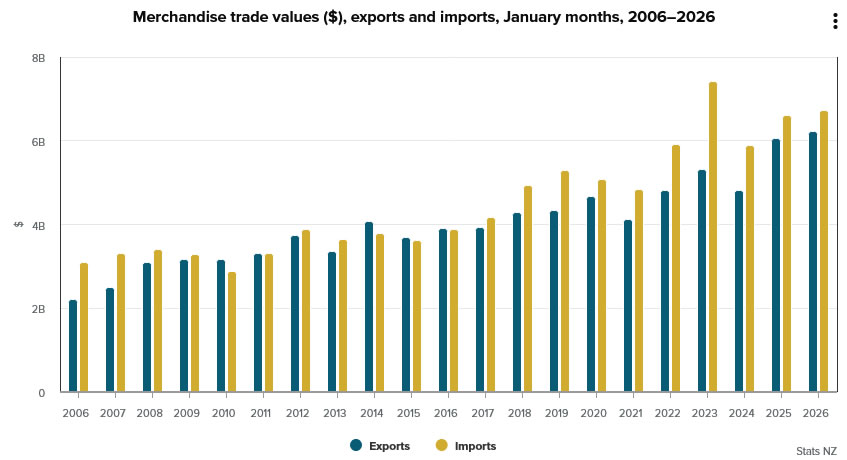
NZ trade deficit at NZD -519m as China flows diverge
New Zealand’s goods exports rose 2.6% yoy in January to NZD 6.2B, up NZD 157m from a year earlier. Goods imports increased 1.9% yoy to NZD 6.7B, up NZD 126m. The result was a monthly trade deficit of NZD -519m.
By destination, export performance was mixed. Shipments to China, New Zealand’s largest trading partner, fell NZD -118m (-7.0%) yoy. In contrast, exports to Australia jumped NZD 134M (+20%), while flows to the EU (+16%) and Japan (+11%) also posted solid gains. Exports to the US were broadly flat.
On the import side, China led the increase, with imports surging NZD 346m (+24%) yoy. South Korea also recorded a strong rise (+36%), while imports from the EU edged higher. Meanwhile, purchases from the US (-17%) and Australia (-8.1%) declined.
The data suggest stable overall trade volumes but highlight shifting bilateral flows, particularly with China, which may have implications for growth in coming months.
Cliff Notes: Lingering Concerns Over Capacity
Key insights from the week that was.
In Australia, the data release of the week was the January Labour Force Survey which reported a +17.8k lift in employment, in line with the market’s expectation. While labour demand is still best characterised as ‘soft’, having slowed to a well below-average pace through 2025, it appears to be finding its footing. At the same time, labour force growth has been tracking a weaker trend, the participation rate falling 0.6ppts over the past year, keeping the unemployment rate steady at 4.1% in recent months.
This data is likely to raise some concern over a possible ‘re-tightening’ in labour market conditions, and the risk of more persistent inflation – a key concern for the RBA’s Monetary Policy Board. On the latter, Chief Economist Luci Ellis dissected the minutes from the February Board meeting earlier this week, including the apparent downplaying of the impact of exogenous exchange rate appreciation on the inflation outlook.
Coming back to the labour market, it is important to recognise that a lower unemployment rate has a very different flavour if it is being driven by weaker participation versus stronger hiring. The forces driving the current downswing in participation – namely an easing in cost-of-living pressures – may not persist for much longer given inflation’s persistence. Combined with an underlying structural uptrend in labour supply, we could easily see a turnaround in labour force participation lift the unemployment rate again.
This is all to say that the upside risks to inflation stemming from the labour market may prove transitory. This week’s benign result for Q4 wages growth, up 0.8% (3.4%yr), supports this assertion. Today’s note from Chief Economist Luci Ellis furthers the discussion around the relationship between the labour market and inflation.
Offshore, in a holiday shortened week, the focus was on the balance of risks in the US. Out last Friday, the market celebrated January’s 0.2% headline gain for consumer prices against the 0.3% consensus expectation. However, the headline beat was primarily the result of a 1.5% decline in energy prices and a moderate 0.2% increase in food prices, along with a flat outcome for core goods prices. Services ex-energy in contrast rose 0.4% in January after a 0.3% increase in December – outcomes well in excess of the FOMC’s target and consistent with broad-based capacity pressures across housing, transport and medical care.
While the January FOMC meeting occurred before this data release, the minutes recognised that inflation risks are now broadly balanced against labour market uncertainty, which has receded of late given evidence of stabilisation after a period of "gradual cooling".
Arguably, most of the Committee still believe policy can be eased further in time, but it is interesting to note that “Several participants indicated that they would have supported a two-sided description of the Committee's future interest rate decisions, reflecting the possibility that upward adjustments to the target range for the federal funds rate could be appropriate if inflation remains at above-target levels”. So, if we see further persistence in services inflation, or businesses pass through more of the cost of tariffs, the FOMC may become more vocal in their concerns over inflation. This would trigger a resetting of market expectations from the current pricing of two or more cuts in 2026 to one or no cuts, with consequences for financial markets.
We currently view one fed funds rate cut as most probable in 2026, although this view is held with low conviction given the above risks to inflation. For the US dollar however, we continue to believe any rate reset is likely to be more than offset by a greater appreciation of growth opportunities elsewhere in the world, seeing the US dollar trend lower.
Across the Atlantic, Q4 GDP disappointed in the UK (0.1%, 1.0%yr) but showed resilience in the Euro Area (0.3%, 1.3%yr). Thankfully for the UK, the latest inflation data gave the BoE support to continue cutting through the first half of this year as annual headline inflation slowed to 3.0%yr, to be in line with core inflation at 3.1%yr. Importantly, services inflation looks to be abating as hoped, now 4.4%yr after being stuck around 5.0%yr through the first half of 2025.
Turning finally to Asia, we are yet to get a sense of how China’s economy has begun 2026 given Lunar New Year Holidays but expect authorities will have to quickly shift to a pro-active stance for policy, else risk a structural deceleration in growth taking root. Across the rest of the region are a broad array of conditions and prospects, with countries such as Taiwan and Vietnam growing rapidly while those whose industry is concentrated more in services such as Thailand underperform. Politics are also very important at present and likely to remain so. As an example, the opportunity seen by many in Japan’s economy and stock market depends on the Government taking action to support investment and consumption and, in doing so, spur private sector confidence. Highlighting the need for action, this week Japanese Q4 GDP surprised to the downside, rising just 0.1% after a 0.7% decline in Q3. Underlying the result, household consumption grew just 0.1%.
NAIRU: Dead, Undead or Just Resting?
Full employment objectives for central banks are common and long-standing. They are harder to assess than inflation objectives, and evolve as our understanding of the economy improves.
- Full employment objectives for central banks are common and long-standing. The RBA has been mandated to pursue both price stability and full employment since its founding as a separate institution. Even a central bank with an inflation-only mandate would need to care about labour market developments, because these provide information about future inflation.
- It is harder to know whether the economy is at full employment than whether inflation is at target. Gaps from full employment are inferred from price and wage outcomes. The exact mapping from those outcomes to a judgement about tightness of the labour market depends in part on how you think the ‘unemployment gap’ or ‘output gap’ affects prices and wages, and how you think inflation expectations are formed.
- The RBA has in recent times instituted a dashboard or checklist approach to assessing where the labour market is relative to full employment. This approach has limitations but is being progressively evolved. It also still focuses on a subset of approaches to analysing the labour market. The so-called ‘NAIRU’ and the gap-oriented approach to assessing full employment is far from dead to central banks.
Many central banks, including the RBA, have ‘full employment’ as part of their mandate, in addition to inflation control. In most cases, again including Australia, this has been true for decades. Indeed, it is well understood that even a central bank with an inflation-only mandate would still want to have a view on full employment, because a labour market being away from that point will influence inflation in future, potentially pushing it away from target. This was the point Mervyn King made back in 1997, that even an ‘inflation nutter’ central bank would still care about employment and unemployment.
But how do central banks know if they have achieved a full employment goal? An inflation target can be specified as a desired rate or range of rates for inflation, and perhaps a horizon over which to achieve it. ‘Full employment’ has, however, always been a bit more nebulous. Typically, policymakers and academic economists alike have framed ‘full employment’ as being the lowest rate of unemployment that is still consistent with inflation remaining at its target. That way, the two mandates are defined not to conflict. ‘Full’ does not mean ‘everybody who wants one has a job’, and it is not necessarily as low a rate of unemployment as other parts of society might prefer.
The evolution of economic understanding of the relationship between inflation and unemployment began in the middle of the previous century, when A W Phillips noted an inverse relationship between growth in money wages and the unemployment rate in the UK. In other words, an unemployment rate below its ‘natural rate’ – an ‘unemployment gap’ – was associated with faster wages growth. The ‘Phillips curve’ concept later expanded to be between price inflation and unemployment rather than money wages growth and unemployment. More recently, the RBA has also related these ‘gaps’ to growth in unit labour costs (which includes all employee compensation, not just wages, expressed relative to output produced) rather than wages or prices directly. This approach stems from the ‘markup model’ framework where marginal costs and labour market slack are related, rather than prices and slack. As we have previously noted, other central banks do not put anywhere near the emphasis on this model that the RBA does.
Later work focused on the role of expected inflation, holding that unemployment would only decline below its ‘natural rate’ if people were ‘surprised’ by inflation. If unemployment was below the ‘Non-Accelerating Inflation Rate of Unemployment’ (now you know why economists call it the NAIRU), inflation (or wages growth) would not just be higher, but would be ever-increasing, because people would come to expect the current rate of inflation to continue, and then you needed to surprise them some more. So if inflation or wages growth was increasing, that was taken as evidence that the unemployment rate was below the NAIRU and the labour market was tighter than ‘full employment’. A steady rate of unemployment or wages growth was seen as a signal that the labour market was roughly in balance.
The RBA’s recent work on establishing where full employment might be has instead taken the view that inflation expectations in Australia are reasonably anchored. So instead of looking for increasing inflation or wages growth as a sign that the labour market is tighter than full employment, any deviation of inflation from target, or wages growth from what the central bank judges to be consistent with inflation remaining at target, is seen as a sign that the labour market is away from full employment. The NAIRU isn’t really dead in the RBA’s framework: they just dropped the “A”.
Observant readers will note that the judgement about whether wages growth is consistent with inflation at target requires a judgement about the mapping from wages growth to labour costs to inflation target. This involves a judgement about trends in productivity growth that is subject to both debate and data revisions.
The RBA has also fleshed their assessment process out with a ‘checklist’ or ‘dashboard’ of indicators of full employment and a separate one for the output gap. This has not been without criticism from labour market experts, though to be fair the dashboards have been improved over time and are now less sensitive to historical averages. It has also integrated at least some of the insights from labour economics that frame the labour market as an exercise in matching workers and jobs, with all the frictions that might arise from that. Still, the exercise has a little of the flavour of the RBA’s use of ‘checklists’ in the early 1980s, before the inflation targeting era. That experiment did not end well.
In the end, though, the RBA’s framework is all about taking signal from inflation and wages data and reading back to the labour market. Consider two possible views of economic trends. One is that trend growth in capacity – that is, potential output – is just above 2%, and the sustainable rate of unemployment is around 4.6%, the RBA’s latest estimate. Another, closer to our own view, would be that potential output growth is more likely to be in the 2¼–2½% range and the sustainable unemployment rate is more like 4¼%. The labour market data on its own will not help you distinguish between these two sets of assumptions. The signal from inflation and wages growth will be the deciders.
The upshot is that the RBA has put a lot of effort into measuring where full employment is. Neither it, nor the profession more broadly, have done as much on building theory about why it is where it is, or where it might go from here, including whether it could be deliberately moved to make even lower unemployment feasible. And despite the dropping of the “A”, the intellectual framework has not evolved much over the past decade. It is still all about inferring gaps from Kalman filtering the relationship between output, labour market data and price and wage outcomes.
There are alternatives, which both policymakers and the research community would be familiar with but have generally not pursued, sticking instead to the ‘gap-oriented’ approach to assessing the balance between demand and supply. One alternative – though by no means the only one – was even expounded in a Bank of England publication more than a decade ago (full disclosure: the author, Professor Roger Farmer, was one of my PhD thesis examiners). There is also more to be gleaned from search-oriented analysis of the labour market.
The analysis of where full employment is therefore far from settled. Further changes in central bank frameworks can be expected as more research is done. Hopefully this future research avoids incrementalism and considers the implications of how labour markets actually work in the 21st century. Meanwhile, the NAIRU might have changed form, and dropped a letter here or there, but it is not dead to central banks.
USD/CHF Carves a Bottom after Reaching 14-Year Lows
2025 was the year of the Swiss Franc, and there were quite a few reasons.
De-dollarization, flows moving towards Europe, the Yen losing some of its Safe-Haven characteristics amid fiscal trouble in Japan, and general diversification towards quality as the World faces troubled times ahead.
Reaching 14-year lows less than a month ago, USD/CHF had become a bear dream for those who thrive on Dollar outflows. 2025 began with a 17% decline in the Major pair and was at the center of the essential themes driving FX flows.
But as Dollar bearish positioning also reaches decade lows, some questions regarding the extended moves are arising.
If the US Dollar finds reasons to catch a serious bid, troubled times could be coming ahead for heavy Greenback-Short sellers. A question evoked in our recent Dollar Index analysis.
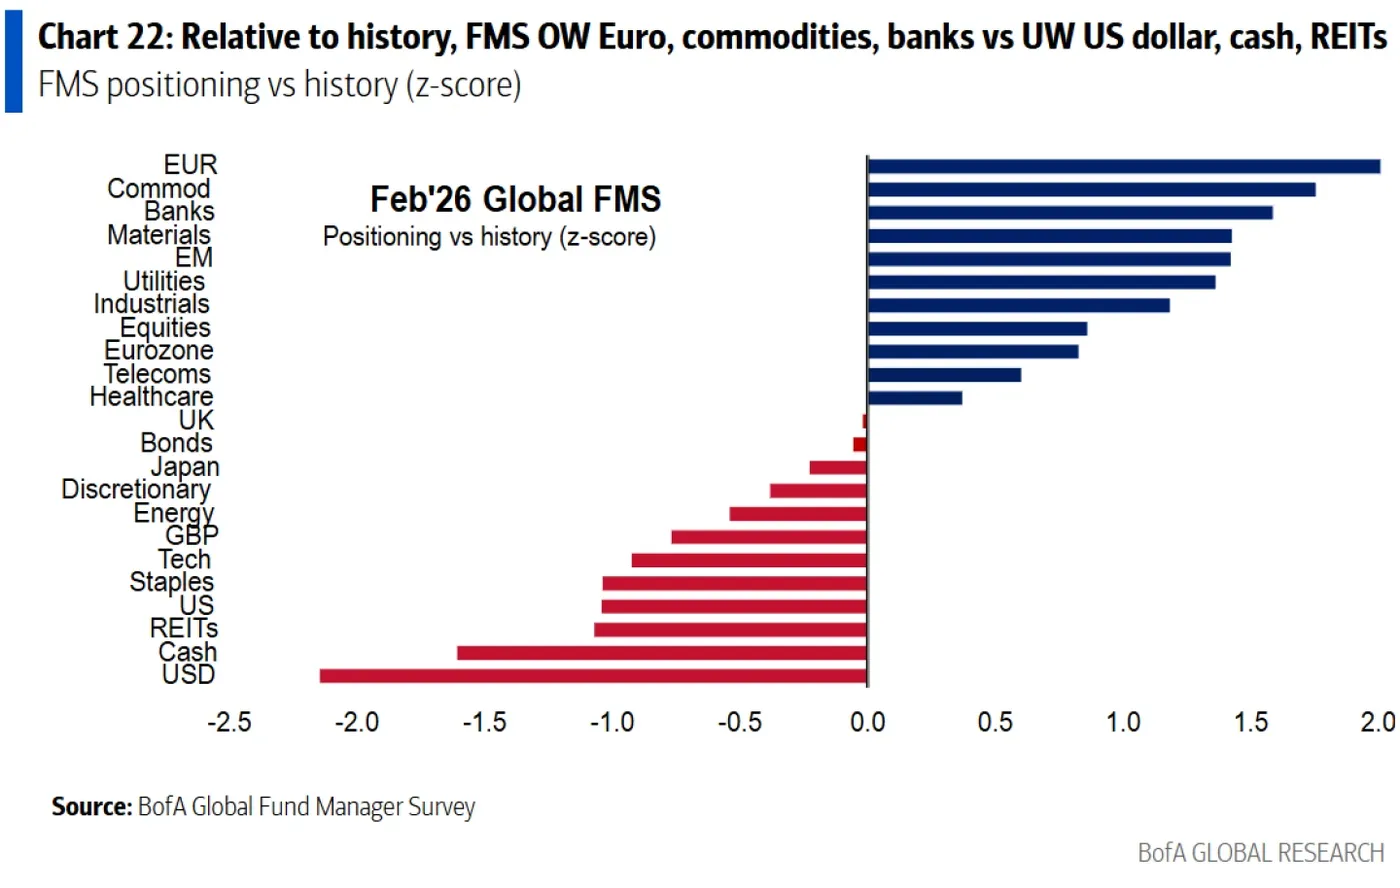
Dollar Bear Positioning is at Extremes – Source: Bank of America Survey
With safe havens like Gold and Silver seeing sudden outflows at the end of last month, coinciding with Kevin Warsh's appointment as head of the Federal Reserve, the appeal of these no and low-yielding assets is being called into question. And the Swiss Franc is no stranger to such.
Switzerland is a victim of quite heavy deflationary pressures, with its currency strengthening (hurting Swiss exports) and the rougher US trade policies, which exacerbate a fundamentally low-inflation regime.
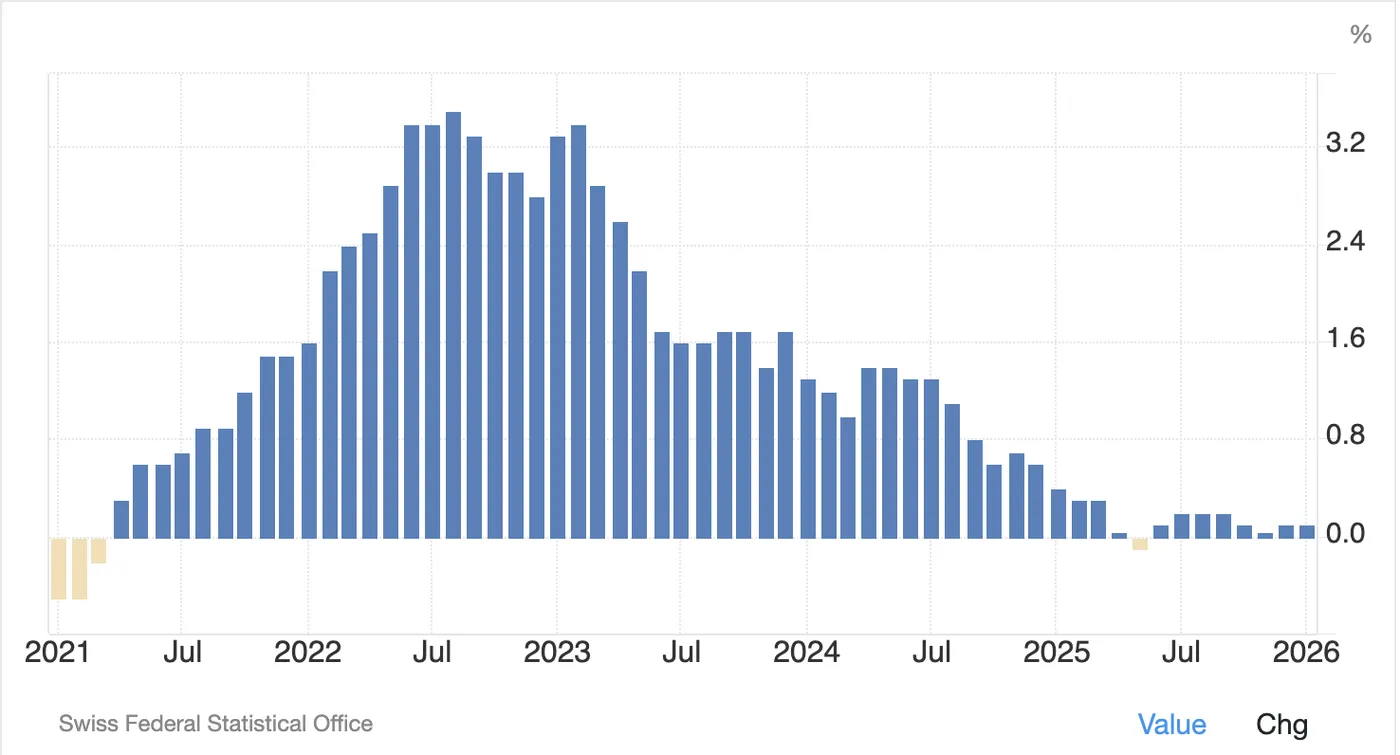
Swiss Inflation – Courtesy of Trading Economics
After reaching a new deal, trade is seemingly bouncing back, but pressure remains on the Swiss National Bank.
The latest inflation report showed a modest 0.1% increase, but if inflation doesn't show a material increase in the coming few reports, the Central Bank might be forced to turn to negative rates. And such come at high costs.
In the meantime, USD/CHF has carved out a pretty strong bottom in recent days and could offer interesting mean-reversion setups for those looking for FX volatility ahead.
Let's dive right into a multi-timeframe analysis of USD/CHF to spot where the action stands and where it could be heading.
USD/CHF Multi-Timeframe Technical Analysis
Daily Chart
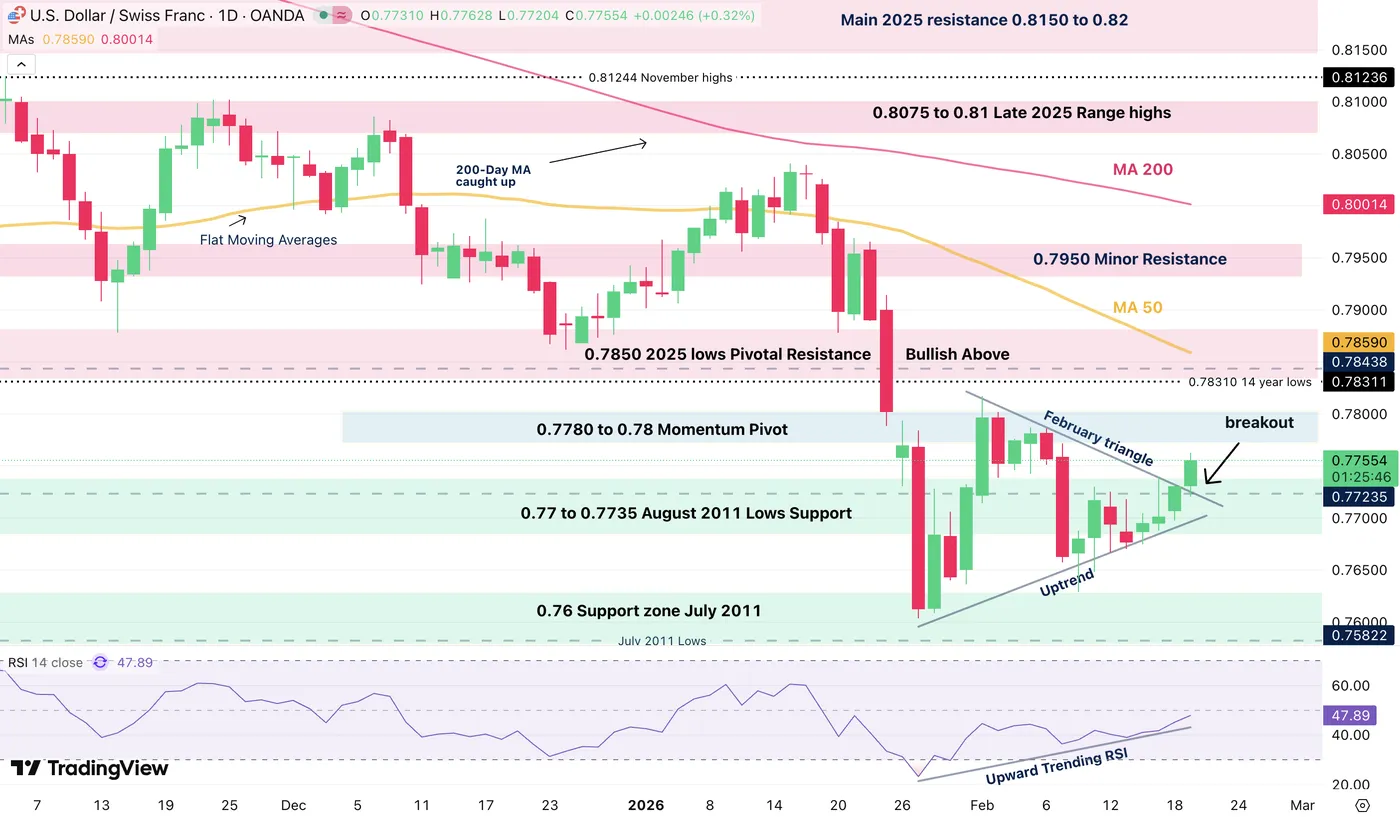
USD/CHF Daily Chart – Source: TradingView. February 19, 2026
USD/CHF is carving out a breakout from its mid-February Triangle consolidation, and will soon face a key test for its buying momentum.
The Daily RSI and Uptrend are working together to provide a fresh push in the pair, with traders leaning on the Monday Lows (0.7675) to drive the action higher.
- If the action falls back below the weekly lows, the breakout will be void but for now it gives high probabilities of holding.
4H Chart and Technical Levels
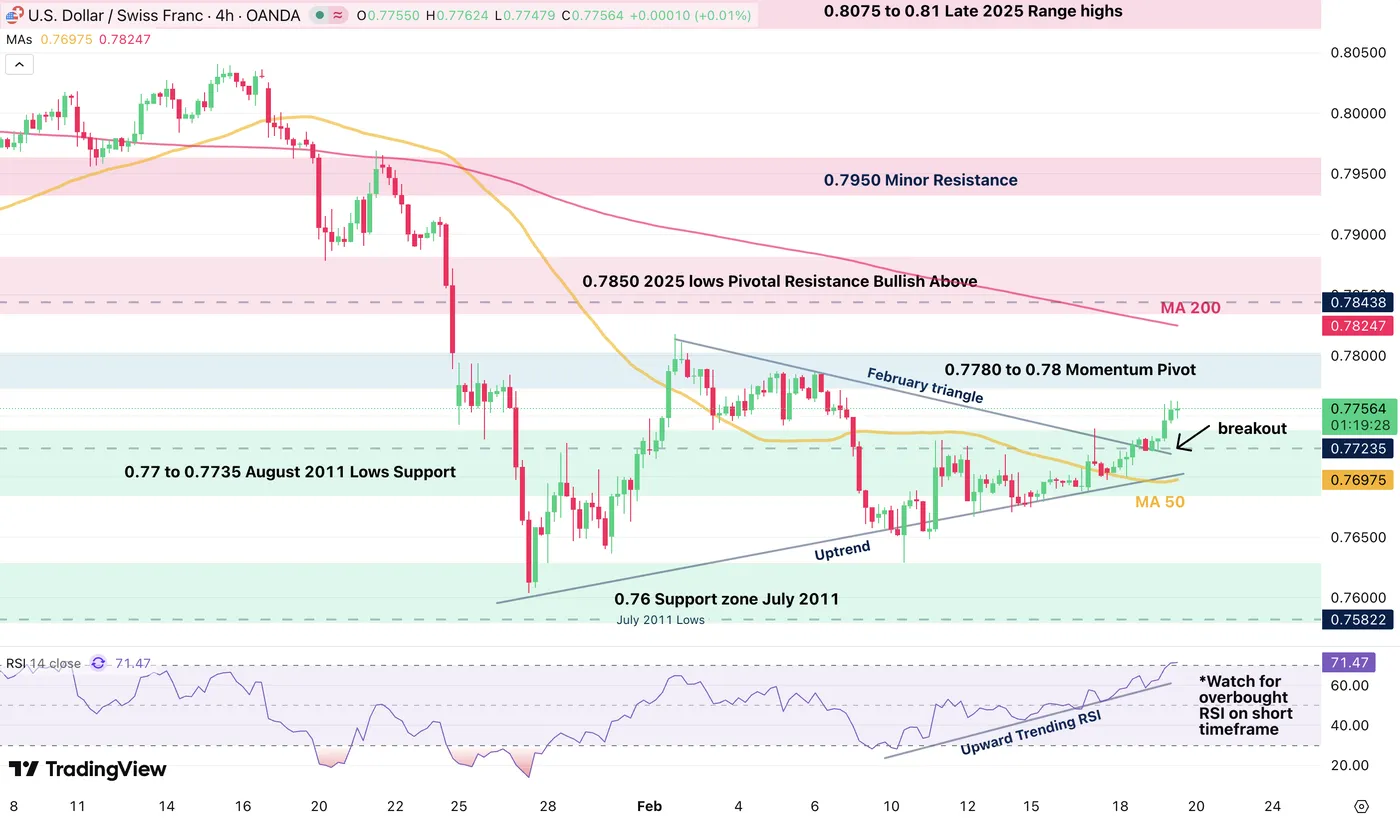
USD/CHF 4H Chart – Source: TradingView. February 19, 2026
USD/CHF is breaking out on quite strong price action, but will face a short-term barrier from overbought conditions. Check trading setups on the 1H timeframe just below.
Trading Levels for USD/CHF
Resistance Levels
- 0.7780 to 0.78 Momentum Pivot
- 0.7850 2025 lows Pivotal Resistance (Bullish Above)
- 0.7950 Minor Resistance
- 0.8075 to 0.81 Late 2025 Range highs
Support Levels
- 0.7725 50H Moving Average
- 0.77 to 0.7725 August 2011 Lows Support
- 0.76292 2026 and 14-year lows
- 0.76 Support zone July 2011
- 0.70696 All-Time lows (August 2011)
1H Chart
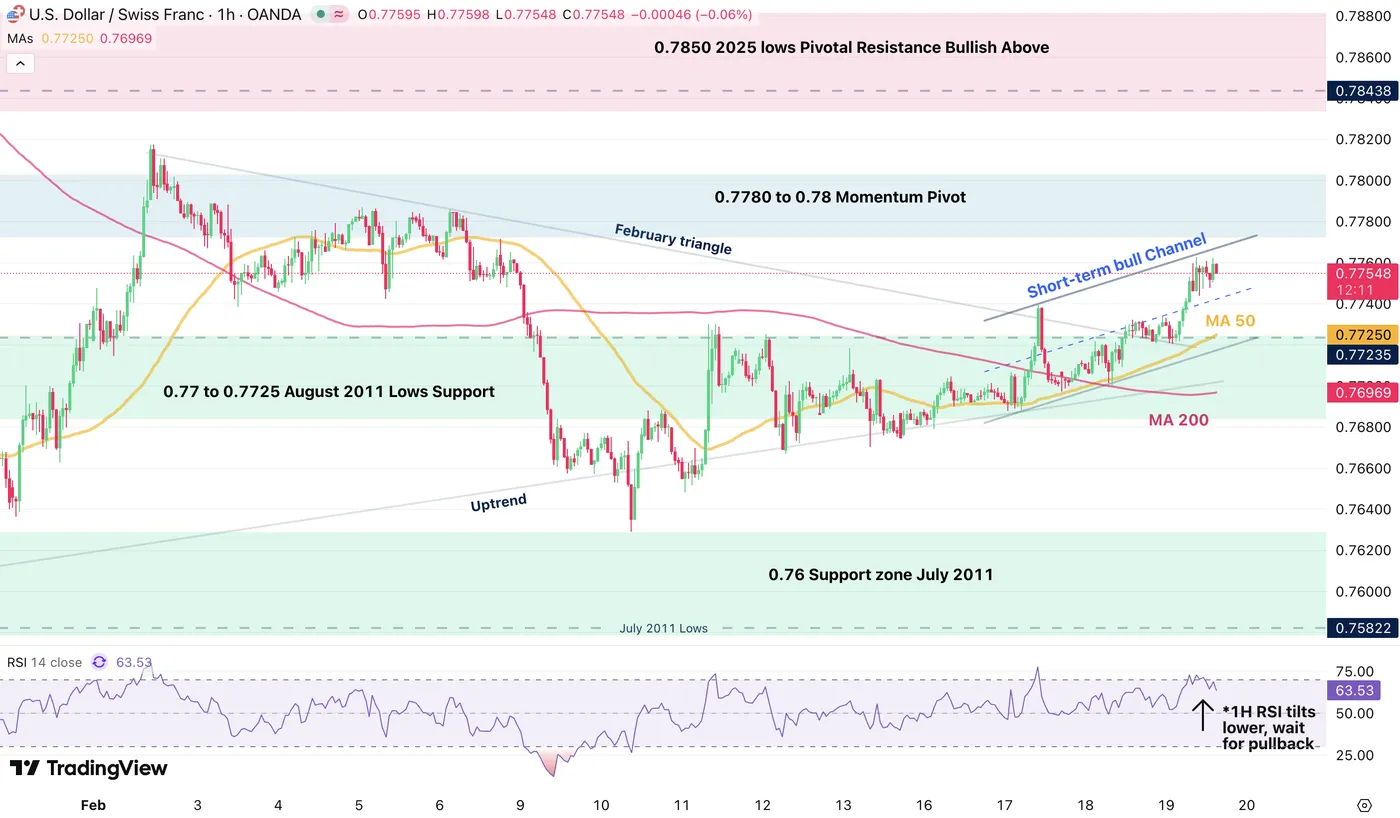
USD/CHF 1H Chart – Source: TradingView. February 19, 2026
The pair now looks slightly overextended on the 1H timeframe, but remains in an upward formation, as seen on the intraday bull channel.
- Traders looking to capture a potential bull move could wait for a retracement to the 50-Hour Moving average at 0.77250.
- If the action doesn't pullback lower, traders can look for breakout setups
- Breaching the February highs 0.78175 would point to a swift test of the Pivotal resistance around 0.7850.
- Any daily close below the 200-Hour MA could prompt a retest of the 2026 low and further bearish action, but technicals aren't pointing to such outcomes for now.
Safe Trades!