
Sample Category Title
Dollar Extends Rally on Strong Jobs, EUR/USD Breaks February Low
Dollar jumped in early US session after jobless claims came in much stronger than expected, reinforcing signs of labor market resilience. The data added fresh fuel to a rally that had already begun following yesterday’s more hawkish-than-expected FOMC minutes. The greenback’s strength is most visible against European majors with EUR/USD sliding through the near-term low set in early February.
Markets appear to be getting more comfortable with the idea that Fed may not need to cut rates again in first half of year. The combination of firm labor data and cautious Fed tone raises the bar for further easing. yesterday’s FOMC minutes already suggested that additional cuts are far from automatic. The mention by some participants that rate hikes could even be discussed under certain inflation scenarios shifted perceived risk asymmetry back in favor of Dollar. Today’s labor figures reinforce that narrative. With initial jobless claims falling sharply, evidence of labor market deterioration remains limited. That reduces urgency for policy accommodation.
Besides, some uncertainty centers on leadership at Fed. US President Donald Trump’s nomination of Kevin Warsh to replace Jerome Powell is facing potential delays amid political standoff in Senate. If confirmation is prolonged, Powell could remain in role slightly longer than anticipated. Alternatively, Vice Chair Philip Jefferson could serve as acting chair during transition.
Either scenario could slow policy adjustments, as institutional continuity tends to favor stability over rapid change. That, in turn, may delay next rate cut even further.
For week so far, Dollar leads performance table and momentum is building. Aussie follows, supported by firm employment data. Loonie benefits from rebound in oil. Yen is now weakest after renewed selling, followed by Sterling and Kiwi, while Euro and Swiss Franc trade in middle of pack.
In Europe, at the time of writing, FTSE is down -0.57%. DAX is down -0.91%. CAC is down -0.76%. UK 10-year yield is up 0.008 at 4.383. Germany 10-year yield is up 0.009 at 2.752. Earlier in Asia, Nikkei rose 0.57%. Hong Kong and China were on holiday. Singapore Strait Times rose 1.28%. Japan 10-year JGB yield rose 0.001 to 2.141.
US initial jobless claims fall to 206k vs exp 229k
US initial jobless claims fell -23k to 206k in the week ending February 14, well below expectation of 229k. Four-week moving average of initial claims fell -1k to 219k.
Continuing claims rose 17k to 1,869k in the week ending February 7. Four-week moving average of continuing claims rose 1k to 1,845k.
BoE's Mann: Inflation improving, but jobless rise ‘very much of a concern’
BoE MPC member Catherine Mann described this week’s inflation data as “good numbers,” though she cautioned that underlying pressures had not improved as much as policymakers had hoped. While headline CPI continues to slow, Mann signaled that the central bank remains focused on whether the disinflation trend is sustainable rather than temporary.
She pointed to the rise in unemployment as "very much of a concern", added that the MPC is approaching a point where policy must carefully balance inflation control with labor market risks. That framing suggests internal debate is shifting from solely combating inflation toward weighing growth considerations more seriously.
However, Mann stopped short of endorsing a March rate cut. She questioned whether the projected fall of inflation toward 2% in coming months truly reflects a durable return to target.
Mann voted with the majority to hold rates in the recent 5-4 decision and indicated the time for a cut is drawing nearer.
Australia unemployment rate unchanged at 4.1%, jobs solid enough to keep RBA May hike in play
Australia added 17.8k jobs in January, slightly below expectations of 20.3k, but the details were firm. Full-time employment rose a strong 50.5k, while part-time positions fell -32.7k. Unemployment rate held steady at 4.1%, undershooting forecasts for a rise to 4.2%, with participation unchanged at 66.7%. Monthly hours worked increased 0.6% mom, reinforcing signs of steady labor demand.
The composition matters. The shift toward full-time employment and higher hours worked suggests underlying strength rather than softening. Taken together, the data indicate the labor market remains relatively tight, with the economy still operating close to capacity.
From the RBA’s perspective, the failure of employment conditions to weaken keeps inflation risks front and center. A cooling labor market would have allowed policymakers to shift focus toward growth risks. Instead, today’s figures reinforce the view that wage pressures may remain sticky.
The base case remains for another 25bps rate hike in May, pending Q1 CPI confirmation. Whether further tightening is needed beyond that remains an open question. But for now, the labor market is not providing the RBA with any comfort that inflation pressures will fade on their own.
RBNZ’s Silk: Growth and disinflation can coexist amid spare capacity
Following the RBNZ’s decision to keep the OCR at 2.25% yesterday, Assistant Governor Karen Silk emphasized that the economy can grow even as inflation moderates.
She acknowledged that the idea may appear counterintuitive but argued that the output gap provides room for above-trend growth without reigniting price pressures. But, according to Silk, the presence of spare capacity allows output to grow above potential temporarily without reigniting inflation.
Silk described risks around the projected cash-rate path as balanced. While some sectors are showing signs of recovery, consumption remains subdued. At the same time, she warned of upside inflation risks if firms facing squeezed margins begin raising prices more aggressively.
The RBNZ estimates the neutral cash rate at around 3%, suggesting policy is still accommodative. Current projections show only a gradual move toward that neutral level by late 2027. “That’s a reflection of that spare capacity that exists within the economy and the time it will take for that to be absorbed,” Silk said.
EUR/USD Mid-Day Outlook
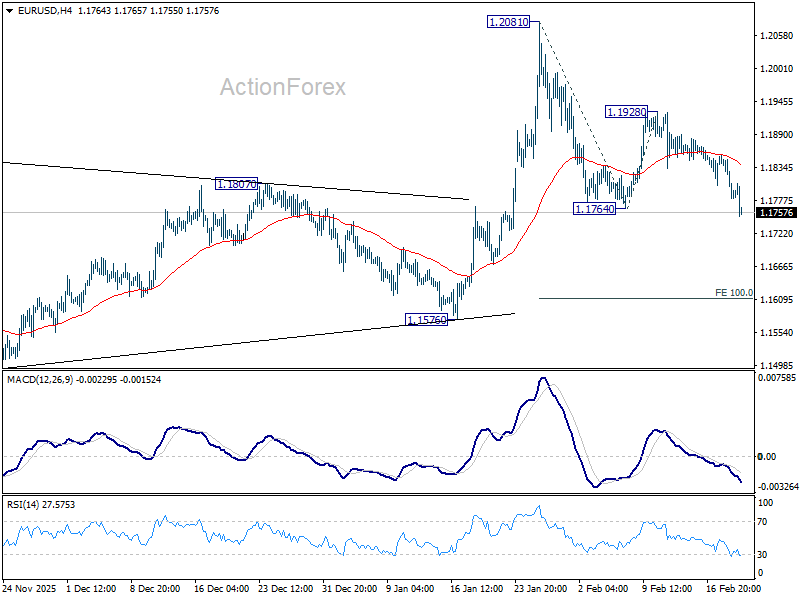
Daily Pivots: (S1) 1.1756; (P) 1.1808; (R1) 1.1833; More….
EUR/USD's fall from 1.2081 resumed by breaking 11764 support and intraday bias is back on the downside. Sustained trading below 55 D EMA (now at 1.1763) will raise the chance of reversal on rejection by 1.2, and target 1.1576 support for confirmation. For now, risk will stay mildly on the downside as long as 1.1928 resistance holds, in case of recovery.
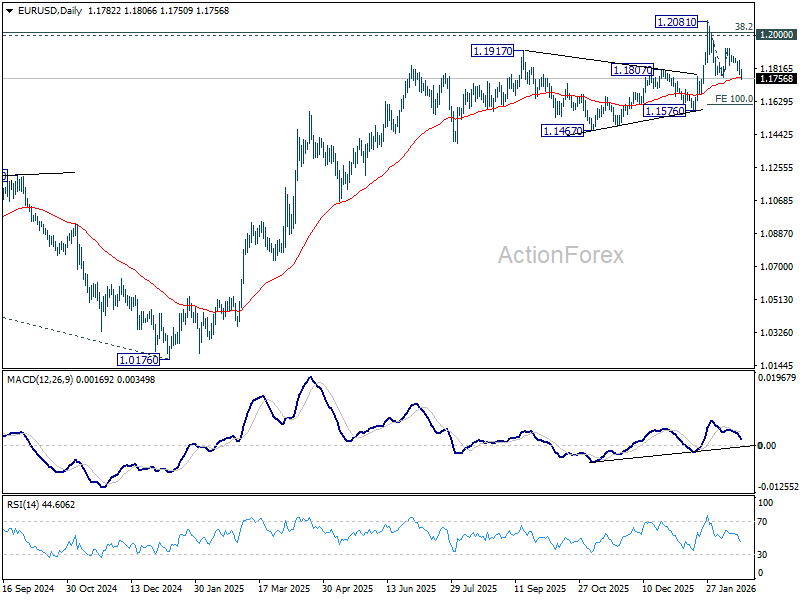
In the bigger picture, as long as 55 W EMA (now at 1.1485) holds, up trend from 0.9534 (2022 low) is still in favor to continue. Decisive break of 1.2 key psychological level will add to the case of long term bullish trend reversal. Next medium term target will be 138.2% projection of 0.9534 to 1.1274 from 1.0176 at 1.2581. However, sustained trading below 55 W EMA will argue that rise from 0.9534 has completed as a three wave corrective bounce, and keep long term outlook bearish.
US initial jobless claims fall to 206k vs exp 229k
US initial jobless claims fell -23k to 206k in the week ending February 14, well below expectation of 229k. Four-week moving average of initial claims fell -1k to 219k.
Continuing claims rose 17k to 1,869k in the week ending February 7. Four-week moving average of continuing claims rose 1k to 1,845k.
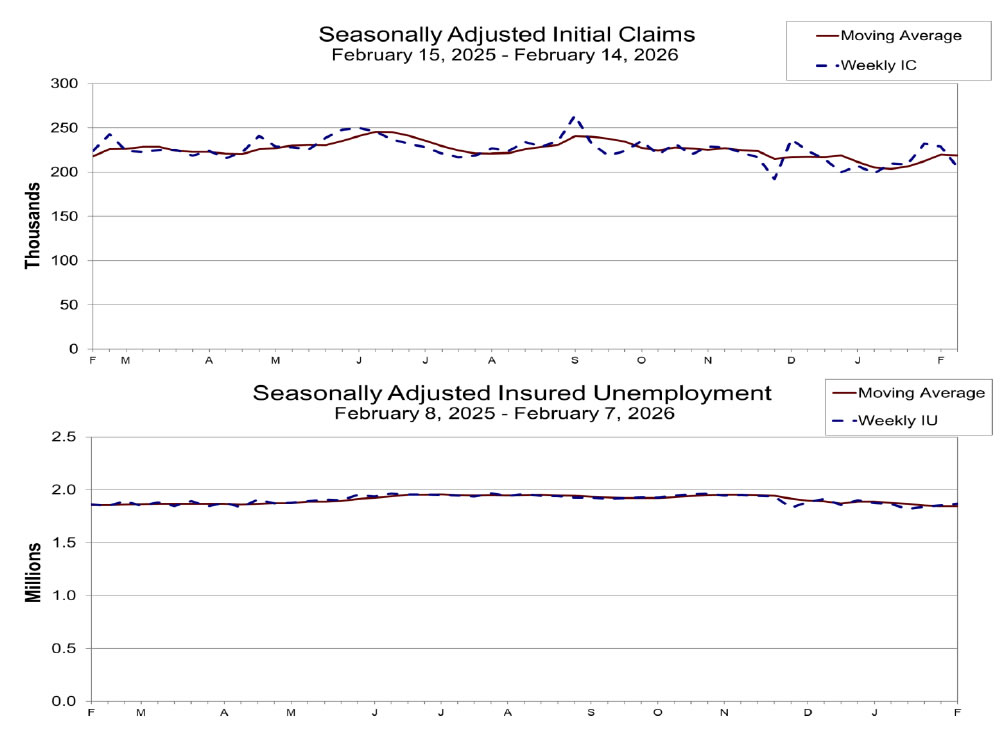
Chart Alert: GBP/USD Breaks Trendline, Is a 470-Odd Pip Decline on the Way?
- GBP/USD has broken a key ascending trendline, potentially leading to a 470-pip decline.
- The four-hour chart RSI is oversold, hinting at a short-term rebound before a potential continuation of the downtrend.
- If the current US Dollar rally wanes, this could see the potential setup face significant headwinds.
- The bearish setup is invalidated if the daily candle closes above the 1.3700 swing high.
GBP/USD has continued to slide thanks in part to the US Dollar resurgence this week as well as renewed hopes of rate cuts from the Bank of England (BoE).
Scenario 1
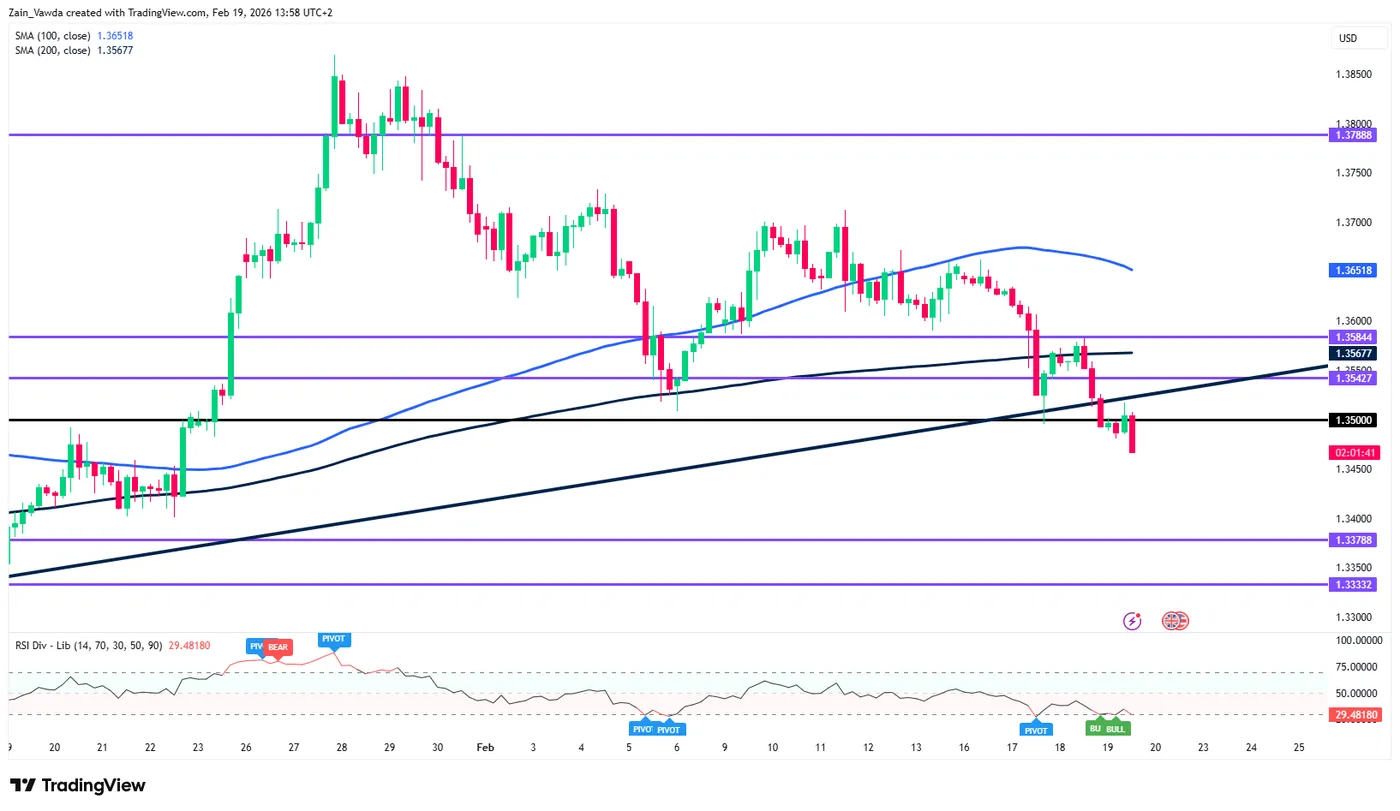
Cable has been on a downward trend printing lower highs and lower lows since the peak of 1.38700 printed on January 27, 2026.
The pair has staircased its way lower since then and has finally breached the medium-term ascending trendline with a daily candle close yesterday.
This sets up a potential drop of as much as 470-odd pips moving forward.
GBP/USD Daily Timeframe, February 19, 2026
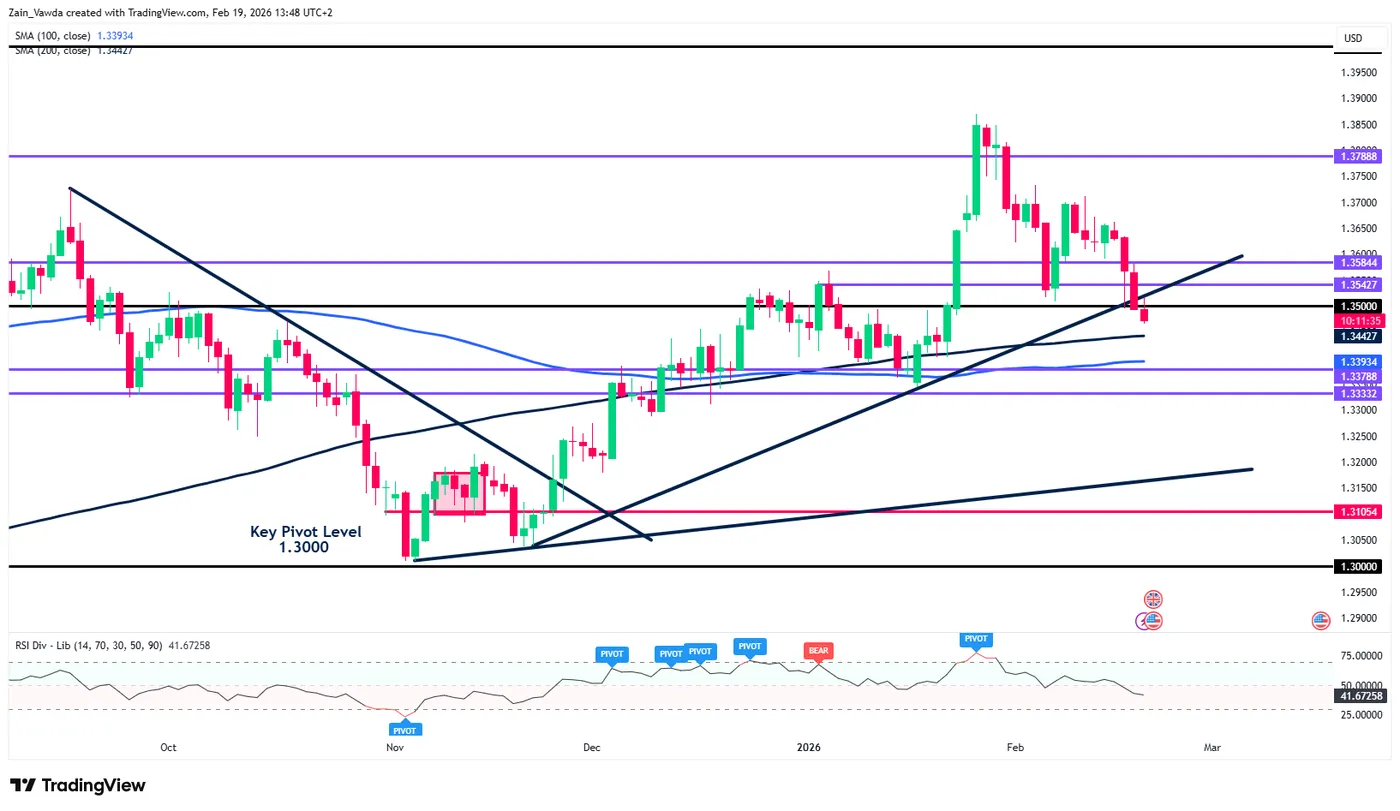
Source: TradingView
Dropping down to a four-hour chart, GBP/USD is printing a fresh low while the RSI-period 14 hovers in oversold territory.
That is a concern and may hint at a pullback in the near-term before a bearish continuation.
Keep an eye on the swing highs around 1.3573 and potentially 1.3651 which lines up with the 100-day MA on the H4 chart.
GBP/USD Four-Hour Timeframe, February 19, 2026
Source: TradingView
Scenario 2
The concern for this setup is the US dollar which is enjoying a renaissance this week which has driven a part of this breakout.
Later today markets will focus on US data releases of initial jobless claims and the December trade surplus report.
If today’s data confirms a narrower-than-expected deficit for December, it would likely boost growth projections for the fourth quarter of 2025 and provide the US dollar with a short-term lift.
Despite this potential for a bounce, the broader outlook for the greenback remains challenged. While the US Dollar Index (DXY) may drift toward the 98.00 level on positive data, a pervasive "sell the rally" sentiment continues to dominate the market.
Many market participants expect the currency’s strength to be fleeting, as long-term expectations for Federal Reserve policy and global trade shifts maintain downward pressure on the dollar's overall trajectory.
This overarching theme around the US dollar is a major concern and could be the one to scupper a potential deeper selloff in GBP/USD.
In order for the bearish setup to be invalidated, a daily candle close above the 1.3700 swing high on the daily chart is needed to put bulls back in control.
GBP/USD Daily Timeframe, February 19, 2026
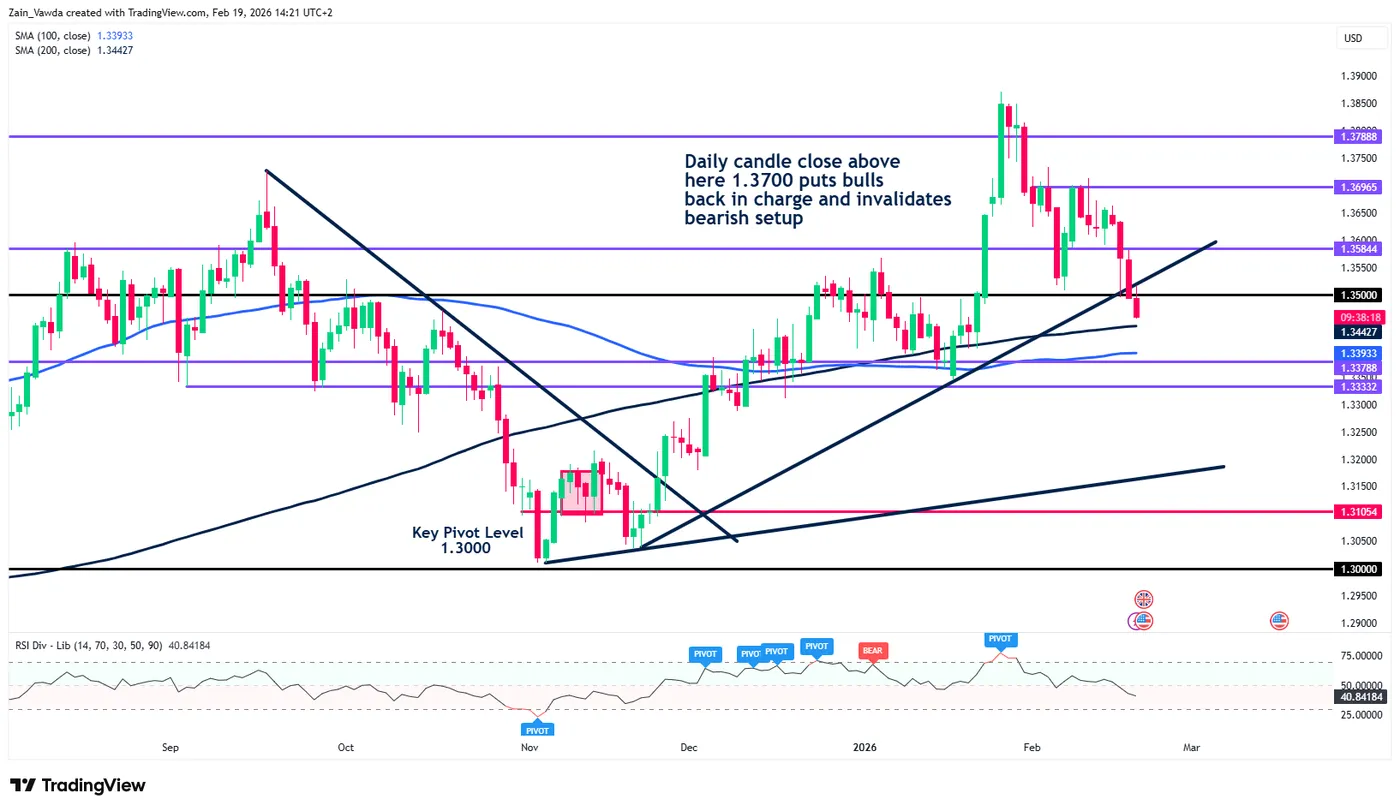
Source: TradingView
Safe Trades XX.
BoE’s Mann: Inflation improving, but jobless rise ‘very much of a concern’
BoE MPC member Catherine Mann described this week’s inflation data as “good numbers,” though she cautioned that underlying pressures had not improved as much as policymakers had hoped. While headline CPI continues to slow, Mann signaled that the central bank remains focused on whether the disinflation trend is sustainable rather than temporary.
She pointed to the rise in unemployment as "very much of a concern", added that the MPC is approaching a point where policy must carefully balance inflation control with labor market risks. That framing suggests internal debate is shifting from solely combating inflation toward weighing growth considerations more seriously.
However, Mann stopped short of endorsing a March rate cut. She questioned whether the projected fall of inflation toward 2% in coming months truly reflects a durable return to target.
Mann voted with the majority to hold rates in the recent 5-4 decision and indicated the time for a cut is drawing nearer.
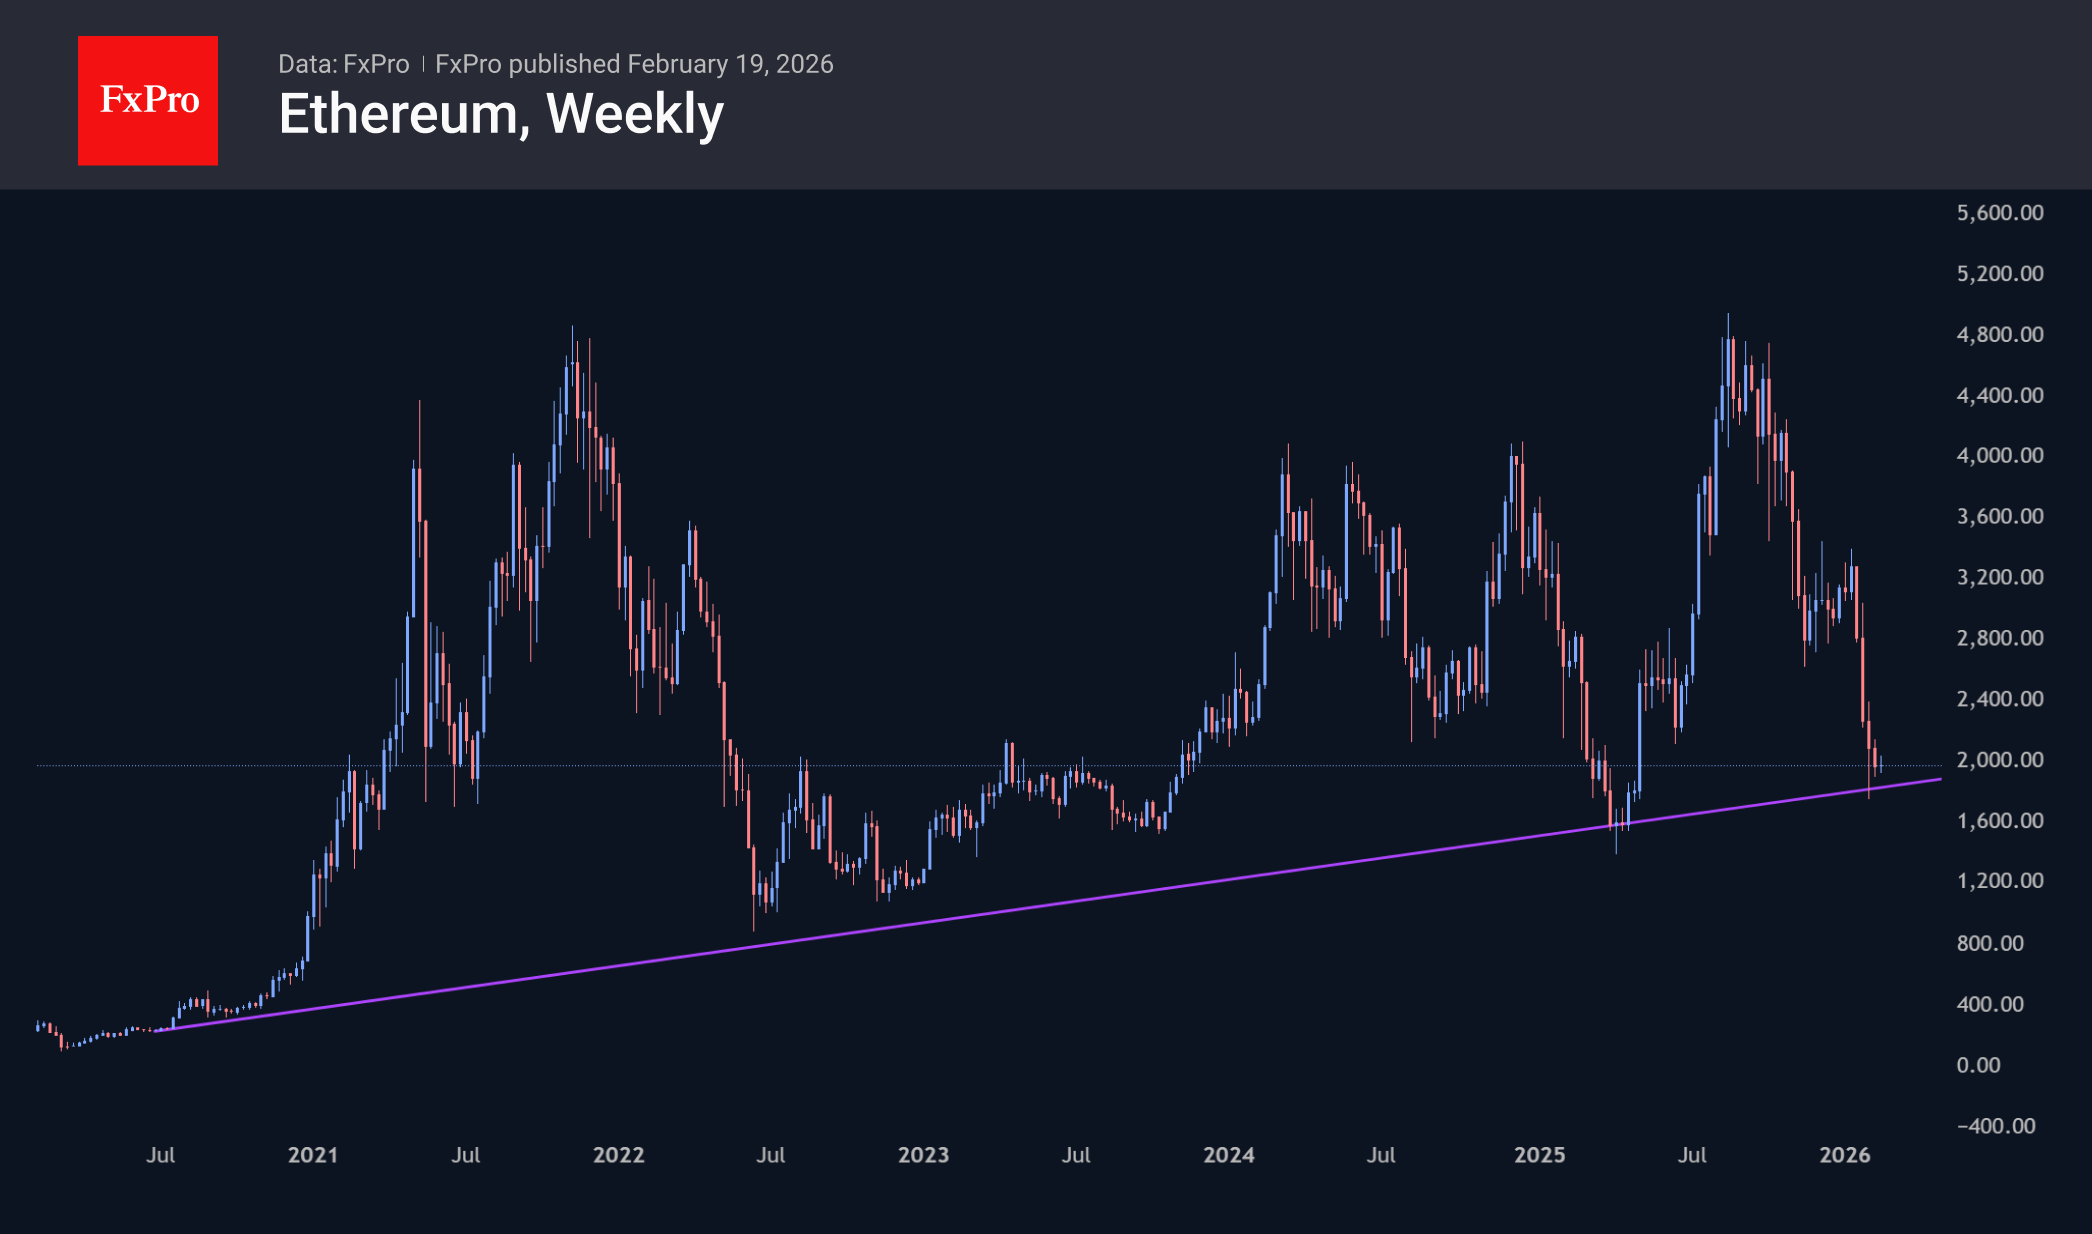
Ethereum Resting on a 6-Year Trend
Market Overview
The crypto market cap fell by more than 1% in 24 hours to $2.31 trillion, approaching last week’s lows but leaving the market 5% above its low point on 6 February. The market’s range continues to narrow, suggesting that volatility is likely to soon break out of the $2.3-2.4T range. Given the previous dynamics and the increasingly cautious nature of growth in the US stock markets, there is a greater chance of an early update of local lows with a dip to the levels we saw in the second half of 2024.
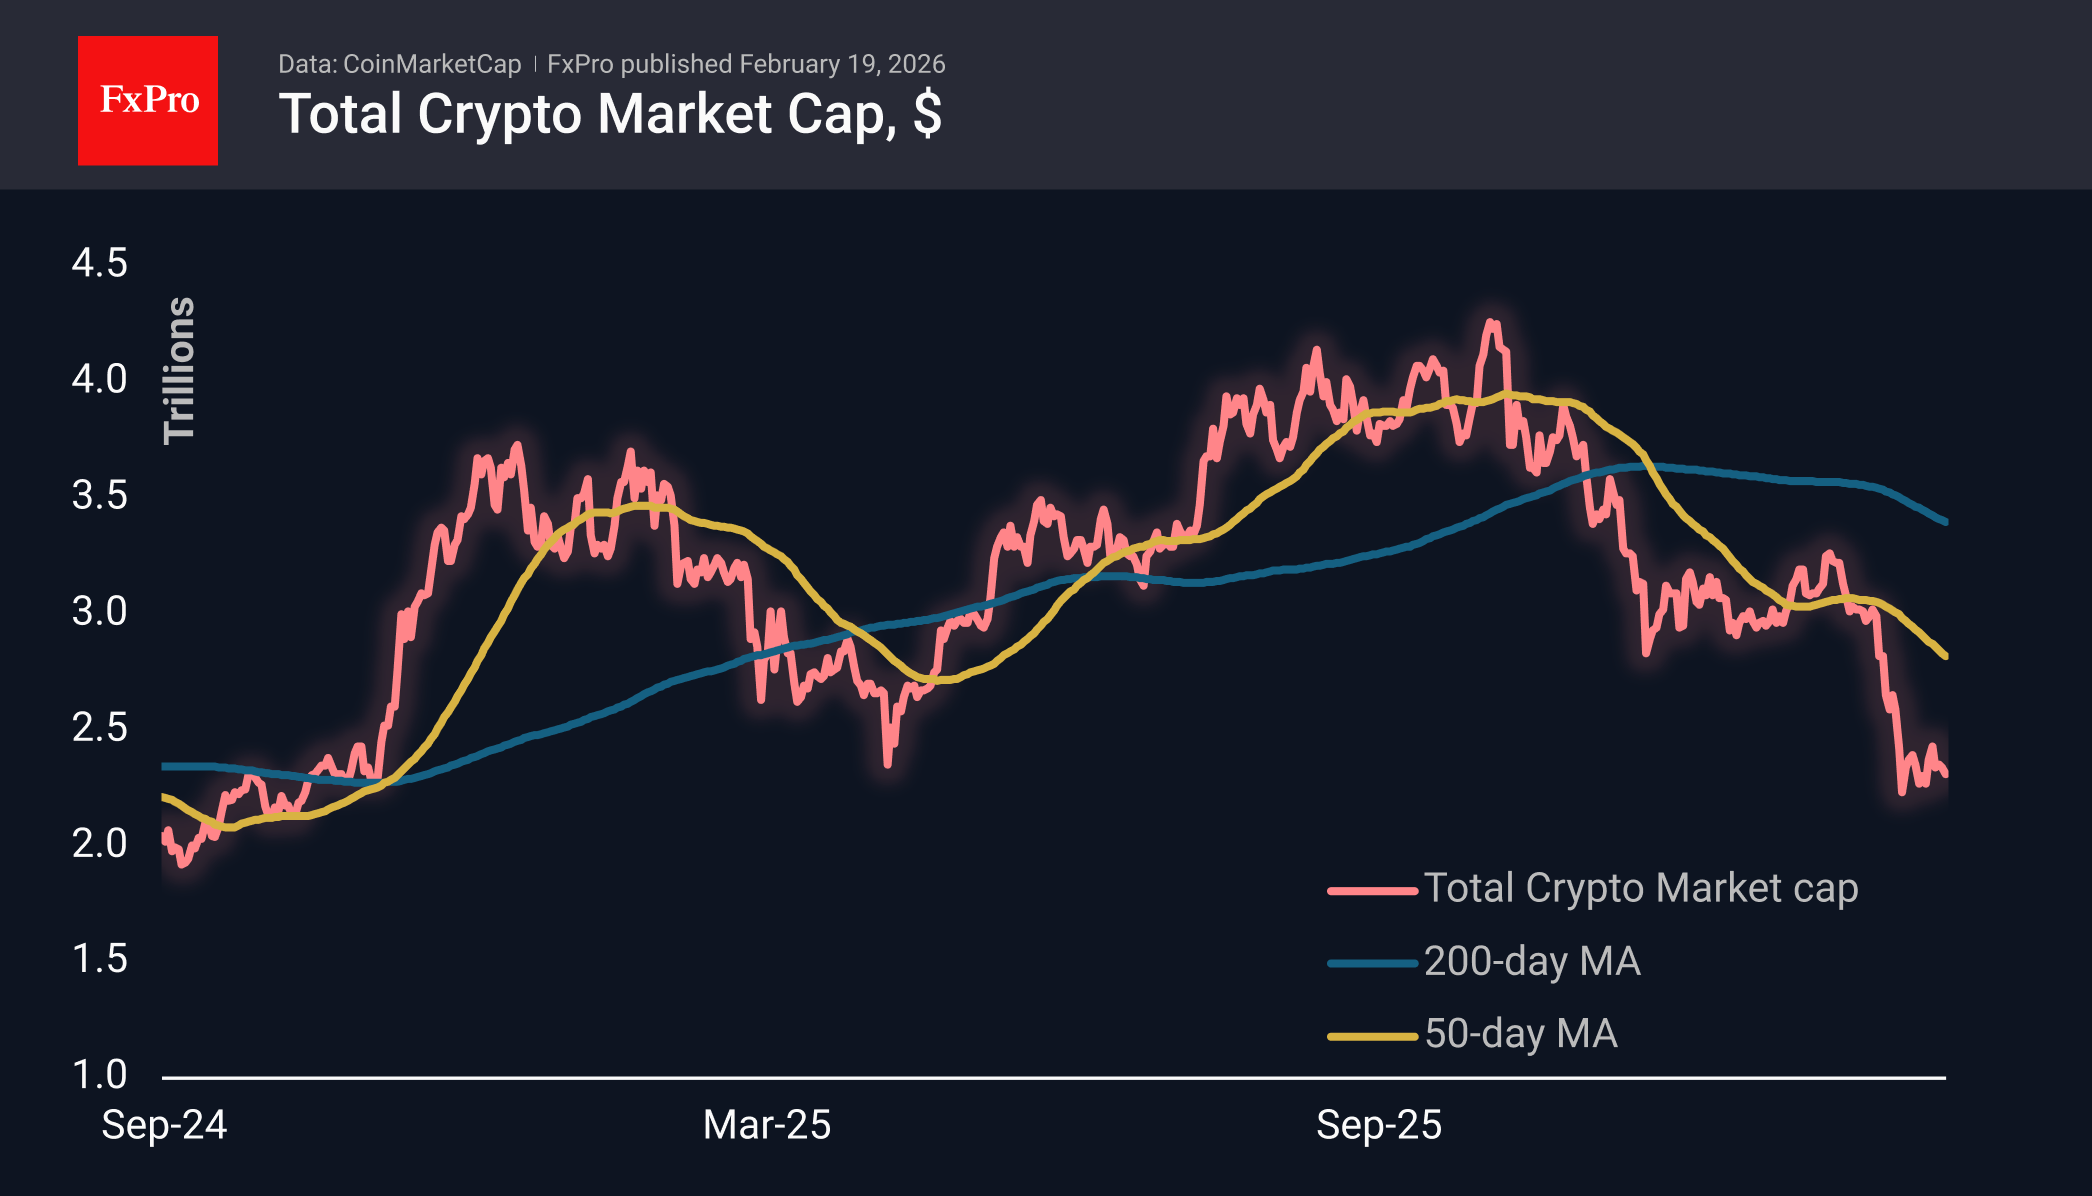
Bitcoin is trading just above $67K, losing slightly under 1%, which is better than the market, as active selling has moved to altcoins outside the top five. BTC is trading at the bottom of the downward range of the last week and a half.
Ethereum is resting on a support line that originated in 2020 and was touched in early 2024 and at the February lows. This global trend line now also coincides with the area around $2,000, which further reinforces its significance. However, for such a serious event as the breakdown of the 6-year support, confirmation in the form of a failure below the recent lows at $1,500 is required. Until then, bulls may remain hopeful, attracting long-term buyers on dips.
News Background
The indicator of Bitcoin inflows from large holders to the Binance exchange has reached record levels, indicating increased pressure on BTC from large players, according to CryptoQuant.
The current state of the crypto market resembles the final stage of the 2022 bear phase, which was followed by a protracted period of consolidation, according to K33.
Bitcoin has only entered the first phase of the bear cycle, according to Willy Woo, co-founder of the CMCC Crest investment fund. The second phase will be associated with a fall in global stock markets, and the third will mark a period of stabilisation.
Strategy bought 2,486 BTC ($168.4 million) over the past week at an average price of $67,710 per coin. Strategy now owns 717,131 BTC, purchased for $54.5 billion at an average price of $76,027 per bitcoin.
Japan’s Metaplanet reported a net loss of $619 million for 2025. The negative financial result is due to the revaluation of the company’s Bitcoin reserves.
Ethereum’s share of staking exceeded 50% of the total supply of the asset for the first time in history, according to Santiment. The queue for Ethereum staking is near historic highs — 3.8 million ETH (waiting time — 67 days). BlackRock has taken the first step towards launching a staking Ethereum ETF in the United States.
The Founders Fund, a venture capital fund owned by billionaire investor Peter Thiel, has sold all of its shares in the DAT company ETHZilla, one of the largest corporate holders of Ethereum. Back in August, Thiel’s share was 7.5%.
Updated rules from the US Internal Revenue Service (IRS) have scared American crypto investors. Starting in 2026, all US-licensed crypto exchanges will be required to disclose information about their clients, from the volume of investments to the profits or losses they have.
EUR/USD Chart Analysis: Volatility May Return to the Market
As indicated by the Bollinger Bands width indicator, the EUR/USD market remained relatively subdued in February, with the indicator twice retreating towards its lower boundary.
However, price action over the past two sessions suggests renewed activity — the range formed between 11 and 17 February has been broken to the downside by sellers.
From a fundamental perspective, this move reflects a combination of factors, including:
- → Reports that European Central Bank President Christine Lagarde is planning to step down before the end of her term in October next year. This development is viewed as a bearish factor for the euro.
- → Minutes from the FOMC meeting showing that policymakers are in no rush to cut interest rates. Opinions were divided, with some members even open to raising the Fed rate if inflation proves persistent. The prospect of a tighter Federal Reserve stance is supportive for the US dollar.
Technical Analysis of the EUR/USD Chart
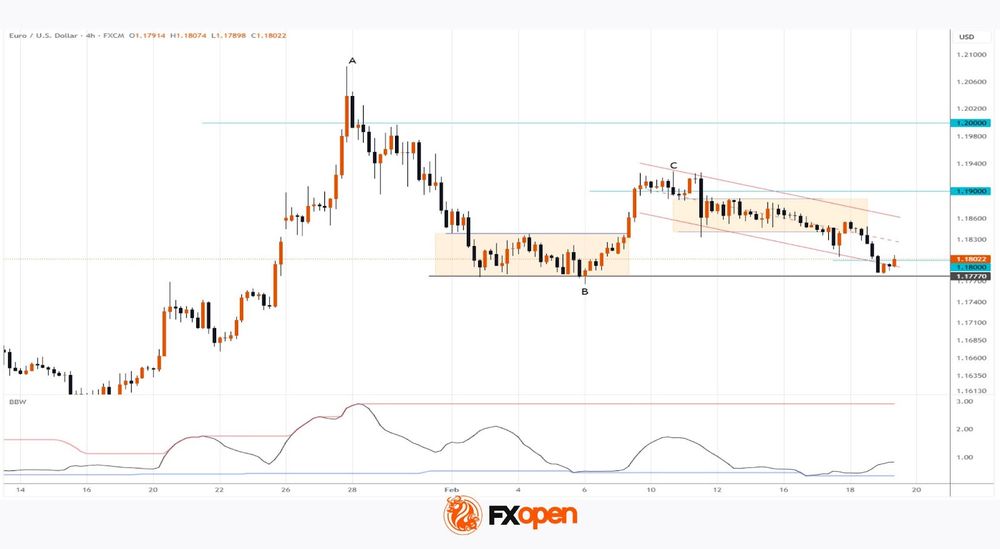
The recent bearish pressure has pushed EUR/USD back towards a key support level around 1.1777. Bears attempted to break below this level on 6 February but failed, resulting in a false breakout at point B.
While bulls may attempt a rebound from this support, the broader picture suggests that sellers currently hold a slight advantage in February, reflected in the following:
- → Price action has been forming a descending channel since 11 February (shown in red).
- → High C sits roughly halfway along the A→B bearish impulse. According to Fibonacci proportions, this is consistent with a bearish market structure.
- → Bulls have been unable to secure a foothold above key psychological levels — first above 1.2000 and subsequently above 1.1900.
If selling pressure persists, a decisive break below 1.1777 cannot be ruled out, which could in turn trigger a fresh surge in volatility.
Trade over 50 forex markets 24 hours a day with FXOpen. Take advantage of low commissions, deep liquidity, and spreads from 0.0 pips (additional fees may apply). Open your FXOpen account now or learn more about trading forex with FXOpen.
This article represents the opinion of the Companies operating under the FXOpen brand only. It is not to be construed as an offer, solicitation, or recommendation with respect to products and services provided by the Companies operating under the FXOpen brand, nor is it to be considered financial advice.
WTI Crude Reaches February High
As the XTI/USD chart shows, the price of a barrel has today moved above the highs of 4 and 11 February, rising beyond the $66 level and marking its highest point since the start of the month. Bullish sentiment is being driven by escalating geopolitical tensions, primarily linked to Iran. According to media reports:
- → Negotiations between the parties remain inconclusive. Although Tehran stated that a “general agreement” had been reached with Washington on the framework of a potential nuclear deal, US Vice-President JD Vance indicated that Iran had failed to meet US demands.
- → President Donald Trump, in turn, maintains that the use of military force remains an option.
This raises the prospect of Iran attempting to block the Strait of Hormuz — a key route for global oil and gas shipments. Any US military action could evolve into a prolonged campaign, unlike the short-lived operation in Venezuela.
Heightened geopolitical risk is therefore pushing oil prices towards fresh yearly highs.
Technical Analysis of the XTI/USD Chart
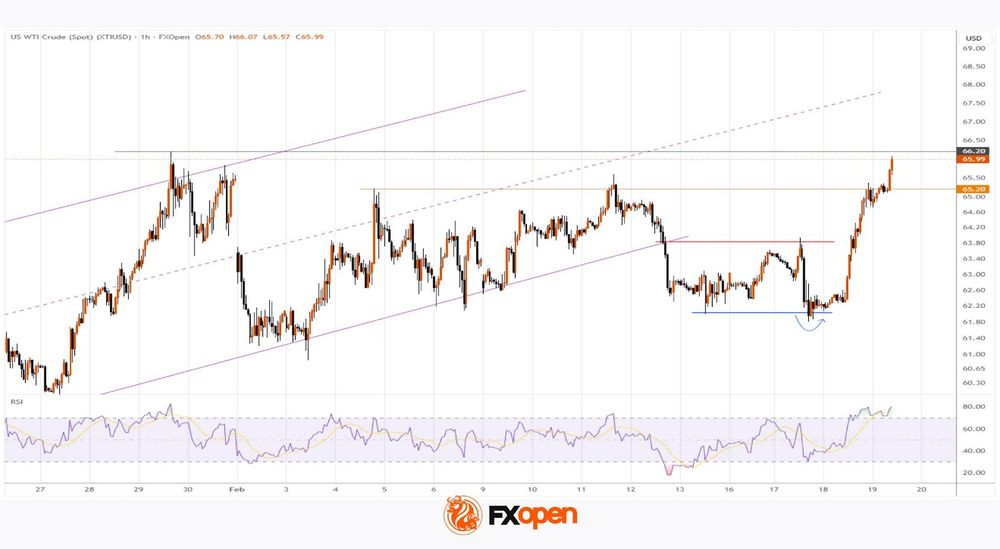
When analysing the oil price chart on 12 February, we:
- → used WTI price swings to construct a broad ascending channel (shown in purple);
- → identified patterns suggesting that initiative was shifting to the bears.
Since then, oil prices not only retreated to the lower boundary of the channel but also broke below it on the same day. The breakout level later acted as local resistance on 17 February.
Subsequently, a false bearish breakout (indicated by the arrow) signalled that selling pressure had been exhausted. Bulls then capitalised on the tense news backdrop to push prices higher.
It is possible that the 65.20 level will now act as support, with scope for a fresh yearly high in the near term. Should signs of military action emerge, traders should be prepared for a scenario in which WTI prices move well above $66.20.
Start trading commodity CFDs with tight spreads (additional fees may apply). Open your trading account now or learn more about trading commodity CFDs with FXOpen.
This article represents the opinion of the Companies operating under the FXOpen brand only. It is not to be construed as an offer, solicitation, or recommendation with respect to products and services provided by the Companies operating under the FXOpen brand, nor is it to be considered financial advice.
EUR/USD Forced Lower: US Dollar Has a Strong Case
EUR/USD on Thursday stabilised at 1.1792 after a sharp decline the day before. The US dollar was supported by strong US macro data and unexpectedly tough signals from the Fed.
The minutes of the previous meeting showed that disagreements remain within the Federal Reserve regarding the future path of rates. This suggests that it may not be easy for the new chair to implement a rate cut. Some members had previously explicitly admitted the possibility of a rate hike if inflation remains above target.
The market has slightly reduced expectations for policy easing this year, but still prices in two 25-basis-point cuts before the end of the year.
Additional support for the dollar was provided by industrial production data. It grew at the highest rate in almost a year. Orders for core capital goods exceeded forecasts, and the number of new home mortgages reached a five-month high.
PMI indices and GDP data are due next, which may provide additional guidance on the path of interest rates.
Technical Analysis
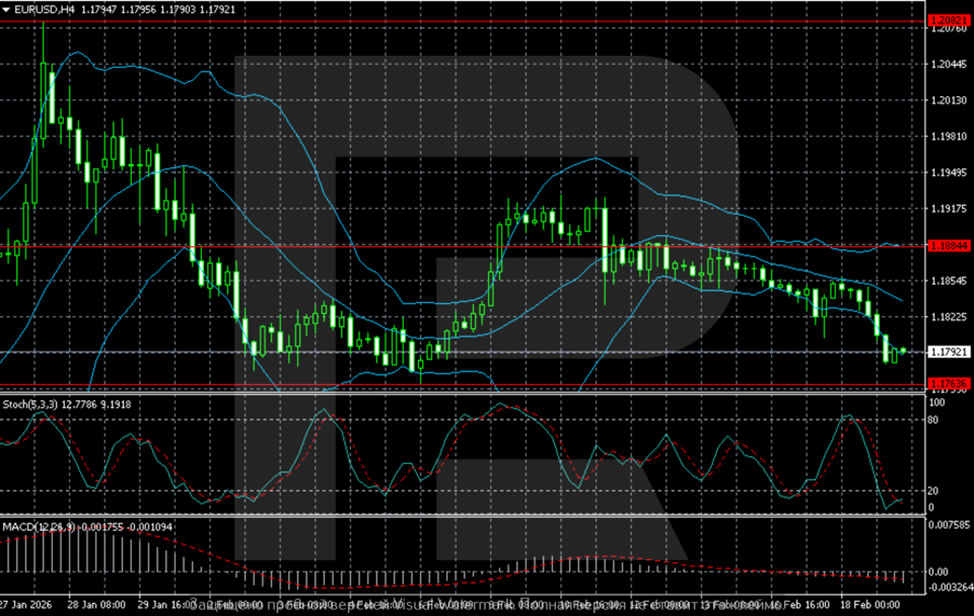
On the H4 chart, EUR/USD stays close to 1.1790–1.1800 after breaking support at 1.1885 and accelerating the decline. The price has firmed below the Bollinger Bands' midline; the bands have widened, indicating bearish momentum. The MACD is in negative territory; the histogram is deepening further, reinforcing downward momentum. The Stochastic oscillator has rebounded from oversold. Against this background, a brief correction is possible, but the structure remains weak. The nearest support is at 1.1765, and resistance is at 1.1885.
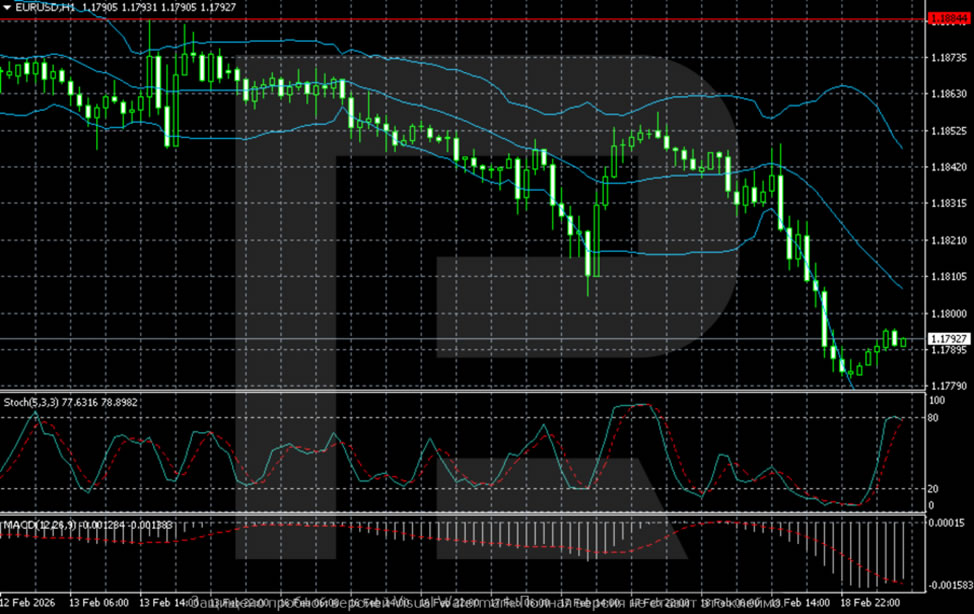
On the lower H1 time frame, a sharp downward move is visible, followed by local stabilisation. The price is forming a small bounce off 1.1780 but remains below the Bollinger Bands' middle line. The MACD remains negative, although the pressure is gradually decreasing. The Stochastic oscillator is in the overbought zone, suggesting that any corrective rebound could fade in the 1.1820–1.1840 area.
The overall picture points to a short-term rebound within a broader bearish move.
Conclusion
In summary, EUR/USD remains under decisive pressure following hawkish Fed signals and resilient US economic data. The technical breakdown below key support has confirmed a bearish shift, with momentum indicators favouring further downside despite oversold conditions. The current stabilisation appears corrective rather than reversal, with any bounce likely capped near 1.1820–1.1840. Upcoming US PMI and GDP releases will shape the near-term direction. A break below 1.1765 would open the door to deeper losses towards 1.1700, while a sustained move above 1.1885 is needed to alleviate bearish pressure.
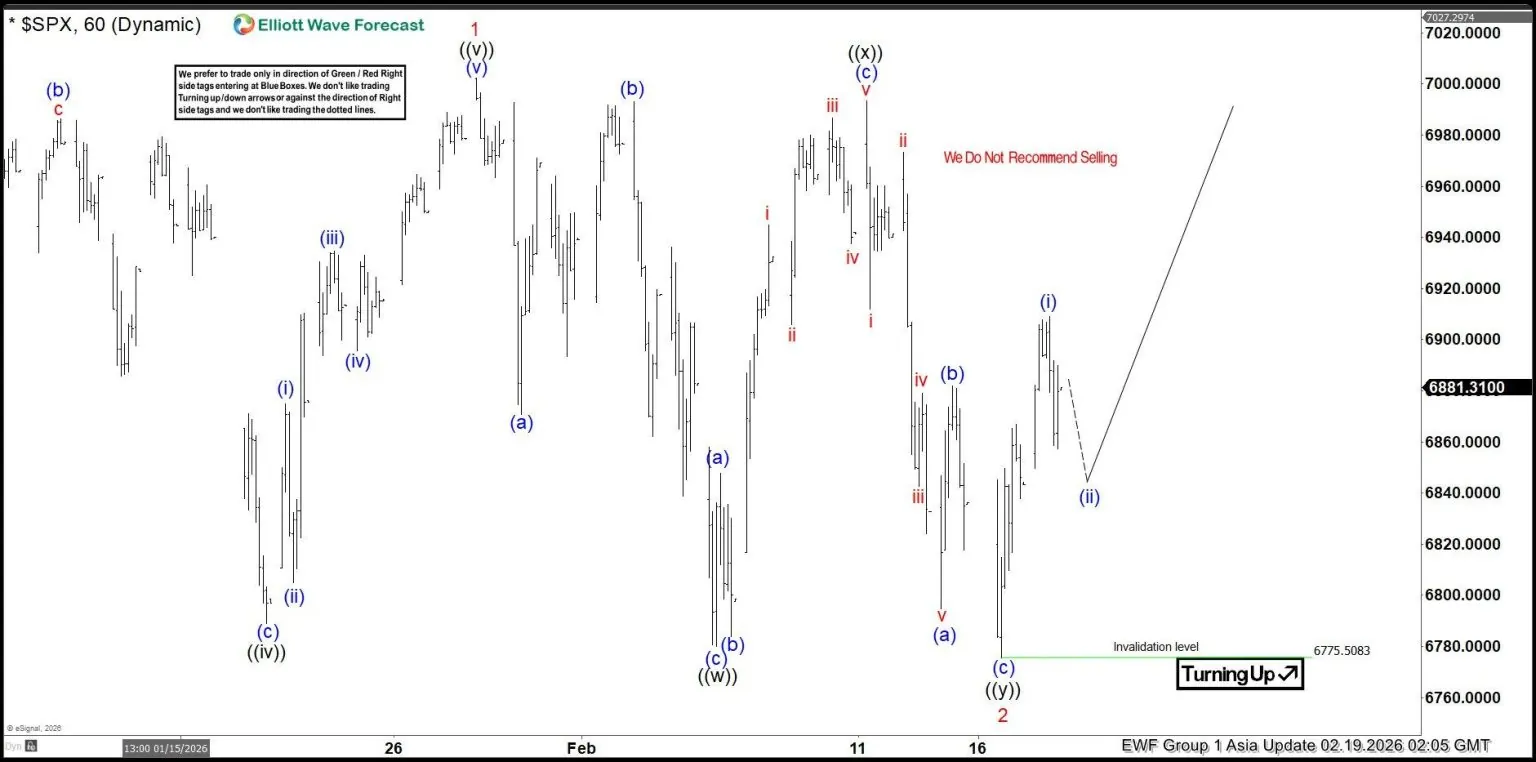
SPX Completes Correction and Turns Higher in Wave 3
S&P 500 completes wave 2 pullback near 6775.50 and resumes bullish momentum above the blue box.
The S&P 500 (SPX) appears to have completed its pullback in red wave 2 at the equal legs area near 4776, unfolding in a corrective 7-swing structure. From that support zone, price has turned higher, suggesting wave 3 is now underway. While there remains a possibility that the correction could extend into an 11-swing structure toward the 1.618 Fibonacci extension around 6440, but we are taking a more aggressive stance that the pullback has already ended. The strong reaction from the blue box area reinforces the bullish outlook and supports the idea that buyers have regained control.
Wave 3 typically represents the strongest and most impulsive leg within the Elliott Wave sequence. Early price action is showing constructive characteristics, indicating upside momentum is building. As long as SPX holds above 6775.5083 low, the preferred scenario calls for continued upside extension. We do not recommend selling against the current structure. Instead, pullbacks are expected to remain corrective and provide buying opportunities in alignment with the developing bullish sequence.
Overall, the index is positioned for further upside while holding above key support levels.
SPX 1-Hour Elliott Wave Chart From 2.19.2026
SPX Elliott Wave Video:
https://www.youtube.com/watch?v=uoC7ILk7MrE
Oil Prices Grabbed a Lot of Attention
Markets
US Treasuries underperformed yesterday with the curve bear flattening. Daily changes ranged between +3 bps (3-yr) and +1.7 bps (30-yr). The US 2-yr yield gets again more breathing room above key 3.4%-support with the 10-yr yield limping away from the psychological 4% area as well. A solid batch of eco data added to the feeling that the Fed stays put in March. December durable goods orders beat the mark on every level, including for the crucial core gauge which serves as a proxy for investments in GDP calculations (+0.9% M/M). Tomorrow we’ll find out when the Bureau of Economic Analysis reports Q4 GDP numbers. Housing data and January industrial production (+0.7% M/M) numbers equally beat consensus. During US trading hours, Minutes of the January FOMC meeting revealed that the vast majority of participants judged that downside risks to employment had moderated in recent months while the risk of more persistent inflation remained. Several participants cautioned that easing policy further in the context of elevated inflation readings could be misinterpreted as implying diminished policymaker commitment to the 2% inflation objective. In an hawkish shift, several would’ve supported two-sided language on the rate path putting the door open for a rate hike if necessary. The data/Minutes-combo helped the dollar out. The trade-weighted greenback (DXY) had its second best day YtD, rising from 97.14 to 97.74. From a technical point of view, the move lacked significance with first minor resistance at 97.99. EUR/USD fell from 1.1855 to 1.1783 with first minor support looming at 1.1766. GBP/USD already closed just below that first technical reference (1.3509) with GBP-weakness this week also at play (following labour market and to a lesser extent CPI numbers). EUR/GBP simultaneously bumps into EUR/GBP 0.8746 resistance with the UK currency at risk of technical follow-up losses in case those levels give away. It's our preferred scenario with UK markets preparing for a March BoE rate cut.
Oil prices grabbed a lot of attention as well with Brent crude preparing a break-out above the $70/b area. Prices jumped by the most since October yesterday after Axios reported that a major war in the Middle East could begin very soon. US officials said that Iran needs to come back with a detailed proposal in two weeks after this week’s Geneva talks. Last summer, the White House set a two-week window to decide between further talks or strikes. Three days later, he launched Operation Midnight Hammer, attacking three nuclear facilities in Iran. The developing narrative is one to look out for today, especially as it doesn’t seem to interfere with a broader risk rebound. Key European indices gained over 1% yesterday with US benchmarks ending 0.25% (Dow) to 0.75% (Nasdaq) higher. The US eco calendar contains trade data, Philly Fed Business Outlook and weekly claims. In Europe, consumer confidence is due. We expect them to play second fiddle today.
News & Views
• Australian January employment grew by 17.8k. That was slightly below the 20k expected but came after an upwardly revised 68.5k in December. Full-time employment rose by 50k, partly offset by a fall of 33k in part-time employment. Strong labour demand was even more visible in the rise in hours worked by 0.56% in January, following an already strong increase in December (0.4%). The unemployment rate stabilized at 4.1%, defying expectations for an uptick to 4.2%. With the central bank’s Q1 forecast at 4.3%, it means downward revisions in the next projections are likely. Labour market participation is at a solid 66.7%. The numbers vindicate the Reserve Bank of Australia, which raised the policy rate earlier this month amid concerns for capacity constraints keeping inflation above target. A tight labour market - the RBA estimates the equilibrium unemployment rate at 4.6% - isn’t going to ease those. Australian swap yields rally 4.4-7.8 bps with front end underperformance revealing increasing rate hike bets. Market implied probabilities for May rise to 87%, for June to 97%. AUD/USD ekes out gains to 0.705.
The IMF in a report yesterday said China’s industrial policies create international spillovers and pressures through overcapacity and have combined with weak domestic demand made Chinese economic growth more reliant on manufacturing exports. It repeated its call to move to a consumption-led model while urging the country to slash state support for the industrial sector. The IMF estimates that China spends around 4% of GDP subsidizing companies in critical sectors and recommended to cut that in half in the medium term. China’s global trade surplus last year for the first time ever surpassed the $1tn mark, with export flows having rerouted from the US (-20%) to Africa (+26%), South-East Asia (+13%) and the EU (+8%).