Sample Category Title
The Battle for 155: Hawkish FOMC minutes fuel USD/JPY breakout hopes
- The primary driver for the USD/JPY climb was the Federal Reserve's cautious stance on rate cuts, which boosted the US Dollar.
- A massive surge in Japanese exports (16.8% YoY) failed to lift the Yen due to the widening policy gap with the Fed.
- The pair is at a critical technical juncture, with a sustained close above the 155.00 resistance level needed for the move to continue.
USD/JPY experienced a dynamic trading session characterized by a renewed surge in US Dollar strength following hawkish signals from the Federal Reserve post the FOMC minutes (for more on this read January FOMC Minutes and Wartime – North American Mid-Week Market update).
Japanese economic data showed a massive surge in exports, the Yen remained largely on the defensive.
Price Action: US Dollar regains momentum
USD/JPY climbed approximately 0.80% during the session, trading near the 154.50 mark.
Earlier in the day, the pair showed signs of consolidation, holding near its mid-Bollinger Band on the daily charts as volatility appeared to fade.
However, the release of the FOMC Meeting Minutes acted as a catalyst for a potential breakout, pushing the pair toward key resistance zones.
Key drivers behind the move
Hawkish FOMC Minutes: The primary driver for the late-session jump was the Federal Reserve’s January meeting minutes. The report indicated a cautious approach to rate cuts, with policymakers emphasizing the need for more evidence of cooling inflation.
This prompted traders to scale back expectations for near-term easing, boosting US Treasury yields and the Dollar.
Japanese Export Surge: Japan released provisional trade data for January 2026, showing a massive 16.8% year-on-year increase in exports, the largest jump since late 2022. Exports to Asia and Europe were particularly strong (up over 25%).
Despite this positive fundamental data, the Yen’s reaction was muted as the market focused more on the widening policy gap between the Fed and the Bank of Japan (BoJ).
Japan-US Investment Ties: News broke regarding Japan’s plan to invest up to $36 billion in US oil, gas, and mineral projects. This is part of a larger $550 billion commitment under a trade pact with the US.
While these ties strengthen long-term economic relations, the immediate capital flow implications contributed to a stable-to-stronger Dollar.
Technical Analysis - USD/JPY
The technical landscape for USD/JPY remains a "battle of the levels":
The Bull Case: A decisive push above the 155.00 psychological level could open the door for a run toward the 158.00 level.
The daily candle close with little upside work suggests that bullish momentum is strong. However, for confirmation the RSI needs to break above the 50 level which would hint at a shift to bullish momentum and could facilitate a move higher.
A break above the 155.00 handle may run into a problem at the 50-day MA which rests at the 155.99 handle.
The Bear Case: Some market analysts maintain a broader bearish bias, suggesting that the current rally is merely a retracement of the massive sell-off seen in January (which peaked at 159.45).
If the pair fails to close above the swing high at 157.66, the overall trend remains bearish in nature and this bullish rally may run out of steam.
For now though the US dollar may play a crucial role in where the pair heads to next.
USD/JPY Daily Chart, February 18, 2026
Source: TradingView (click to enlarge)
The road ahead
Looking forward, the USD/JPY trajectory will likely be dictated by upcoming US labor market data and further commentary from BoJ officials.
While Japan's trade resilience is a long-term positive for the Yen, the "higher-for-longer" narrative from the Federal Reserve remains the dominant force keeping the pair in a high-altitude breakout zone.
Traders should watch for a sustained close above 155.00 to confirm if this rally has the legs to retest year-to-date highs.
For all market-moving economic releases and events, see the MarketPulse Economic Calendar.
Gold (XAU/USD) Breaches $5000/oz: Has Bullish Trajectory Resumed?
- Gold (XAU/USD) has breached $5000/oz, challenging the consensus that its recent rally was a "dead cat bounce."
- While the long-term trend is bullish, the short-term view is neutral-to-bearish, with a key upside breakout level at 5046.
- A barrage of US data and geopolitical risk ahead this week could be a key driver for Gold prices.
The price of gold has breached the $5000/oz handle once more. A surprise given the overwhelming consensus by analysts that the recent rally had shown signs of being a ‘dead cat bounce’ given the grind we saw from gold prices.
However, Gold has once again grinded its way back above the key $5000/oz handle, with more questions now being asked. Chief among them is whether the precious metal will be able to kick in from here or will we be in for more indecision for the rest of the week?
What was behind the recent pullback in Gold prices?
There has been a lot of mixed messages as to what the reasons were behind Gold's recent slide.
In my view the initial pullback in gold prices was driven by a strengthening US dollar and a shift toward risk-off sentiment across global markets.
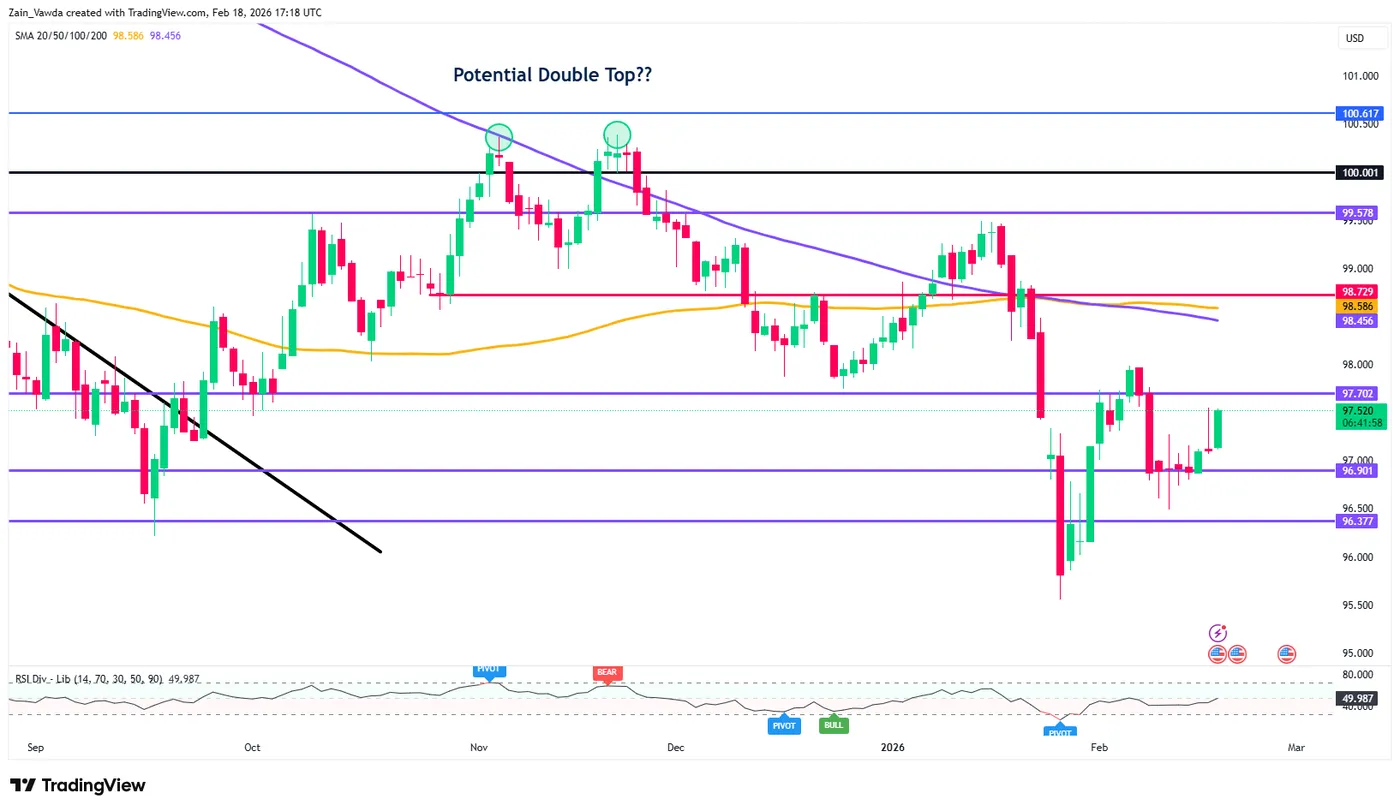
US Dollar Index (DXY) Daily Chart, February 18, 2026
Source: TradingView
These price swings were further intensified by thin liquidity, as major Asian markets were closed for the Lunar New Year, making gold more vulnerable to macroeconomic shifts and currency fluctuations.
Despite this sensitivity to the dollar and broader market nerves, the recent decline appears to be a temporary correction rather than a long-term trend. As Asian markets reopen and liquidity returns to normal levels, gold appears to have found firmer support.
Given the ongoing macroeconomic uncertainty and solid underlying fundamentals, any further price dips will likely attract fresh buying interest from investors looking for a safe haven.
Looking Ahead: US data, US dollar dynamics and geopolitical risks
Looking ahead, US markets will focus on housing data, remarks from Fed officials, GDP figures for Q4 2025, and the release of the Fed’s preferred inflation measure, the core Personal Consumption Expenditures (PCE) Price Index.
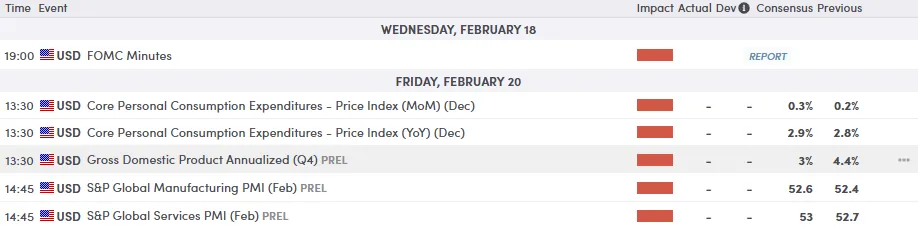
For all market-moving economic releases and events, see the MarketPulse Economic Calendar. (click to enlarge)
All of these will have some role to play in Gold's next move as markets remain somewhat cautious given the uncertainties at play.
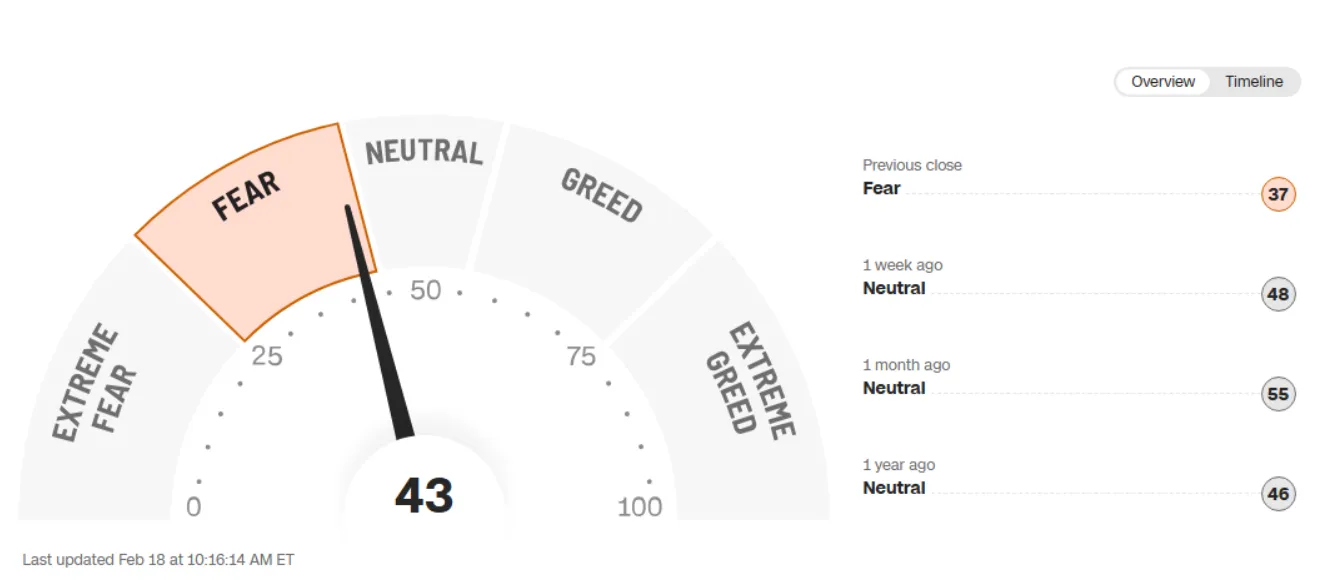
Looking at the fear and greed index and markets are still in fear territory with a score of 43. This is also keeping Gold prices supported, as fear tends to keep market participants interested in safe haven bets.
Source: FinancialJuice
Technical Outlook - Gold (XAU/USD)
From a technical standpoint,Gold has resumed its long term bullish trajectory but significant challenges remain.
The overall long-term structure remains bullish (upward), but the shorter-term chart (H4) shows a neutral-to-bearish tilt as the market consolidates its recent 15% drop from the $5,500 highs.
Looking at the four-hour chart below and the range between 5096 and 4760 will be key in the near-term.
Looking at the potential for an upside breakout and the swing high at 5046 (printed on February 13) is the first point of contention. A four-hour candle close above this level may open the dorr for a range break beyond the 5096mark and open up a potential 330 odd dollar move to the upside.
Further supporting the bullish breakout narrative is the period-14 RSI on the H4 chart which is now above the 50 level, hinting at bullish momentum.
Conversely, a move lower here first needs to navigate support at 4908 before the swing low around the 4860 handle comes into focus.
Only then will the range low around 4760 become an area of focus.
Gold (XAU/USD) Four-Hour Chart, February 18, 2026
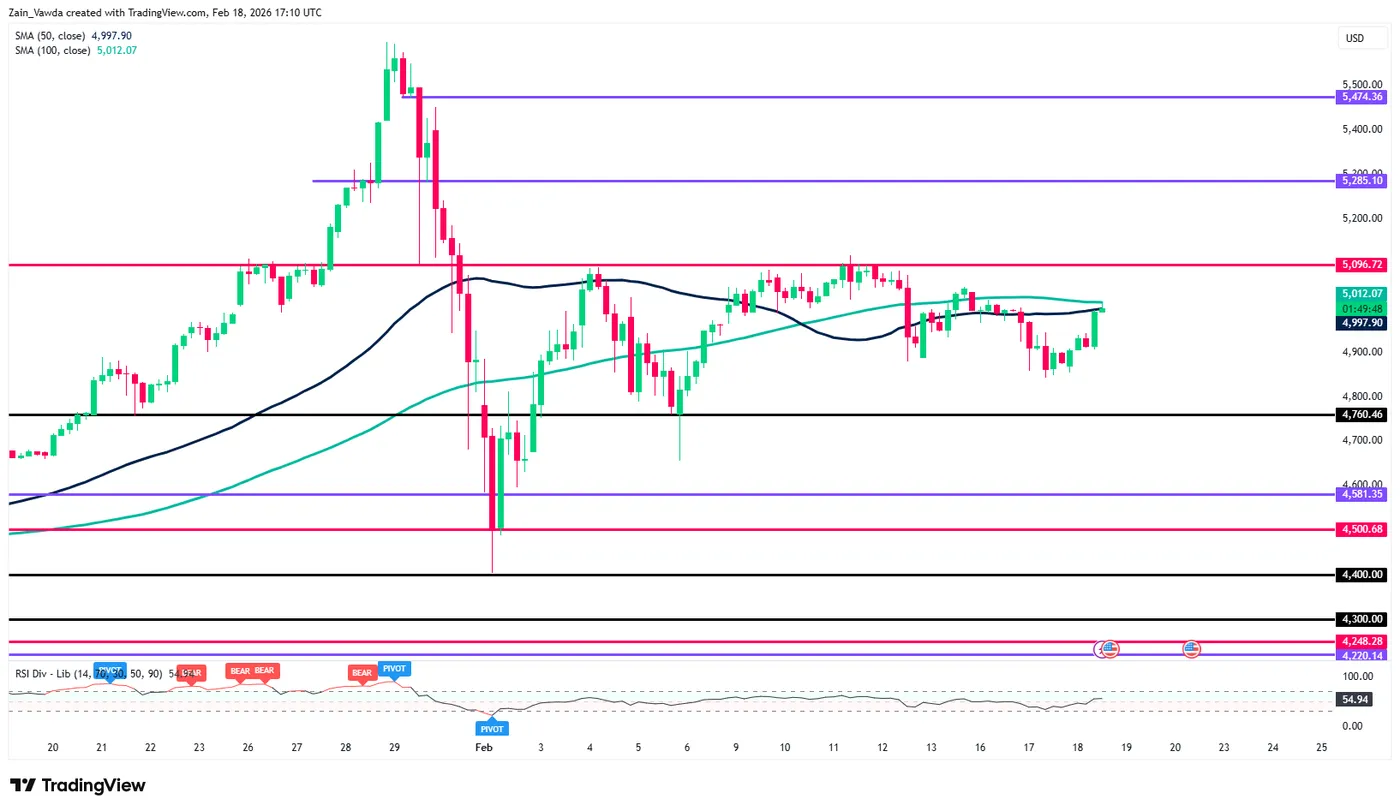
Source: TradingView (click to enlarge)
FOMC Members Saw Risks Tilting Towards Inflation in January
The Federal Reserve Open Market Committee (FOMC) held the federal funds rate at a target range of 3.50% to 3.75% in January.
The minutes showed that the committee is still concerned about inflation remaining above 2%. Participants noted that elevated inflation readings seemed to be largely due to core goods inflation, which appeared to have been boosted by tariffs, and they continue to expect these effects to diminish later this year. But most participants "cautioned that progress towards the Committee's 2 percent objective might be slower and more uneven" than previously expected, and saw meaningful risk of inflation running persistently above target.
With respect to the labor market, participants noted that recent data suggested "labor market conditions may be stabilizing after a period of gradual cooling". Participants nonetheless noted that while layoffs remained low, hiring also remained low, and several participants noted business contacts expressing caution in hiring decisions. Most participants also noted that while downside risks to the labor market remained, they had diminished since the last meeting.
Participants generally agreed that economic growth would remain solid in 2026 but felt that uncertainty about the growth outlook was high, as was the case in the prior meeting's minutes.
The vast majority of members "judged that downside risks to employment had moderated … while the risk of more persistent inflation remained". Moreover, some commented that these risks had come into better balance from before. Several participants also cautioned that easing rates in the current context could imply diminished commitment to the 2 percent inflation objective.
Key Implications
The minutes offered two critical insights into the Committee's thinking. First, the balance of risks has shifted away from concerns about labor market weakness, and more towards concern about inflation remaining persistently elevated. We would note that this shift in the Committee's assessment came before last week's delayed payrolls data, which would strengthen the assessment that downside risks to the labor market are not as significant as they seemed in December. Second, those voting in the majority (all but two members) generally agreed that the Committee's current policy rate was closer to neutral rather than restrictive, diminishing the impetus for further rate cuts.
All in all, the minutes from January's meeting have thrown a little cold water on hopes for more expeditious rate cuts from the Federal Reserve. We continue to expect the Committee to remain on pause this quarter as the data calendar catches up from the shutdown, and the picture of labor market risks and the persistence of inflation both become clearer.
Eco Data 2/19/26
| GMT | Ccy | Events | Act | Cons | Prev | Rev |
|---|---|---|---|---|---|---|
| 23:50 | JPY | Machinery Orders M/M Dec | 19.10% | 4.50% | -11.00% | |
| 00:30 | AUD | Employment Change Jan | 17.8K | 20.3K | 65.2K | 68.5K |
| 00:30 | AUD | Unemployment Rate Jan | 4.10% | 4.20% | 4.10% | |
| 09:00 | EUR | Eurozone Current Account (EUR) Dec | 14.6B | 9.2B | 8.6B | 8.9B |
| 09:00 | EUR | Eurozone Economic Bulletin | ||||
| 13:30 | CAD | Trade Balance (CAD) Dec | -1.3B | -2.0B | -2.2B | -2.6B |
| 13:30 | CAD | New Housing Price Index M/M Jan | -0.40% | 0.10% | -0.20% | |
| 13:30 | USD | Initial Jobless Claims (Feb 13) | 206K | 229K | 227K | 229K |
| 13:30 | USD | Trade Balance (USD) Dec | -70.3B | -55.5B | -56.8B | -53.0B |
| 13:30 | USD | Wholele Inventories Dec P | 0.20% | 0.20% | 0.20% | |
| 13:30 | USD | Philadelphia Fed Manufacturing Feb | 16.3 | 7.8 | 12.6 | |
| 15:00 | USD | Pending Homeles M/M Jan | -0.80% | 2.60% | -9.30% | -7.40% |
| 15:00 | EUR | Eurozone Consumer Confidence Feb P | -12 | -12 | -12 | |
| 15:30 | USD | Natural Gas Storage (Feb 13) | -144B | -148B | -249B | |
| 17:00 | USD | Crude Oil Inventories (Feb 13) | 1.7M | 8.5M |
| 23:50 | JPY |
| Machinery Orders M/M Dec | |
| Actual | 19.10% |
| Consensus | 4.50% |
| Previous | -11.00% |
| 00:30 | AUD |
| Employment Change Jan | |
| Actual | 17.8K |
| Consensus | 20.3K |
| Previous | 65.2K |
| Revised | 68.5K |
| 00:30 | AUD |
| Unemployment Rate Jan | |
| Actual | 4.10% |
| Consensus | 4.20% |
| Previous | 4.10% |
| 09:00 | EUR |
| Eurozone Current Account (EUR) Dec | |
| Actual | 14.6B |
| Consensus | 9.2B |
| Previous | 8.6B |
| Revised | 8.9B |
| 09:00 | EUR |
| Eurozone Economic Bulletin | |
| Actual | |
| Consensus | |
| Previous | |
| 13:30 | CAD |
| Trade Balance (CAD) Dec | |
| Actual | -1.3B |
| Consensus | -2.0B |
| Previous | -2.2B |
| Revised | -2.6B |
| 13:30 | CAD |
| New Housing Price Index M/M Jan | |
| Actual | -0.40% |
| Consensus | 0.10% |
| Previous | -0.20% |
| 13:30 | USD |
| Initial Jobless Claims (Feb 13) | |
| Actual | 206K |
| Consensus | 229K |
| Previous | 227K |
| Revised | 229K |
| 13:30 | USD |
| Trade Balance (USD) Dec | |
| Actual | -70.3B |
| Consensus | -55.5B |
| Previous | -56.8B |
| Revised | -53.0B |
| 13:30 | USD |
| Wholele Inventories Dec P | |
| Actual | 0.20% |
| Consensus | 0.20% |
| Previous | 0.20% |
| 13:30 | USD |
| Philadelphia Fed Manufacturing Feb | |
| Actual | 16.3 |
| Consensus | 7.8 |
| Previous | 12.6 |
| 15:00 | USD |
| Pending Homeles M/M Jan | |
| Actual | -0.80% |
| Consensus | 2.60% |
| Previous | -9.30% |
| Revised | -7.40% |
| 15:00 | EUR |
| Eurozone Consumer Confidence Feb P | |
| Actual | -12 |
| Consensus | -12 |
| Previous | -12 |
| 15:30 | USD |
| Natural Gas Storage (Feb 13) | |
| Actual | -144B |
| Consensus | -148B |
| Previous | -249B |
| 17:00 | USD |
| Crude Oil Inventories (Feb 13) | |
| Actual | |
| Consensus | 1.7M |
| Previous | 8.5M |
NZDUSD Wave Analysis
NZDUSD: ⬇️ Sell
- NZDUSD reversed from resistance area
- Likely to fall to support level 0.5950
NZDUSD currency pair reversed from the resistance area between the major resistance level 0.6060 (which has been reversing the price from June) and the upper daily Bollinger Band.
The downward reversal from this resistance area created the daily Japanese candlesticks reversal pattern Shooing Star – strong sell signal for this currency pair.
Given the strength of the resistance level 0.6060 and the bullish US dollar sentiment seen today, NZDUSD currency pair can be expected to fall to the next support level 0.5950.
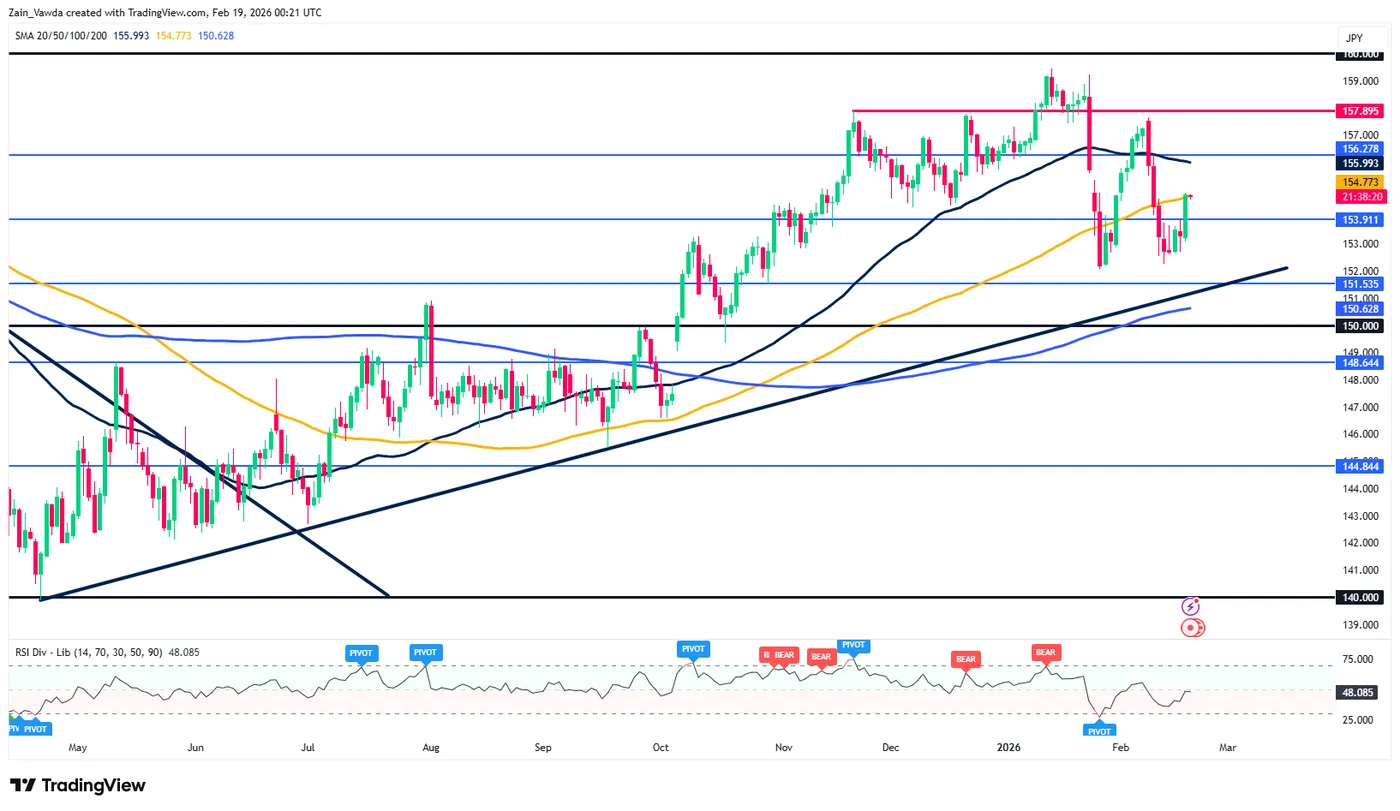
USDJPY Wave Analysis
USDJPY: ⬆️ Buy
- USDJPY reversed from support area
- Likely to rise to resistance level 155.15
USDJPY currency pair reversed up from the support area between the key support level 152.20 (which has been reversing the price from October), 50% Fibonacci correction of the upward impulse from September and the support trendline of the weekly up channel from last April.
The upward reversal from this support area stopped the previous minor correction ii – which belongs to wave iii from September.
Given the clear daily uptrend, USDJPY currency pair can be expected to rise to the next resistance level 155.15.

FTSE 100 Index Wave Analysis
FTSE 100 Index: ⬆️ Buy
- FTSE 100 Index broke the resistance area
- Likely to rise to resistance level 10800.00
FTSE 100 Index recently broke the resistance area between the resistance level 10500.00 and the two daily up channels from November and June of 2025.
The breakout of this resistance area accelerated the active intermediate impulse wave (3).
Given the overriding daily uptrend, FTSE 100 Index can be expected to rise to the next resistance level 10800.00.
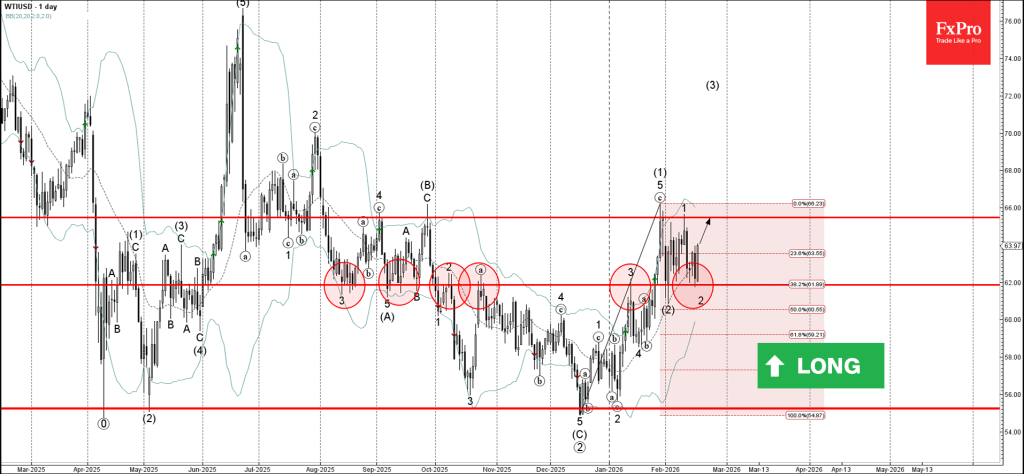
WTI Crude Oil Wave Analysis
WTI Crude oil: ⬆️ Buy
- WTI Crude oil reversed from pivotal support level 62.00
- Likely to rise to resistance level 65.45
WTI Crude oil recently reversed from the support area between the pivotal support level 62.00 (which has been reversing the price from August, alternating between the support and resistance roles) and the 38.2% Fibonacci correction of the upward impulse from December.
The upward reversal from this support area stopped the previous minor ABC correction 2.
WTI Crude oil can be expected to rise to the next resistance level 65.45 (which has been reversing the price from September).
Sunset Market Commentary
Markets
In yet another session stripped of volumes, volatility and news worthy the name, an overlooked NY Fed tariff study of last week drew some attention. It was Kevin Hassett’s (director of the National Economic Council) aim at the conclusion that ironically enough brought it back in the spotlight. He disagrees with the findings that US businesses and consumers paid nearly 90% of the cost of president Trump’s tariffs last year. The share was the largest in the first months of Trump’s presidency, 94%, before dropping to 86% in November (cut-off period). The study results of course undercut POTUS’ claim that foreign companies would bear the burden. Hassett called for the authors of what he described as “the worst study in the Fed’s history” to be disciplined. Also to be found in the non-market related section (at least for now) is speculation on ECB’s Lagarde early exit as president of the ECB. British newspaper Financial Times ran an article this morning floating the possibility to give French president Macron a say in her succession before the presidential elections of next year. A glimpse at the polls reveals the motive. The far-right Rassemblement National is consistently polling ahead of rivals and the belief is that the party’s unconventional views would complicate the nomination process. Commentators are drawing parallels with French central bank governor Villeroy’s announcement earlier this month to step down ahead of the end of his term. Lagarde is part of a bigger position switch going on at the ECB. Chief economist Lane’s and board member Schnabel’s terms end in 2027 too with the latter having openly solicited for Lagarde’s position in the past. Other touted candidates include Germany’s Nagel, the Netherland’s Knot and Spain’s de Cos.
Turning to markets then. Treasury yields build on yesterday’s intraday recovery to add 0.8-2.5 bps in a bear flattening move. It offers little relief for the likes of the 2-yr, which remains close to critical 3.4% support. The 10-yr tenor (4.07%) is trying to create breathing space, away from the 4% psychological barrier. European yields rise slightly, Bunds underperforming vs. swap. The US dollar extended earlier (marginal) gains after stronger-than-expected durable goods orders (December) in all of the gauges. The headline series (-1.4% vs -2% expected) was impacted by a sharp drop in nondefense aircraft orders (Boeing, -24.9%) but core measures all printed solid increases, including the one used for capital investments in GDP (shipments, +0.9%). December housing data came in well above consensus as well. Building permits and housing starts rose by 4.3% and 6.2% m/m respectively. An unexpected deterioration in the NY Fed’s services sector activity gauge (-25.7, from -16.1) tempered dollar bulls a bit. The 6-month gauge improved to the highest since February 2025 but remains below the series’ long-term average. DXY inches higher to 97.34, EUR/USD depreciates from 1.185 to 1.182. The kiwi dollar underperforms after the central bank this morning doused an Aussie-fueled fire for short-term rate hikes. NZD/USD’s stay north of 0.60 was cut short. Other noteworthy moves include NOK strength on higher oil prices. Brent rises 3% amid reports from news outlet Axios that a US-Iran war may be closer and longer-lasting than currently assumed.
News & Views
The Flemish Community raised €2bn via a long 10-yr bond (Jun2036) issued via syndication. The bond was priced to yield 17 bps over the Belgian OLO reference curve, compared with initial and revised guidance of respectively +21 bps and +19 bps. Books were above €11bn, highlighting solid demand. Flanders Department of Finance estimates total funding needs for 2026 at €9bn, the lion share of which is to cover new funding needs (€6bn). The funding need mainly stems from an estimated budget deficit of €1.83bn and other (recurring) funding needs such as the Flemish Social Housing Company (VMSW €0.92bn), the Flemish Housing Fund (VWF €1.36bn) and costs related to the Oosterweel link (LANTIS; €0.86bn). Debt redemptions for 2026 are projected at €2.82bn. They include Flanders’ short term Belgian Commercial Paper programme, rolling over a €1.5bn 3-month bill (current maturity 04/22/26) and a €0.75bn bond redemption (June2026). Internal redemptions (€0.17bn) are expected to be reinvested in the Flemish Community by the consolidated public institutions. Total new funding needs are forecasted to remain constant in the 2027-2030 period at €5-5.33bn. Including bond redemptions results in gross borrowing needs of €6.36bn-6.88bn in 2027, 2028 & 2030 and €7.6bn in 2029.
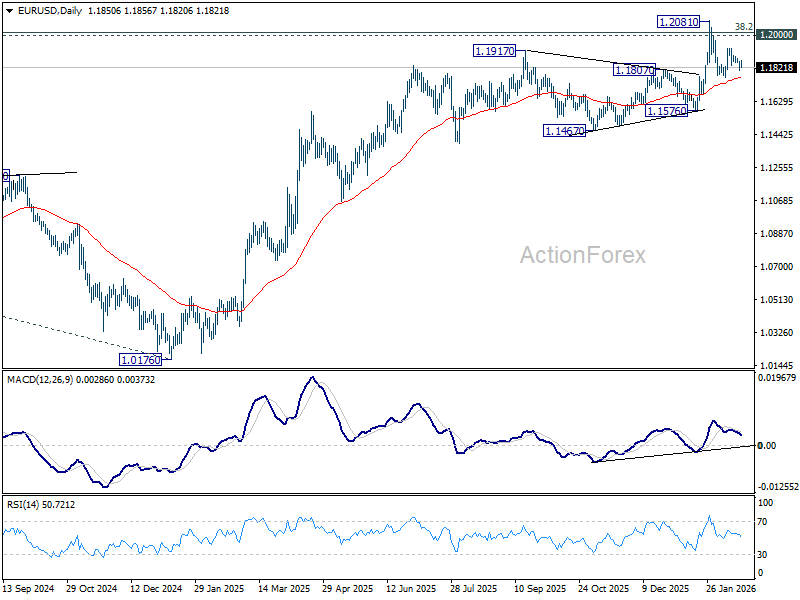
EUR/USD Mid-Day Outlook
Daily Pivots: (S1) 1.1821; (P) 1.1839; (R1) 1.1873; More….
EUR/USD is still bounded in range trading and intraday bias stays neutral. On the upside, above 1.1928 will target a retest on 1.2081 high. Decisive break there and sustained trading above 1.2 psychological level will carry larger bullish implications. On the downside, however, sustained trading below 55 D EMA (now at 1.1763) will raise the chance of reversal on rejection by 1.2, and target 1.1576 support for confirmation.
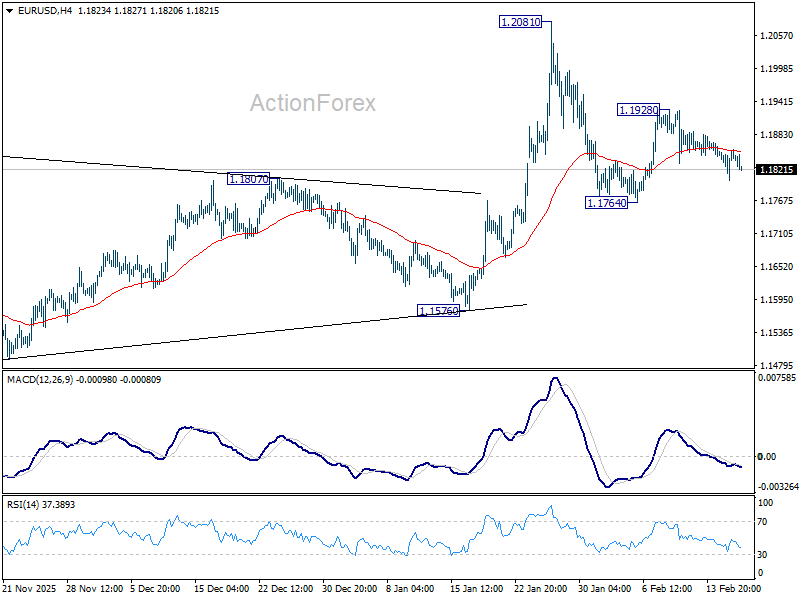
In the bigger picture, as long as 55 W EMA (now at 1.1485) holds, up trend from 0.9534 (2022 low) is still in favor to continue. Decisive break of 1.2 key psychological level will add to the case of long term bullish trend reversal. Next medium term target will be 138.2% projection of 0.9534 to 1.1274 from 1.0176 at 1.2581. However, sustained trading below 55 W EMA will argue that rise from 0.9534 has completed as a three wave corrective bounce, and keep long term outlook bearish.