
Sample Category Title
Sentiment Lifts, Conviction Lags
US equities kicked off the holiday-shortened week with another dip on Tuesday, but this time dip buyers stepped in and staged a rebound. The S&P500 found support around its 100-DMA, while the Nasdaq 100 rebounded after briefly dipping below the 24’400 mark. Some software companies released earnings ahead of schedule to ease concerns that AI will completely erode their revenues, arguing instead that integrating AI into their products will increase demand. In vain. The iShares Expanded Tech Software ETF was hit by another 2% selloff on Tuesday, extending the AI-fear driven decline.
On the other side of the trade, the AI enablers — the companies making the AI disruption possible — remain under pressure due to their massive investment plans, increasingly financed by debt. Roundhill’s Magnificent 7 Index is now down more than 11% from its October peak, gently entering the 10–20% drawdown zone that typically starts to look interesting for investors seeking discounted entry levels. Meta’s PE ratio has eased to around 27 — below its 2023 peak of 38. Alphabet’s is around 28, down from above 30 a few weeks ago, while Nvidia trades at roughly 45 times earnings — high, but the lowest since the AI boom began and falling, as earnings growth continues to catch up with price gains.
Still, valuations remain elevated, and the scale of debt-financed investment plans is unsettling some investors. CDS tied to Big Tech names are changing hands, suggesting need to hedge against credit risks.
But the credit risk remains low for now: Big Tech high-grade bonds continue to see strong demand and offer yields only slightly above US Treasuries. This means that despite equity market frustration and increased hedging activity, investors still view these companies as extremely high-quality borrowers with very low default risk. In other words, while not technically risk-free, their bonds are priced close to US sovereign risk in practical credit terms — and that could help put a floor under the equity selloff.
That said, the US Big Tech correction may have further to run before appetite fully returns. Each leg lower from here will increasingly raise the question: is it over? Judging by the 2% slide in SoftBank in Japan today, perhaps not yet. Next week, Nvidia closes the earnings season for the group. Whether it can restore broader appetite remains to be seen.
Meanwhile, the so-called rotation trade remains in play, with European indices benefiting from capital flows. The FTSE 100 hit a fresh record high yesterday despite weakness in energy and mining stocks on softer commodity prices. The sharp decline in sterling following a weak jobs report likely provided support to the index, given that roughly 75–80% of FTSE 100 revenues are generated outside the UK.
On the data front, the UK unemployment rate rose to its highest level since the pandemic, while wage growth slowed to its weakest pace in more than five years. The data is difficult for households, but very much supportive for Bank of England (BoE) doves. The ‘sweet’ combination of rising unemployment and easing inflation strengthens the case for rate cuts and has boosted appetite for UK assets. A sufficiently soft inflation report this morning should cement the expectation that the BoE will cut rates in March and again in June to support an economy strained by harsh fiscal stance.
In the FX, a softer BoE outlook is weighing on sterling against the euro — where the European Central Bank (ECB) is expected to remain on hold for now — and against the US dollar, where Federal Reserve (Fed) expectations have stabilized enough to allow the greenback to regain some ground versus sterling. Technically, Cable tested the major 38.2% Fibonacci retracement of the October-to-February rebound for the third time yesterday. A sustained break below that level would open the door to a deeper bearish consolidation.
Of course, much depends on the dollar leg. Fed minutes due later today may provide further insight into policymakers’ rate outlook. Markets currently price around two rate cuts this year, though views remain divided. Meanwhile, confidence in US data and policy motivation is increasingly debated, keeping the dollar’s broader trajectory uncertain.
The US dollar is attempting a second day of gains, while the kiwi is under pressure after the Reserve Bank of New Zealand (RBNZ) kept rates unchanged and signaled that the policy would remain accommodative as inflation is expected to return toward the 2% target on the coming year. Whether this marks the end of the NZDUSD’s year-to-date rebound near the 0.60 level remains to be seen.
For now, overall dollar appetite remains too fragile to suggest a sustained USD rebound. Let’s see whether the Fed minutes change that narrative – which I doubt.
Lagarde to Step Down Early as ECB President
In focus today
In the UK, January CPI inflation is released today. Two of the recent four prints have been softer than expected but core inflation remains elevated at 3.2%. The speed of the continued disinflationary path will determine when we get the next rate cut from the Bank of England.
In the evening, the minutes of FOMC's January meeting are due for release. Markets will keep a close eye on any more nuanced clues regarding the most likely timing for rate cuts.
Ukraine and Russia will continue peace talks from yesterday although there are little expectations of major breakthrough. Land disputes remain the key sticking point, as Russia demands control of the remaining 20% of Donetsk, which Ukraine refuses to concede. The negotiations come days before the fourth anniversary of Russia's invasion.
Economic and market news
What happened overnight
The Reserve Bank of New Zealand maintained the interest rate at 2.25% as expected. The meeting lowered market expectations for a rate hike in the near future with governor Anna Breman stating that they are not expecting a hike "until we see more inflationary pressures and a stronger economy".
In the euro area, Christine Lagarde is expected to step down as European Central Bank president before her term ends in October 2027, most likely before the French presidential election in April 2027 according to Financial Times. It has not been confirmed by the ECB officially. Her departure would allow Emmanuel Macron to be amongst the EU leaders that select her successor instead of a possible new French president from the far right. This raises the likelihood of getting a classical candidate and smoothens the process. We expect a limited impact of the new ECB president as EU leaders historically have aimed to strike a balance within the ECB's executive board between doves and hawks. Even with the early departure, EU leaders have plenty of time to discuss and select a new president as part of the large shift taking pace in ECB top positions the coming two years. Hence, we do not expect a market impact from this piece of news.
In Japan, exports increased 16.8% y/y (cons: 12%, prior: 5.1%) in January, the fastest growth in over three years, driven by strong Asian demand ahead of China's Lunar New Year. Exports to China rose 32%, while shipments to the U.S. fell 5%. Imports dropped 2.5%, leading to a smaller than expected trade deficit of 1.15 trillion yen. The increase may be temporary, potentially leading to lower than expected export in February.
What happened yesterday
The UK jobs report for December was released with the unemployment rate increasing to 5.2% (Nov: 5.1%), generally in line with expectations. The increase marks the highest unemployment rate in almost 5 years in the UK and supports the recent more dovish signs from the Bank of England. The increase in the unemployment rate reflects weaker hiring activity and that more people out of work are actively job searching.
In Germany, the ZEW survey showed an improvement in the current economic situation while expectations were broadly unchanged in February. Expectations fell marginally to 58.3 from 59.6 against an expected rise to 65.2 by consensus. In contrast, the assessment of the current situation rose as expected to -65.9 (cons: -65.9) from -72.7. Hence, a small rebound in the German economy has been visible in the past months according to the ZEW and expectations remain at high levels relative to the past years.
Iran and the United States reached an understanding on key guiding principles in nuclear talks, easing fears of regional conflict in the Middle East, although no deal is expected in the very near future. Iran reiterated it would only negotiate its nuclear programme in exchange for sanctions relief, rejecting discussions on its missile stockpile.
Equities: The US returned after the holiday with a shrug. At least that is how it looked on the surface, with S&P 500 ending 0.1% higher. However, beneath the surface the software scare continued. The software rebound on Friday reversed, and the sector sold off -2% again, being one of the worst performing industries.
However, what is noteworthy in the session is that consumer staples sold off heavily. Staples has been one of the best performing sectors during the last month, as investors have sought shelter from AI disruption. The fact that staples and software sell off in tandem is interesting. It could be at a sign that overall risk sentiment is about to revert back to the cyclical fundamentals, but in which AI disruption fears lingers in the software industry, without spilling over to overall risk appetite and a broader defensive rotation. We see a big catchup potential in the cyclical trade and believe value cyclicals and small caps is the best was to play this. Futures are higher this morning.
FI and FX: Yesterday's session saw a halt to the last week's drop in US yields with notably also the USD real rates curve rebounding a couple of bp. Meanwhile the long-end of EUR rates continued to drive a bullish flattening of the EUR curve with 2s10s now back to levels last seen in mid-November. In FX space the NZD has been the primary underperformer alongside the GBP following a relatively soft Reserve Bank of New Zealand overnight and weak UK figures yesterday. Also, EUR/SEK and EUR/NOK have edged somewhat higher while EUR/USD was little changed following stories this morning that Christine Lagarde will leave the ECB ahead of our her 8 year term. Oil has traded slightly heavy over the last 24 hours with Brent Crude falling to USD 67.5/bbl on signs of progression in the US-Iran nuclear talks.
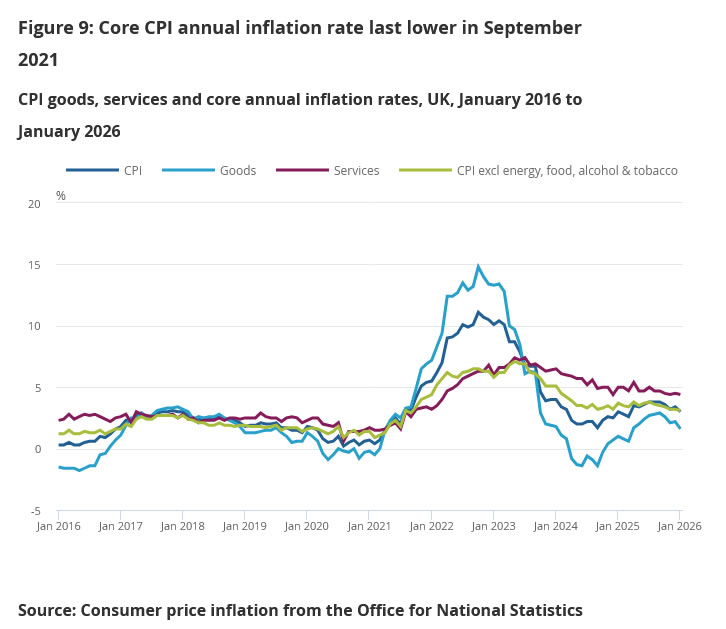
UK CPI slows to 3.0% in January as goods prices ease, services sticky
UK CPI slowed from 3.4% yoy to 3.0% yoy in January, matching expectations and marking the lowest annual rate since March 2025. On a monthly basis, prices fell -0.5% mom, reflecting broad-based easing in several categories.
Core inflation, which excludes energy, food, alcohol and tobacco, edged down from 3.2% yoy to 3.1% yoy — the lowest level since late 2021. Goods inflation cooled more decisively, with the annual rate falling from 2.2% to 1.6%. However, services inflation — a key focus for the BoE — eased only marginally from 4.5% to 4.4%.
ONS Chief Economist Grant Fitzner noted that petrol prices were a major driver of the decline, alongside lower airfares and softer food prices, particularly bread, cereals, and meat. These were partly offset by higher costs for hotel stays and takeaways.
The data reinforce the disinflation trend, but sticky services inflation may keep policymakers cautious despite strengthening expectations for a March rate cut.
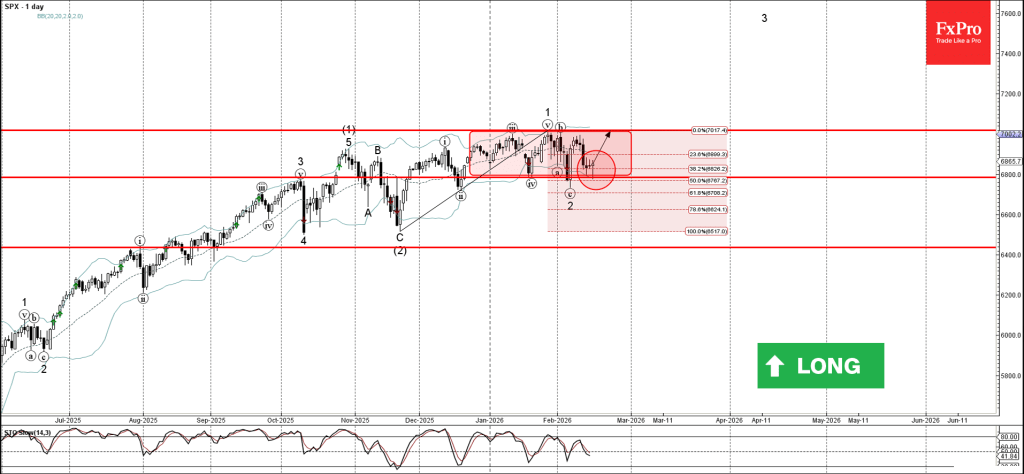
S&P 500 Wave Analysis
S&P 500: ⬆️ Buy
- S&P 500 reversed from pivotal support level 6800.00
- Likely to rise to resistance level 7020.00
S&P 500 index reversed up from the support area between the pivotal support level 6800.00 (which has been reversing the price from January), lower daily Bollinger Band and the 50% Fibonacci correction of the upward impulse from November.
The upward reversal from this support area formed the 3rd consecutive candlesticks reversal pattern Doji.
Given the clear daily uptrend, S&P 500 index can be expected to rise to the next resistance level 7020.00 (upper border of the active sideways price range).
RBNZ holds at 2.25%, lifts rate track slightly
RBNZ left the Official Cash Rate unchanged at 2.25%, in line with expectations, but delivered a slightly hawkish tilt through updated projections. While policymakers reiterated that monetary policy would remain “accommodative for some time,” the forward track now implies a marginally higher future rate path.
The central bank’s official projections see the OCR rising to 2.52% by March 2027, up from the previous estimate of 2.34%. That adjustment aligns with a broadly shared economist view that there is scope for one 25bps hike by late 2026 or early 2027, even as the near-term stance remains steady.
In its statement, RBNZ maintained confidence that inflation is likely returning to within the 1–3% target band this quarter. Officials expect inflation to move back toward the 2% midpoint over the next 12 months, supported by spare capacity, modest wage growth, and core measures already within target.
Taken together, the decision reinforces a steady policy stance in the near term while keeping the door open to eventual tightening. The slightly higher rate track signals that the next move remains upward, but timing will depend on how the recovery and inflation dynamics evolve.
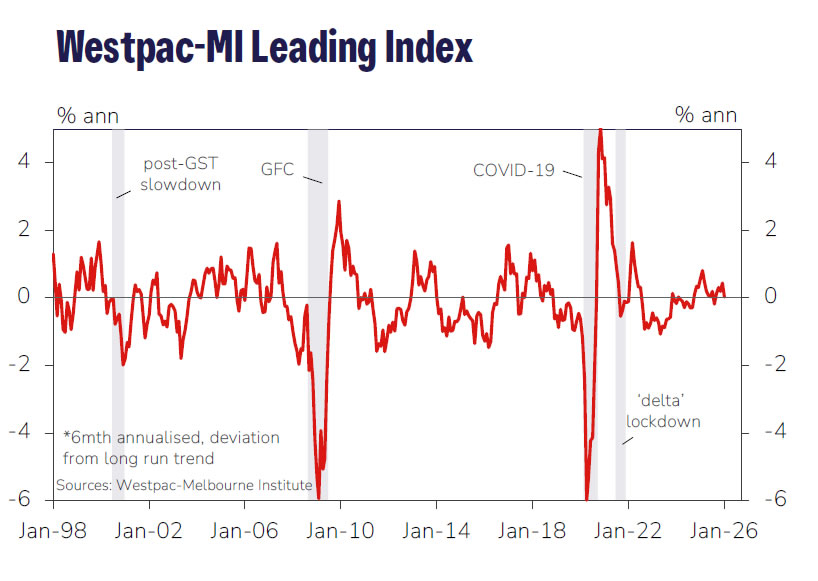
Australia Westpac leading index falls, “on again, off again” year in 2026
Australia’s Westpac Leading Index slowed in January, falling from 0.44% to 0.02%, pointing to fading growth momentum at the start of 2026. Westpac noted that the slightly above-trend pace seen in the second half of 2025 has lost traction, adding that the earlier improvement was never particularly convincing and stalled mid-year.
The bank warned that with growth stalling again and further rate increases still possible, 2026 may shape up as another “on again, off again” year for the economy. Even so, Westpac continues to expect GDP growth of around 2.5% this year — broadly in line with trend and consistent with the Leading Index signal.
For monetary policy, the near-term focus is inflation. While a March hike cannot be ruled out, Westpac expects RBA to pause and wait for more evidence. The decisive moment is likely Q1 CPI at end-April. If inflation remains stubbornly high, another 25bps increase at the May meeting appears likely despite signs that tighter financial conditions are beginning to weigh on activity.
Japan exports surge 16.8% yoy in January as China demand rebounds
Japan’s exports jumped 16.8% yoy in January to JPY 9,187B, marking the fastest growth since November 2022. The increase was well above December’s 5.1% yoy rise and exceeded expectations of 12.0%, pointing to a sharp acceleration in external demand at the start of the year.
Shipments to China, Japan’s largest trading partner, surged 32% yoy, accelerating strongly from December’s 5.6% increase despite lingering diplomatic tensions following Prime Minister Sanae Takaichi’s remarks on Taiwan. In contrast, exports to the U.S. fell -5% yoy after an -11.1% drop in December. Transport equipment, accounting for more than 20% of export growth, rose modestly by 0.8% yoy.
Imports declined -2.5% yoy to JPY 10,340B, reversing December’s 5.1% rise and undershooting expectations of a 3.0% increase. As a result, Japan posted a trade deficit of JPY 1,153B.
Eco Data 2/18/26
| GMT | Ccy | Events | Act | Cons | Prev | Rev |
|---|---|---|---|---|---|---|
| 21:45 | NZD | PPI Input Q/Q Q4 | -0.50% | 0.20% | ||
| 21:45 | NZD | PPI Output Q/Q Q4 | 0.10% | 0.60% | ||
| 23:50 | JPY | Trade Balance (JPY) Jan | 0.46T | -0.14T | -0.21T | -0.06T |
| 00:30 | AUD | Wage Price Index Q/Q Q4 | 0.80% | 0.80% | 0.80% | |
| 01:00 | NZD | RBNZ Interest Rate Decision | 2.25% | 2.25% | 2.25% | |
| 07:00 | GBP | CPI M/M Jan | -0.50% | -0.50% | 0.40% | |
| 07:00 | GBP | CPI Y/Y Jan | 3.00% | 3.00% | 3.40% | |
| 07:00 | GBP | Core CPI Y/Y Jan | 3.10% | 3.10% | 3.20% | |
| 07:00 | GBP | RPI M/M Jan | -0.50% | -0.40% | 0.70% | |
| 07:00 | GBP | RPI Y/Y Jan | 3.80% | 4.00% | 4.20% | |
| 07:00 | GBP | PPI - Input M/M Jan | 0.40% | 0.40% | -0.20% | -0.50% |
| 07:00 | GBP | PPI - Input Y/Y Jan | -0.20% | 0.80% | 0.50% | |
| 07:00 | GBP | PPI - Output M/M Jan | 0.00% | 0.20% | 0.00% | -0.10% |
| 07:00 | GBP | PPI - Output Y/Y Jan | 2.50% | 3.40% | 3.10% | |
| 07:00 | GBP | PPI Core Output Y/Y Jan | 0.20% | 3.20% | -0.20% | |
| 07:00 | GBP | PPI Core Output M/M Jan | 2.90% | -0.10% | 3.10% | |
| 13:30 | USD | Durable Goods Orders Dec | -1.40% | -1.60% | 5.30% | 5.40% |
| 13:30 | USD | Durable Goods Orders ex Transport Dec | 0.90% | 0.30% | 0.50% | 0.40% |
| 14:15 | USD | Industrial Production M/M Jan | 0.70% | 0.30% | 0.40% | 0.20% |
| 14:15 | USD | Capacity Utilization Jan | 76.20% | 76.40% | 76.30% | 75.70% |
| 19:00 | USD | FOMC Minutes |
| 21:45 | NZD |
| PPI Input Q/Q Q4 | |
| Actual | -0.50% |
| Consensus | |
| Previous | 0.20% |
| 21:45 | NZD |
| PPI Output Q/Q Q4 | |
| Actual | 0.10% |
| Consensus | |
| Previous | 0.60% |
| 23:50 | JPY |
| Trade Balance (JPY) Jan | |
| Actual | 0.46T |
| Consensus | -0.14T |
| Previous | -0.21T |
| Revised | -0.06T |
| 00:30 | AUD |
| Wage Price Index Q/Q Q4 | |
| Actual | 0.80% |
| Consensus | 0.80% |
| Previous | 0.80% |
| 01:00 | NZD |
| RBNZ Interest Rate Decision | |
| Actual | 2.25% |
| Consensus | 2.25% |
| Previous | 2.25% |
| 07:00 | GBP |
| CPI M/M Jan | |
| Actual | -0.50% |
| Consensus | -0.50% |
| Previous | 0.40% |
| 07:00 | GBP |
| CPI Y/Y Jan | |
| Actual | 3.00% |
| Consensus | 3.00% |
| Previous | 3.40% |
| 07:00 | GBP |
| Core CPI Y/Y Jan | |
| Actual | 3.10% |
| Consensus | 3.10% |
| Previous | 3.20% |
| 07:00 | GBP |
| RPI M/M Jan | |
| Actual | -0.50% |
| Consensus | -0.40% |
| Previous | 0.70% |
| 07:00 | GBP |
| RPI Y/Y Jan | |
| Actual | 3.80% |
| Consensus | 4.00% |
| Previous | 4.20% |
| 07:00 | GBP |
| PPI - Input M/M Jan | |
| Actual | 0.40% |
| Consensus | 0.40% |
| Previous | -0.20% |
| Revised | -0.50% |
| 07:00 | GBP |
| PPI - Input Y/Y Jan | |
| Actual | -0.20% |
| Consensus | |
| Previous | 0.80% |
| Revised | 0.50% |
| 07:00 | GBP |
| PPI - Output M/M Jan | |
| Actual | 0.00% |
| Consensus | 0.20% |
| Previous | 0.00% |
| Revised | -0.10% |
| 07:00 | GBP |
| PPI - Output Y/Y Jan | |
| Actual | 2.50% |
| Consensus | |
| Previous | 3.40% |
| Revised | 3.10% |
| 07:00 | GBP |
| PPI Core Output Y/Y Jan | |
| Actual | 0.20% |
| Consensus | |
| Previous | 3.20% |
| Revised | -0.20% |
| 07:00 | GBP |
| PPI Core Output M/M Jan | |
| Actual | 2.90% |
| Consensus | |
| Previous | -0.10% |
| Revised | 3.10% |
| 13:30 | USD |
| Durable Goods Orders Dec | |
| Actual | -1.40% |
| Consensus | -1.60% |
| Previous | 5.30% |
| Revised | 5.40% |
| 13:30 | USD |
| Durable Goods Orders ex Transport Dec | |
| Actual | 0.90% |
| Consensus | 0.30% |
| Previous | 0.50% |
| Revised | 0.40% |
| 14:15 | USD |
| Industrial Production M/M Jan | |
| Actual | 0.70% |
| Consensus | 0.30% |
| Previous | 0.40% |
| Revised | 0.20% |
| 14:15 | USD |
| Capacity Utilization Jan | |
| Actual | 76.20% |
| Consensus | 76.40% |
| Previous | 76.30% |
| Revised | 75.70% |
| 19:00 | USD |
| FOMC Minutes | |
| Actual | |
| Consensus | |
| Previous | |
Fed’s Goolsbee urges patience, keeps door open to multiple 2026 rate cuts
Chicago Fed President Austan Goolsbee cautioned against overinterpreting last week’s CPI data, even as headline inflation slowed to 2.4%. In comments to CNBC, he stressed the need to confirm that easing price pressures are not temporary.
Goolsbee pointed to tariffs as a lingering uncertainty, noting that their longer-term impact could complicate the inflation outlook. For now, he prefers a wait-and-see approach rather than assuming that inflation is firmly on track toward 2%.
Still, Goolsbee kept the door open to additional easing next year. “If this proves to be transitory, and we can show that we’re on the path back to 2% inflation, I still think there’s several more rate cuts that can happen in 2026,” he said.
Sunset Market Commentary
Markets
UK gilts outperform global peers with yields pushing between 1.2 and 3.5 bps lower, accompanied by GBP weakness. EUR/GBP reaches for the YtD high just south of 0.875, up from a sub 0.87 reading in early European hours. GBP/USD (cable) loses the 1.36 big figure to revisit the February troughs. The moves follow this morning’s UK labour market report that surprised to the downside. Employment grew by 52k in the three months through December 2025 from the previous three-month (Jul-Sep) period. That was less than halve the 108k expected. A preliminary estimate for January printed at -11k. The unemployment rate in the same period rose to 5.2% with only the 5.3% pandemic peak standing in the way of a decade high. And wage growth (ex. bonus) decelerated to the slowest in five years. Barring a huge upward surprise in tomorrow’s CPI, the numbers all but cement a rate cut by the Bank of England in March. Governor Bailey had been the swing vote in an otherwise evenly split committee the last couple of times. He wanted - and just got - more evidence of wage pressures easing before supporting a further rate reduction. Money market pricing rose from 60% after the BoE February meeting to <75% yesterday before rising to more than 80% today.
US Treasuries’ gains in Asian and European dealings evaporated throughout the day. The front end first, following the ADP weekly employment change indicator. Longer tenors (almost) returned earlier gains when US investors joined. The four-month weekly MA in the week through January 30 rose from an upwardly revised 7.75k to 10.25k, printing higher readings for a third week straight now and suggesting improving hiring momentum. The 2-yr yield on a net daily basis adds 2.5 bp with the intraday movement spanning 6 bps. Bund yields drop 0.5-2 bps. The 2-yr tenor (flat) for now found support at the lower bound of a downward sloping trend channel with origins dating back from ECB Schnabel’s December speech (on markets pricing in rate hikes). Longer-term yields, both in Germany and in swap, recouped some of the intraday losses despite the fragile risk sentiment that reigned for most of the day. European equities whipsawed between gains and losses all day and currently are up 0.4%. Wall Street defied negative futures (up to -1%) with a flat open. Both the dollar and the Japanese yen return invigorated from the long weekend. USD/JPY balances out but a strong JGB performance this morning (yields down almost 10 bps at the long end) reveals appetite for Japanese assets. DXY rises to 97.4, EUR/USD drops to 1.182.
News & Views
German ZEW investor sentiment (current situation) improved from -72.7 to -65.9 in February, the second best level since July 2023. The export-oriented sectors showed moderate to strong improvements. Prospects have particularly improved for the chemical and pharmaceutical industries (+7.5 ), steel and metal production (+8.6) and mechanical engineering (+10.9). This likely reflects better than expected incoming orders at the end of 2025. Despite continuing uncertainty, prospects for private consumption are improving (+6). In contrast, banks and insurances and the information technology industry are facing some headwinds. The forward looking ZEW expectations index stabilized at 58.3 (from 59.6), but that’s still the second best level since July 2021.
The overall Canadian price level was unchanged in January (0% M/M) while consensus expected a modest increase (+0.1%). Details were a mixed bag with declining transportation costs being a significant drag in January. On an annual basis, inflation slowed from 2.4% to 2.3%. Gasoline prices had the biggest downward impact, mainly because of a base effect (+0.5% M/M vs +4% M/M last year). The temporary tax break on certain items from mid December 2024 to mid-February 2025 continued to put upward pressure. Underlying core inflation gauges slowed as well though, like for example the Bank of Canada’s preferred trimmed mean: 2.7% Y/Y to 2.4% Y/Y. The latter is the lowest level since April 2021 and is a welcome development as the Bank of Canada holds a steady course with a 2.25% policy rate. Growth in shelter costs continued to decelerate, rising by 1.7% Y/Y in what was the first sub-2% outcome in nearly five years.