Sample Category Title
Inflation Enters Bank of Canada’s Target Range in June, But Core Still Elevated
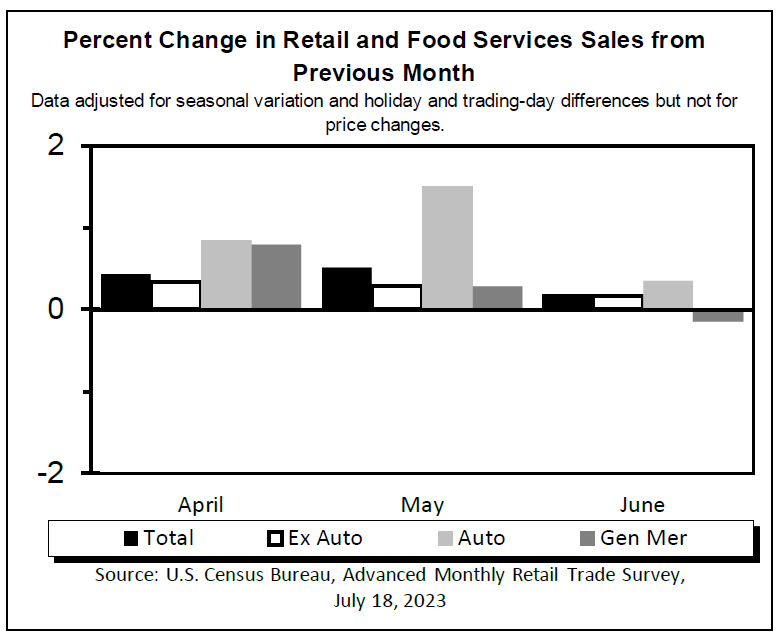
Consumer price inflation cooled to 2.8% year-on-year (y/y) in June, down from 3.4% in May. That was slightly below market expectations.
Lower energy prices, gasoline primarily, relative to a year ago were the key downward force on inflation. Without the effect of gasoline prices being down -21.6% versus a year ago, headline inflation would have been 4.0% y/y in June.
The components contributing the most upward pressure to inflation are groceries (+9.1% y/y) and mortgage interest costs (+30.1% y/y). Food prices at stores have risen nearly 20% over the past two years, the largest such increase in over 40 years.
Shelter inflation heated up very slightly to 4.8%in June, up from 4.7% in May. Even so, total services inflation cooled further to 4.2% y/y from 4.8% y/y in May. Services inflation cooled thanks to smaller increases for travel tours (+6.8 y/y in June down from 23.4% y/y in May) and cellular services, which are down 14.7% y/y, versus a smaller 8.2% y/y decline in May.
There were signs of easing price pressures for consumer goods also. Durable goods inflation continued to cool to 0.8% y/y in June. Passenger vehicle prices were up 2.4% y/y in June, down from a peak of 8.4% last September. Household furniture and equipment was up only 0.1% y/y in June, down from a peak of 10.5% last June.
The Bank of Canada's underlying inflation measures cooled further in May. CPI-trim eased to 3.7%y/y in June from 3.8% y/y in May, and CPI-median registered 3.9% versus 4.0% y/y in May.
Key Implications
Canadian inflation continued to make encouraging progress in June. However, the cooling in headline inflation is benefitting from sizeable base effects, due to the favourable comparison to high energy prices last June. The Bank of Canada (BoC) is watching its preferred core measures – CPI-trim and median – which continue to show glacial progress.
BoC Governor Macklem emphasized last week that the Bank has become worried about the persistence of underlying inflation pressures in the economy. The June inflation data likely provides some reassurance that things are moving in the right direction, but not fast enough for the Bank of Canada lets its guard down.
EUR/USD Mid-Day Outlook
Daily Pivots: (S1) 1.1211; (P) 1.1230; (R1) 1.1257; More...
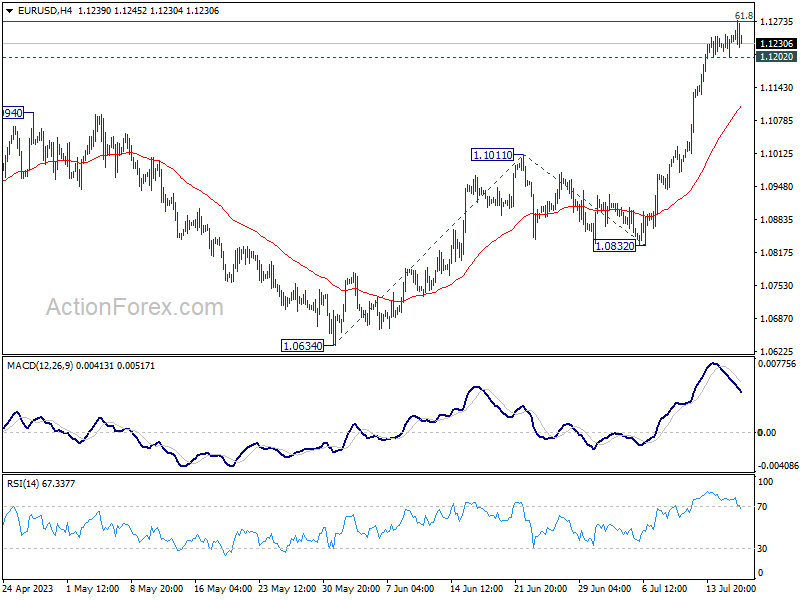
Immediate focus is now on 1.1273 fibonacci level in EUR/USD. As upside momentum is diminishing as seen in 4H MACD, upside could be limited by 1.1273. Break of 1.1202 minor support will indicate short term topping, and turn bias back to the downside for deeper pull back. Nevertheless, sustained break of 1.1273 will extend larger up trend to 161.8% projection of 1.0634 to 1.1011 from 1.0832 at 1.1442 next.
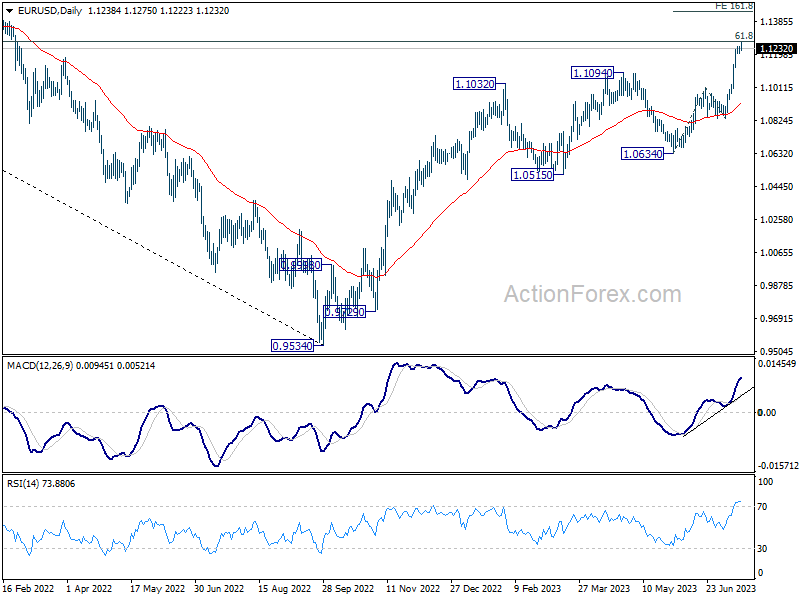
In the bigger picture, as rise from 0.9534 extends, focus is now on 61.8% retracement of 1.2348 (2021 high) to 0.9534 at 1.1273. Sustained break there will solidify the case of bullish trend reversal and target 1.2348 resistance next. Meanwhile, outlook will continue to stay bullish as long as 1.0832 support holds, even in case of deep pull back.
Canadian Dollar Dips Slightly after CPI, Euro Rally Fades
Canadian Dollar is having a mild slump in early US session following lower-than-expected headline CPI reading. However, the currency's slide was largely restrained, primarily due to the base-year effects of gasoline prices contributing to the deceleration in consumer inflation. Concurrently, Australian and New Zealand Dollars also experienced a slight dip amid mixed risk sentiment. Euro, after rising slightly earlier in the day, has softened marginally, as ECB officials re-emphasized the uncertainty regarding more monetary tightening beyond July.
In contrast, Japanese Yen and Swiss Franc are so far today's better performers, with British Pound and Dollar following closely. Although US futures suggest a moderately lower open, persistence of stock market selloff remains uncertain. A shift in overall risk sentiment later in the session could potentially cause Dollar and Yen to turn lower again
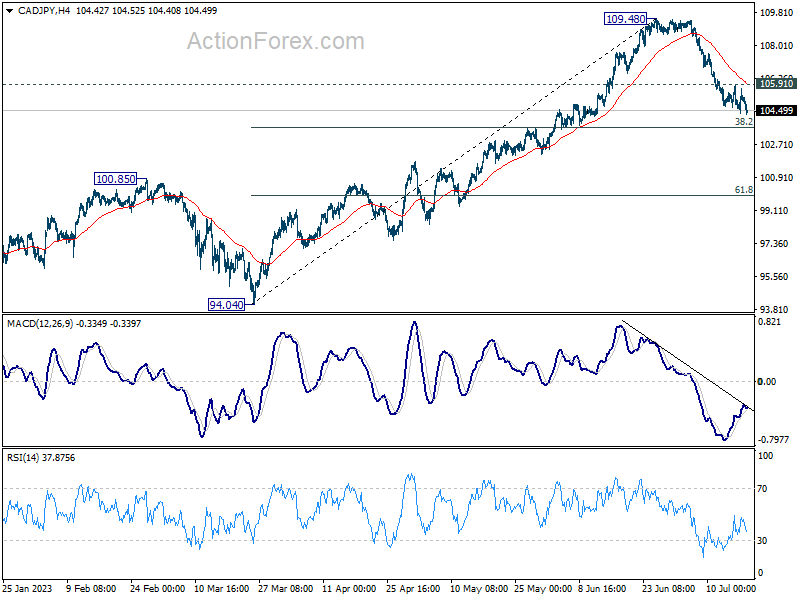
On a technical note, while CAD/JPY is trying to resume the corrective fall from 109.48, downside momentum is so far weak. Indeed, some support could be seen from 38.2% retracement of 94.04 to 109.48 at 103.58 to contain downside, at least on first attempt. Break of 105.91 minor resistance will turn bias back to the upside for stronger rebound back towards 109.48 high.
In Europe, at the time of writing, FTSE is up 0.07%. DAX is down -0.08%. CAC is down -0.10%. Germany 10-year yield is down -0.093 at 2.389. Earlier in Asia, Nikkei rose 0.32%. Hong Kong HSI dropped -2.05%. China Shanghai SSE dropped -0.37%. Singapore Strait Times dropped -0.01%. Japan 10-year JGB yield rose 0.0066 to 0.487.
US retail sales rose 0.2% mom in Jun, ex-auto sales up 0.2% mom
US retail sales rose 0.2% mom to USD 689.5B in June, below expectation of 0.5% mom. Ex-auto sales rose 0.2% mom to 556.3B, below expectation of 0.3% mom. Ex-gasoline sales rose 0.3% mom to USD 637.0B. Ex-auto, gasoline sales rose 0.3% mom USD 503.8B.
Total sales for the April through June period were up 1.6% form the same period a year ago.
Canada CPI down to 2.8% in Jun, led by gasoline base-year effect
Canada CPI slowed form 3.4% yoy to 2.8% yoy, below expectation and back inside BoC's 1-3% target range. On a monthly basis, CPI edged up 0.1% mom down from May's 0.4% mom.
Statistics Canada noted, "While deceleration was fairly broad-based, another base-year effect in gasoline prices led the slowdown in the CPI." Excluding gasoline, CPI slowed from 4.4% yoy to 4.0% yoy.
Grocery prices at 9.1% yoy and mortgage interest costs at 30.1% yoy were the biggest contributor to CPI increase. Ex-food CPI was at 1.7% while excluding mortgage interest costs, CPI was at 2.0%.
CPI median decelerated from 4.0% yoy to 3.9% yoy, above expectation of 3.7% yoy. CPI trimmed slowed form 3.8% yoy to 3.7% yoy, above expectation of 3.6% yoy. CPI common slowed from 5.2% yoy to 5.1% yoy, above expectation of 5.0% yoy.
ECB Visco: Inflation may come down faster
Talking to Bloomberg TV, ECB Governing Council member Ignazio Visco said, "Since we have also been observing a substantial reduction in energy prices, we have to expect that this will be seen also in underlying inflation in the coming months, certainly by the end of the year."
Visco also suggested the possibility of a quicker pace than initially forecasted by ECB, saying, "The ECB projects that by the end of 2025 there will be 2% — my impression is that it might be faster."
Visco cautioned against the risks associated with making excessive adjustments, stating, "There is a risk of doing too much and I think that we have to be careful about that." However, he also noted the potential risk of doing too little, emphasizing the need for balance and judicious decision-making based on incoming information.
Meanwhile, another Governing Council member Klaas Knot expressed his perspective on potential policy adjustments beyond July. "For July I think it (rate hike) is a necessity, for anything beyond July it would at most be a possibility but by no means a certainty," Knot said. He urged careful monitoring of the data from July onwards, to assess the distribution of risks surrounding the baseline.
RBA Jul minutes: Hike considered, hold to reassess in Aug
Minutes from RBA's July 4th meeting reveal that two options were considered: raising cash rate by additional 25 bps, or keeping it unchanged. RBA eventually chose the latter, acknowledging the "uncertainty around the outlook and the significant increase in interest rates to date." Members agreed to "reassess the situation at the August meeting."
Despite maintaining status quo, RBA members acknowledged the possibility of future policy tightening. "Members agreed that some further tightening of monetary policy may be required to bring inflation back to target within a reasonable timeframe, but that this depended on how the economy and inflation evolve," the minutes read.
RBA's decision underscores the central bank's caution amid shifting economic conditions. With August meeting on the horizon, the Board anticipates additional data on inflation, the global economy, labor market, and household spending. This incoming information, combined with updated staff forecasts and a revised risk assessment, will guide the next policy decision.
EUR/USD Mid-Day Outlook
Daily Pivots: (S1) 1.1211; (P) 1.1230; (R1) 1.1257; More...
Immediate focus is now on 1.1273 fibonacci level in EUR/USD. As upside momentum is diminishing as seen in 4H MACD, upside could be limited by 1.1273. Break of 1.1202 minor support will indicate short term topping, and turn bias back to the downside for deeper pull back. Nevertheless, sustained break of 1.1273 will extend larger up trend to 161.8% projection of 1.0634 to 1.1011 from 1.0832 at 1.1442 next.
In the bigger picture, as rise from 0.9534 extends, focus is now on 61.8% retracement of 1.2348 (2021 high) to 0.9534 at 1.1273. Sustained break there will solidify the case of bullish trend reversal and target 1.2348 resistance next. Meanwhile, outlook will continue to stay bullish as long as 1.0832 support holds, even in case of deep pull back.
Economic Indicators Update
| GMT | Ccy | Events | Actual | Forecast | Previous | Revised |
|---|---|---|---|---|---|---|
| 01:30 | AUD | RBA Meeting Minutes | ||||
| 04:30 | JPY | Tertiary Industry Index M/M May | 1.20% | 0.40% | 1.20% | |
| 12:15 | CAD | Housing Starts Jun | 281K | 215K | 202K | 200K |
| 12:30 | CAD | CPI M/M Jun | 0.10% | 0.30% | 0.40% | |
| 12:30 | CAD | CPI Y/Y Jun | 2.80% | 3.00% | 3.40% | |
| 12:30 | CAD | CPI Core M/M Jun | 0.10% | 0.20% | 0.10% | |
| 12:30 | CAD | CPI Median Y/Y Jun | 3.90% | 3.70% | 3.90% | |
| 12:30 | CAD | CPI Trimmed Y/Y Jun | 3.70% | 3.60% | 3.80% | |
| 12:30 | CAD | CPI Common Y/Y Jun | 5.10% | 5.00% | 5.20% | |
| 12:30 | CAD | Industrial Product Price M/M Jun | -0.60% | -0.10% | -1% | |
| 12:30 | CAD | Raw Material Price Index Jun | -1.50% | -0.20% | -4.90% | |
| 12:30 | USD | Retail Sales M/M Jun | 0.20% | 0.50% | 0.30% | 0.50% |
| 12:30 | USD | Retail Sales ex Autos M/M Jun | 0.20% | 0.30% | 0.10% | 0.30% |
| 13:15 | USD | Industrial Production M/M Jun | -0.50% | 0.00% | -0.20% | -0.50% |
| 13:15 | USD | Capacity Utilization Jun | 78.90% | 79.50% | 79.60% | 79.40% |
| 14:00 | USD | Business Inventories May | 0.20% | 0.20% | ||
| 14:00 | USD | NAHB Housing Market Index Jul | 55 | 55 |
US retail sales rose 0.2% mom in Jun, ex-auto sales up 0.2% mom
US retail sales rose 0.2% mom to USD 689.5B in June, below expectation of 0.5% mom. Ex-auto sales rose 0.2% mom to 556.3B, below expectation of 0.3% mom. Ex-gasoline sales rose 0.3% mom to USD 637.0B. Ex-auto, gasoline sales rose 0.3% mom USD 503.8B.
Total sales for the April through June period were up 1.6% form the same period a year ago.
Canada CPI down to 2.8% in Jun, led by gasoline base-year effect
Canada CPI slowed from 3.4% yoy to 2.8% yoy in June, below expectation and back inside BoC's 1-3% target range. On a monthly basis, CPI edged up 0.1% mom down from May's 0.4% mom.
Statistics Canada noted, "While deceleration was fairly broad-based, another base-year effect in gasoline prices led the slowdown in the CPI." Excluding gasoline, CPI slowed from 4.4% yoy to 4.0% yoy.
Grocery prices at 9.1% yoy and mortgage interest costs at 30.1% yoy were the biggest contributor to CPI increase. Ex-food CPI was at 1.7% while excluding mortgage interest costs, CPI was at 2.0%.
CPI median decelerated from 4.0% yoy to 3.9% yoy, above expectation of 3.7% yoy. CPI trimmed slowed form 3.8% yoy to 3.7% yoy, above expectation of 3.6% yoy. CPI common slowed from 5.2% yoy to 5.1% yoy, above expectation of 5.0% yoy.
Another Tick in Gold’s Bull-Trend Checkbox
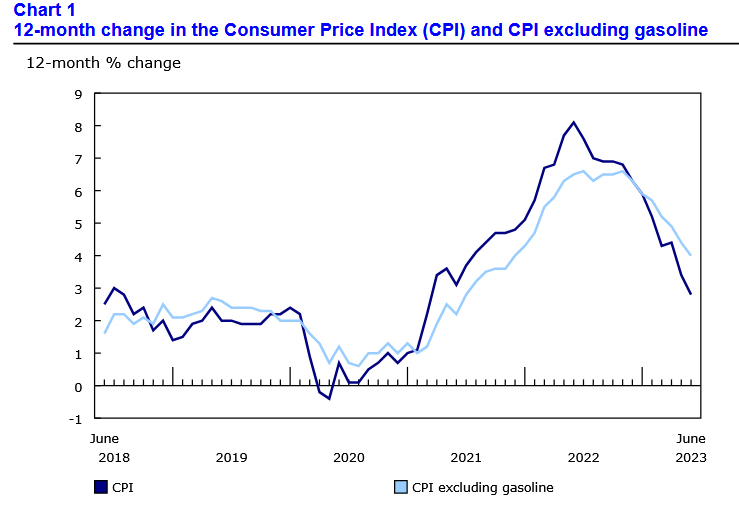
Gold returned to monthly highs near $1962 on Tuesday morning after consolidating around the 50-day moving average. All eyes are now on gold’s ability to break away from this line, a medium-term trend indicator.
The upward move is well within the pattern forming in the gold market since last September. After forming a solid bottom in September-November the previous year, the price rallied from lows near $1615 to a peak of $2081 in early May.
Within two months, we saw a classic correction with a pullback to 61.8% of the initial move, briefly touching levels below $1900. Gold then reversed to the upside.
Within this long-term pattern, gold could break through the previous highs ($2081) and potentially head towards $2370 (161.8% of the initial move), which could take more than six months.
However, the bears have a good chance of proving their strength and thwarting the upside scenario. The current level delayed gold’s decline in the first half of last month and now acts as an obstacle to further gains.
Separately, we are watching the oversold local dollar. Last week, the weakening of the US currency boosted gold’s gains, but a corrective recovery in the dollar could break gold’s bullish pattern.
A rise in gold above $1970 in the next few days would reduce doubts about the bullish scenario involving a renewal of historical highs. A quick pullback below $1950 and the 50-day moving average would confirm the dominance of a short-term downtrend.
Silver Stabilizes Above Recent Rectangle
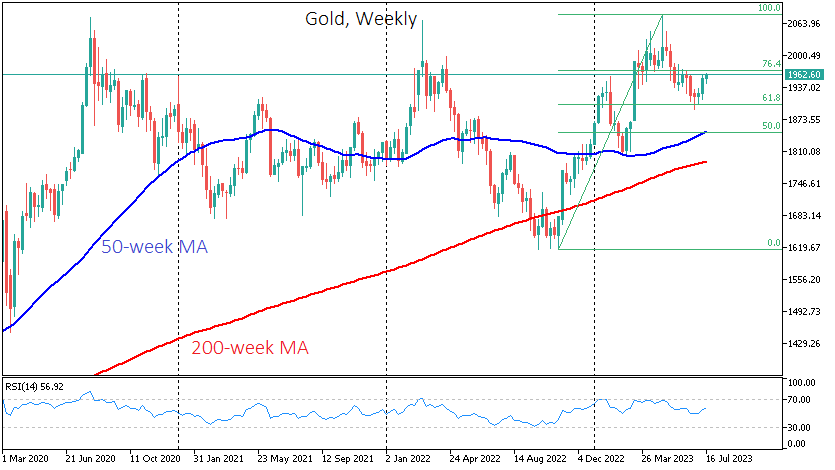
Silver is edging higher today but continues to hover around the 24.92 level. The bulls have staged another breakout of the December 2022-February 2023 rectangle, breaking the recent series of lower lows and lower highs, but the 7.5% jump in just two days does not appear to have a follow-through.
The momentum indicators are mostly on the bulls’ side at this juncture. The Average Directional Movement Index (ADX) is finally above its 25-threshold and hence pointing to a strong bullish trend in the market. More importantly, the stochastic oscillator has jumped to its overbought area, building a significant gap from its moving average. On the flip side, the RSI is in bullish territory but failing to make a higher high. This could be an early rally-exhaustion sign.
Should the bulls aim to stage another rally, they would first try to overcome the 78.6% Fibonacci retracement of the March 8, 2022 – September 1, 2022 downtrend at 24.92. The path would then be clear until the January 28, 2011 low and the recent double top pattern’s highs at the 26.12-26.39 range.
On the other hand, the bears are keen on a move back inside the aforementioned rectangle and below the January 3, 2023 high at 24.53. Lower, they could have a go at the March 31, 2021 low at 23.76 and then, most likely, test the support set by the busier 23.45-23.59 range that is defined by the 50- and 100-day simple moving averages (SMAs).
To conclude, silver’s rally appears to have fizzled out despite the fact that the momentum indicators are still supportive of the bulls’ intentions.
EUR/USD Price: 17-month Maximum
Last week, the dollar index posted its worst week of 2023 amid news of declining US inflation, which was seen as a motive for easing the Fed's current tight monetary policy. "I think the dollar can stay under selling pressure," Carol Kong, currency strategist at Commonwealth Bank of Australia, told Reuters.
On the other hand, inflation in the Eurozone is not declining as fast. FT writes that some ECB officials consider it necessary to raise the rate several more times after the summer meetings, which supports the euro.
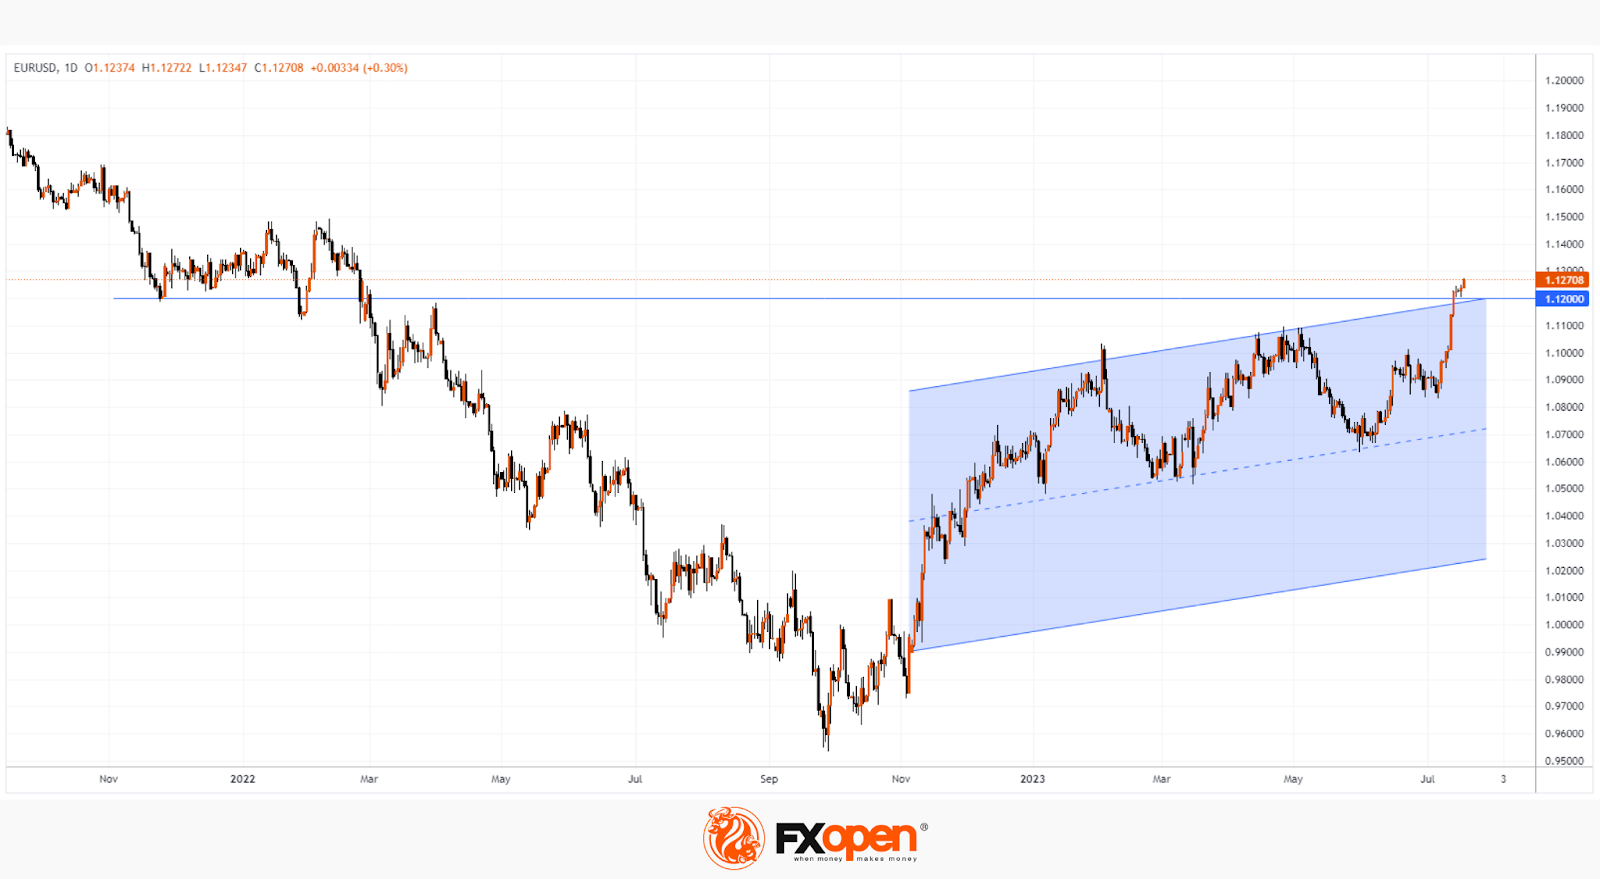
The EUR/USD chart shows demand dominance. At the same time, the price of the euro against the dollar:
- rose above the 1.1200 level for the first time in 17 months. Note that this level has influenced the EUR/USD price dynamics in the past;
- went beyond the upper limit of the ascending channel.
Given these 2 observations, we can assume that the market is in a vulnerable position for a pullback, and the bulls will need to make specific efforts to gain a foothold above 1.1200.
The situation may change in the near future:
- US retail sales data to be released today at 15:30 GMT+3;
- Tomorrow at 12:00 GMT+3 inflation data in the Eurozone will be published.
Aussie Shrugs after RBA Minutes, US Retail Sales Next
- RBA minutes point to close call at July decision
- US retail sales for June expected to climb
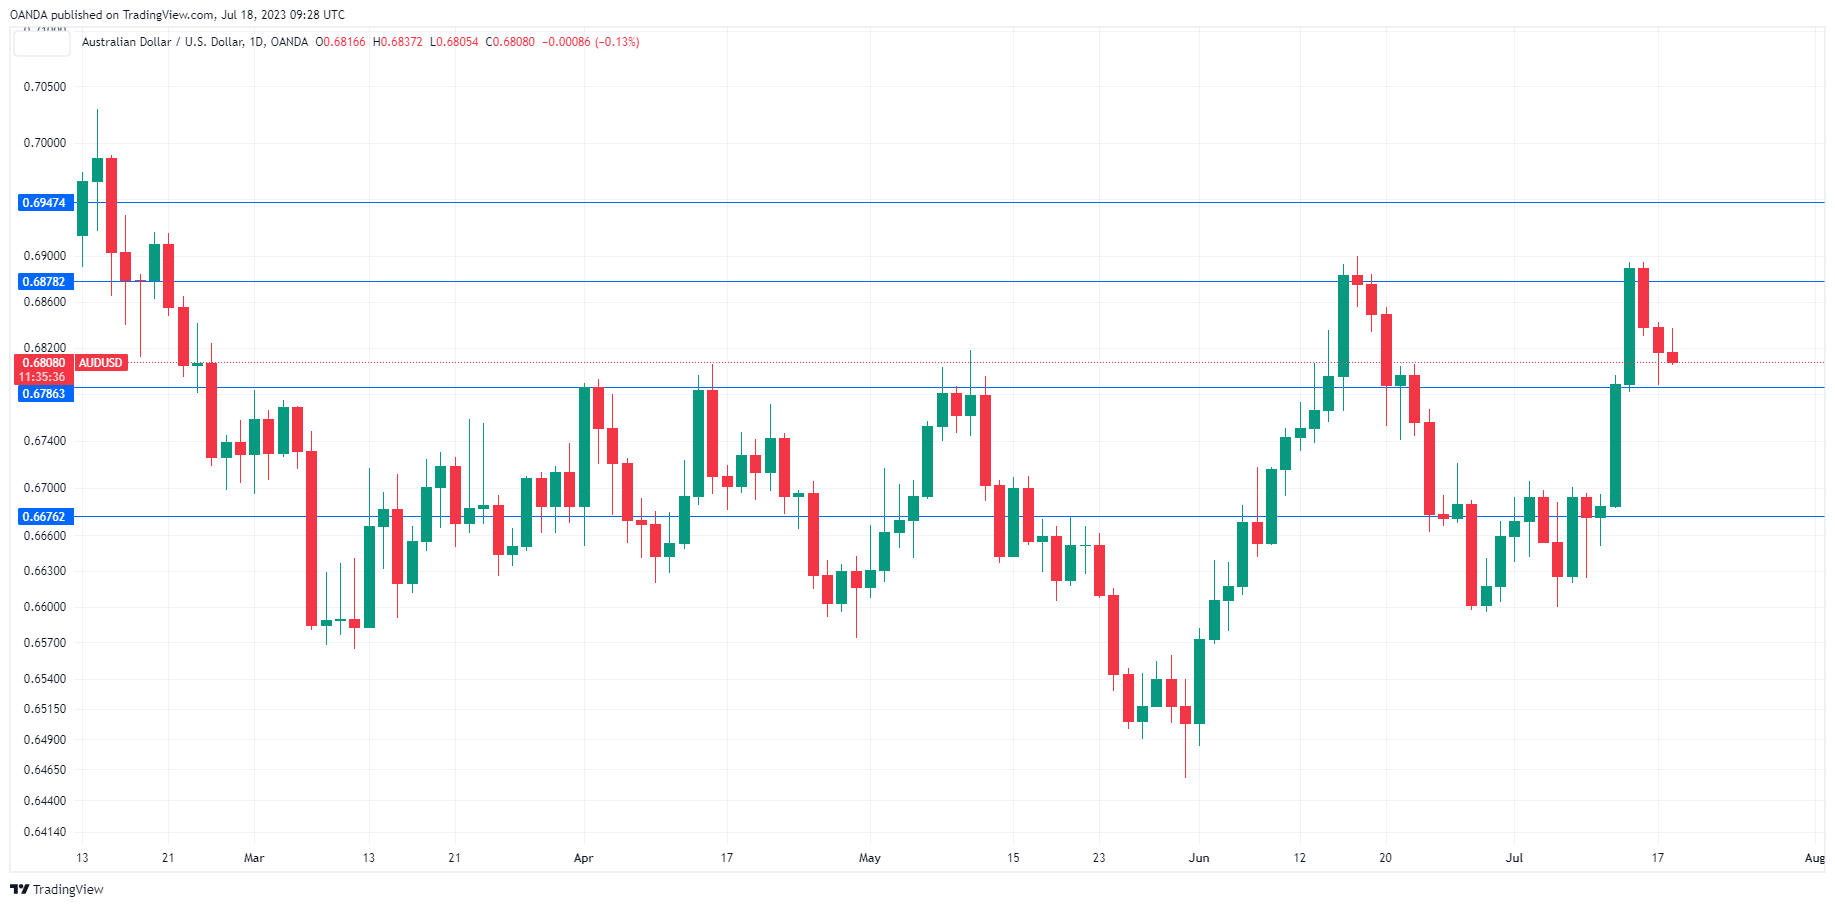
The Australian dollar has edged lower on Tuesday, trading at 0.6807, down 0.14%. We could see some further movement in the North American session when the US releases retail sales.
RBA minutes point to uncertainty about the economy
The RBA minutes didn’t provide much in the way of insights and the Australian dollar barely showed a muted response. Perhaps the most interesting aspect of the minutes was the spelling out of both sides of the argument about whether to raise rates or take a pause. In support of a hike, the minutes noted that wage growth is rising, inflation is falling and the labour market remains tight. The case for a pause relied on inflation remaining high and weaker growth. In the end, policy makers voted to pause since the arguments in favour of holding rates were more compelling.
The minutes stated that monetary policy was “clearly restrictive” at the current rate level but that would not preclude the RBA from further tightening, which would depend on the economy and inflation. The money markets have priced a pause at the August 1st meeting at 75%, according to the ASX RBA rate tracker. At the July meeting, the decision to pause was a close call and that could repeat itself at the August meeting, so I am not as confident in a pause as the money markets.
US retail sales expected to climb
The US releases the June retail sales report, with expectations that consumers remain in a spending mood. The consensus estimate for headline retail sales is 0.5% m/m, up from 0.3%, and the core rate is expected to rise 0.3%, up from 0.1%.
The Federal Reserve is widely expected to raise rates at the July 27th meeting. If retail sales improve as expected, we could see the pricing for a September rate hike – currently, there is only a 14% chance of a rate hike, according to the CME Tool Watch.
AUD/USD Technical
- There is resistance at 0.6878 and 0.6947
- 0.6786 and 0.6676 are providing support
EUR/GBP: Falling Thick Daily Cloud Produces Strong Headwinds to Near-Term Recovery
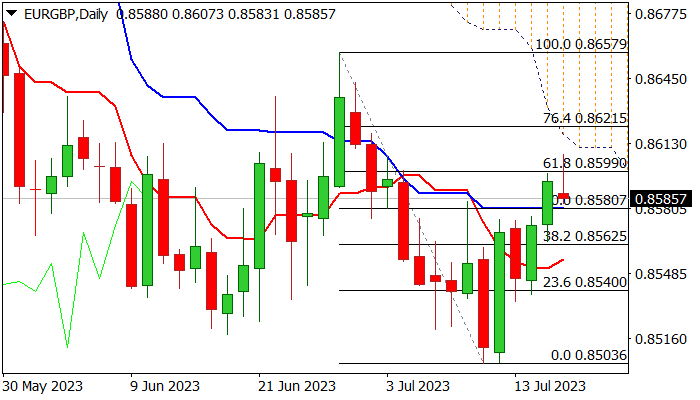
Attempts to extend strong rally of past two days failed at pivotal Fibo barrier at 0.8599 (61.8% of 0.8657/0.8503), as probe above faced strong headwinds from thick falling daily cloud (base of the cloud lays at 0.8610).
Short-lived spike higher is forming a daily candle with long upper shadow, which generates initial signal of possible recovery stall, though needs confirmation in daily close in this shape.
The notion is supported by overbought stochastic and 14-d momentum in negative territory and heading south.
Close below 0.8599 will provide initial negative signal and keep the downside vulnerable, with dip and close below 0.8580 (daily Kijun-sen / broken 50% retracement) to further weaken near-term structure and increase downside risk.
Alternatively, sustained break above 0.8599 pivot to keep bullish bias, but penetration into daily cloud is needed to fully employ bulls for stronger recovery.
Res: 0.8599; 0.8610; 0.8621; 0.8643.
Sup: 0.8580; 0.8562; 0.8540; 0.8518.