Sample Category Title
US 500 Cash Index Rally Continues; Correction Long Overdue
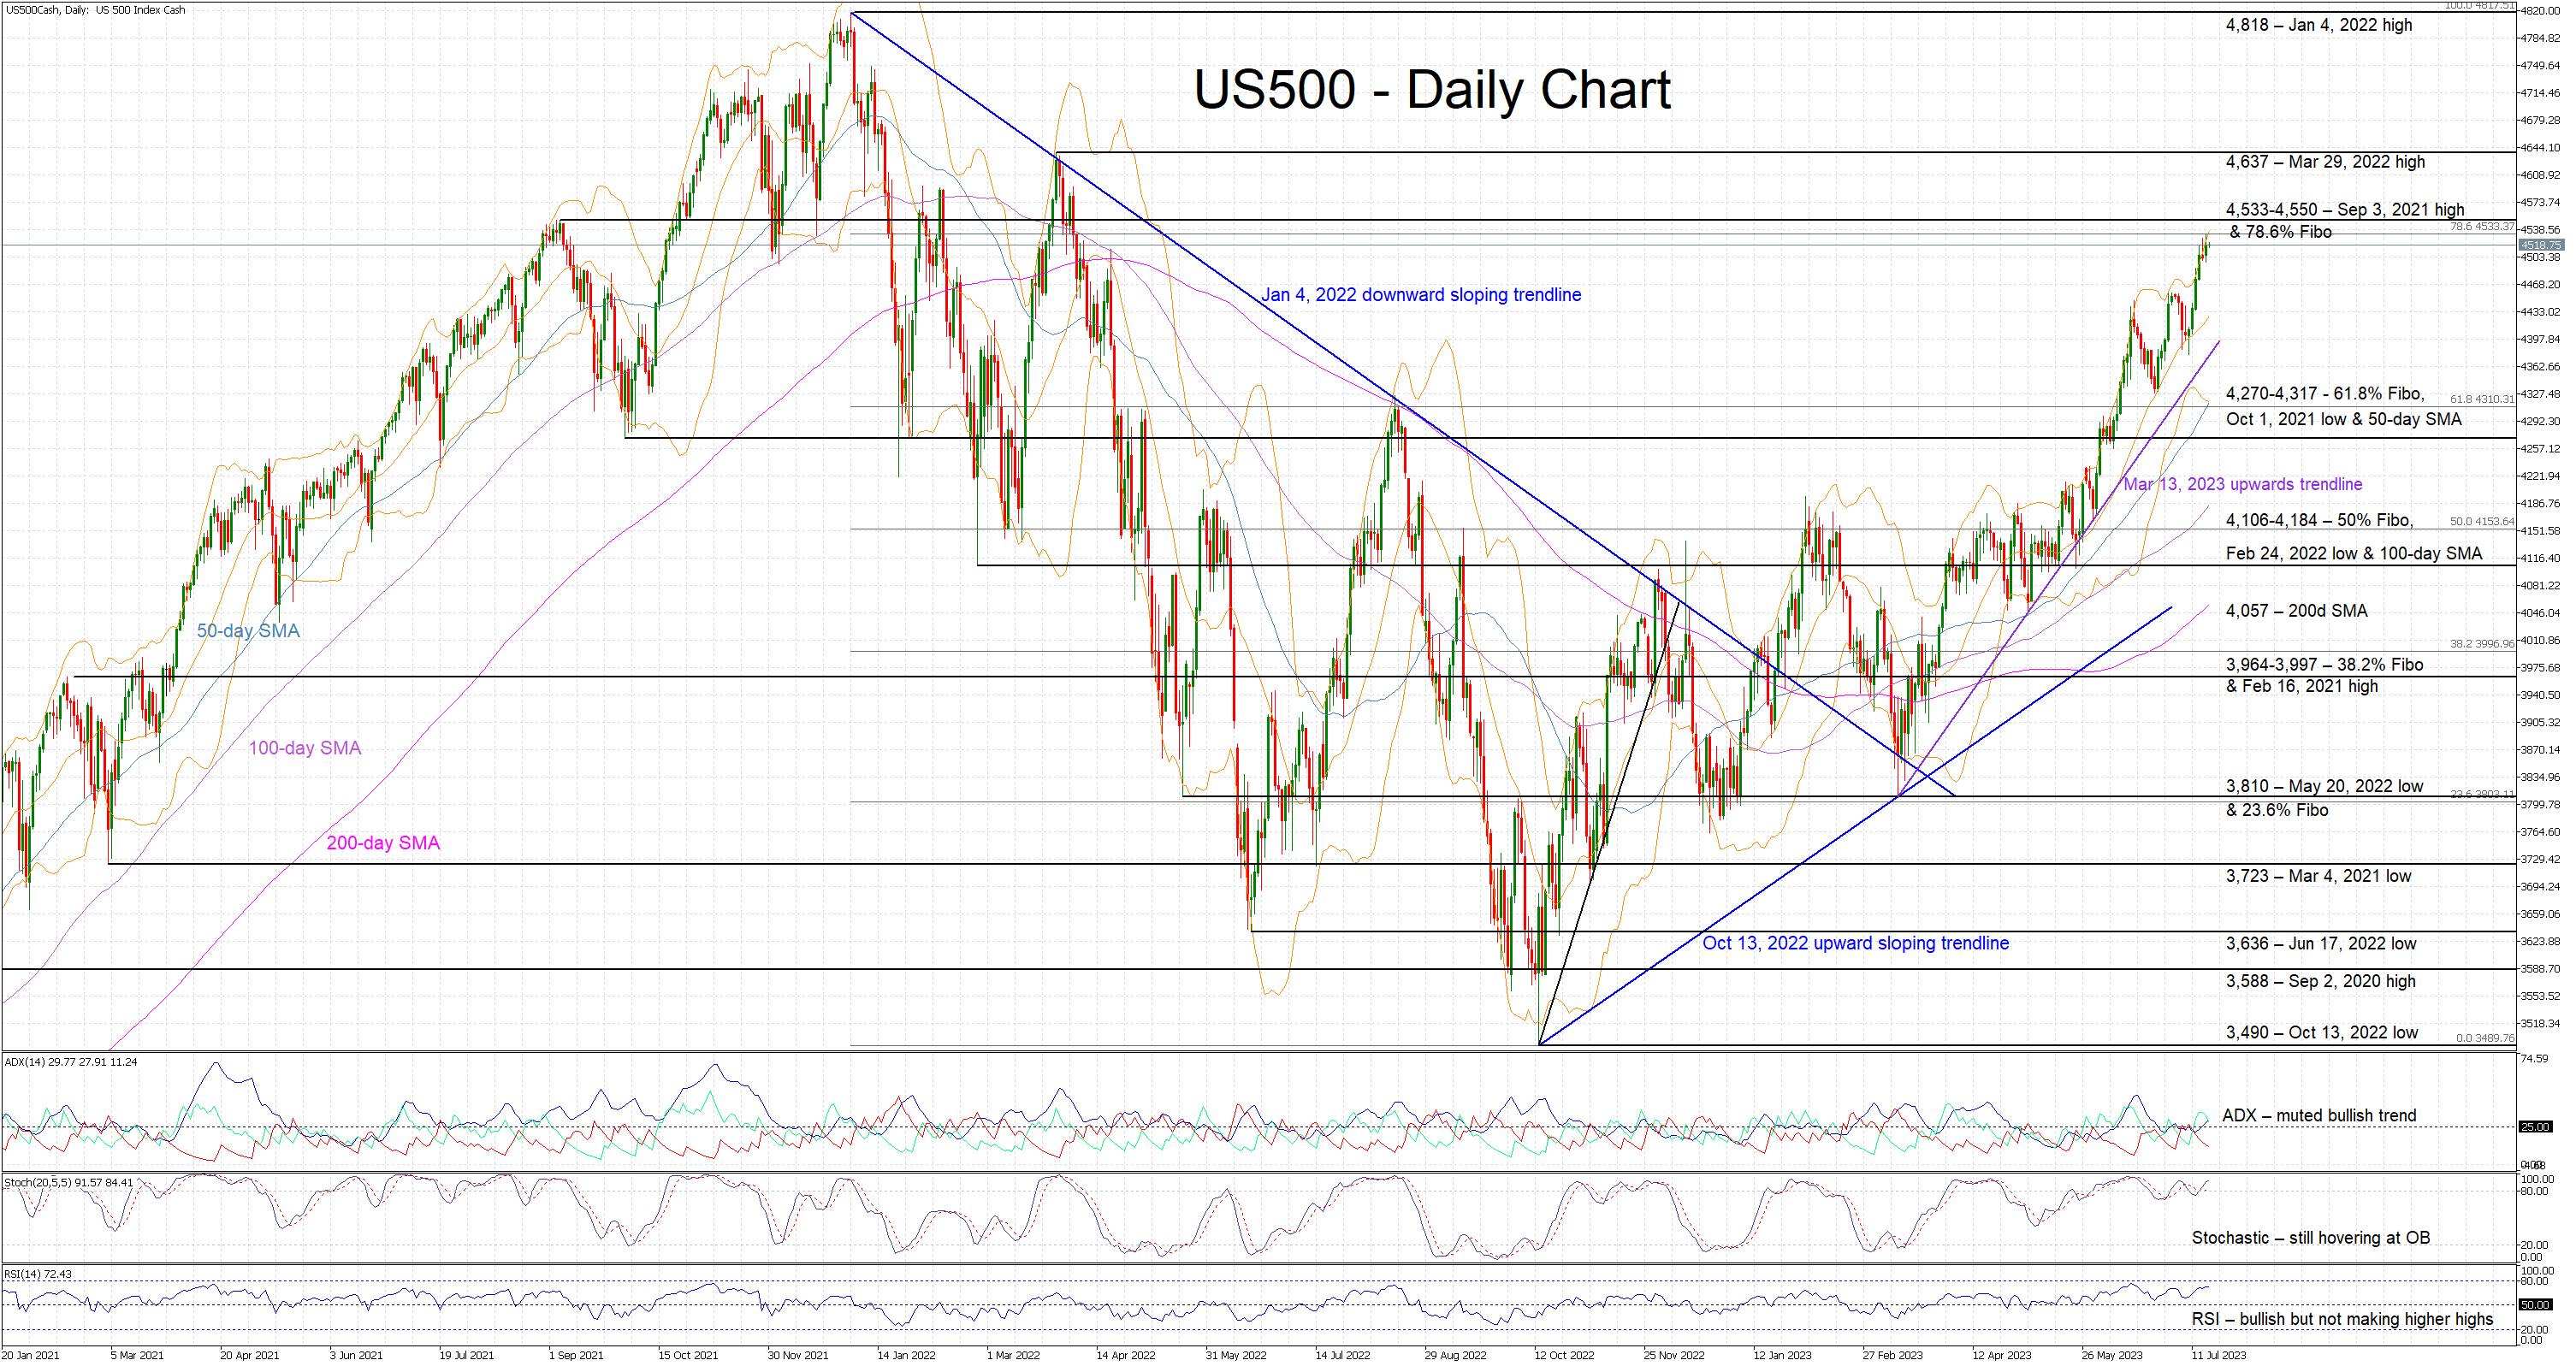
The US 500 cash index continues its advance, and it is currently trading at the highest level since April 6, 2022. The move since the March 13, 2023 low has been exponential with the lack of significant corrections being very visible at this stage. The index is currently hovering below the busy 4,533-4,550 area, as the bulls appear keen to record another 2023 high.
In the meantime, while the momentum indicators are clearly on the bulls’ camp, there are some early signs of rally exhaustion manifesting. More specifically, both the RSI and the stochastic oscillator continue to support the current upleg. However, both these indicators are unable to register higher highs and thus opening the door to the much-expected correction. Crucially, the Average Directional Movement Index (ADX) seems unimpressed by the current US 500 index upleg as it trades just a tad above the 25-level threshold.
Should the move higher have legs, the initial target would probably be the 4,533-4,550 area that is defined by the 78.6% Fibonacci retracement level of the January 4, 2022 – October 12, 2022 downtrend and the September 3, 2021 high. Higher, the March 29, 2022 high is unlikely to trouble the bulls’ much as they set their eyes at the all-time high of 4,818.
On the flip side, the bears are anxiously trying to stage a small pullback. They would be keen on a move towards the March 13, 2023 upward sloping trendline and the 4,270-4,317 range respectively. The latter is populated by the 61.8% Fibonacci retracement, the October 1, 2021 low and the 50-day simple moving average (SMA). If successful, the bears could have a go at the 4,106-4,184 range, a key level from a sentiment-perspective.
To conclude, with the US 500 cash index rally continuing unabated, the bears are trying to muster up the courage and sufficient evidence from the momentum indicators to finally stage a decent correction.
USD/CAD Daily Outlook
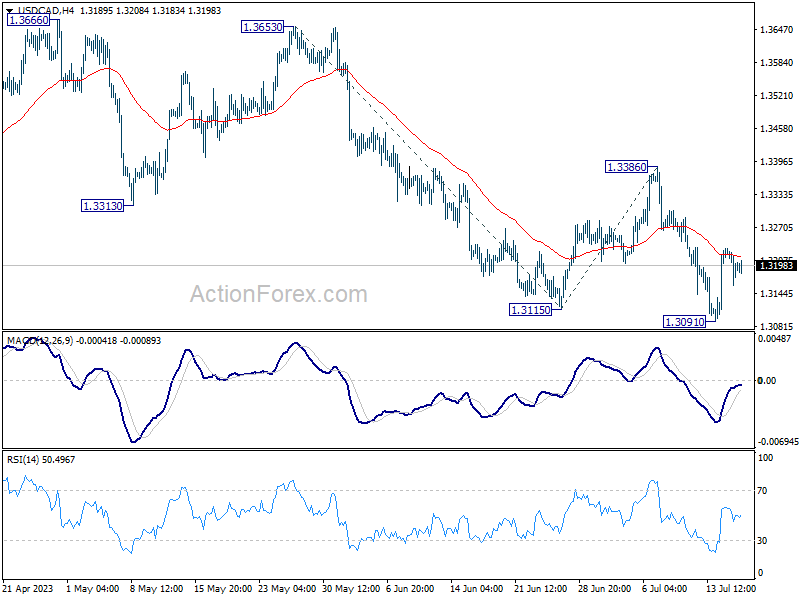
Daily Pivots: (S1) 1.3163; (P) 1.3198; (R1) 1.3234; More....
No change in USD/CAD's outlook as intraday bias remains neutral. Outlook will remain bearish as long as 1.3386 resistance holds. Break of 1.3091 will resume larger decline to 61.8% projection of 1.3653 to 1.3115 from 1.3386 at 1.3054. However, firm break of 1.3386 will indicate near term reversal and turn outlook bullish.
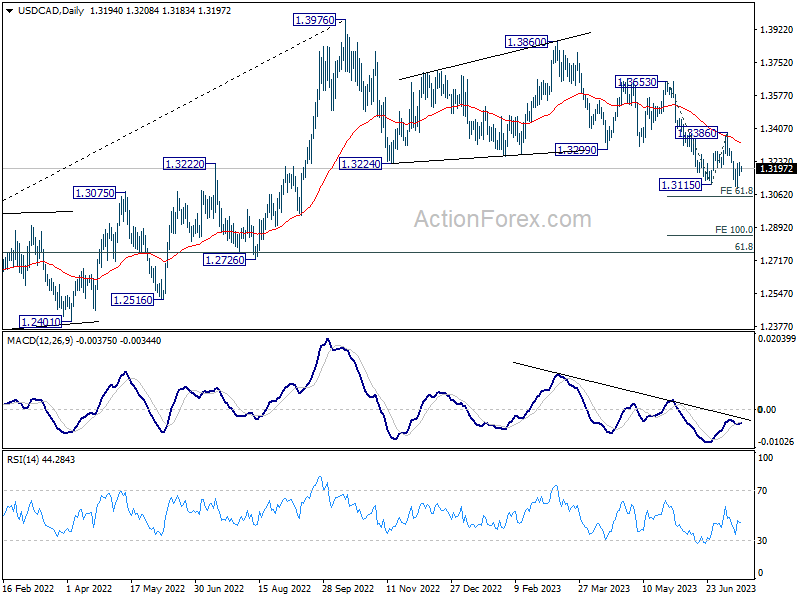
In the bigger picture, price actions from 1.3976 are viewed as a correction to up trend from 1.2005 (2021 low) only. But even so, deeper decline is expected as long as 1.3386 resistance holds. Further fall could be seen to 61.8% retracement of 1.2005 to 1.3976 at 1.2758. Meanwhile, break of 1.3386 will be a sign that the correction has completed and bring stronger rally back to retest 1.3976.
AUD/USD Daily Report
Daily Pivots: (S1) 0.6787; (P) 0.6817; (R1) 0.6846; More...
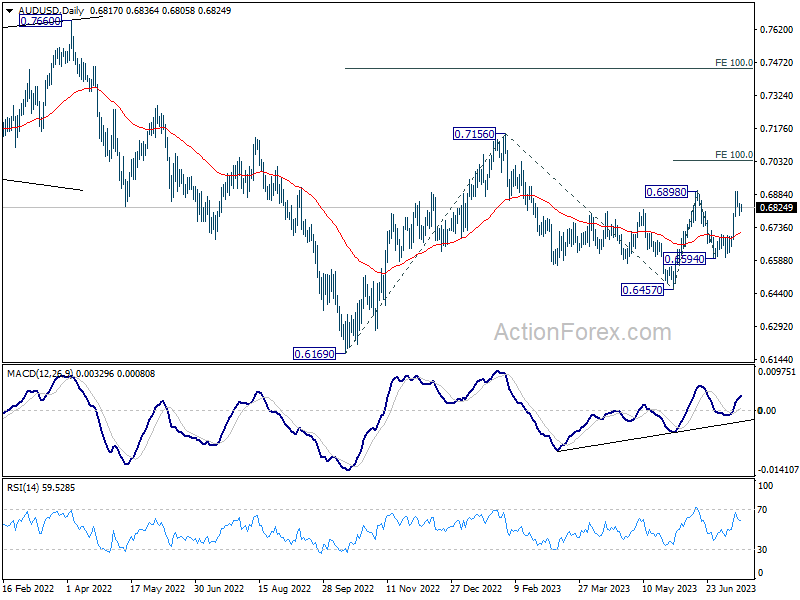
Intraday bias in AUD/USD stays neutral at this point. On the upside, decisive break of 0.6898 resistance will firstly confirm resumption of rise from 0.6457. Secondly, that should also confirm completion of the fall from 0.7156 at 0.6457. Next target will be 100% projection of 0.6457 to 0.6898 from 0.6594 at 0.7035, and then 0.7156 resistance.
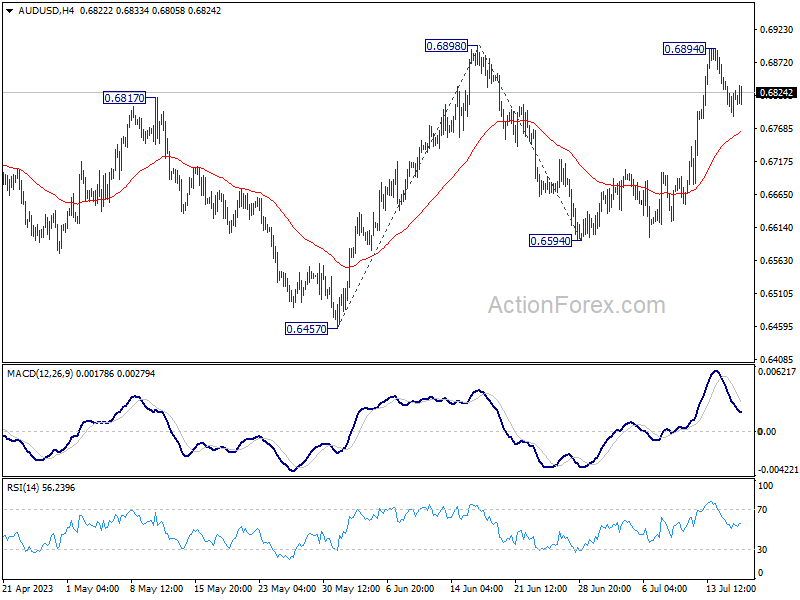
In the bigger picture, price actions from 0.7156 are seen as a correction to the rebound from 0.6169 (2022 low). Break of 0.6898 resistance will argue that rise from 0.6169 is ready to resume through 0.7156. Next target will be 100% projection of 0.6169 to 0.7156 from 0.6457 at 0.7444. For now, this will be the favored case as long as 55 D EMA (now at 0.6703) holds.
EUR/USD Daily Outlook
Daily Pivots: (S1) 1.1211; (P) 1.1230; (R1) 1.1257; More...
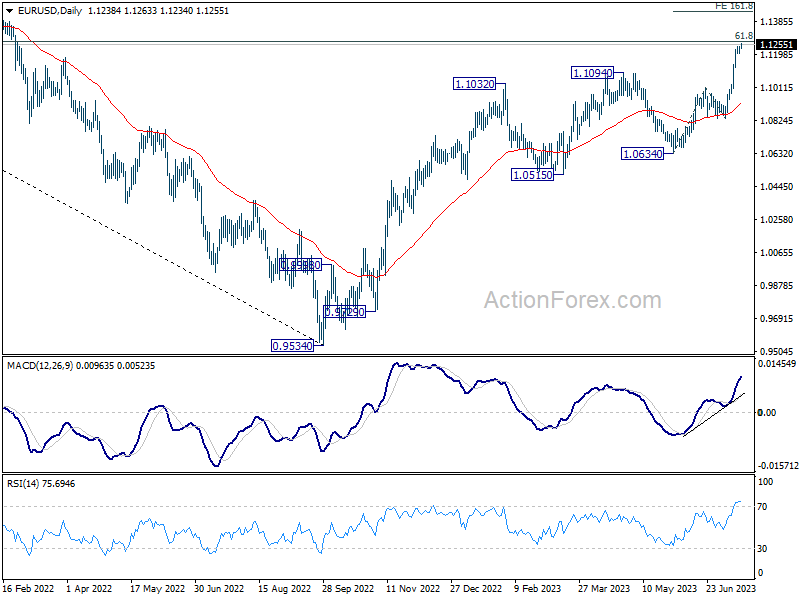
EUR/USD's rally is resuming by breaking 1.1248 minor resistance. However, upside could be limited by 1.1273 fibonacci level on first attempt, on loss of momentum. On the downside, break of 1.1202 minor support will turn bias back to the downside for deeper pull back. Nevertheless, sustained break of 1.1273 will extend larger up trend to 161.8% projection of 1.0634 to 1.1011 from 1.0832 at 1.1442 next.
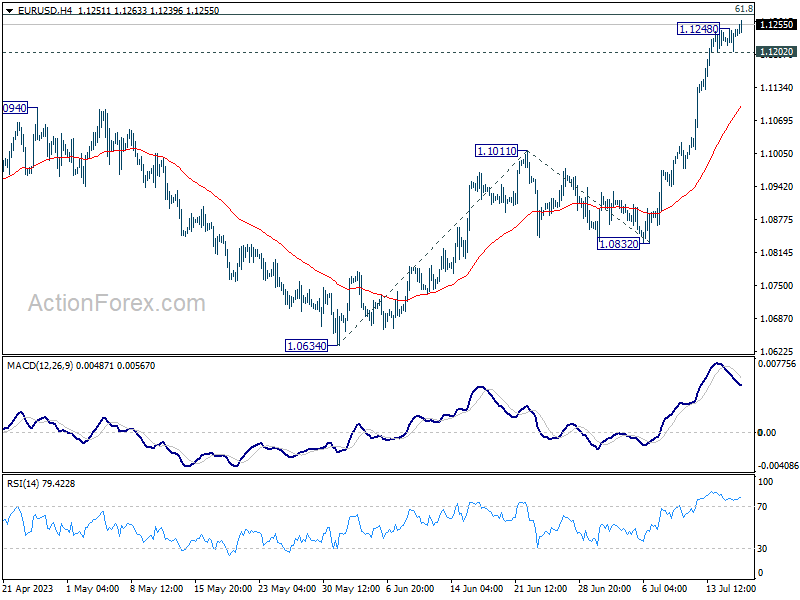
In the bigger picture, as rise from 0.9534 extends, focus is now on 61.8% retracement of 1.2348 (2021 high) to 0.9534 at 1.1273. Sustained break there will solidify the case of bullish trend reversal and target 1.2348 resistance next. Meanwhile, outlook will continue to stay bullish as long as 1.0832 support holds, even in case of deep pull back.
GBP/USD Daily Outlook
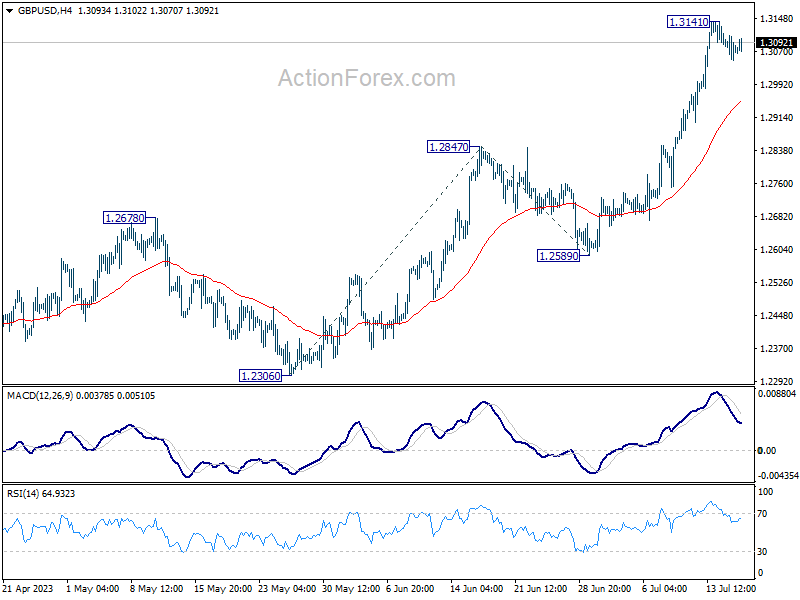
Daily Pivots: (S1) 1.3075; (P) 1.3108; (R1) 1.3127; More...
Intraday bias in GBP/USD remains neutral as consolidation from 1.3141 is extending. Downside of retreat should be contained above 1.2847 resistance turned support to bring rise resumption. On the upside, break of 1.3141 will resume larger up trend and target 161.8% projection of 1.2306 to 1.2847 from 1.2589 at 1.3464 next.
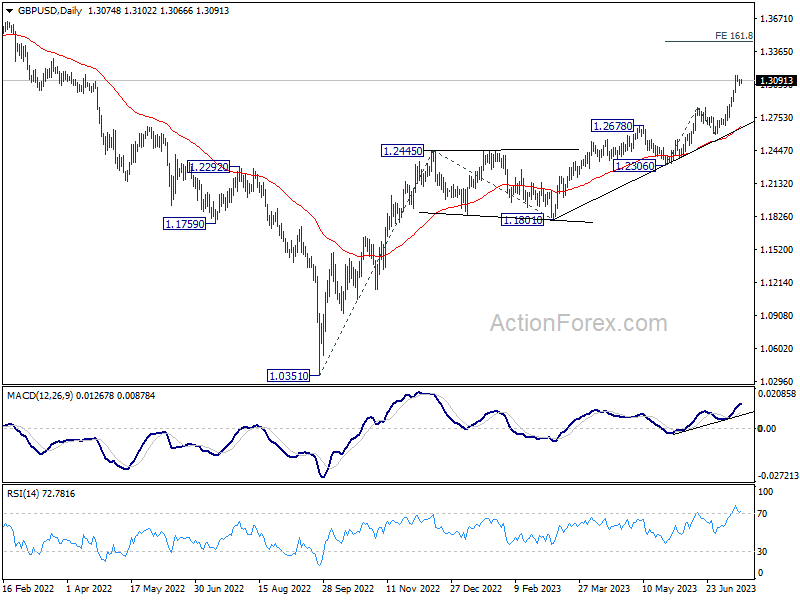
In the bigger picture, rise from 1.0351 medium term bottom (2022 low) is in progress. Next target is 100% projection of 1.0351 to 1.2445 from 1.1801 at 1.3895. Break there will target 1.4248 key long term resistance (2021 high) next. This will now remain the favored case as long as 1.2678 resistance turned support holds.
USD/JPY Daily Outlook
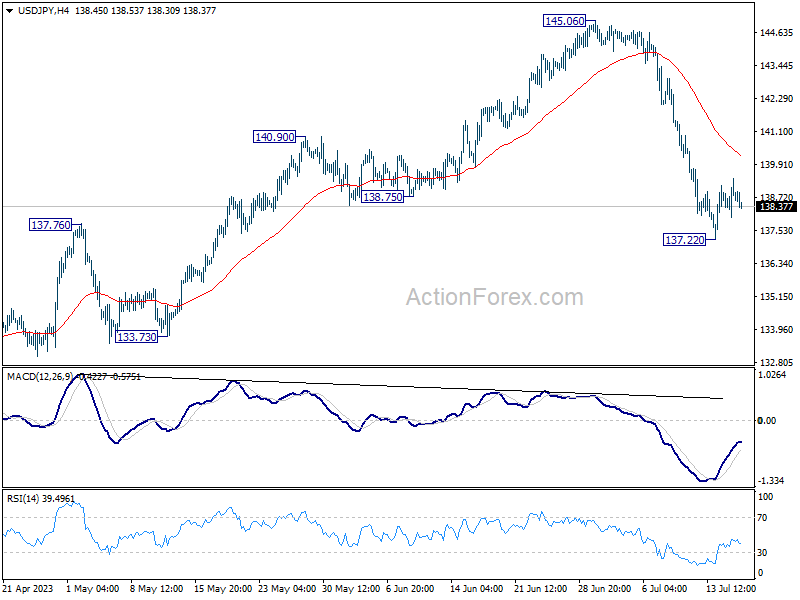
Daily Pivots: (S1) 138.01; (P) 138.71; (R1) 139.41; More...
Intraday bias in USD/JPY remains neutral as consolidation from 137.22 is extending. Upside of recovery should be limited by 55 4H EMA (now at 140.18) and bring another decline. Break of 137.22 and sustained trading below 137.90 resistance turned support will confirm the larger bearish case, and target 127.20 and below.
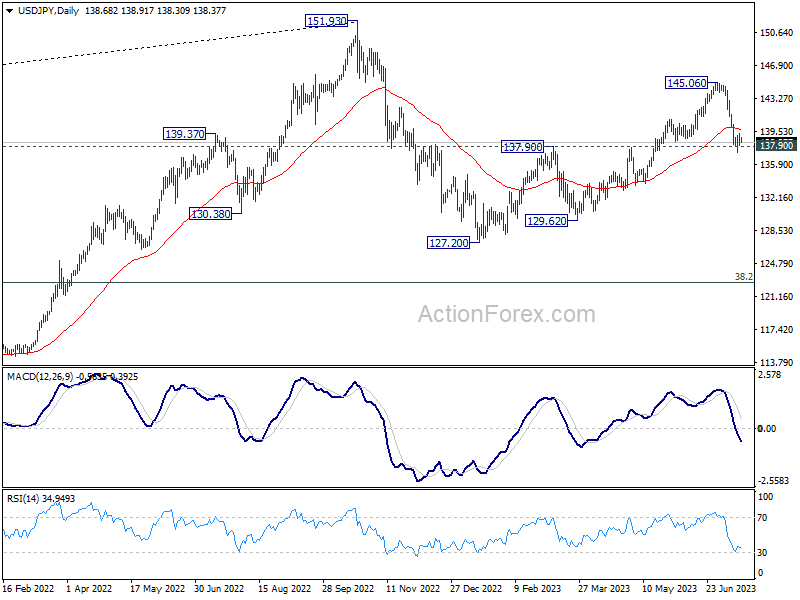
In the bigger picture, fall from 145.06 is seen as the third leg of the corrective pattern from 151.93 (2022 high). Sustained break of 137.90 resistance turned support should confirm this case and target 127.20 (2023 low) and below. For now, this will remain the favored case as long as 145.06 resistance holds, even in case of strong rebound.
Better to Wait the Outcome of Next Week’s ECB/Fed Policy Meetings
Markets
Yesterday had little to offer from an economic point of view and that showed in daily trading. Main FI and FX markets traded sideways from the start. US stock markets (up to +0.93% for Nasdaq) parted ways with key European indices (up to -1% lower). Technical elements played in Europe after failure last week to pierce key resistance (4400) in the EuroStoxx 50. ECB members are about to join their US colleagues in the pre-meeting blackout period, but that didn’t hold some back for some last-minute comments. ECB Nagel – German, hawk by nature - stated the obvious by calling the July hike and stuck with the main message that data will decide on the outcome of the September meeting. His personal connotations – “core inflation is very sticky”, “don’t currently see a risk of overtightening” and “too early to declare victory over inflation” – barely conceal his preference though. Bank of Italy governor Visco – Italian, dove by nature - is more hopeful and believes that inflation may drop more quickly than forecast. He assumes that the drop in energy prices will more quickly show in core prices as well. Therefore, he’s wary about doing too much from a monetary policy point of view. ECB Villeroy is still scheduled to speak today and later this week, but on both occasions the topic is non-monetary policy related. The ECB’s Q2 Bank Lending Survey (July 25) is the final piece of key input ahead of the July 27 policy meeting.
Today’s eco calendar contains US retail sales. Consensus expects a 0.5% M/M headline gain and a 0.3% M/M increase for the retail control group (used as proxy for consumption calculations in GDP). We don’t expect retail sales to have a big market impact following final pre-Summer lull 2-way positioning at the start of the month. Traded volumes are shrinking fast and risk-reward it’s better to wait the outcome of next week’s ECB/Fed policy meetings. In this scenario, EUR/USD 1.1274 resistance (62% retracement on 2021-2022 USD rise) should theoretically hold, but risks if any are clearly for a sooner break higher. EUR/GBP moves further away from the low 0.85 support area (currently 0.86) awaiting tomorrow’s inflation numbers which should seal the (discounted) 50 bps BoE rate hike in August. On a very first small positive note, a Lloyds survey showed that UK food and drink manufacturers cut prices in June for the first time in more than 3 years.
News and views
The NY Fed’s SCE credit access survey showed that the overall rejection rate for credit applicants increased to 21.8% the highest level since June 2018. The increase was broad-based across all age groups. The rejection rate for auto loans increased to 14.2% from 9.1% in February, a new series high. It also increased for credit cards, credit card limit increase requests, mortgages, and mortgage refinance applications. The average reported expectation of applicants that a loan application will be rejected increased sharply for all loan types. It rose to 30.7% for auto loans (series high), 32.8% for credit cards, 42.4% for credit limit increase requests (series high), 46.1% for mortgages (series high), and 29.6% for mortgage refinance applications.
Minutes of the Reserve Bank of Australia’s (RBA) July policy meeting indicated that the MPC discussed both the option to raise the policy rate further by 25 bps or holding the cash rate unchanged at 4.10%. The case to increase the cash rate further was centered on observations that inflation was forecast to remain above target for an extended period and the risk that this timeframe would be extended without further monetary policy tightening. The labour market remains very tight, notwithstanding some easing in conditions recently. Supporting the case for leaving the policy rate unchanged, members noted that monetary policy had been tightened considerably and rapidly over the prior year and that the stance of monetary policy was clearly restrictive. Mortgage interest payments (as a share of household disposable income) were around a record high and will rise further. The MPC saw considerable uncertainty about the resilience of household consumption. The MPC also pondered the risk that the unemployment rate would rise beyond the rate required to ensure inflation returns to target in a reasonable timeframe. The MPC concluded to leave the policy rate unchanged an reassess the situation at the August meeting. Some further tightening may be required but this depends on how the economy and inflation evolve.
Caution Lingers on China Fears, Earnings Take Centre Stage
Asian shares flashed red on Tuesday as concerns over China’s sluggish economic recovery weighed on sentiment.
The disappointing GDP data published in the previous session along with the hefty losses posted by China’s Evergrande over two years sapped investor confidence in the world’s second-largest economy. Interestingly, European futures are pointing to a flat open, shrugging off the caution from Asia with investors focusing on key economic data and corporate earnings. On Wall Street, the S&P 500 closed at 15-month highs yesterday and could be injected with more volatility as earnings season switches into higher gear. The likes of Bank of America, Morgan Stanley, Goldman Sachs, Netflix, and Tesla among others will announce their quarterly results this week.
In the currency arena, the dollar slightly weakened against other G10 currencies ahead of the U.S. retail sales and industrial production data released later today. Looking at commodities, oil bulls were able to draw strength from Russia’s plans to cut crude exports while gold prices nudged higher, supported by China growth fears and expectations around the Fed ending its rate hike cycle.
Dollar shaky ahead of key US data
The pending U.S. retail sales and industrial production figures could influence monetary policy expectations before the Fed meeting next week. After the June US CPI report cooled more than expected, investors are searching for more signs of inflation slowing in the world’s largest economy. Markets are forecasting retail sales to rise 0.5% in June, marking an increase from 0.3% in the prior month. The industrial production figures are expected to hold steady in June after falling 0.2% in May. Should the incoming US data bring a positive surprise, this could refuel speculation around the Fed keeping interest rates higher for longer.
Commodity spotlight – Gold
Gold flirted around the $1960 level this morning as market players evaluated China’s sluggish growth and speculation around the Fed ending its rate hike campaign.
The precious metal is likely to remain supported by a weaker dollar and subdued Treasury yields ahead of another busy week for financial markets. Fresh volatility could be on the cards for gold over the next few days as investors focus not only on US economic data but corporate earnings which could influence overall sentiment. Should gold experience a clean breakout and solid close above $1960, this may encourage a move towards $1985 and $2000 respectively. But if $1960 proves to be a tough resistance, prices may slip back towards $1940 and $1932.
Energy, Metals Fall, Wheat Rallies
The week started with unpleasant news really. First, the Chinese growth numbers disappointed at yesterday’s open, and sent the metal, energy, and European stocks down. A barrel of American crude fell 1.72% and slipped below the $75pb level, and is still consolidating below this level this morning, the European nat gas prices continue trending lower following an upbeat mood at the start of the summer on expectation that the European nations refilling their reserves for winter would push prices higher. But the disappointing growth numbers and the slowing activity in Europe hammered the positive trend and the prices remained under pressure despite the recent spike in oil prices. Then, Wisdomtree’s industrial metals ETF dropped nearly 2% and Hermes slumped more than 4% below its 50-DMA and to its 100-DMA yesterday on worries that the Chinese costumers, who were the reason why the company announced juicy earnings in the past few quarters. In summary, energy and French luxury goods, and the British FTSE 100 index – full of energy and miners – didn’t react well to the news.
Then, Russia cancelled the grain deal, which allowed the safe passage of around 33 million of crops from Ukraine via Black Sea since last June and wheat futures jumped nearly 3.50% yesterday. While Russia had only half-heartedly agreed to sign a Turkish brokered deal, the latest explosion in the bridge between Russian and Crimea and the Western sanctions that are taking a toll on the Russian exports brought Russia to drop the deal, turning all eyes to Turkish President Erdogan, who said that he will meet Vladimir Putin in August, but given the urging situation he will certainly call him before. There is one thing that could displease Russians though, and it is the fact that Erdogan gave a greenlight for Sweden joining NATO just a couple of days ago. The latter could make another crop deal harder to be sealed. So, all eyes are on Turkish President Erdogan. If he can’t agree on a new deal, the Ukrainian crops must take a pricier detour to reach the international market and that extra cost could discourage farmers to keep supply steady. Lower supply could boost wheat prices and add to food price inflation worries that had just started easing.
US stocks extend rally
But it doesn’t seem to be a concern for the US equities, as despite the morose mood in Asia and Europe yesterday, the S&P500 advanced yet to another high since April 2022, as Nasdaq 100 reached levels last since at the start of last year. The US 2-year yield which consolidates near the 4.70% level on hope that the Federal Reserve’s (Fed) tightening cycle is soon over. And the 7-9% drop expected in S&P500 earnings is nothing compared to a chance that the US economy could avoid a hard landing following the Fed’s steep interest rate hikes. After all, the Fed’s balance sheet only slowly drops, as the Fed’s reverse repo operations tank, which means that the Fed is keeping the market liquidity in a sweet spot as the US Treasury general account is being refilled after the debt limit crisis. And all that liquidity continues to be supportive of stock prices, no matter how fast the Fed increases its interest rates.
Menu du Jour
Anyway, today, Bank of America, Morgan Stanley and Lockheed Martin will be releasing their quarterly earnings. While BoFA and Morgan Stanley’s investment branches may have taken a hit, investors will be looking at how well these banks benefited from rising rates. Lockheed Martin on the other hand will undoubtedly continue outperforming as war and geopolitical tensions only keep rising and increasing the defense budgets around the world.
On the macro calendar, the US retail sales will be in focus today, as the resilience of the US consumer spending is another headache in the Fed’s fight against inflation, and the data could not surprise to the downside. According to Bank of America’s card data, spending in June was down by 0.2% ‘but not out’ and the official numbers are expected to show a slow improvement. A better-than-expected read could fuel inflation expectations and slowdown the US dollar’s selloff but unless we see seriously strong data, any improvement will unlikely to turn the bearish winds around in the medium run.
Technical Outlook and Review
DXY:
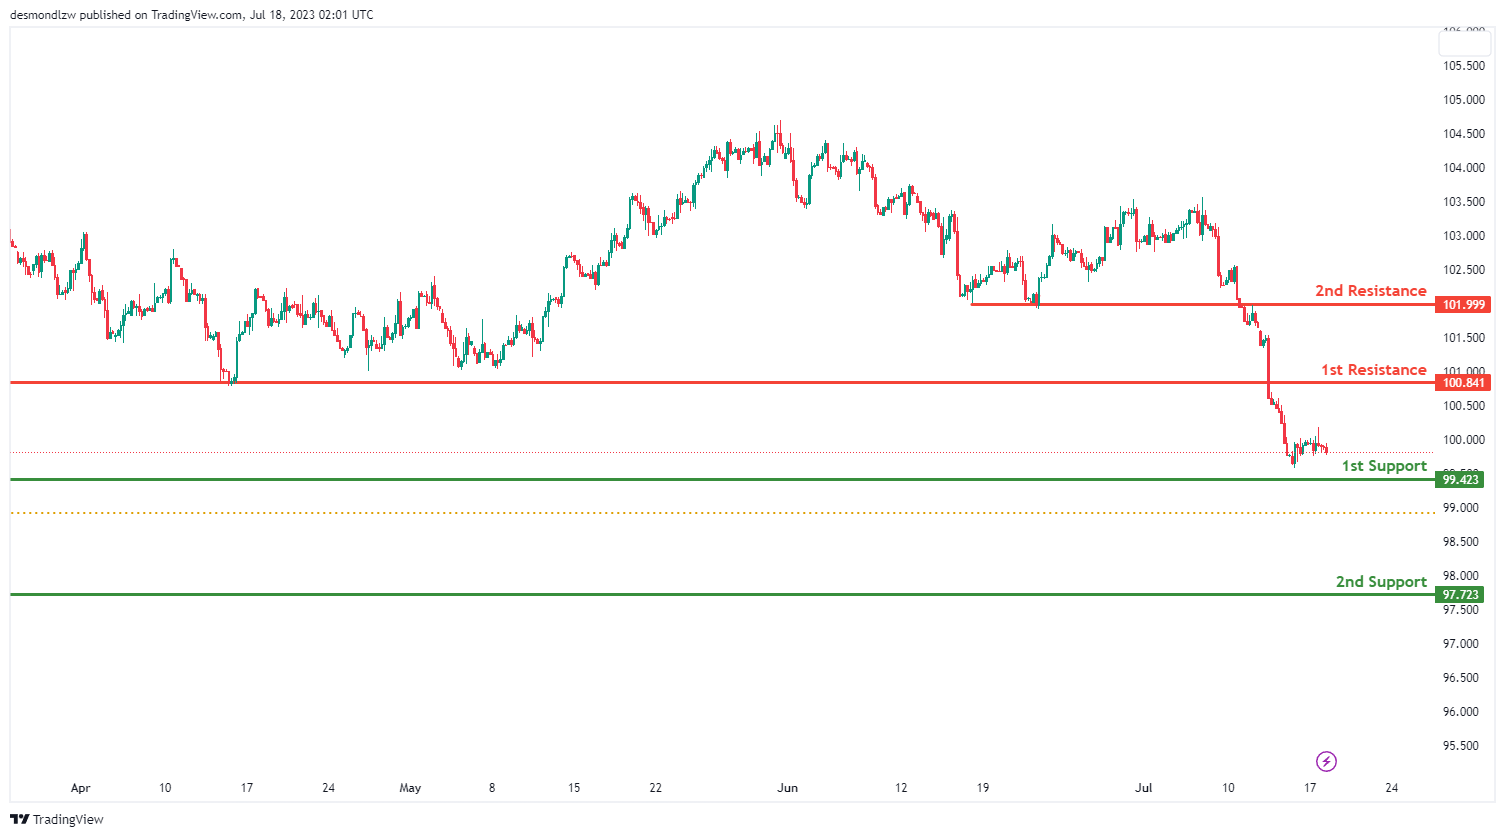
The DXY (US Dollar Index) chart is currently showing a bearish momentum This suggests that the price could potentially continue to descend towards the 1st support level.
The 1st support level is found at 99.42, which is recognized as an overlap support. Should the price break this level, it could continue its bearish trajectory towards the 2nd support level at 97.72, also characterized as an overlap support. These support levels mark important areas where buying interest might outweigh selling pressure, leading to a potential price rebound.
On the other hand, if the price begins to rise, it could face resistance at 100.84, identified as pullback resistance. Further above, the 2nd resistance level is at 101.99, also recognized as an overlap resistance. These resistance levels might act as obstacles to upward price movements and could stimulate a selling response.
EUR/USD:
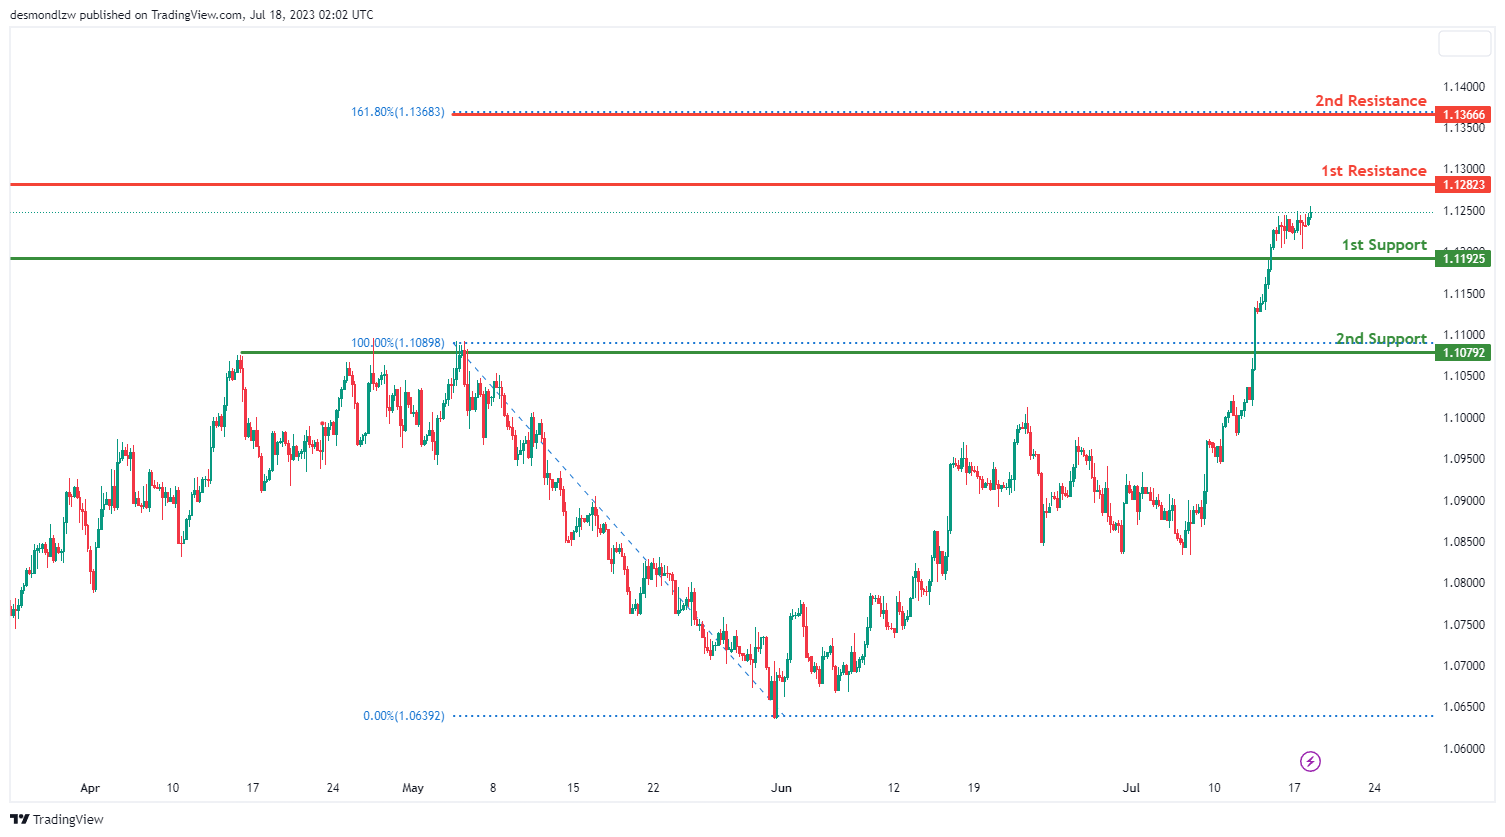
For the EUR/USD instrument, the overall momentum of the chart is bullish. This suggests that the price could potentially continue its upward movement towards the 1st resistance level.
The 1st support level is identified at 1.1192, characterized as a pullback support. If the price retreats, this level could provide a bounce back point. A further drop could lead the price towards the 2nd support level at 1.1079, also classified as pullback support. These support levels mark critical areas where buying interest may outstrip selling pressure, leading to a potential rise in price.
On the other hand, if the price continues its bullish trajectory, it could meet resistance at 1.1282, identified as an overlap resistance. If the price breaks this level, the next hurdle could be the 2nd resistance level at 1.1366. This level corresponds to the 161.80% Fibonacci extension, making it a significant potential turning point. These resistance levels might act as barriers to the price’s upward movement and could stimulate a selling response.
EUR/JPY:
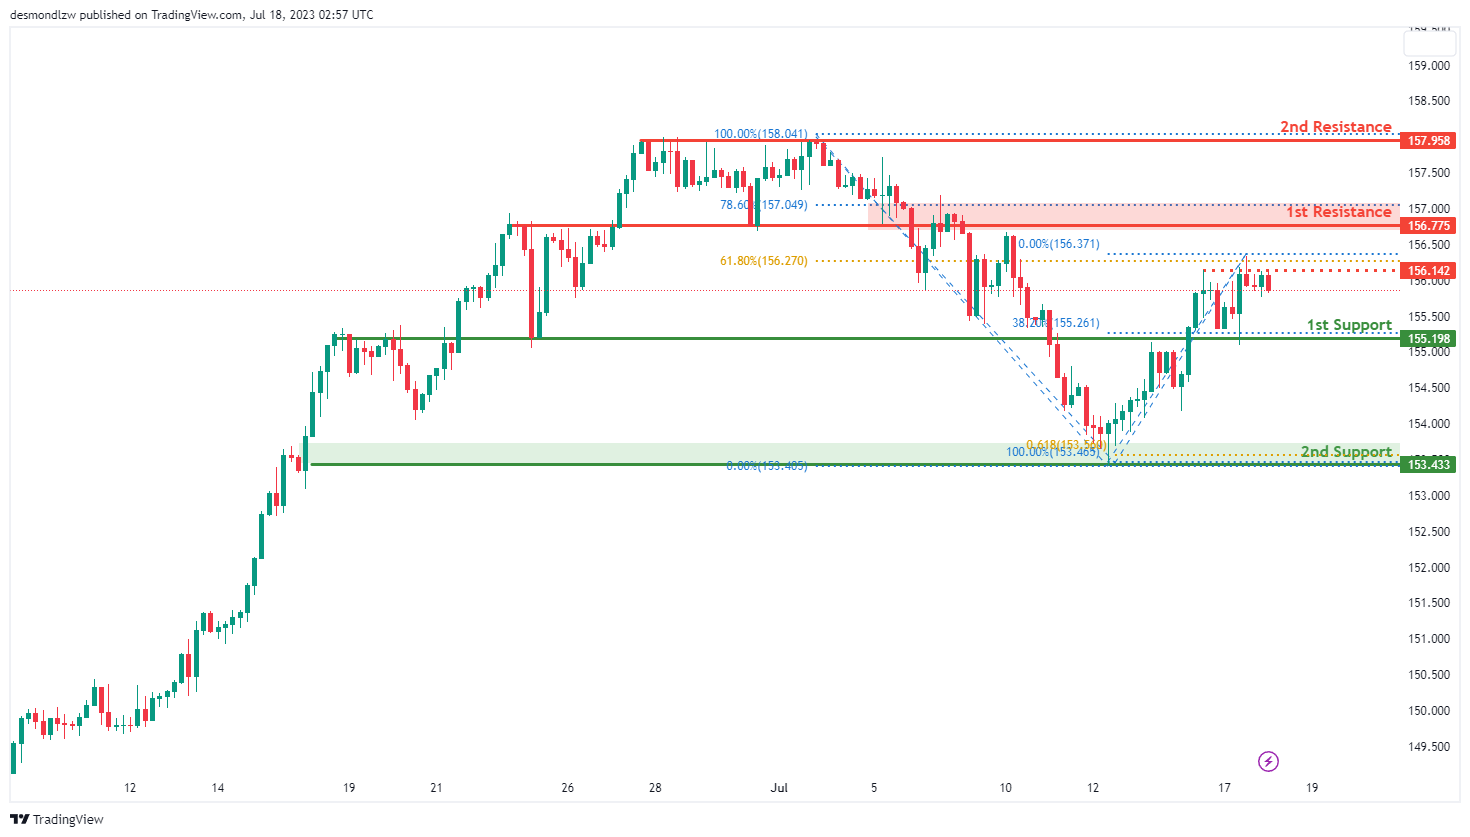
The EUR/JPY instrument is currently showing a bullish overall momentum. Based on the chart analysis, there is a potential for the price to drop further to the first support level in the short term before bouncing from there and rising towards the first resistance.
The first support level at 155.19 is considered good as it provides pullback support and coincides with the 38.20% Fibonacci retracement level. Additionally, the second support at 153.43 is identified as swing low support and aligns with the 61.80% Fibonacci projection level.
On the upside, the first resistance level at 156.77 is seen as an overlap resistance and corresponds to the 78.60% Fibonacci retracement level. The second resistance at 157.95 is identified as a multi-swing high resistance.
Furthermore, an intermediate resistance level at 156.14 is noteworthy as it aligns with the 61.80% Fibonacci retracement level.
EUR/GBP:
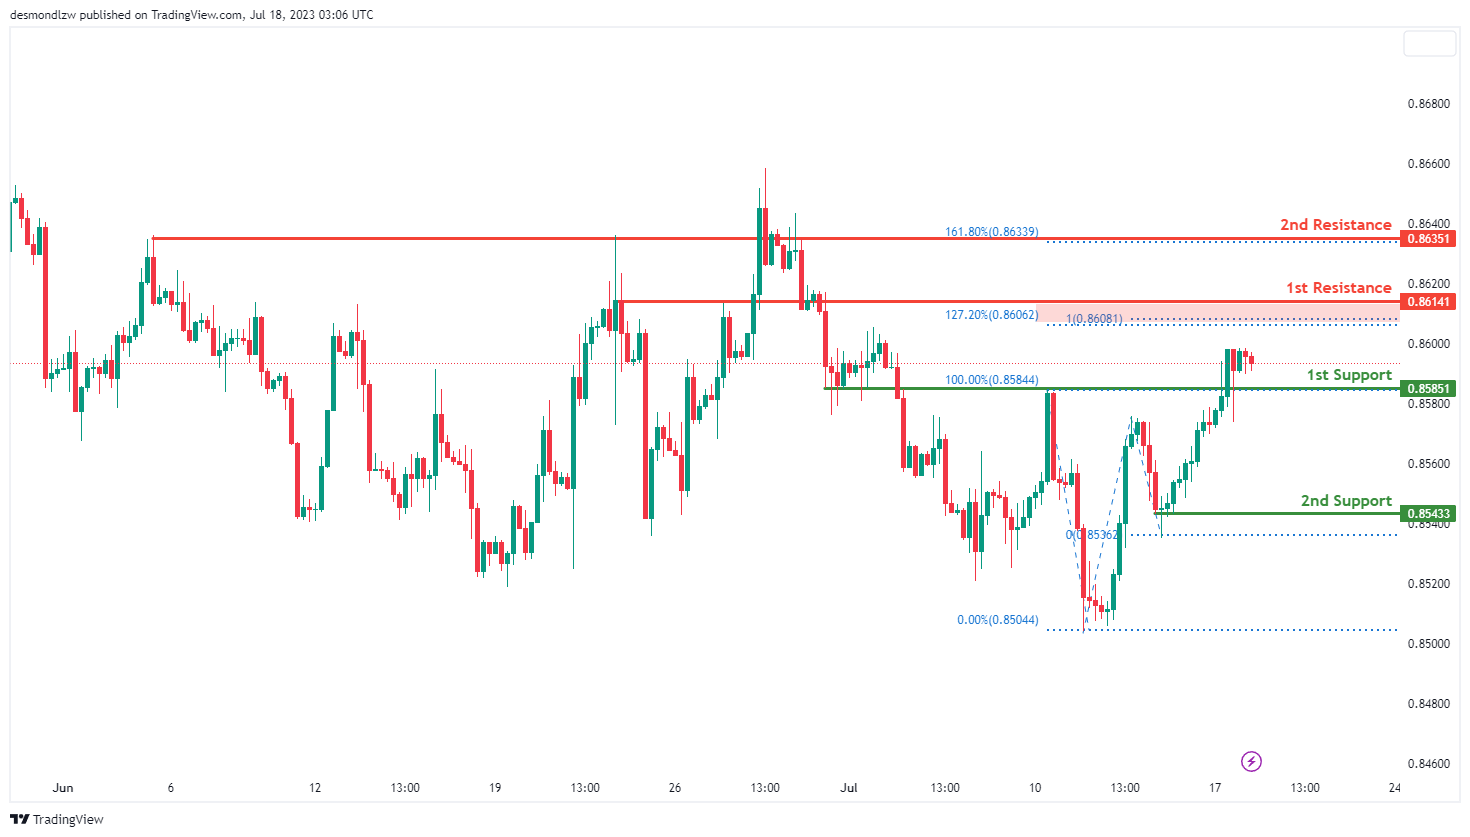
The EUR/GBP instrument is currently demonstrating a bullish overall momentum. Based on the chart analysis, there is a potential for the price to drop further to the first support level in the short term before bouncing from there and rising towards the first resistance.
The first support level at 0.8585 is considered good as it provides pullback support. Additionally, the second support at 0.8543 is identified as swing low support.
On the upside, the first resistance level at 0.8614 is seen as an overlap resistance, and it also aligns with the 127.20% Fibonacci extension and 100% Fibonacci projection levels. The second resistance at 0.8635 is identified as an overlap resistance.
GBP/USD:
The GBP/USD instrument currently exhibits a bullish momentum, implying that the price could continue its upward trajectory towards the 1st resistance level.
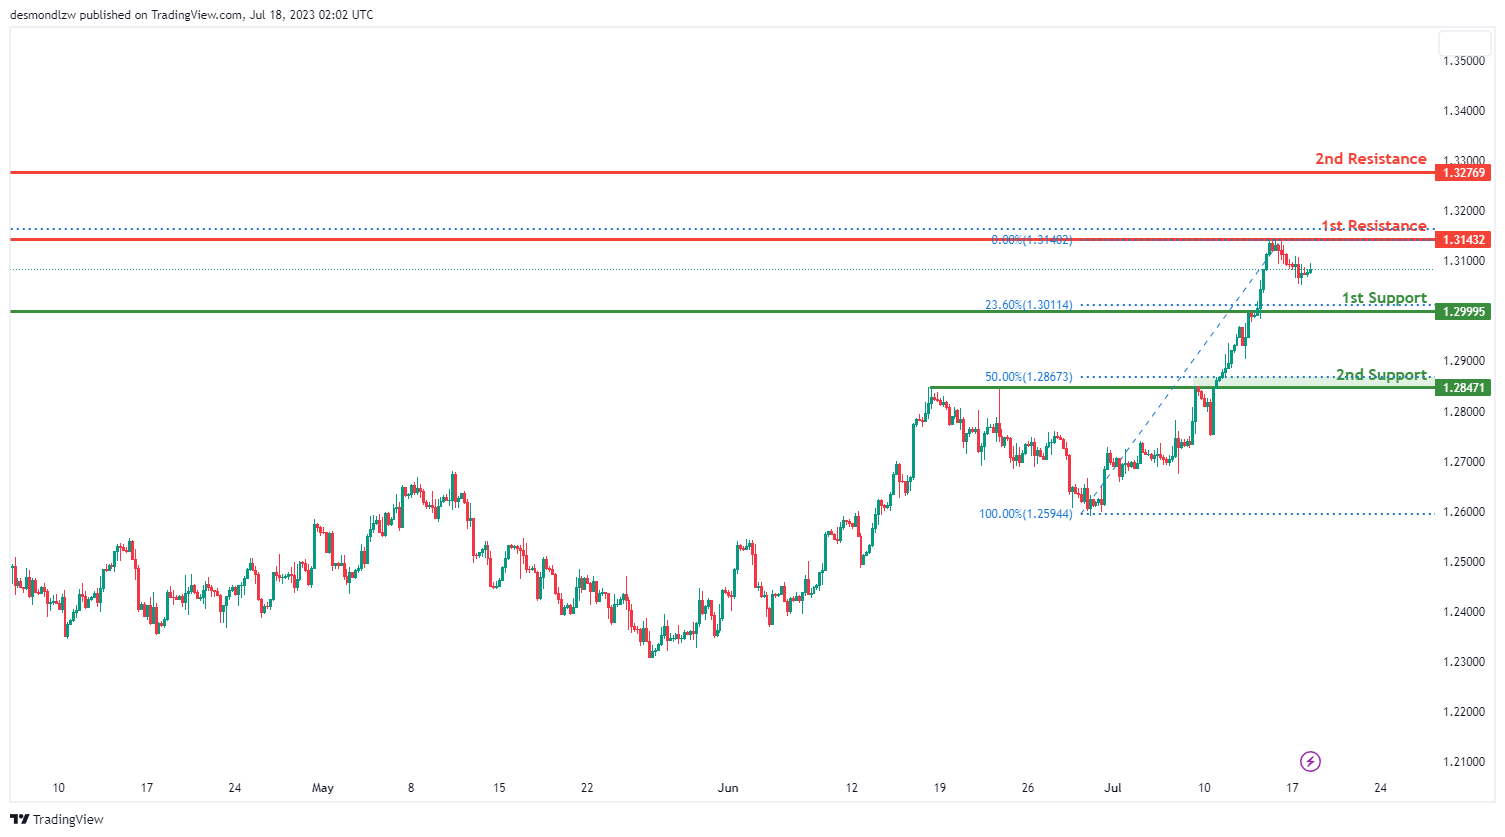
The 1st support level is situated at 1.2999, recognized as a pullback support and also aligns with the 23.60% Fibonacci retracement level. Should the price retreat, this level might provide a rebound point. A further decline could lead the price towards the 2nd support level at 1.2847, which is also considered as pullback support and matches with the 50% Fibonacci retracement level. These support zones are important areas where buying pressure may overpower selling pressure, potentially causing a price increase.
On the flip side, if the price continues its bullish run, it may encounter resistance at 1.3143, identified as a multi-swing high resistance. If the price surpasses this level, the next obstacle could be the 2nd resistance level at 1.3276, distinguished as an overlap resistance. These resistance levels could act as barriers to the price’s advancement and may trigger a selling reaction.
GBP/JPY:
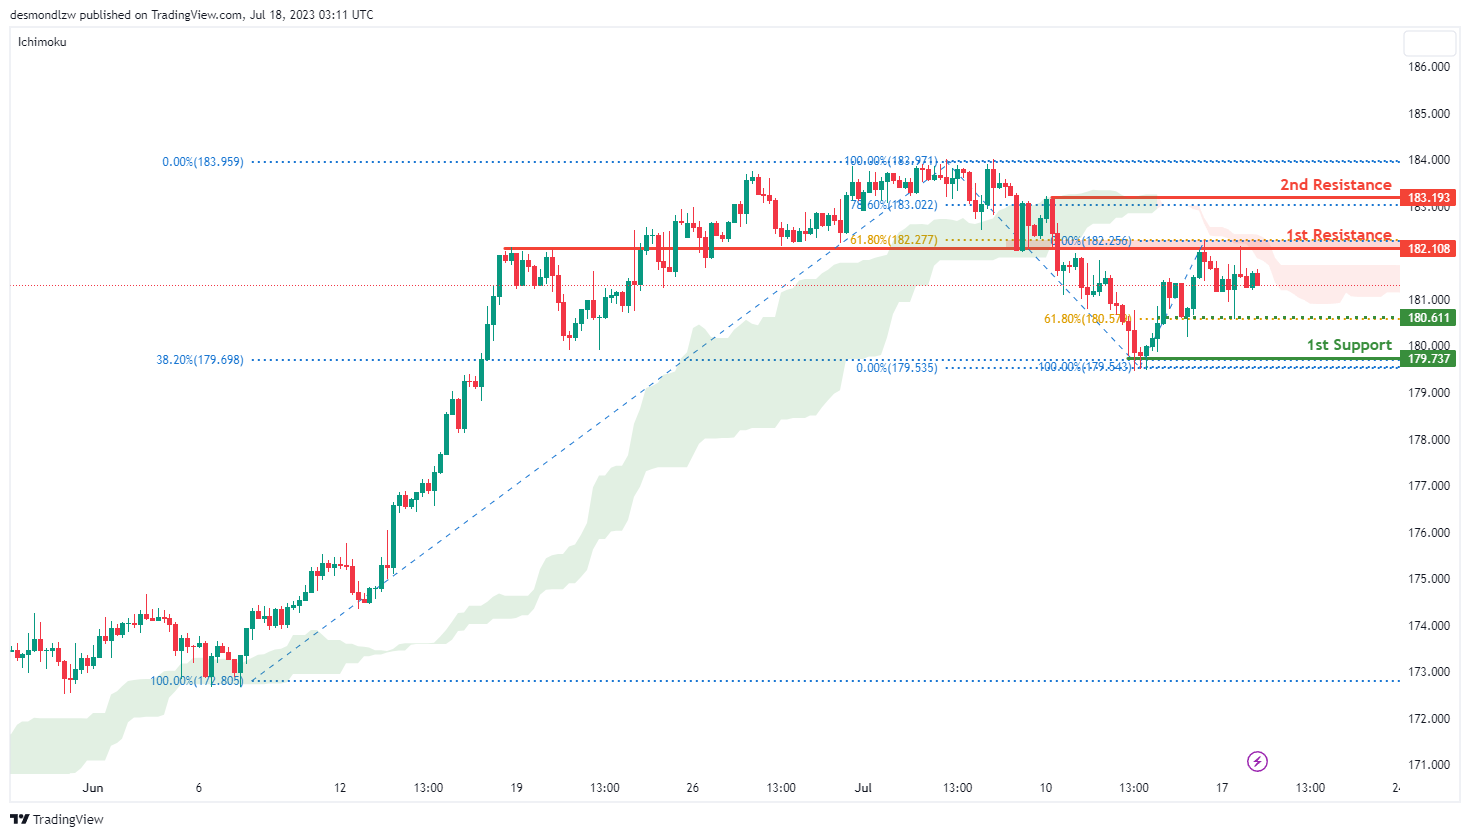
The GBP/JPY instrument is currently experiencing a bearish momentum, and one of the factors contributing to this momentum is that the price is below the bearish Ichimoku cloud. Based on the chart analysis, there is a potential for a bearish continuation towards the first support level.
The first support level at 179.73 is considered good as it provides pullback support and aligns with the 38.20% Fibonacci retracement level. Additionally, the intermediate support at 180.61 is identified as a level that corresponds to the 61.80% Fibonacci retracement.
On the upside, the first resistance level at 182.10 is seen as an overlap resistance and is associated with the 61.80% Fibonacci retracement. The second resistance at 183.19 is identified as a swing high resistance and corresponds to the 78.60% Fibonacci retracement.
USD/CHF:
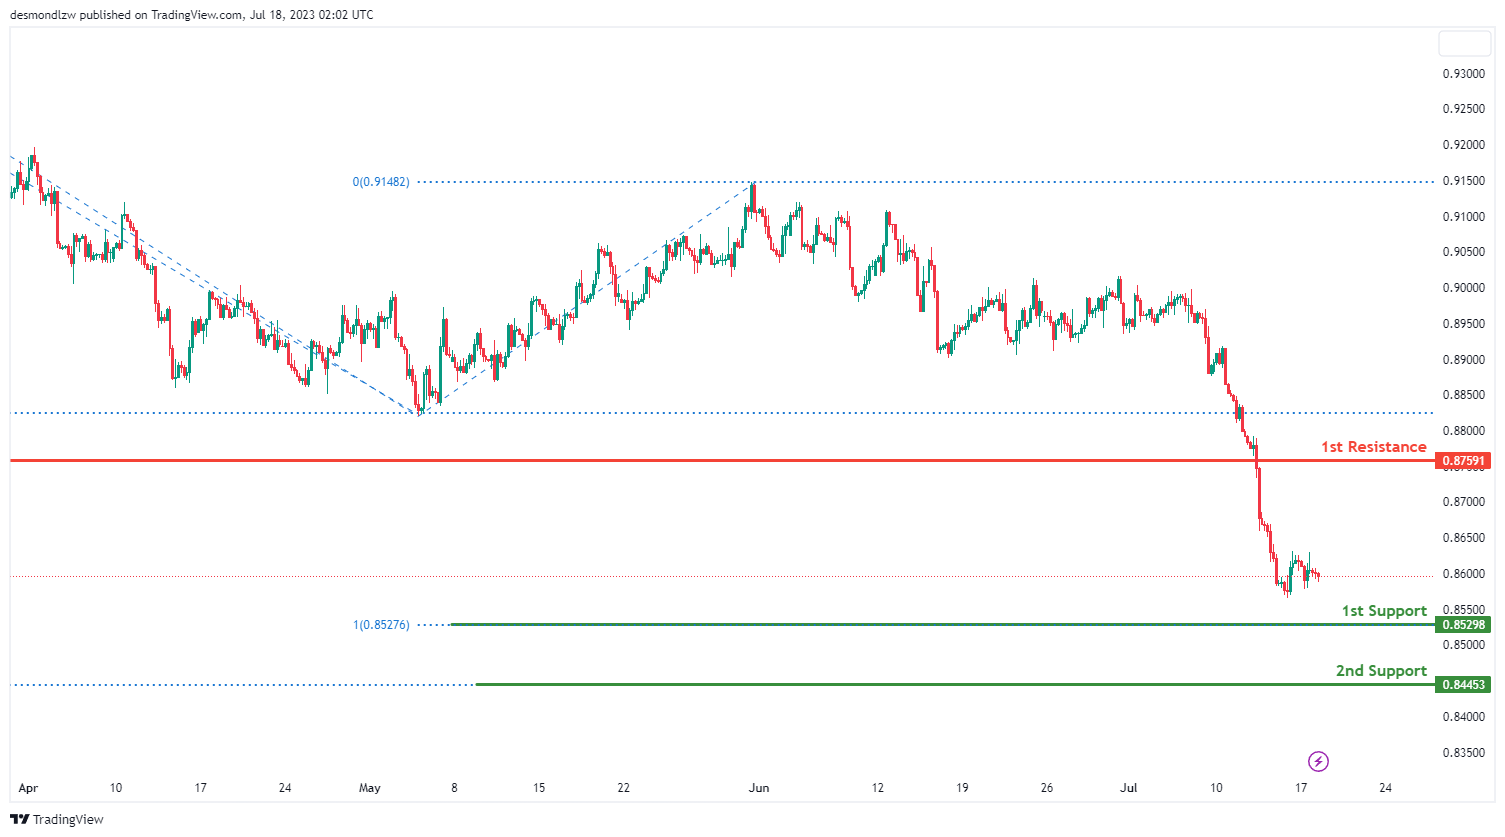
The USD/CHF instrument is currently exhibiting a bearish momentum, indicating that the price could potentially continue its downward movement towards the 1st support level.
The 1st support level is identified at 0.8529 and it aligns with the 100% Fibonacci projection, making it a significant level where the price might experience a bounce. Should this level fail to hold, the price could decline further to the 2nd support level at 0.8445, which corresponds to the -61.8% Fibonacci expansion level. These support levels are crucial areas where buying interest may surpass selling pressure, leading to a potential price increase.
Conversely, if the price reverses its course and starts to ascend, it could face resistance at 0.8759. This level, defined as a pullback resistance, might act as a barrier to the price’s advancement, possibly triggering a selling response. It’s important to closely monitor the price action at these critical levels for potential trading opportunities.
USD/JPY:
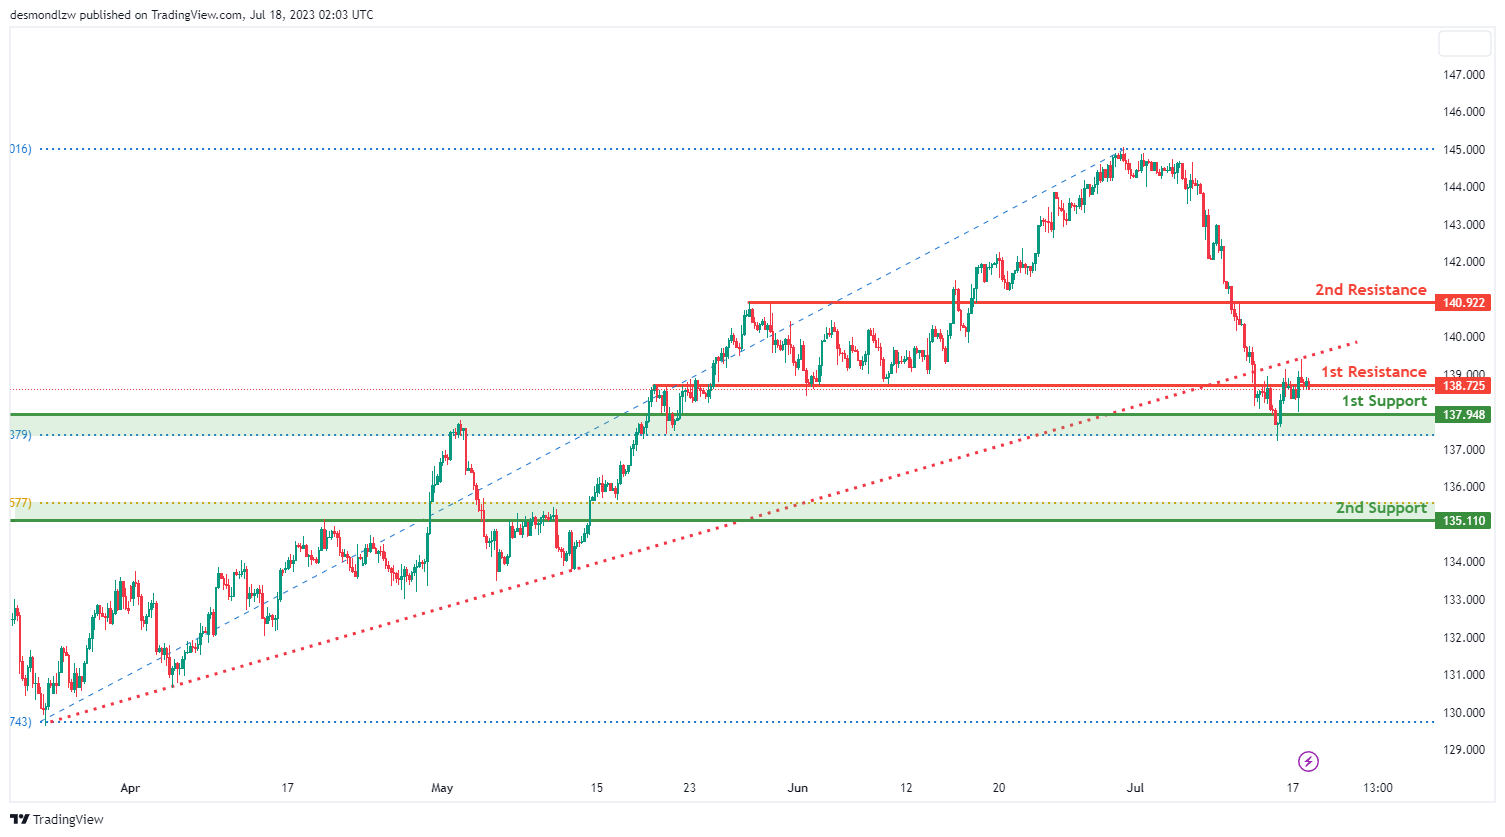
The USD/JPY currency pair currently demonstrates a bearish momentum after breaking below an ascending support line, which could potentially trigger further bearish movement. This suggests that the price could continue its downward trajectory towards the 1st support level.
The 1st support level is at 137.94 and is identified as an overlap support, coinciding with the 50% Fibonacci projection. This creates a potentially significant zone where the price may experience a bounce. If this support level fails to hold, the price could further descend towards the 2nd support level at 135.11, which is another overlap support but this time coinciding with the 61.80% Fibonacci retracement. These support levels are critical areas where buying pressure might exceed selling pressure, leading to a potential upturn in the price.
On the flip side, if the price starts to rise, it could face resistance at 138.72, identified as an overlap resistance. Further upwards, the 2nd resistance level stands at 140.92, also recognized as an overlap resistance. These resistance levels may act as barriers where the price could meet a selling response, potentially halting its upward movement
USD/CAD:
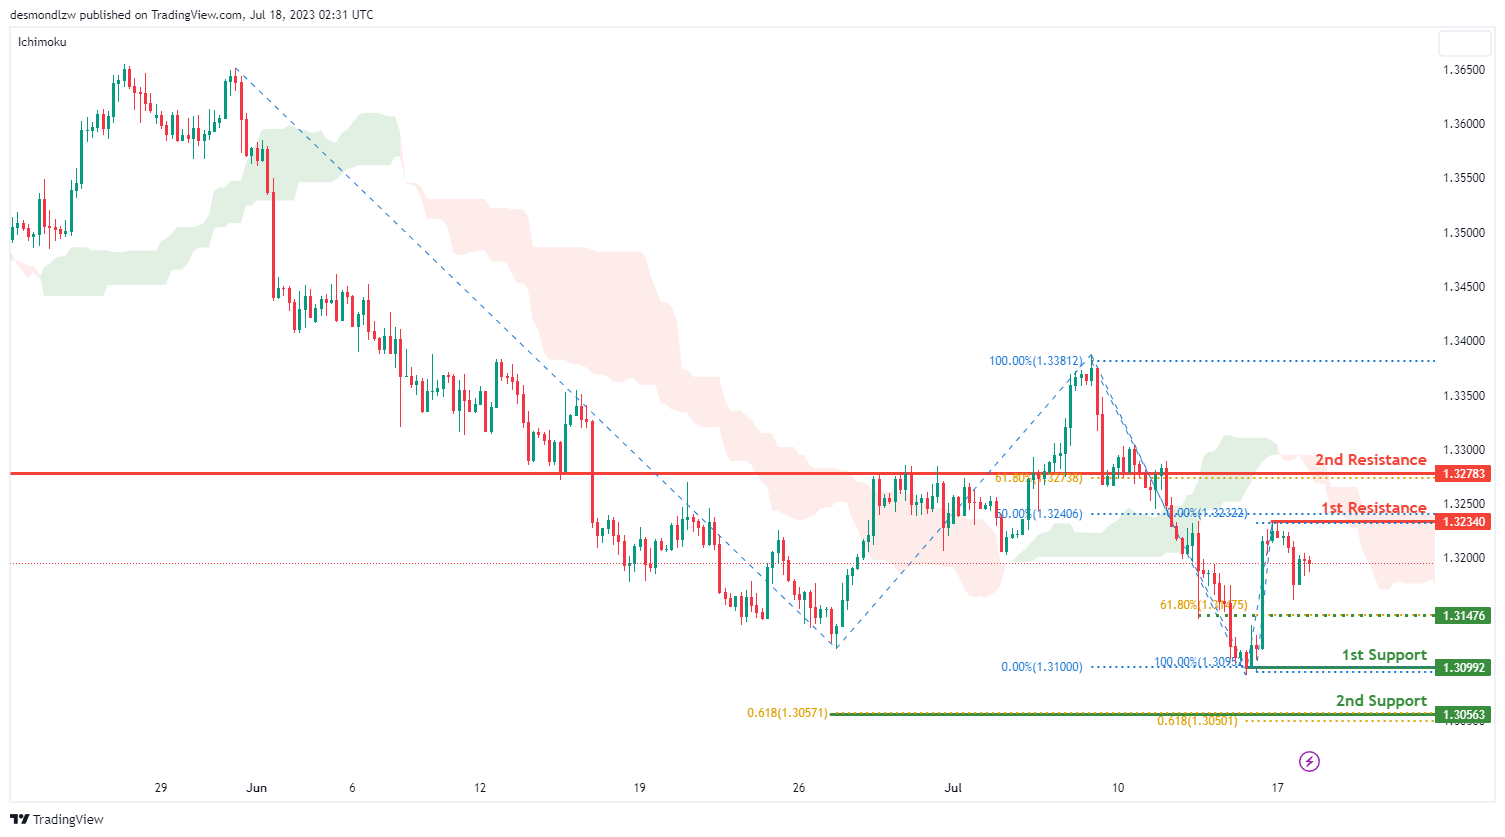
USD/CAD is currently showing a bearish momentum as the price is below the bearish Ichimoku cloud. This indicates that the price could potentially continue its bearish momentum towards the 1st support level.
The 1st support level is at 1.3099, identified as a swing low support level. In addition, there is also an intermediate support level at 1.3148 that coincides with the 61.8% Fibonacci retracement level. If the price goes beyond this point, the next level to watch would be the 2nd support at 1.3056, which is a pullback support level and also coincides with two Fibonacci projection levels at 61.80%. This indicates a strong Fibonacci confluence which might work as a strong barrier against further price decline.
On the other hand, if the price reverses its bearish course, it could face resistance at 1.3234, identified as a swing-high resistance level and also coinciding with the 50% Fibonacci retracement level. A further bullish move may encounter the 2nd resistance level at 1.3278, an overlap resistance which aligns with the 61.80% Fibonacci retracement level. These resistance levels could potentially hinder further price progress and trigger a selling response.
AUD/USD:
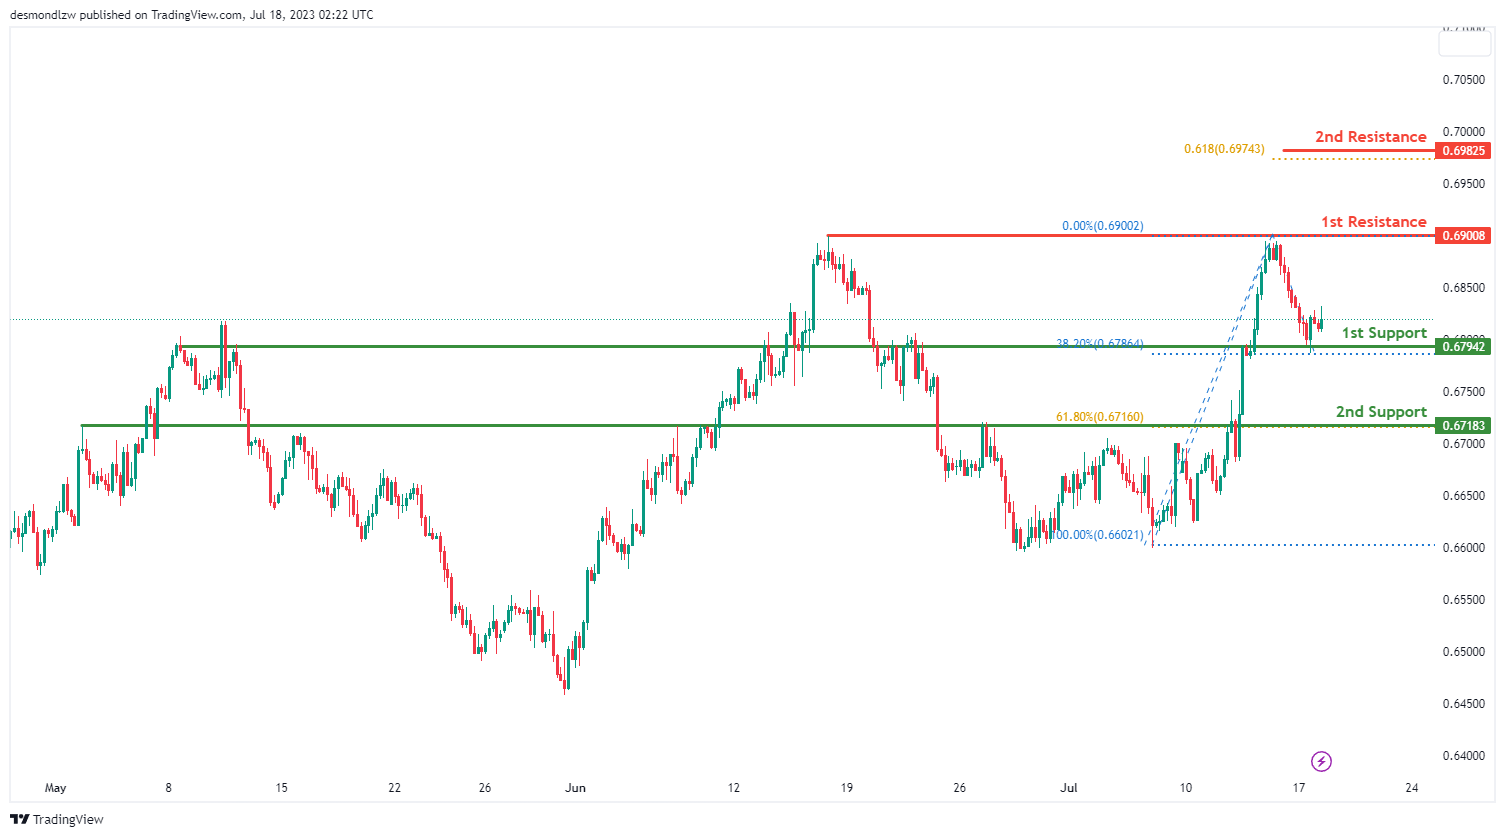
The AUD/USD pair currently shows bullish momentum. In this context, it could potentially make a bullish bounce off the 1st support level and head towards the 1st resistance level.
The 1st support level is located at 0.6794, recognized as an overlap support and coinciding with the 38.20% Fibonacci retracement level. If the price retreats to this level, it could find strong buying interest that could push it higher. Should the 1st support level fail to hold, the price might further decline towards the 2nd support level at 0.6718, which is identified as a pullback support and aligns with the 61.80% Fibonacci retracement level.
On the upside, the 1st resistance level is situated at 0.6900, defined as a multi-swing high resistance. This level might act as a hurdle where the price could face selling pressure. If the price successfully breaks this resistance, it could aim for the 2nd resistance level at 0.6982, also a significant level as per the 61.80% Fibonacci projection.
NZD/USD
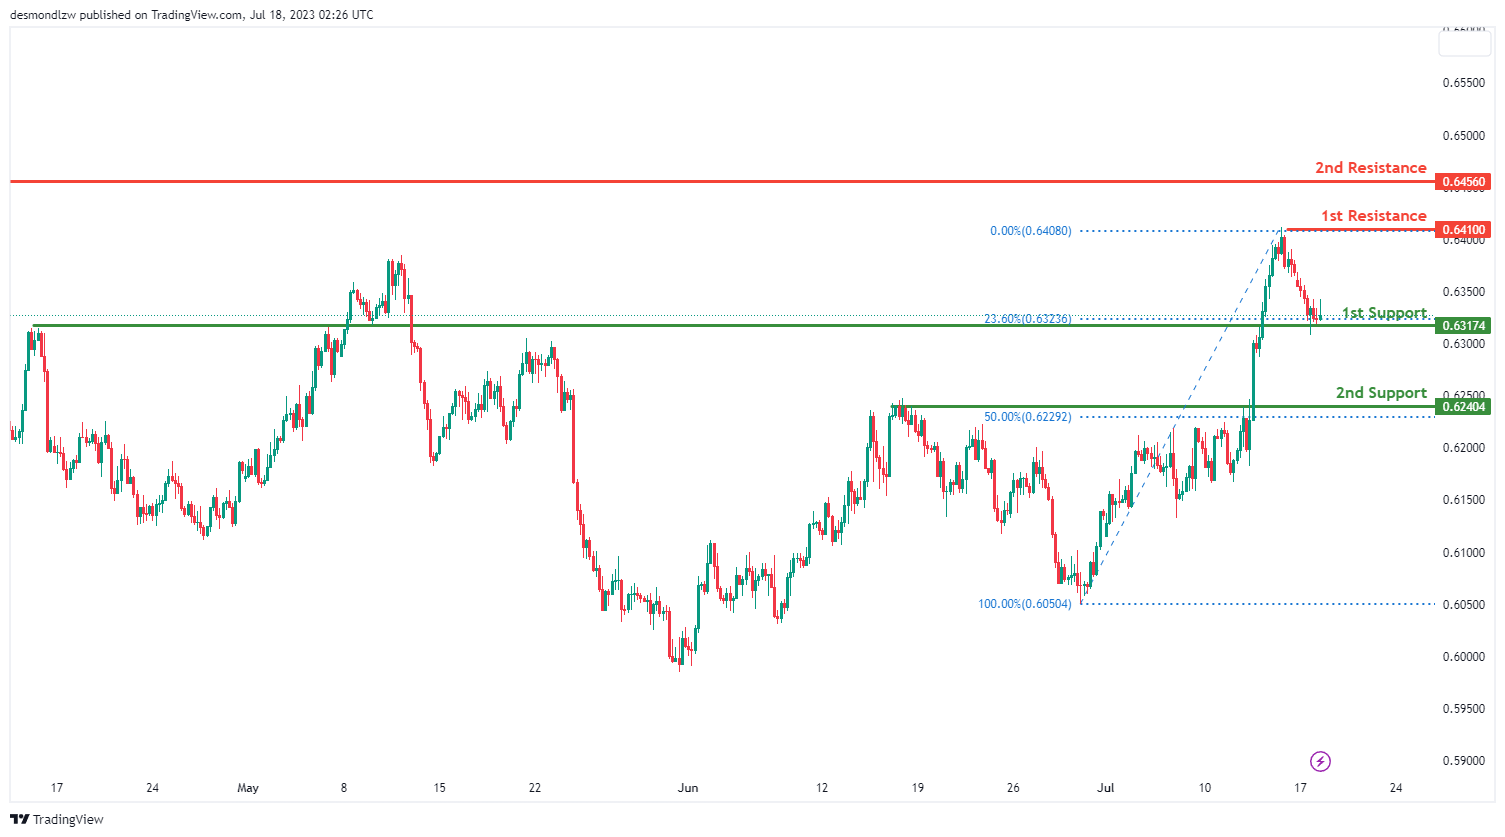
The NZD/USD pair is currently showcasing bullish momentum. Given this context, it could potentially make a bullish bounce off the 1st support level and proceed towards the 1st resistance level.
The 1st support level is at 0.6317, identified as an overlap support and coinciding with the 38.20% Fibonacci retracement level. If the price retraces to this level, it may encounter significant buying interest that could push it upwards. Should the 1st support fail to hold, the price may further decline towards the 2nd support level at 0.6240. This level is recognized as a pullback support and aligns with the 50% Fibonacci retracement level.
On the upside, the 1st resistance level stands at 0.6410, characterized by swing high resistance. This level might act as a hurdle, triggering some selling pressure. If the price successfully surmounts this resistance, it could then aim for the 2nd resistance level at 0.6456, known as a pullback resistance.
DJ30:
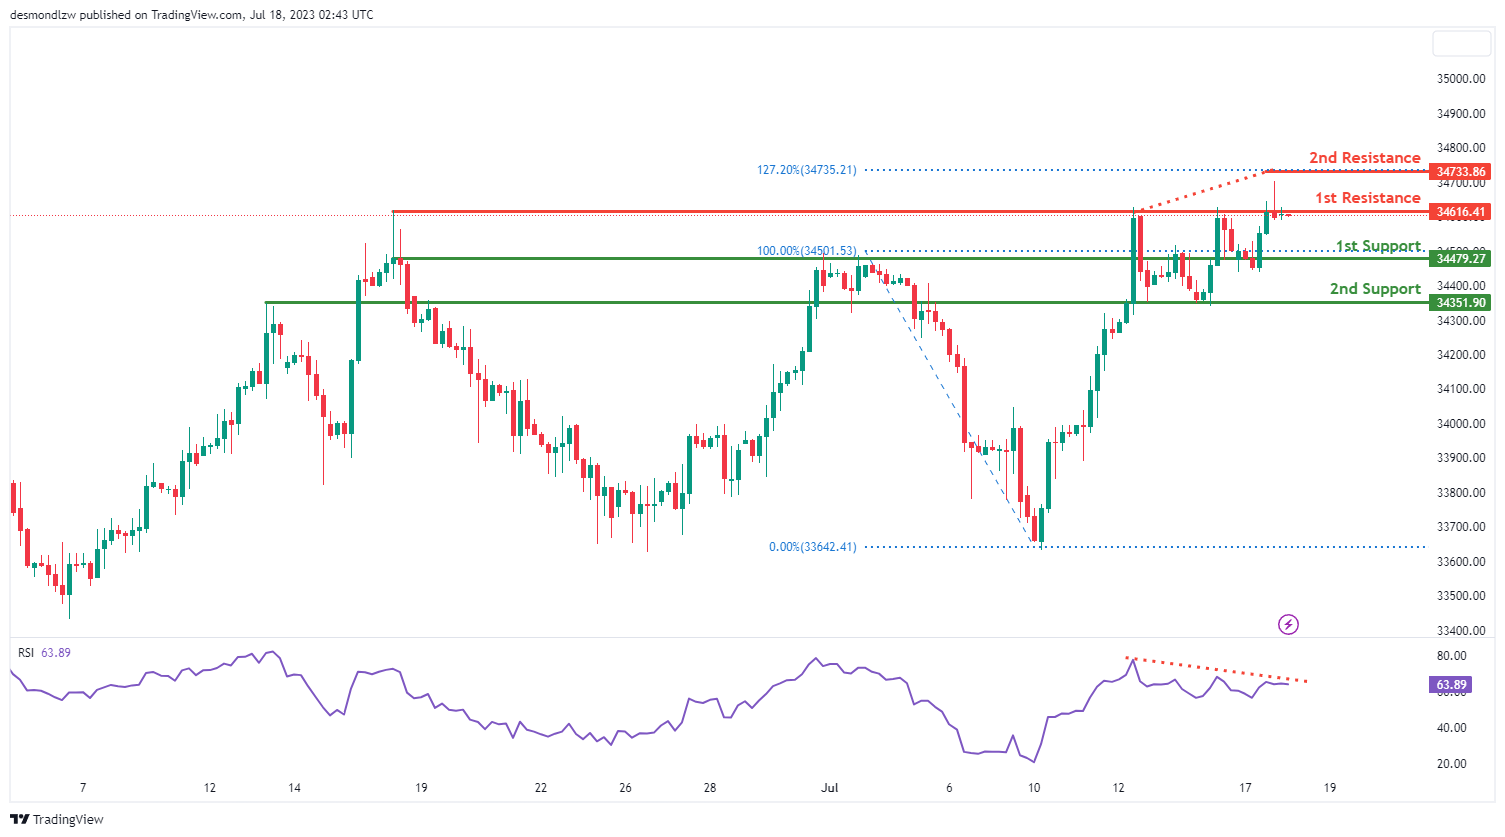
The DJ30, or Dow Jones Industrial Average, is currently experiencing a bearish momentum. Based on the chart analysis, there is a potential for a bearish reaction off the first resistance level, leading to a drop towards the first support level.
The first support level at 34479.27 is considered good as it provides pullback support and aligns with the 38.20% Fibonacci retracement level. The second support at 34351.90 is identified as an overlap support level.
On the upside, the first resistance level at 34616.41 is seen as a multi-swing high resistance. The second resistance at 34733.86 corresponds to the 127.20% Fibonacci extension level.
Additionally, the Relative Strength Index (RSI) is displaying bearish divergence versus price, suggesting that a reversal might occur soon.
GER30:
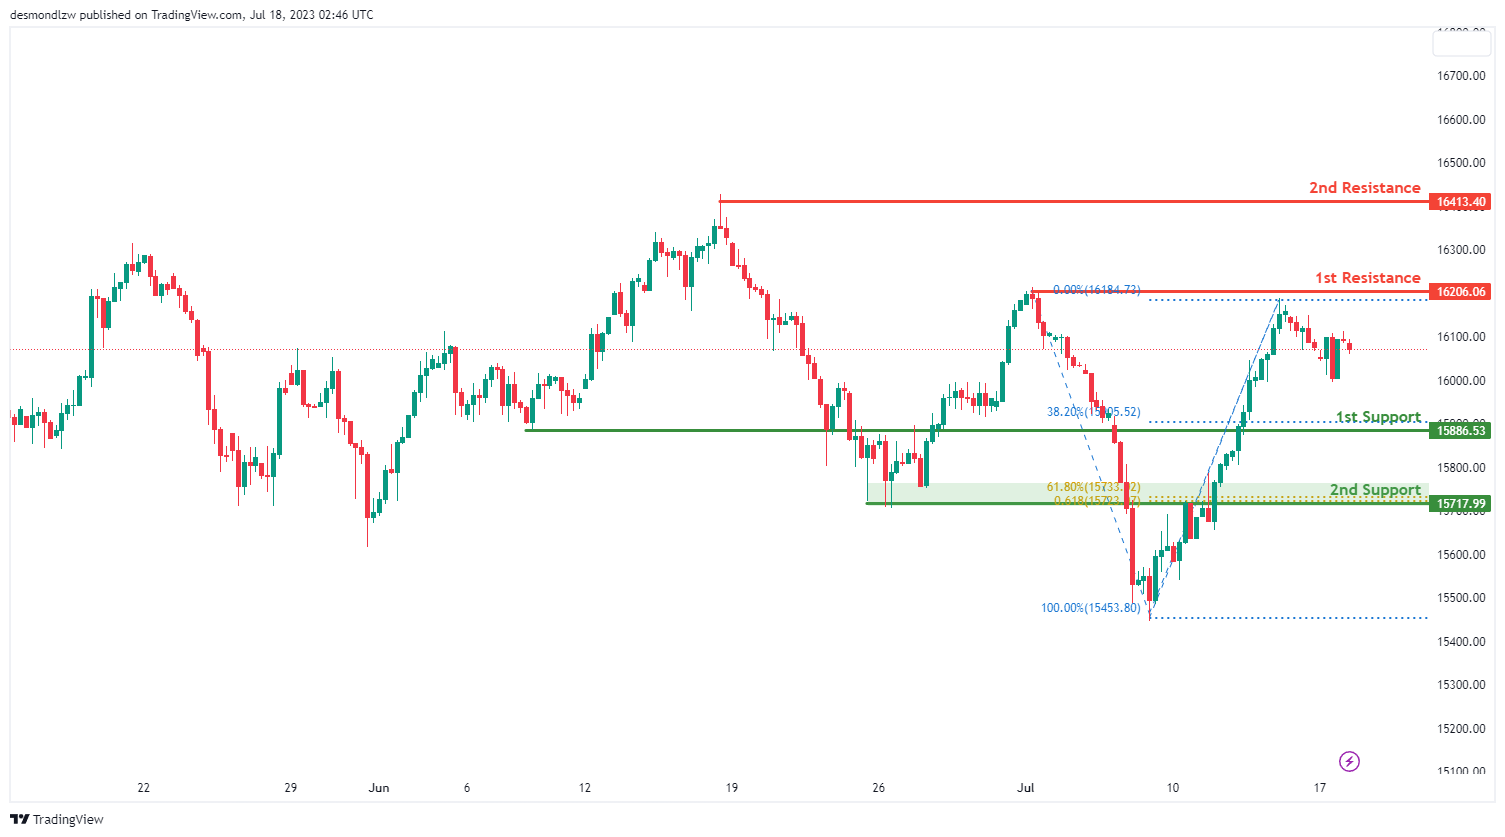
The GER30 (DAX) instrument is currently experiencing a neutral momentum, indicating a lack of clear directional bias in the chart.
Based on the analysis, there is a potential for price to fluctuate between the first resistance and first support levels.
The first support level at 15886.53 is considered good as it provides pullback support and aligns with the 38.20% Fibonacci retracement level. The second support at 15717.99 is identified as an overlap support, which also coincides with the 61.80% Fibonacci retracement and projection levels, indicating Fibonacci confluence.
On the upside, the first resistance level at 16206.06 is seen as a multi-swing high resistance. The second resistance at 16413.40 corresponds to a swing high resistance level.
US500
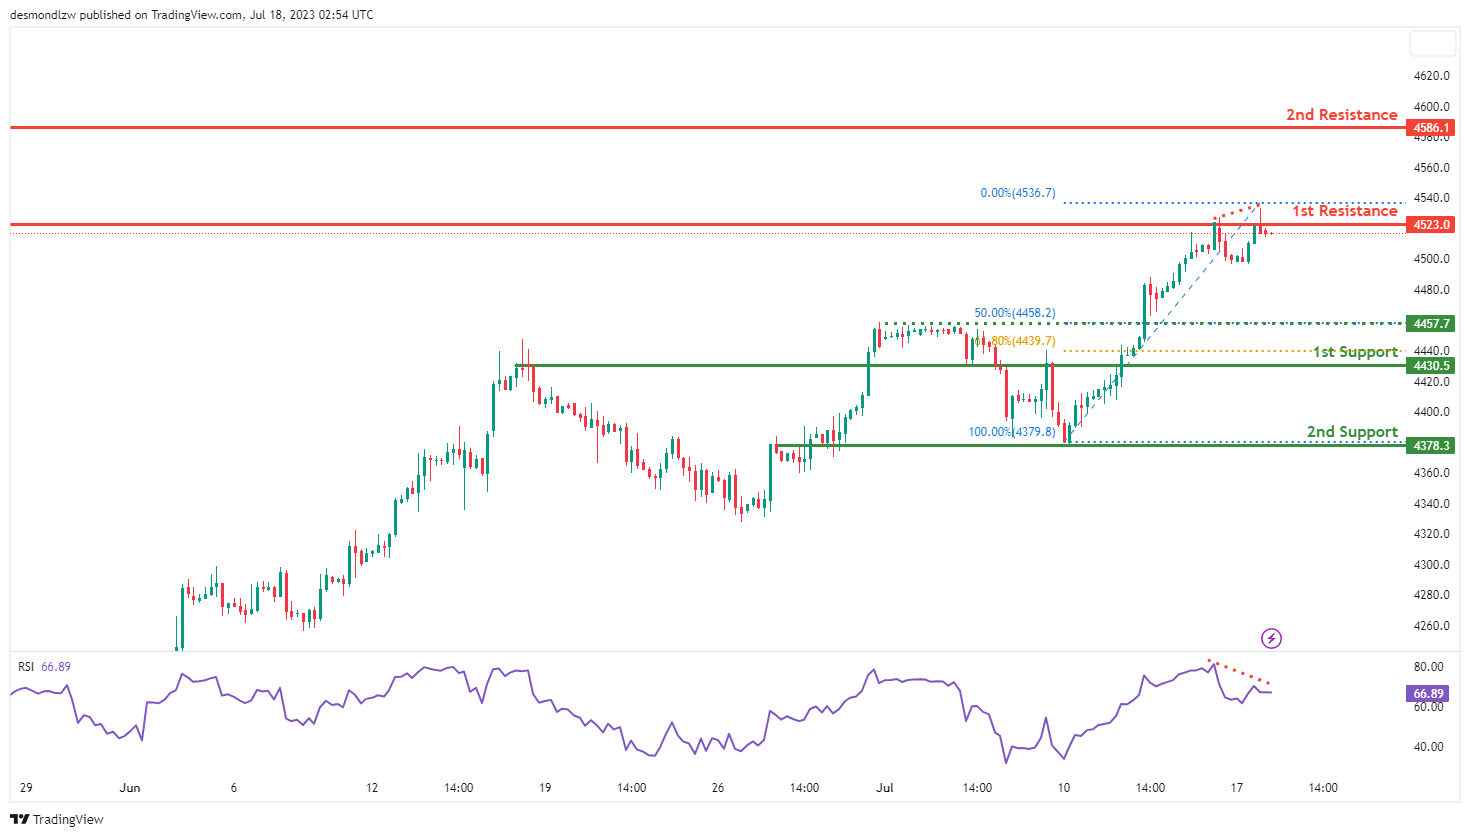
The US500 (S&P 500) instrument is currently experiencing a bearish momentum, indicating a downward bias in the chart.
Based on the analysis, there is a potential for price to have a bearish reaction off the first resistance level and drop towards the first support level. The first support level at 4430.5 is considered good as it aligns with an overlap support and coincides with the 61.80% Fibonacci retracement level. The second support at 4378.3 is identified as an overlap support.
On the upside, the first resistance level at 4523.0 is seen as a multi-swing high resistance. The second resistance at 4586.1 corresponds to a swing high resistance level.
Additionally, the RSI indicator is displaying bearish divergence versus price, suggesting that a reversal might occur soon. This could further support the bearish scenario.
BTC/USD:
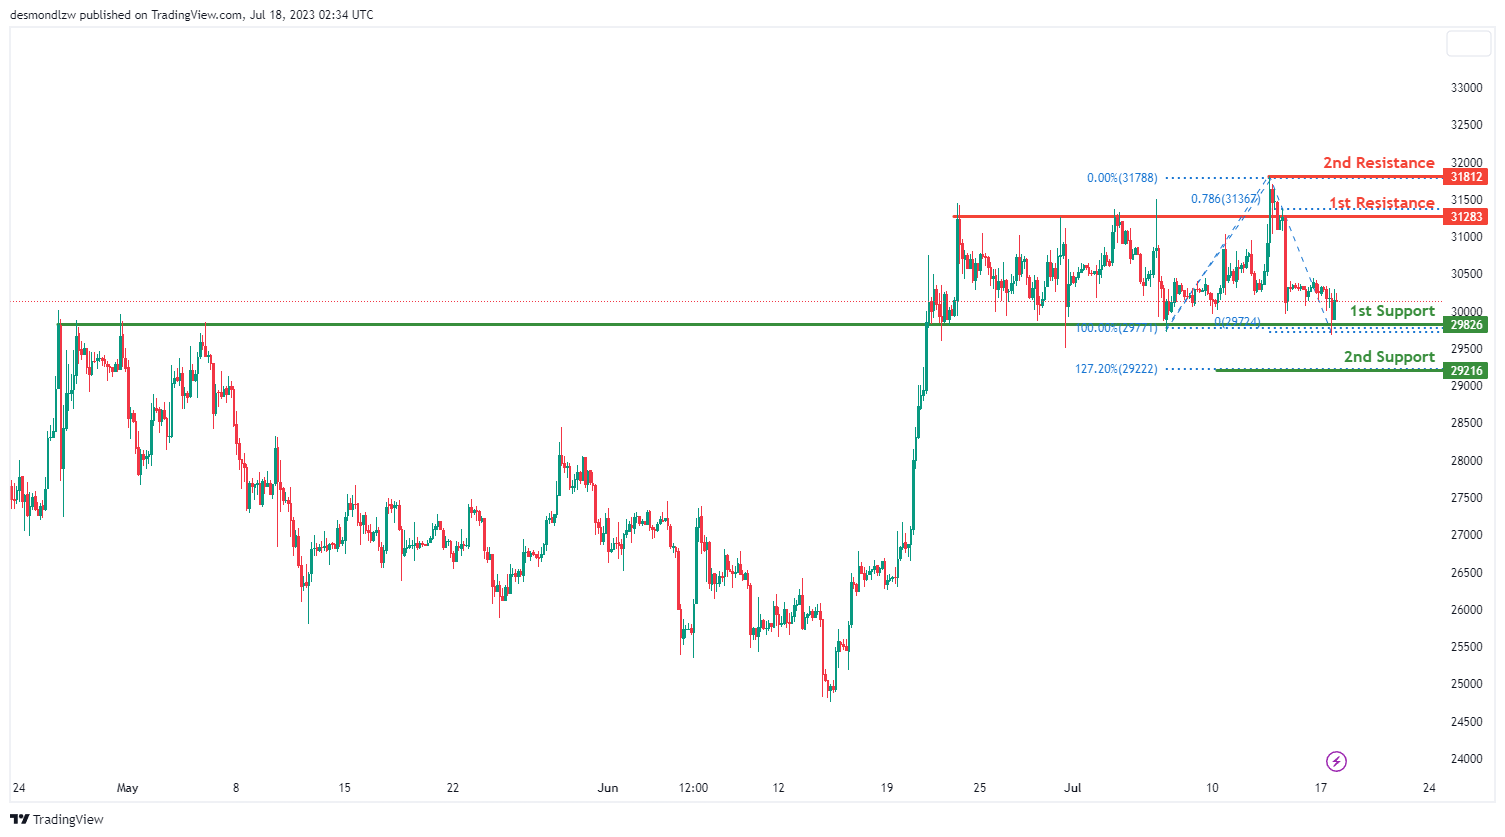
For the BTC/USD instrument, the overall momentum of the chart is currently neutral, which suggests that the price could potentially fluctuate between the 1st resistance and 1st support level.
The 1st support level is at 29826, identified by overlap support. If this support level fails to hold, the price could potentially drop to the 2nd support level at 29216, which is at the 127% Fibonacci retracement level. These support levels are critical areas where buying interest could outweigh selling pressure and lead to a price rebound.
On the other hand, if the price starts to rise, it could face resistance at 31283. This level is identified as an overlap resistance and a 78.6% Fibonacci projection. Further above, the 2nd resistance level is at 31812, which is a swing high resistance level, could also act as a strong barrier for upward price movement and potentially trigger a selling response.
ETH/USD:
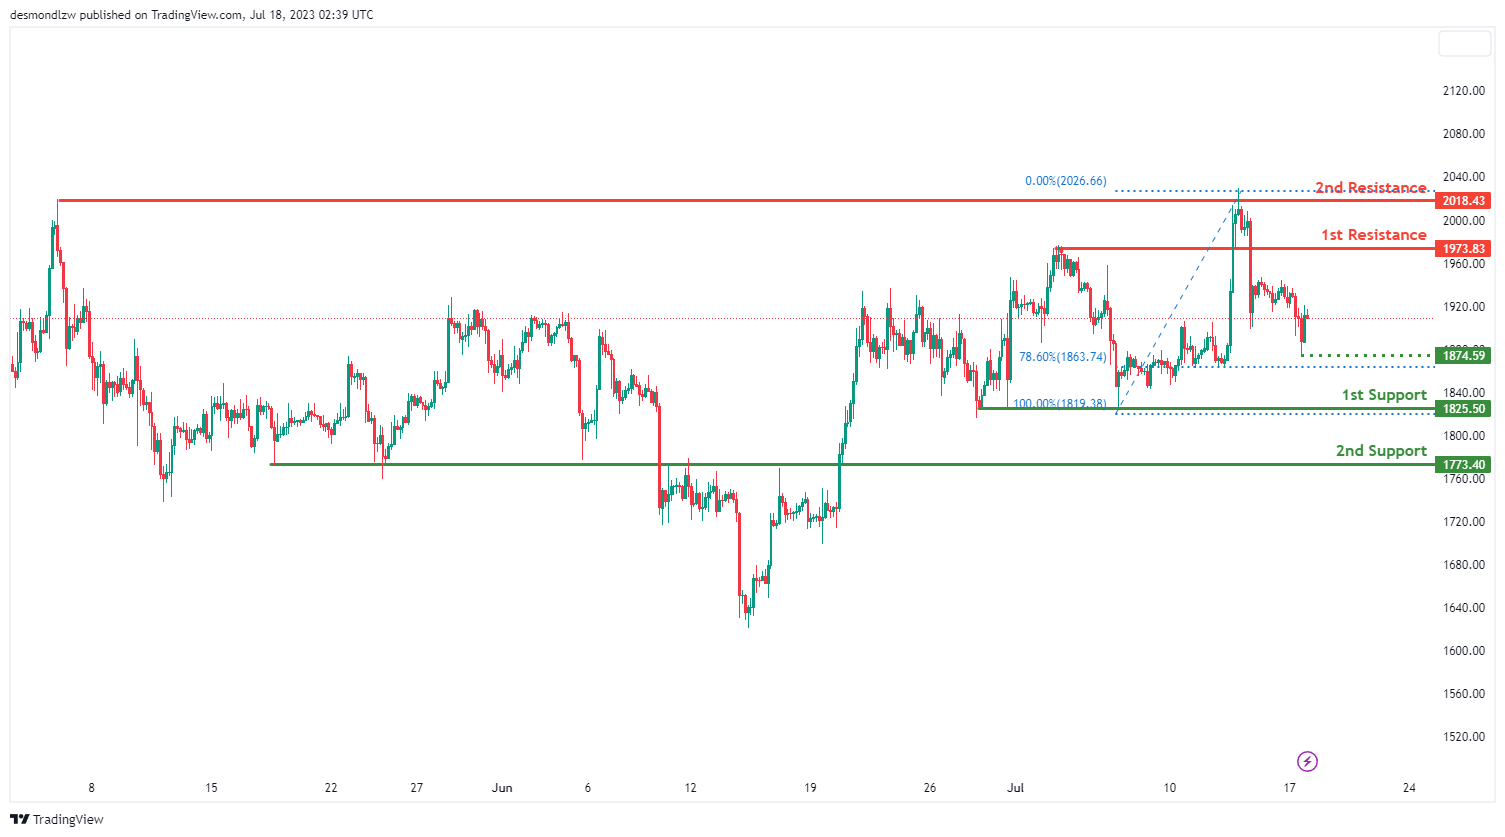
The ETH/USD instrument is currently exhibiting a neutral overall momentum. Based on the chart analysis, there is a potential for price to fluctuate between the first resistance and first support levels.
The first support level at 1825.50 is considered strong due to its status as a multi-swing low support. Additionally, the second support level at 1773.40 is identified as an overlap support.
On the other hand, the first resistance at 1973.83 is seen as an overlap resistance, indicating a potential barrier to further upward movement. The second resistance at 2018.43 is identified as a multi-swing high resistance.
There is also an intermediate support level at 1874.59, which is noteworthy as a swing low support and coincides with the 78.60% Fibonacci retracement level.
WTI/USD:
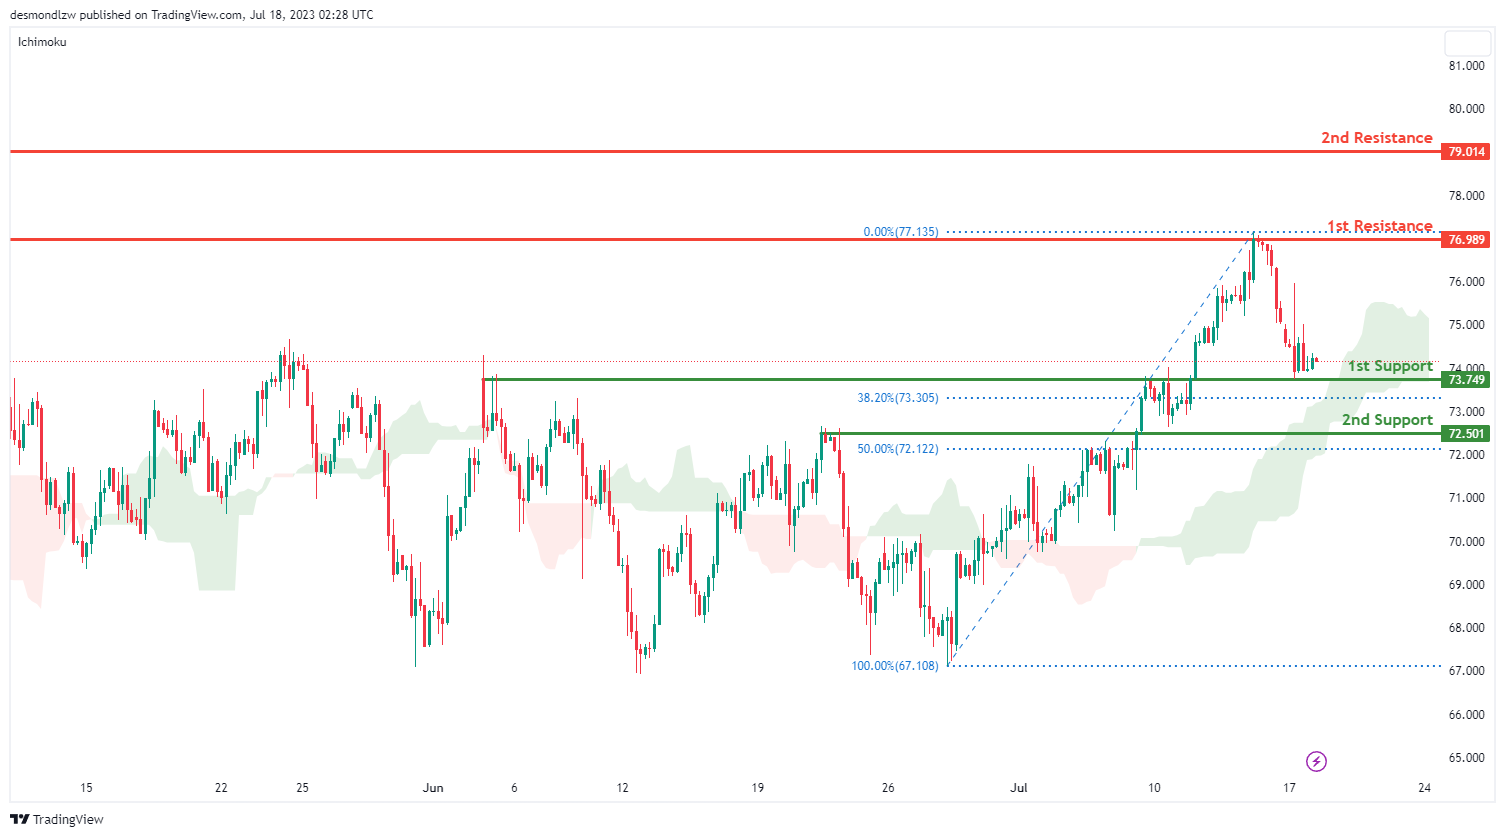
The WTI/USD pair is currently displaying a bullish momentum, despite being above the bullish Ichimoku cloud. In light of this, the price could potentially make a bullish bounce off the 1st support level and progress towards the 1st resistance level.
The 1st support level is situated at $73.75, recognized as an overlap support, and coincides with the 38.20% Fibonacci retracement level. If this level fails to hold the price, it could potentially decline towards the 2nd support level at $72.50. This level is also noted as an overlap support, and it aligns with the 50% Fibonacci retracement level.
On the flip side, if the price maintains its bullish trajectory, it could encounter resistance at $76.99. This level is marked as overlap resistance and could act as a barrier to the price’s upward progression. If the price manages to breach this resistance, it could then aim for the 2nd resistance level at $79.01, which is similarly recognized as overlap resistance.
XAU/USD (GOLD):
The XAU/USD pair, also known as gold, is currently showing neutral momentum, which indicates the price could potentially fluctuate between the 1st resistance and 1st support level.
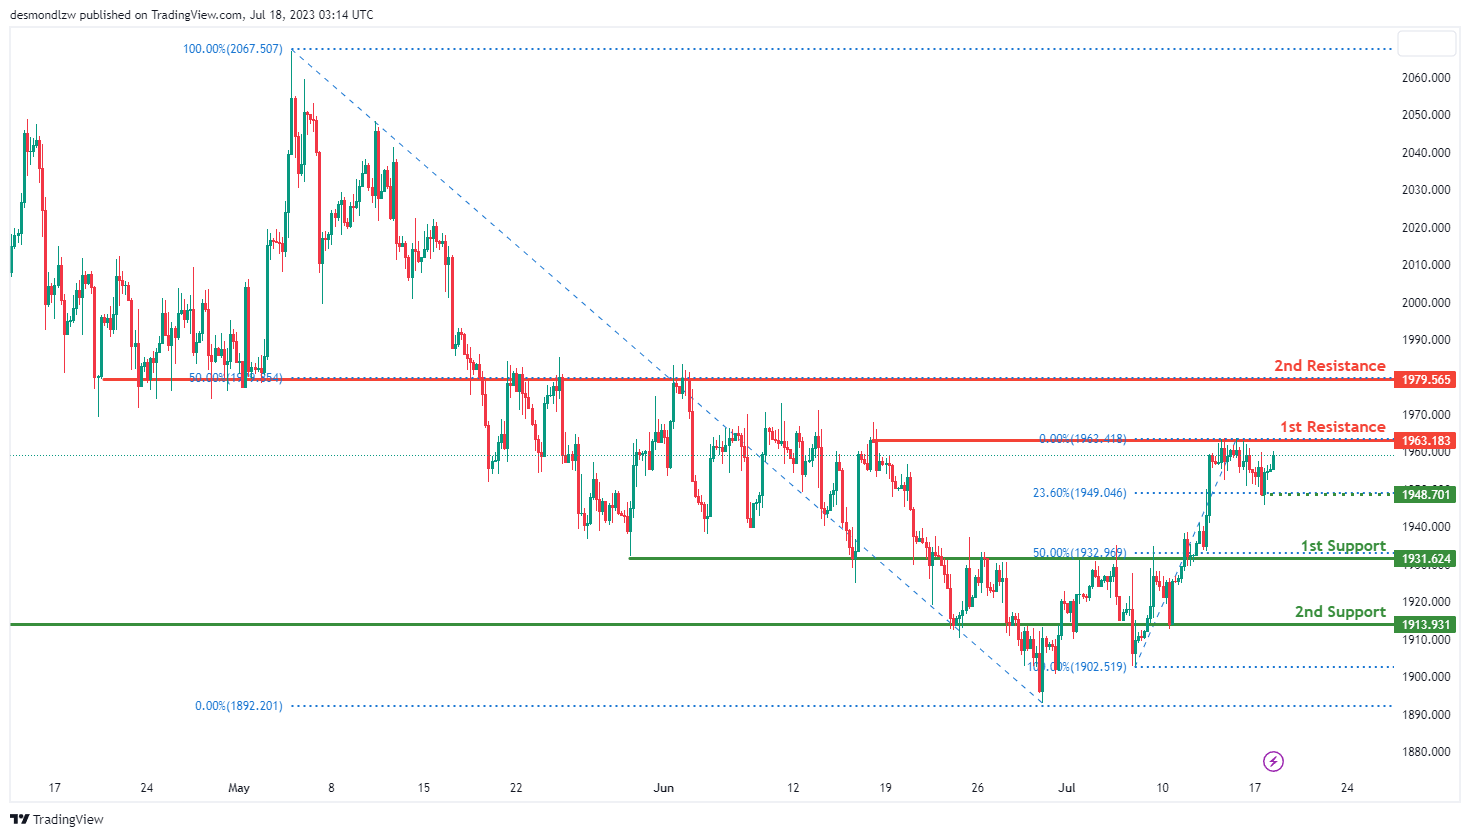
The 1st support level is identified at 1931.62, known as an overlap support and aligning with the 50% Fibonacci projection level. This could be a level at which buying interest may potentially outweigh selling interest, leading to a possible price rebound. If the price breaks this level, it could drop further to the 2nd support level at 1913.93, also identified as an overlap support.
On the upside, the 1st resistance level is positioned at 1963.18, a level defined by the multi-swing high resistance. If the price manages to break this resistance, it could climb towards the 2nd resistance level at 1979.56, which is known as an overlap resistance. These resistance levels may act as barriers where the price could meet selling interest.
In between these levels, there’s an intermediate support level at 1948.70, recognized as a pullback support and coinciding with the 23.60% Fibonacci retracement.