Sample Category Title
NZDUSD Wave Analysis
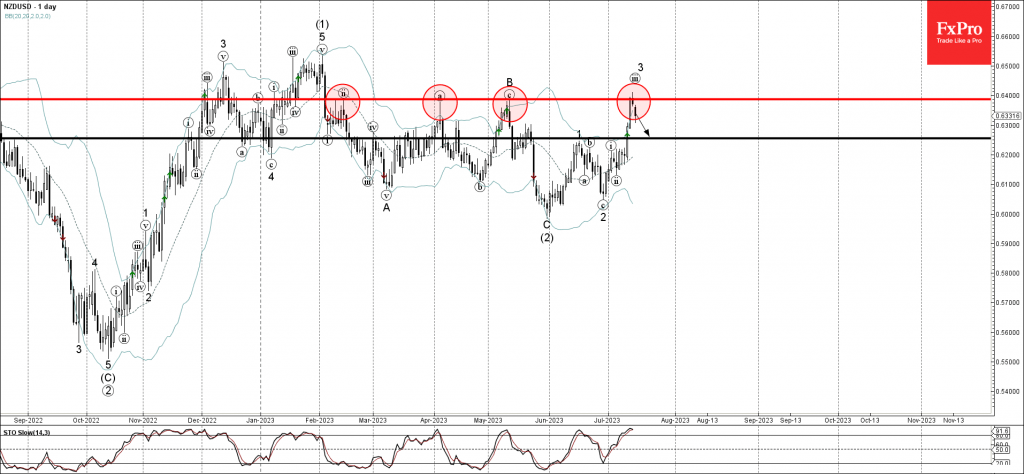
- NZDUSD reversed from resistance level 0.6400
- Likely to fall to support level 0.6255
NZDUSD recently reversed down from the major resistance level 0.6400 (which has been reversing the price from last February).
The downward reversal from the resistance level 0.6400 stopped the previous impulse waves (iii) and 3.
Given the strength of the resistance level 0.6400 and the overbought daily Stochastic, NZDUSD can be expected to fall further toward the next support level 0.6255, previous monthly high from June.
Gold – Edges Lower after Failing at $1,960 But Recovery Over?
- Gold pares gains after post-inflation bounce
- US yields remain lower, pulling the dollar down with them
- Resistance levels remain above at key Fibonacci levels
Gold has rotated lower over the last couple of days after previously recovering on the back of encouraging US inflation data.
The decline in US yields that we’ve seen since the release has weighed heavily on the US dollar and given the yellow metal a real boost after having endured a pretty torrid May and June.
Is the recovery sustainable?
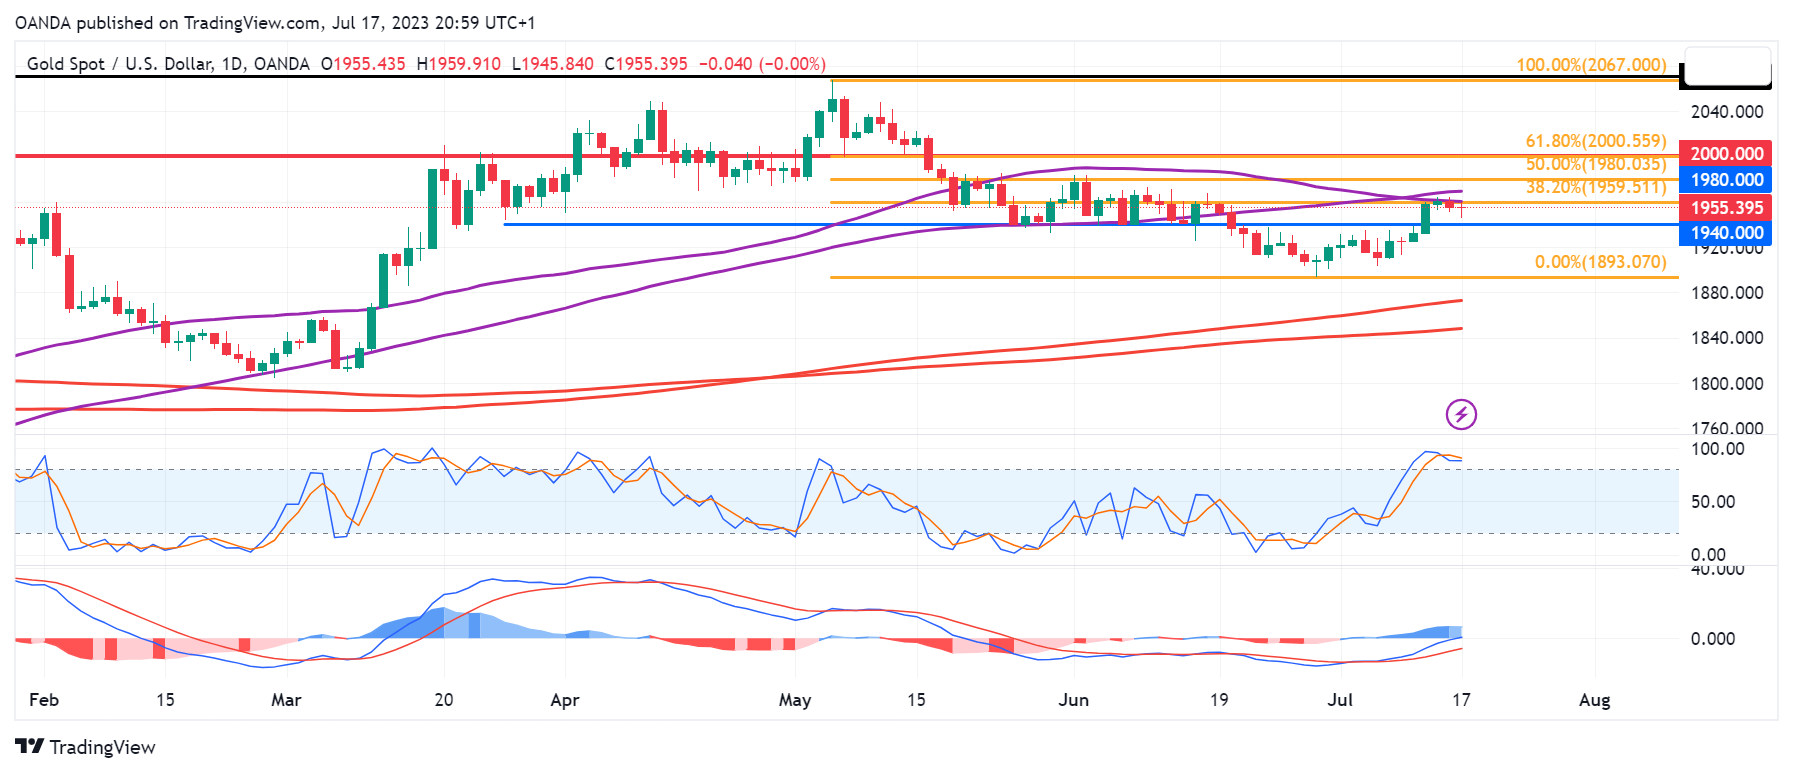
The rotation occurred around $1,960 which was the first notable test of resistance after breaking above $1,940 earlier in the week.
XAUUSD Daily
Source – OANDA on Trading View
It falls around the 38.2% Fibonacci retracement level – May highs to June lows – and now the focus will be on whether that prior resistance level – $1,940 – turns into support.
Confirmation of the breakout – which may come from the price now finding support at $1,940 as it was previously resistance – could be bullish although there remains plenty of resistance ahead.
If the price does trend higher from here, the next tests of resistance could come around $1,980 and $2,000 which are the 50% and 61.8% Fibonacci retracement levels of the above move, respectively. The latter is also a major psychological level.
Brent Failed to Rise Despite Improved Sentiment
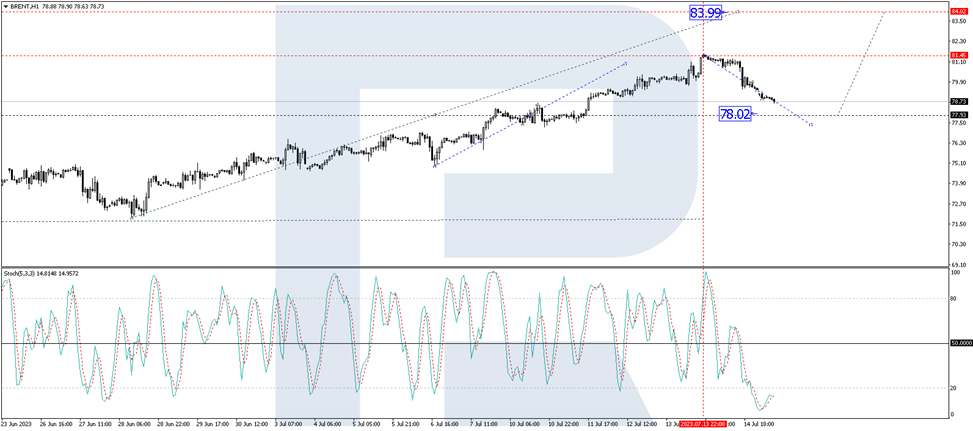
Crude oil prices have paused in their rally. Brent quotes on Monday dropped to 79.20 USD per barrel.
One of the reasons for this local decline might be the market decision to lock in a part of the profit after the steady growth earlier. This version is also supported by the fact that today is the first work day after the weekend.
At the same time, the commodity market sentiment improved noticeably over the last week. Large investment houses still expect a shortage in crude oil supply in the second half of this year, which looks like a favourable factor, keeping in mind the current demand parameters.
The buyers are equally supported by the fundamental background. The geopolitical situation in Libya is unstable, which might lead to problems with the supply of energy carriers.
Technical analysis of Brent:
On the H4 Brent chart, the structure of the third wave of growth is developing. At a certain point, the quotes rose to 78.00. A consolidation range formed around this level, the price broke it upwards and extended to 81.45. Today the market is correcting this growth. A technical return to 78.00 is expected with a test of this level from above. Next, a rise to 84.00 is to follow. This is a local target. After the quotes reach this level, a new correction to 78.00 could develop, followed by an increase to 85.00. This is the first target. Technically, this scenario is confirmed by the MACD: its signal line is at the highs, moving out of the histogram area, which is a signal in favour of a decline to zero.
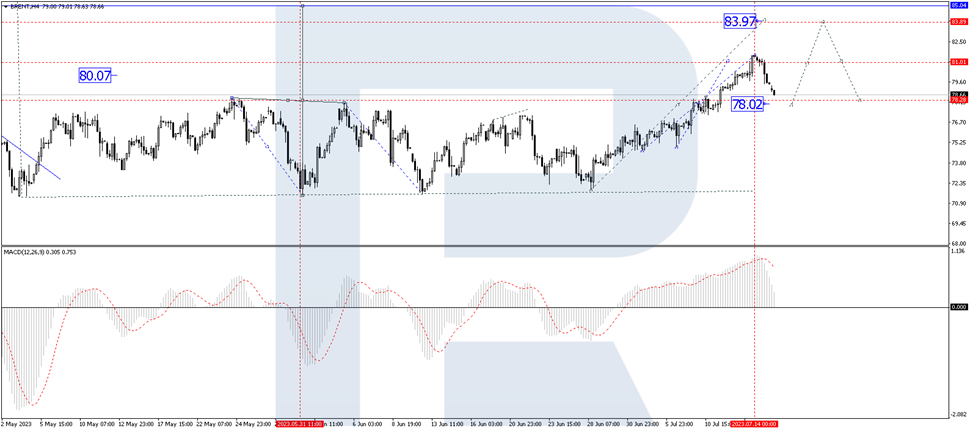
On the H1 Brent chart, a corrective wave to 78.00 is developing. After it is over, a wave of growth to 84.00 is expected to start. This is a local target. Technically, this scenario is confirmed by the Stochastic oscillator: its signal line is under 20, ready to go on growing to 50. And if this level also breaks, the potential for a rise to 80 could open.
AUD/USD Edges Lower ahead of RBA Minutes, Lowe is Out
- Australian dollar soared over 2% last week
- RBA minutes to be released on Tuesday
- RBA Governor Lowe will be replaced by Michelle Bullock
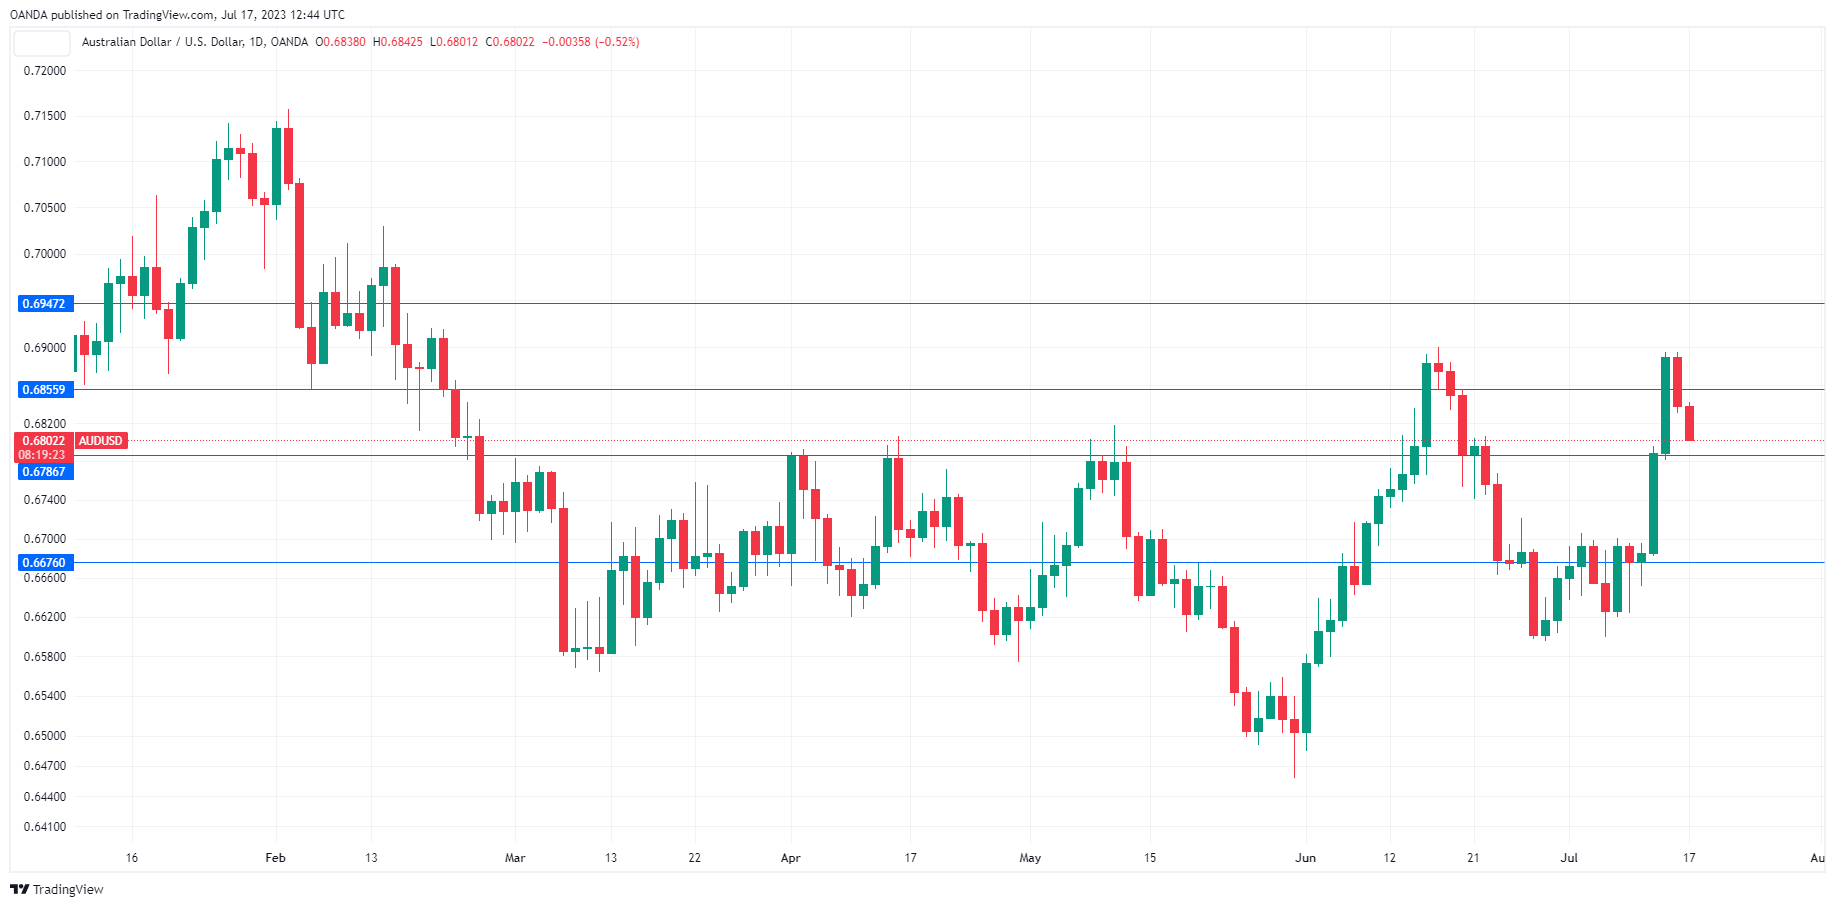
The Australian dollar has started the week in negative territory. In the European session, AUD/USD is trading at 0.6816, down 0.32%. The Aussie is coming off a banner week, with gains of 2.18% against the US dollar.
Has RBA hit the terminal rate?
The Reserve Bank of Australia releases the minutes of the July 4th meeting on Tuesday. At that meeting, the RBA took a pause and maintained the cash rate at 4.10%. The burning question is whether interest rate levels have peaked. The markets are more confident that the RBA is leaning towards another pause in August, with a 75% probability of a 25-bp hike in August, compared to 48% just a week ago.
The RBA has based its rate decisions on key economic data, in particular, inflation and employment reports. Thursday’s employment report will be a key factor in the RBA rate decision. If the employment numbers are stronger than expected, we’ll likely see the markets revise higher the probability of a rate hike in August.
There was a feeling in the air that RBA Governor Lowe would be shown the front door, and the axe came down on Friday. Lowe has been heavily criticised for assurances he made as late as November 2021 that he would not raise rates until 2024, only to embark on an aggressive rate-hike campaign soon after.
The RBA’s zig-zagging of rate hikes and pauses hurt the central bank’s credibility, and a recent review of the RBA found that major structural changes were needed. Add a 7% inflation level to the mix, and it’s not difficult to see why the government decided that a change was needed at the helm of the RBA.
AUD/USD Technical
- There is resistance at 0.6855 and 0.6947
- 0.6786 and 0.6676 are providing support
July Flashlight for the FOMC Blackout Period
Summary
- The FOMC kept the fed funds rate unchanged in June, but the post-meeting statement said that the Committee would take into account "economic and financial developments" when "determining the extent to which additional policy firming may be appropriate."
- In our view, recent "economic and financial developments" will lead the FOMC to raise its target range for the federal funds rate by 25 bps on July 26.
- For starters, the employment reports for May and June, which were released since the FOMC last raised rates on May 3, showed that while job growth is slowing, the labor market remains tight and is helping to keep inflation above the Committee's 2% target.
- Inflation slowed in June, including the smallest monthly gain in the core CPI since 2021. However, with price growth running well-above target for about two years now, we believe participants will want to be more confident that inflation is on a sustainable downward path before ending the FOMC's tightening cycle.
- Furthermore, written and verbal communication by Fed officials since the last FOMC meeting suggest that further tightening likely lies in store. The "dot plot" that was released after the June 14 meeting showed that most members believed that further tightening would be appropriate by the end of this year, and Fed officials have generally sounded hawkish in recent public comments.
- The FOMC could conceivably refrain from hiking its target range by 25 bps on July 26, but we do not believe a consensus currently exists among Committee members for another hold next week. A far more likely way to reach consensus, in our view, would be via a 25 bps rate hike with indications in the post-meeting statement that the FOMC is prepared to hike further, if "economic and financial developments" warrant.
- We do not expect the FOMC to make any technical tweaks to the interest rate it pays on reserve balances that banks hold at the central bank, nor to its repo and reverse repo rates.
Recent Data Support the Case for Another Rate Hike
The Federal Open Market Committee (FOMC) has raised its target range for the federal funds rate by 500 bps since March 2022. The rapid pace of tightening last year, which transpired as inflation was shooting higher, was meant to quickly turn the stance of monetary policy from accommodative to restrictive. The Committee has slowed the pace of tightening this year as economic activity has decelerated and inflation has receded. In the statement that was released following the policy meeting on May 3, at which the FOMC hiked rates by 25 bps, and again on June 14, when it kept rates unchanged, the Committee said it would take into account "economic and financial developments" when "determining the extent to which additional policy firming may be appropriate."
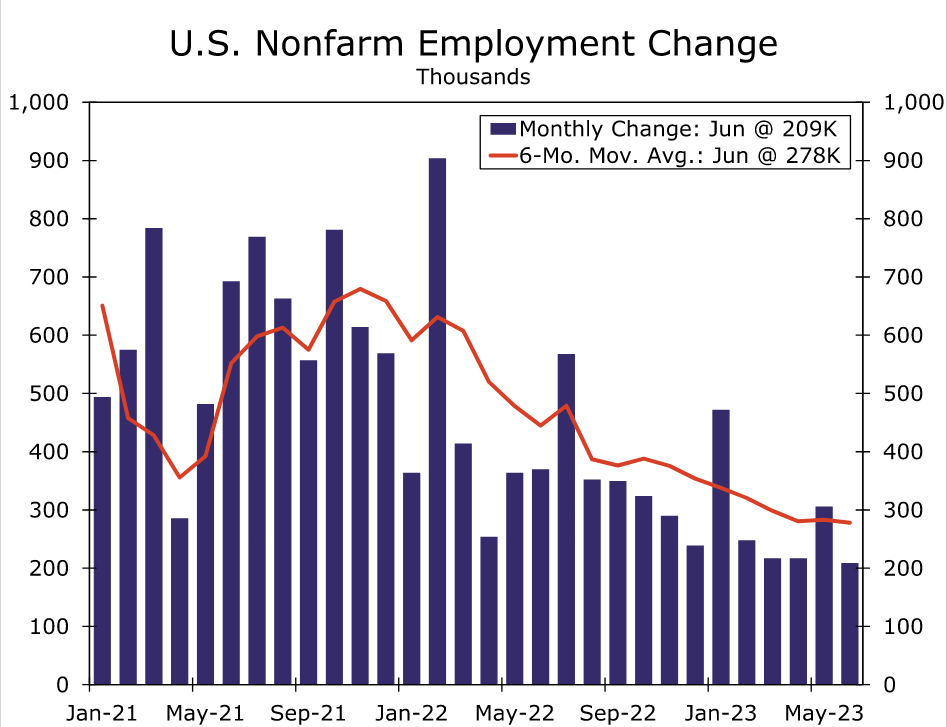
In that regard, recent data suggest that more "policy firming" may indeed "be appropriate." For starters, the U.S. economy added 209K jobs in June (Figure 1). Although the monthly addition to payrolls in June was the smallest since December 2020, the increase still exceeded the average rise of roughly 185K per month during the 2010-2019 expansion. Only 3.6% of the labor force was unemployed in June, little changed from the cyclical low of 3.4% hit in January and April, and the year-over-year rise in average hourly earnings stayed constant at 4.4% last month. In short, the labor market remains tight, which is helping to keep inflation elevated.
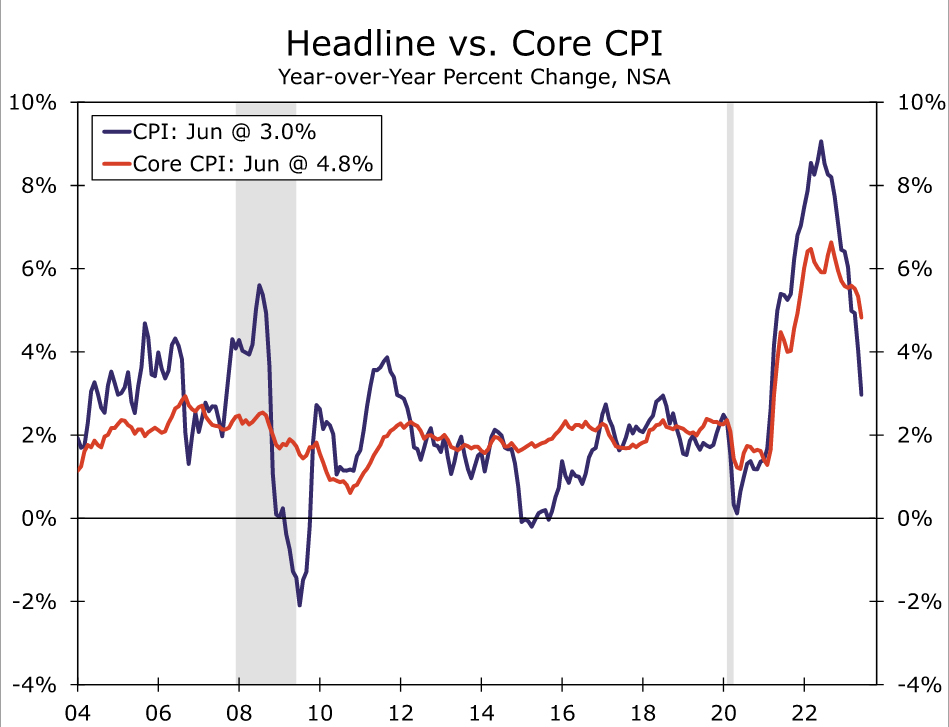
Data released on July 12 showed that consumer prices edged up 0.2% in June relative to the previous month, which caused the year-over-year rate of CPI inflation to drop from 4.0% in May to 3.0% in June (Figure 2). Since peaking at 9.1% in June 2022, the overall rate of CPI inflation has receded by more than six percentage points. While there has been broad-based deceleration in consumer prices over the past year, the 27% drop in the gasoline component of the CPI since June 2022, which has little to do with Fed policy tightening per se, has helped to pull the overall rate of CPI inflation lower over the past year. When looking at the "core" rate of CPI inflation, which excludes prices of food and energy but accounts for 80% of the consumer price index, the FOMC has had less success in bringing inflation lower. The year-over-year rate of core CPI inflation, which rose to a 40-year high of 6.6% last September, has receded to only 4.8%. Moreover, the core CPI in June rose at an annualized rate of 4.1% relative to three months prior (i.e., March). Although down from the comparable three-month rate of change of 5.0% in May, inflation is still running well above the FOMC's 2% target.
Core inflation was initially pushed higher by rapid acceleration in prices of core goods (i.e., prices of goods excluding food and energy). But a rotation of consumer spending away from goods and toward services in conjunction with the healing of supply chains have led to considerable moderation in core goods inflation since early 2022. In June, prices of core goods were up only 1.4% on a year-ago basis. Although the acceleration in prices of core services, which account for nearly 60% of the overall CPI, lagged the moonshot in core goods prices, service sector inflation has been slower to recede. In June, prices of core services were up 6.2% on a year-ago basis.
Because wages and salaries are the largest cost component for most service-providing businesses, a return to an overall inflation rate of 2% will be difficult for the Federal Reserve to achieve as long as the labor market remains excessively tight. At 3.6% currently, the jobless rate is below what most FOMC members estimate it should be in the "longer run" (i.e., after 2025). This long-run estimate of the unemployment rate can be interpreted as a proxy for the "equilibrium" jobless rate, or the so-called non-accelerating inflation rate of unemployment (NAIRU). In order to generate some "slack" in the labor market, the Fed must slow growth in the economy enough to bring labor demand into better balance with labor supply. Interest rate increases affect the economy with long and variable lags, and individual policymakers can disagree about whether more monetary tightening is currently needed to bring the demand for labor in line with the supply of labor. But written and verbal communication by many Fed officials since the last FOMC meeting suggest that further tightening likely lies in store.
Most FOMC Members Seem to Support Further Tightening
For starters, the "dot" plot that was released at the conclusion of the June 14 FOMC meeting showed that 16 of the 18 Committee members deemed that at least 25 bps of further tightening would be appropriate by the end of this year (Figure 3). More recently, Fed officials have sounded hawkish in public commentary. Last week, a number of FOMC members, including Governors Christopher Waller and Michael Barr, Cleveland Fed President Loretta Mester and San Francisco Fed President Mary Daly all indicated their support for further monetary tightening this year. In sum, we think that a 25 bps rate hike on July 26 is highly likely.
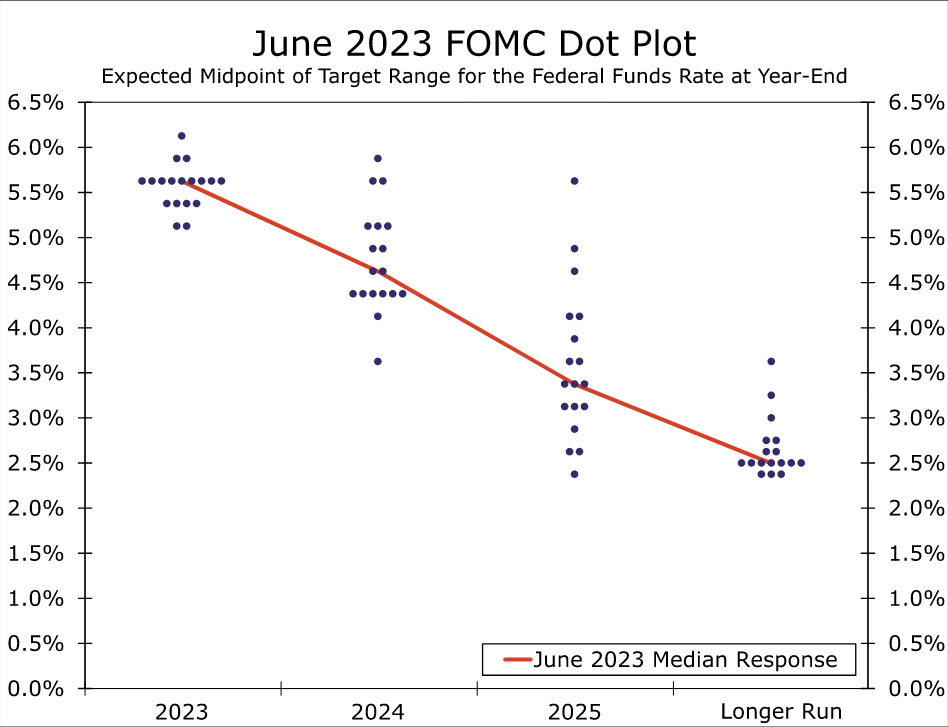
Although the FOMC could conceivably refrain from tightening further on July 26, we think that probability is rather low. As discussed previously, the economy remains resilient and inflation continues to run well above the FOMC's target of 2%. Financial markets are more or less fully priced for a 25 bps rate hike on July 26, and the FOMC has tried to refrain from surprising markets in recent years. Although Fed speakers did not discuss the specific timing of further rate hikes in recent comments, pausing again at this meeting after the Committee decided to keep rates on hold on June 14 does not seem probable to us. The June dot plot indicated that 12 of the 18 FOMC members thought that at least 50 bps of further tightening would be appropriate by the end of the year. This suggests to us that holding policy rates steady for the second consecutive meeting is not the consensus view on the FOMC. Furthermore, a second consecutive "skip" would likely lead markets to discount the possibility of further tightening, leading to an easing in financial conditions.
Likewise, we think the probability of a 50 bps rate hike next week is even less likely than another pause. Payrolls and core consumer prices have decelerated since the FOMC last met in June. Financial markets are not currently priced for a 50 bps rate hike on July 26 and, as noted above, the FOMC tries to refrain from surprising market participants. Furthermore, the FOMC is a consensus-driven body, and we do not believe a consensus currently exists among Committee members for a 50 bps rate hike next week. A far more likely way to reach consensus, in our view, would be via a 25 bps rate hike with indications in the post-meeting statement, supported by comments by Chair Powell in his press conference, that the FOMC is prepared to hike further, if "economic and financial developments" warrant.
We Do Not Expect Any Change in the Pace of QT
Not only has the FOMC been tightening monetary policy via rate hikes since March 2022, but it has also undertaken "quantitative tightening" (QT) since last June. That is, the FOMC is currently allowing up to $60 billion worth of Treasury securities and up to $35 billion worth of mortgage-backed securities (MBS) to roll off the central bank's balance sheet every month. As shown in Figure 4, the size of the Fed's balance sheet peaked at roughly $9 trillion in April 2022 before shrinking to $8.3 trillion in early March of this year. The failures of some regional banks in mid-March caused the balance sheet to spike by approximately $400 billion over the following two weeks as some liquidity-strapped banks tapped the Fed's emergency lending facilities. But as tensions in financial markets have subsided since March, the outstanding stock of emergency loans has trended lower and the size of the Fed's balance sheet has declined to $8.3 trillion.
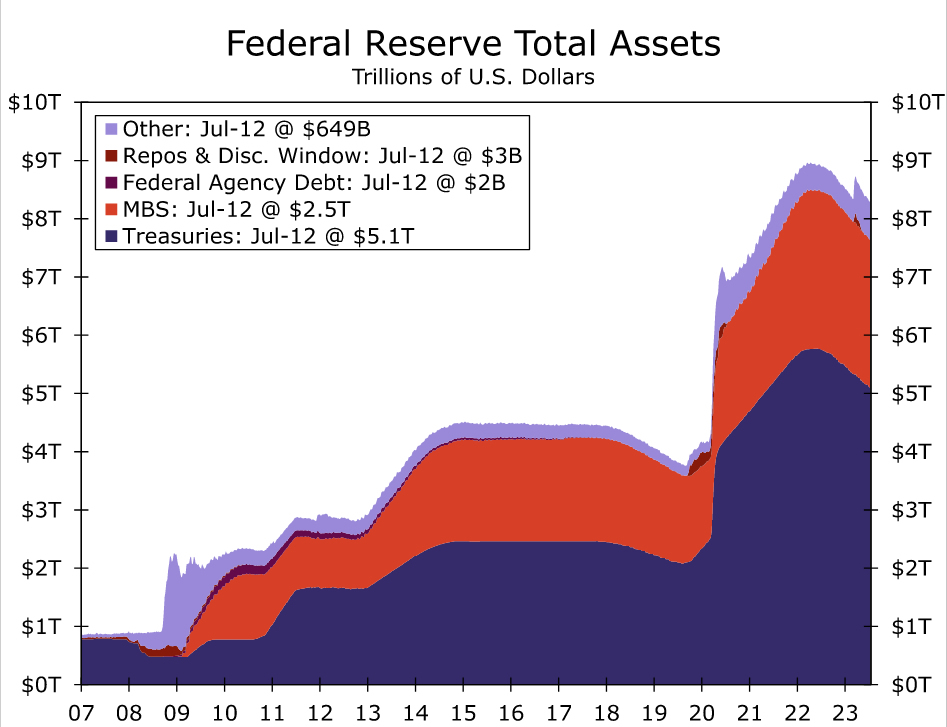
The FOMC held a previously scheduled policy meeting on March 22, less than two weeks after the failures of Silicon Valley Bank and Signature Bank. Despite lingering tensions in financial markets at that time, the FOMC decided on March 22 to maintain the monthly pace of QT at $60 billion of Treasury securities and $35 billion of MBS. With many measures of financial market volatility at low levels and with few signs that banks are experiencing liquidity issues, we look for the FOMC to maintain its current pace of QT at the July 26 meeting. Our expectation regarding the pace of QT was reinforced last week by Minneapolis Fed President Kashkari who said "I think the bar would be quite high in tweaking our path for the balance sheet runoff." Accordingly, we look for the Fed's balance sheet to decline further in the month's ahead and reach roughly $7.7 trillion by year-end.
Additionally, we do not expect the FOMC will make any technical tweaks to the interest rate it pays on reserve balances that banks hold at the central bank, nor to its repo and reverse repo rates. That is, we expect the Committee will lift all three of these rates by 25 bps, in line with the increase in the target range for the federal funds rate.
Inflation to Determine the Size of the Next BoE Rate Hike
The focus this week is on Wednesday’s UK CPI release (06.00 GMT). With the next Bank of England meeting scheduled in two weeks, this report will probably determine the size of the expected rate hike. In the meantime, the pound continues to outperform the euro but a potential downside surprise on Wednesday could really clip its wings.
BoE's inflation problem
Compared to the rest of the central banks rushing to raise rates to squelch the acute inflationary pressure, the BoE opted for a more measured approach. As a result, headline inflation remains the highest in the developed world, failing to record the noteworthy drop seen in other regions over the past few months. Thus, the BoE has decided to act more forcefully as, following the surprise 50 bps rate hike at the June 22 gathering, there are growing expectations for a similarly sized move in two weeks’ time.
The main issue is that the BoE has lost valuable time and these rate hikes are probably coming too late. One of the reasonings behind the BoE's cautious approach may have been the expectation that the US economy would already have entered a recession by now, cooling US inflationary pressures, and also dragging UK inflation lower. This expectation was not confirmed and hence Bailey et al are now “forced” to adopt a more aggressive strategy that is bound to cause further significant damage to the real economy.
The housing sector is expected to really feel the higher interest rates. The BoE’s Credit Conditions Survey found that mortgage defaults in the March-May 2023 period increased to the highest level since 2009 when the subprime-induced recession was ravaging the global economy. This means the peak in defaults has yet to be seen in this cycle, potentially delivering a massive hit on total household wealth amidst the strongest inflation period since the 1970s.
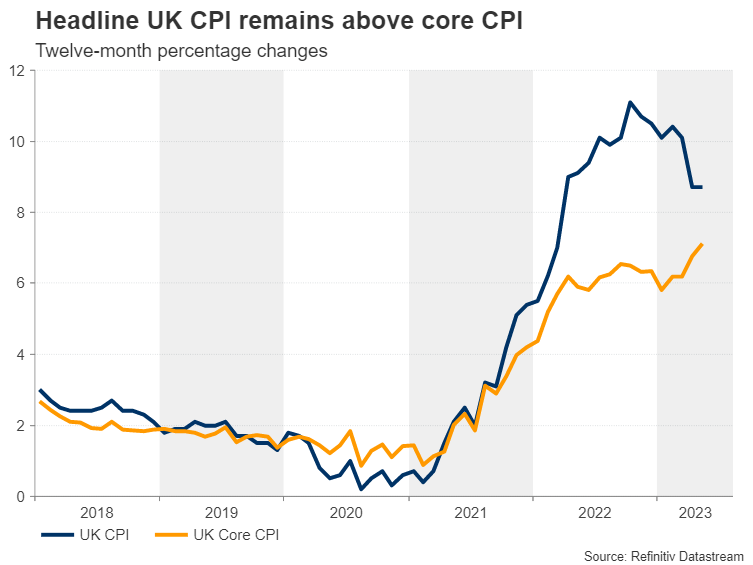
June CPI on Wednesday morning
In this environment, Wednesday’s CPI prints for June are extremely important. The headline figure is expected to edge lower to an 8.2% year-on-year increase from 8.7% in May. If confirmed, this will be the lowest print since April 2022. However, it is still above its core component. This is forecast to remain at the record high of 7.1% YoY, confirming its stubborn nature. While we have seen numerous comments on the ability of core CPI to predict future inflation levels, it is an undeniable fact that the UK continues to experience significant inflationary pressure, well above the levels seen in both the US and the euro area.
In the meantime, there are increasing demands for strong salary rises to alleviate the inflationary problem. Last week’s offer by the government for 5-7% rises in public sector workers’ pay is sizeable but smaller than feared by the BoE. However, the risk of continued industrial action and an associated hit on the economy would have been devastating for the UK's growth outlook at this juncture. In this context, on Friday we get a double dose of data releases regarding the consumer sector that the BoE will be monitoring very closely.
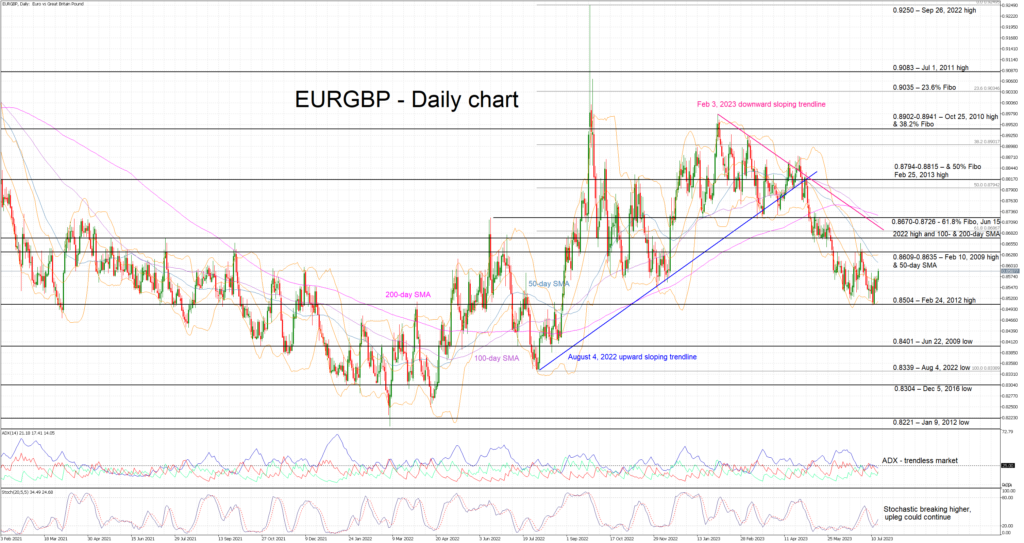
Euro/pound touched 0.85
The pound remains the star of 2023 and it is currently trading close to an 11-month high against the euro. The pound has shown extreme resilience throughout the year despite the different pace of monetary policy adjustment between the BoE and the ECB. This balance has tipped in favour of the pound lately, opening the door to more significant gains against the euro going forward.
The euro/pound pair almost broke 0.85 on July 11, prompting a small upleg towards the 0.8580 area. If the CPI report produces a significant downside surprise, especially if core inflation finally records a sizeable drop, the euro/pound pair could find strength to make a higher high and stage a move towards the 0.8670-0.8726 range. On the flip side, confirmation of current forecasts or a small pickup in inflation rates could probably cement the expectations for another 50bps move at the early-August BoE meeting, and hence allow the euro/pound pair to test the 0.8400 area.
GBP/USD: Cable Eases from New 2023 Top, UK CPI Data Eyed for Fresh Signals
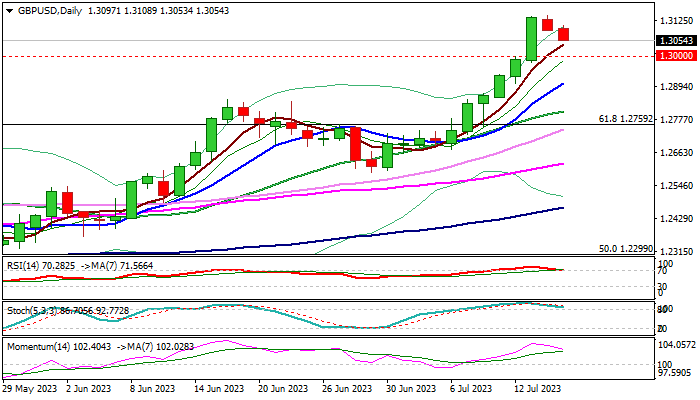
Pullback from new 2023 high (1.3141), where last week’s strong bullish acceleration was repeatedly rejected, extends into the second straight day.
Strongly overbought RSI /stochastic and fading bullish momentum on daily chart, contributed to decision to collect some profits.
Fresh bears face initial support at 1.30 (psychological), ahead of rising 10DMA (1.2906) and former top at 1.2848 (June 16), which should contain extended dips and keep larger bulls in play.
Markets shift focus on UK inflation report (due on Wednesday’s morning) which may provide more clues about BoE’s decision in Aug policy meeting.
British inflation is expected to ease in June (y/y 8.2% f/c vs 8.7% in May) with softer results to ease pressure on central bank, while above-forecast figures would add to expectations for 50 basis points hike.
Res: 1.3108; 1.3141; 1.3200; 1.3298.
Sup: 1.3041; 1.3000; 1.2906; 1.2848.
Sunset Market Commentary
Markets
The new trading week started with some risk-off. Growth concerns took the upper hand following Chinese Q2 GDP numbers published in early Asian dealings this morning. There were some green shoots, including the better-than-expected June industrial production figures, but markets dismissed them. European equities slip more than one percent. Technical charts supported the downleg. The EuroStoxx50 tested the strong 4400 resistance area end last week. Failing to push through instead triggered a countermove lower for a fifth time since April. Core bonds advanced, pushing yields in the euro area and US several bps lower before paring declines after a stronger-than-expected NY Fed Empire index. The headline figure eased from 6.6 to 1.1, pointing at marginally increasing factory activity. This compares to the -3.5 consensus was expecting. Both prices paid and received eased further to the lowest level in two years but the gauges for six months ahead picked up. New orders stabilized at a low level while the employment subindex for the first time since January hit positive territory again. The business outlook six months ahead deteriorated a few points to 14.3 to remain around the highest levels since mid-2022. US yields erased all previous losses of as much as 6 bps to trade flat for the day. German rates join the US trading pattern and drop 0.8-2 bps with the wings underperforming the belly.
The currencies Down Under are today’s laggards. That should come as no surprise since the risk-off can be traced back to slowing growth in one of Australia’s and New Zealand’s most important trading partner. AUD/USD goes into it’s second day of declines to test the 0.68 big figure. NZD/USD in a parallel move goes from 0.636 to 0.633. Commodities feel the pressure as well with oil losing 1.4% to further slip sub $80 again. Soft commodities, and especially wheat, are doing much better. It follows Russia’s decision to terminate and not to extend the UN-Turkey brokered grain deal, potentially limiting world supply ahead of the harvest season (see headline below). Other currency pairs trade extremely tight ranges today. EUR/USD moves sideways around 1.123. The trade-weighted dollar stages an unconvincing attempt to recoup the 100 barrier. EUR/GPB bounces towards the 0.86 area in technical trading with sterling on edge for Wednesday’s CPI numbers.
News & Views
Russia today formally withdrew from the Black Sea grain deal brokered last year to export Ukrainian grain across the Black Sea. Since the deal, around 33 million of commodities have exported from Ukraine. Russian president Putin’s spokesman Peskov said that western sanctions should be removed to bolster trade (eg reconnecting an agricultural bank to the SWIFT international payments system) in a parallel agreement under which the UN vowed to improve access to Russian food and fertilizer exports. In November of last year, Russia already ditched the Black Sea grain deal for one day, before Turkish President Erdogan helped agreeing an extension. Putin and Erdogan meet again in August with exit deal becoming one of the key talking points. Wheat prices spike around 2% higher on the news today.
Polish monetary council member Duda said in a Business Insider Polska interview that the MPC will have arguments to carefully discuss interest rate cuts as soon as after summer holidays. Of course given that they see a fast decrease in inflation, putting it on permanent downward trend in the long term. She thinks that inflation could fall into single digit territory faster than the current NBP forecast of Q4 2023. Polish prices have not increased M/M in the last two months, providing evidence for the ongoing disinflation process. Falling energy and food prices are slowing down global price growth. Supply chains have improved. These are other elements limiting price pressure. Polish swap rate today drop up to 15 bps in the 5-10yr bucket of the curve. The Polish zloty holds firm though, changing hands near recent tops around 4.45.
USD/JPY Mid-Day Outlook
Daily Pivots: (S1) 137.63; (P) 138.40; (R1) 139.55; More...
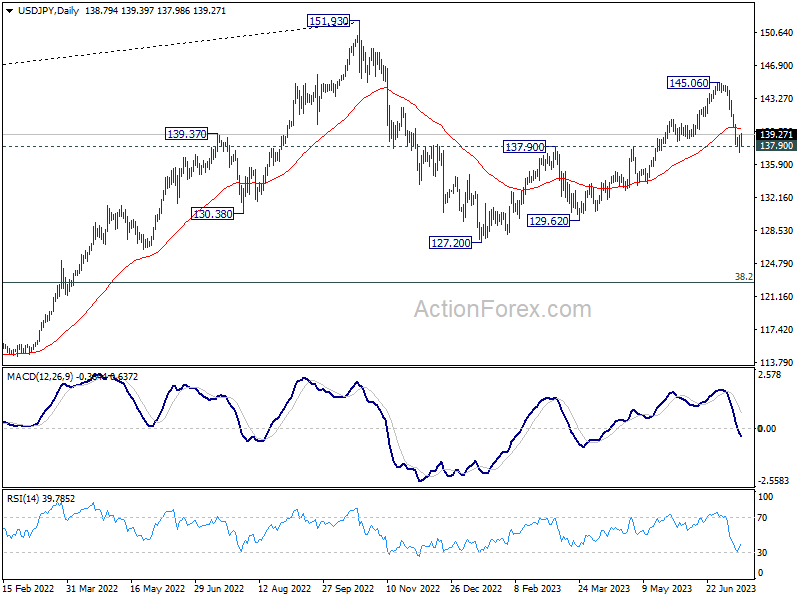
USD/JPY's consolidation from 137.22 is extending and intraday bias remains neutral. Upside of recovery should be limited by 55 4H EMA (now at 140.45) and bring another decline. Break of 137.22 and sustained trading below 137.90 resistance turned support will confirm the larger bearish case, and target 127.20 and below.
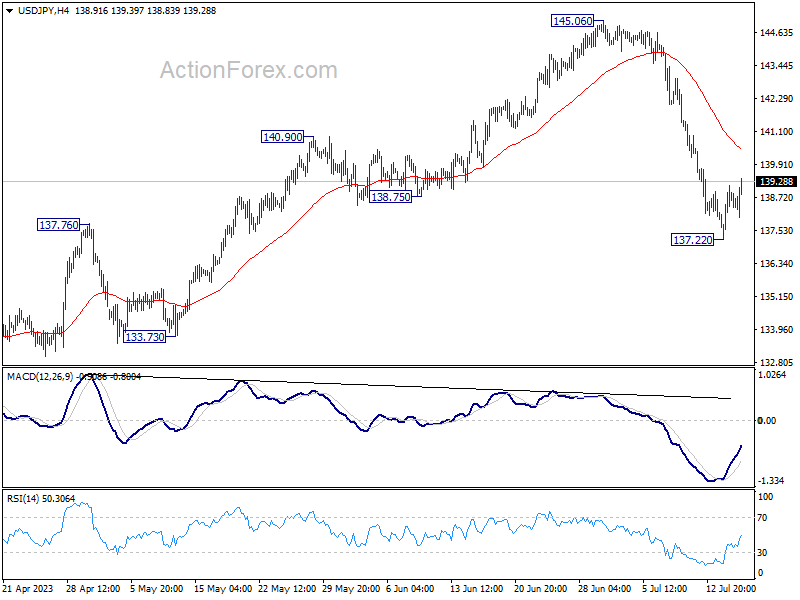
In the bigger picture, fall from 145.06 is seen as the third leg of the corrective pattern from 151.93 (2022 high). Sustained break of 137.90 resistance turned support should confirm this case and target 127.20 (2023 low) and below. For now, this will remain the favored case as long as 145.06 resistance holds, even in case of strong rebound.