Sample Category Title
GBP/USD Corrects Lower While EUR/GBP Aims Higher
GBP/USD started a downside correction from the 1.3145 zone. EUR/GBP is eyeing more gains above the 0.8575 resistance zone.
Important Takeaways for GBP/USD and EUR/GBP Analysis Today
- The British Pound is trading in a bullish zone above 1.3080 against the US Dollar.
- There was a break below a key bullish trend line with support near 1.3085 on the hourly chart of GBP/USD at FXOpen.
- EUR/GBP started a fresh increase from the 0.8500 zone.
- There is a major bullish trend line forming with support near 0.8565 on the hourly chart at FXOpen.
GBP/USD Technical Analysis
On the hourly chart of GBP/USD at FXOpen, the pair started a fresh increase from the 1.2750 support zone. The British Pound climbed above the 1.3020 resistance zone against the US Dollar.
The bulls were able to pump the pair above 1.3080 and the 50-hour simple moving average. It tested the 1.3145 zone before it started a downside correction. There was a move below the 1.3100 level. Besides, there was a break below a key bullish trend line with support near 1.3085.
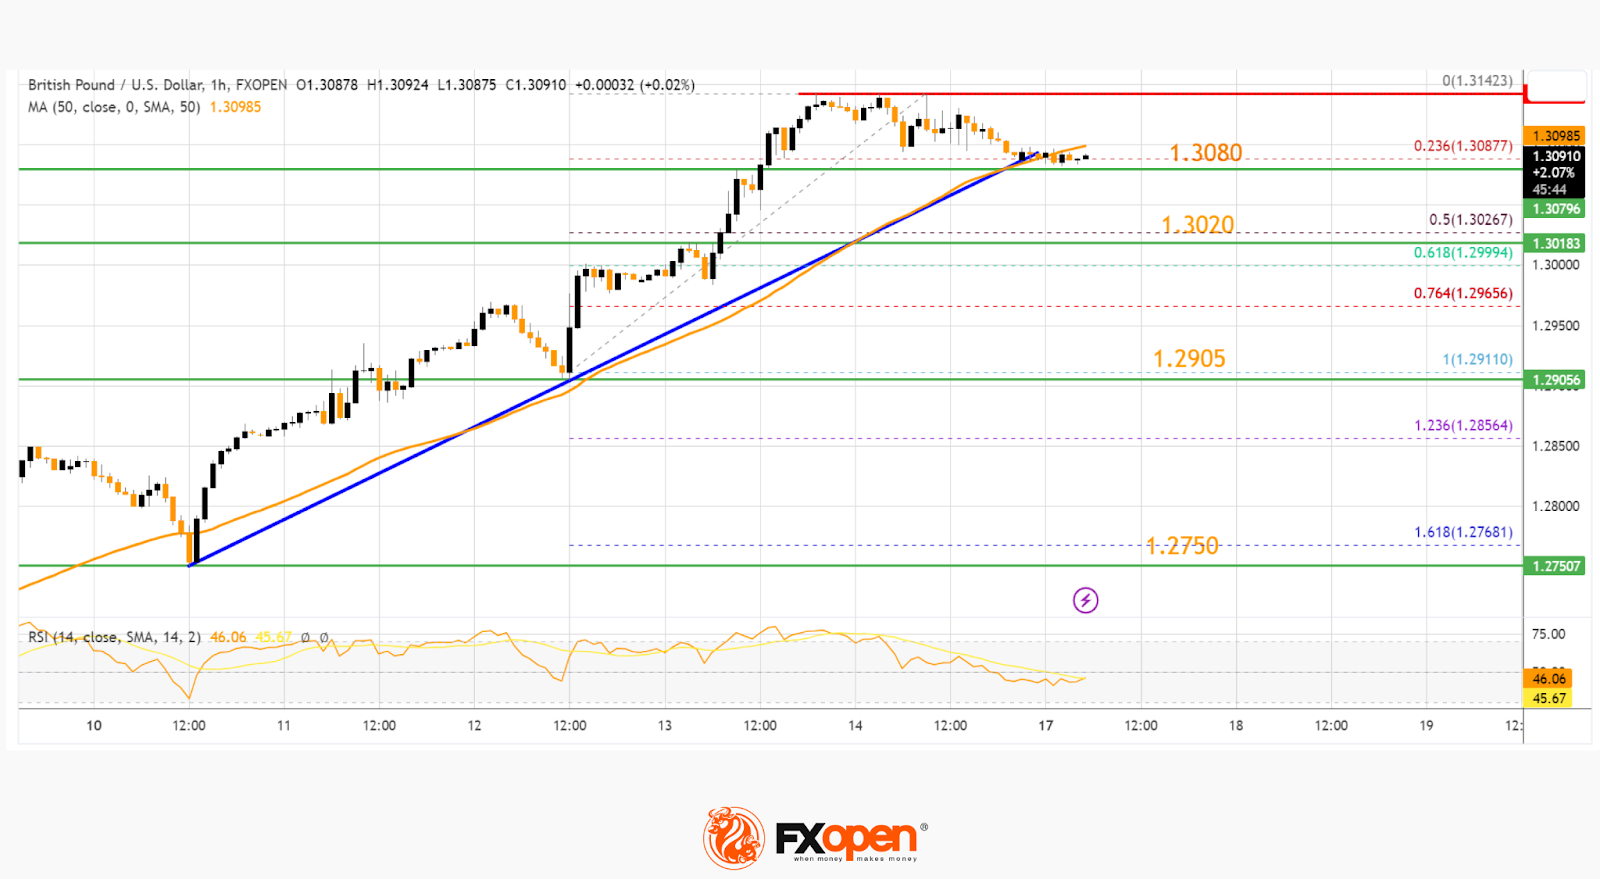
The pair is consolidating near the 23.6% Fib retracement level of the upward move from the 1.2910 swing low to the 1.3142 high.
On the downside, there is a major support forming near 1.3080. If there is a downside break below the 1.3080 support, the pair could accelerate lower. The next major support is near the 1.3020 zone. It is close to the 50% Fib retracement level of the upward move from the 1.2910 swing low to the 1.3142 high, below which the pair could test 1.2905.
Any more losses could lead the pair toward the 1.2750 support. On the upside, the GBP/USD chart indicates that the pair is facing resistance near the 50-hour simple moving average.
The next major resistance is near the 1.3145 level. If the RSI moves above 50 and the pair climbs above 1.3145, there could be another rally. In the stated case, the pair could rise toward the 1.3200 level or even 1.3240.
EUR/GBP Technical Analysis
On the hourly chart of EUR/GBP at FXOpen, the pair started a fresh increase from the 0.8500 zone. The Euro traded above the 0.8535 level to move into a positive zone against the British Pound.
The EUR/GBP chart suggests that the pair settled above the 50-hour simple moving average and 0.8565. It is now consolidating gains below the 0.8575 resistance zone. The RSI is moving lower and suggesting a minor downside correction.
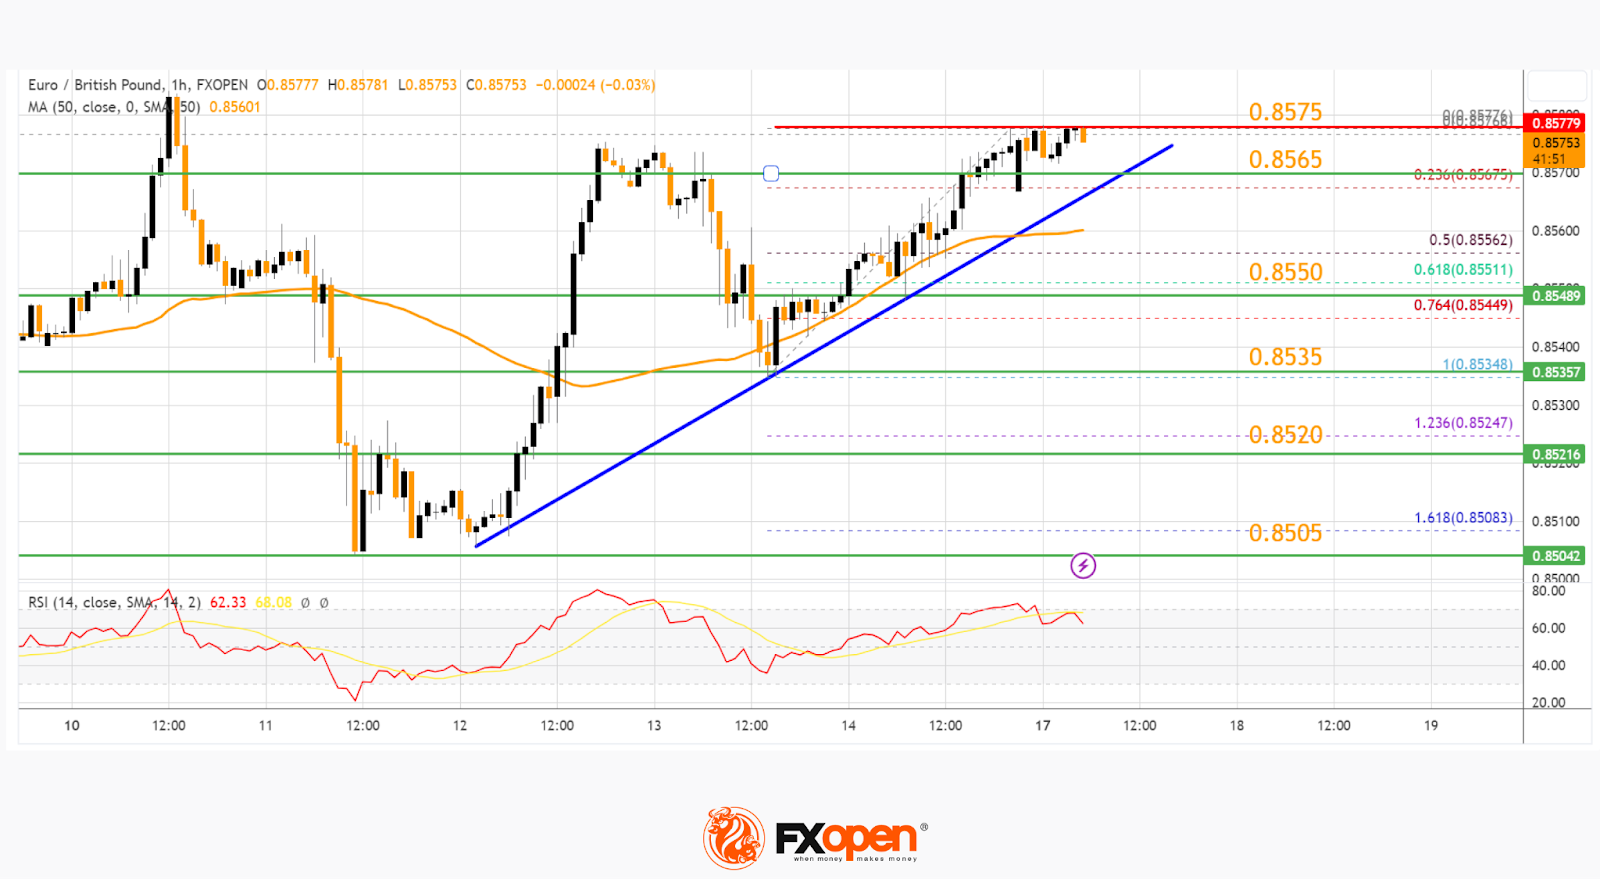
If there is no move above 0.8575, the pair could correct lower. Immediate support sits at 0.8565 or the 23.6% Fib retracement level of the upward move from the 0.8534 swing low to the 0.8577 high.
The next major support is near the 61.8% Fib retracement level of the upward move from the 0.8534 swing low to the 0.8577 high at 0.8550. A downside break below the 0.8550 support might call for more downsides. In the stated case, the pair could drop toward the 0.8520 support level.
Immediate resistance is near 0.8575. The next major resistance for the bulls is near the 0.8600 handle. A close above the 0.8600 level might accelerate gains.
In the stated case, the bulls may aim for a test of 0.8640. Any more gains might send the pair toward the 0.8680 level in the coming sessions.
EURUSD Plays Defense Bear Overbought Conditions
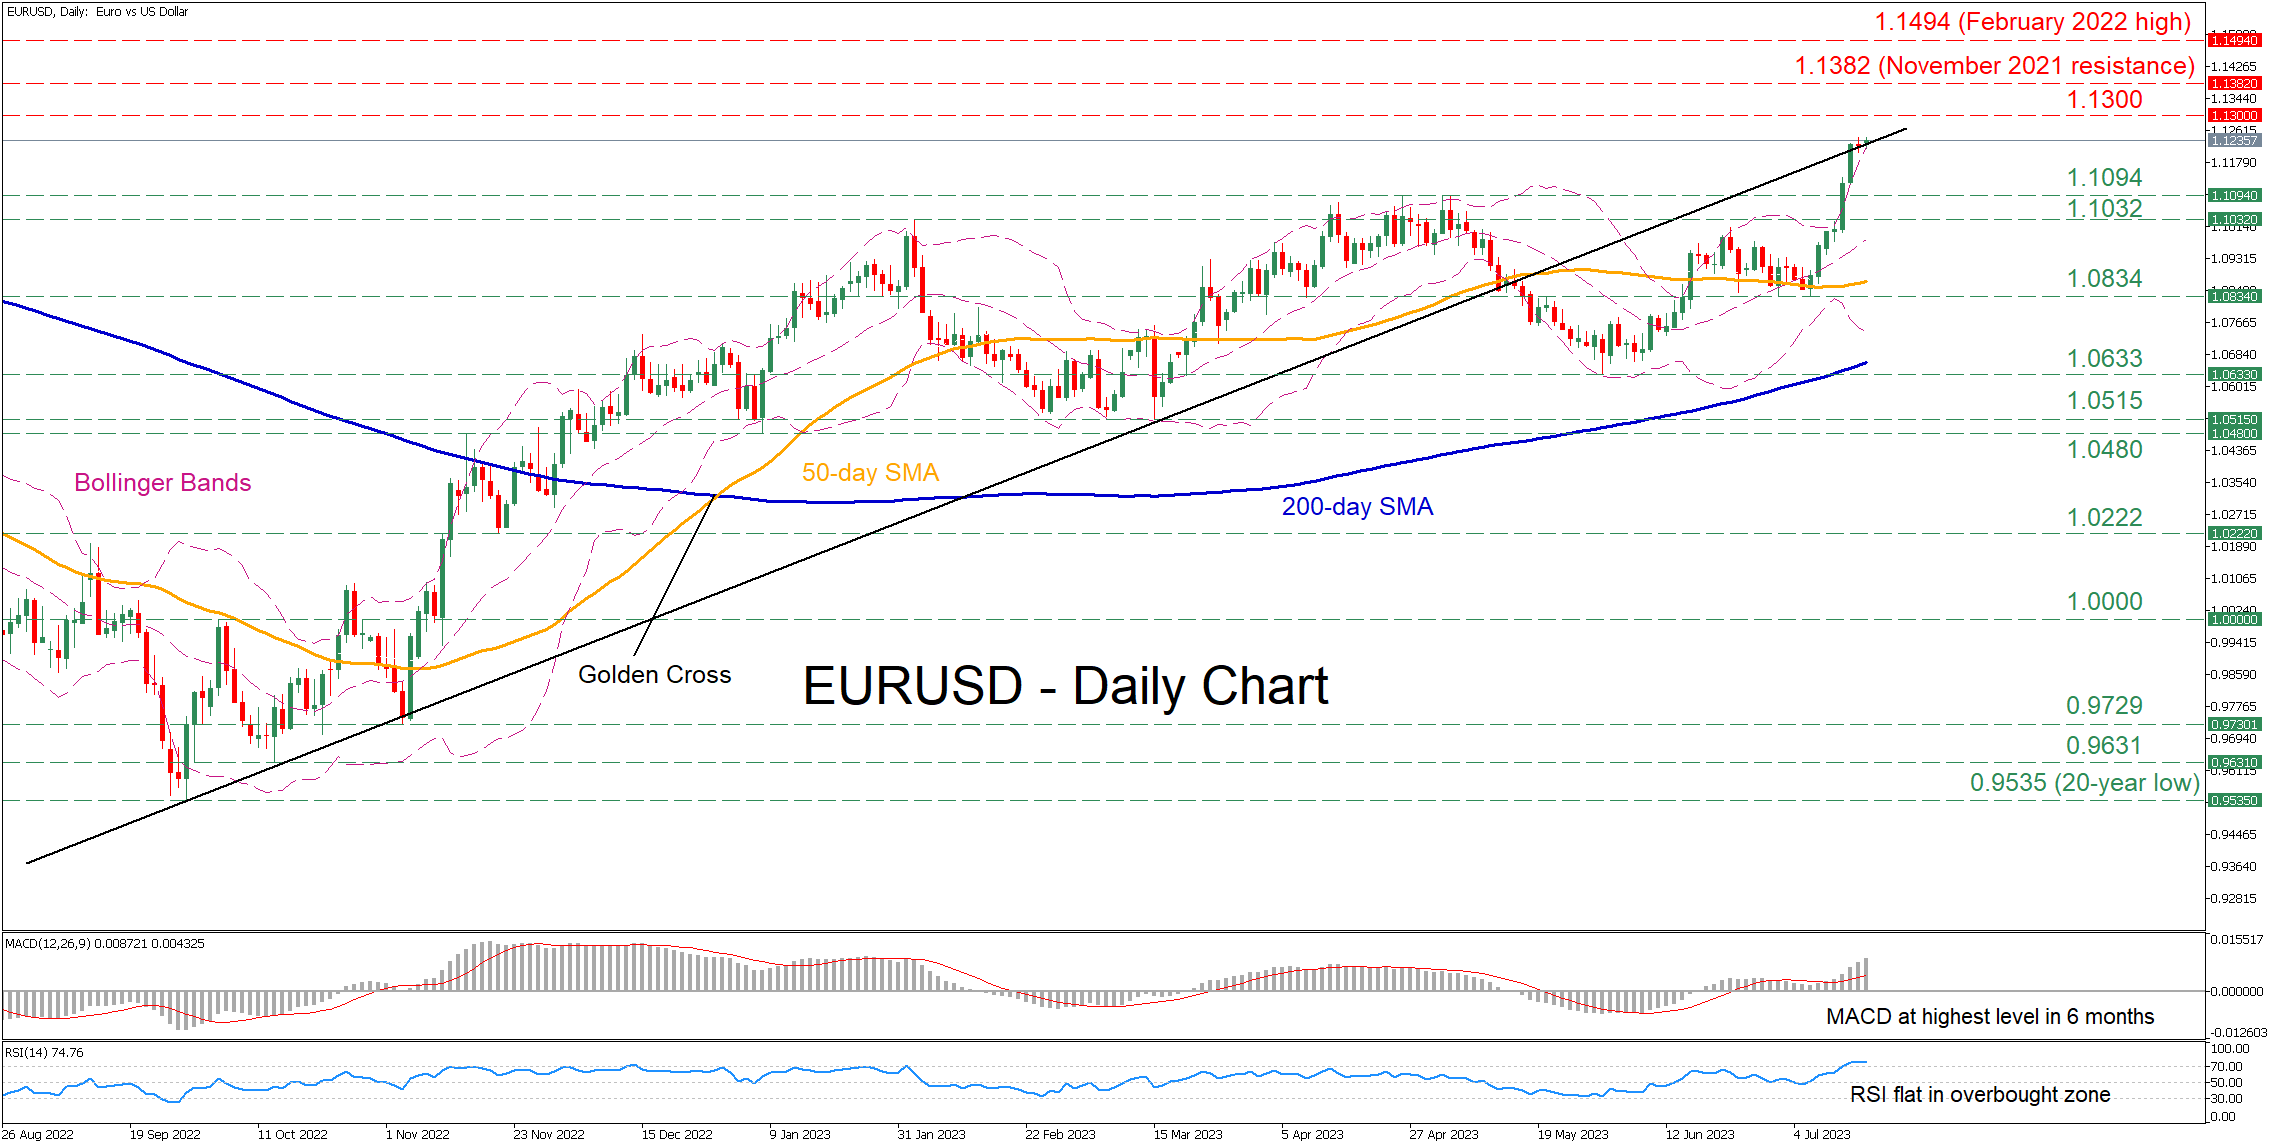
EURUSD has experienced significant gains in the past 10 days, smashing its recent resistance levels and posting a fresh 17-month peak last Friday. However, it seems that the bulls cannot extend the recent rally as the pair has approached overbought conditions.
The momentum indicators currently suggest that the recent rally could be overstretched. Specifically, the MACD is not only above both zero and its red signal line but also at its highest levels since January 2023, while the RSI is directionless within the 70-overbought zone.
Should the advance falter and the pair correct to the downside, the previous peak of 1.1094 could act as the first line of defense. Breaking below that zone, the price could test the February resistance of 1.1032, which could serve as support in the future. Further declines might then cease at the July support of 1.0834.
On the flipside, if the latest rally continues unhindered, the bulls may initially attack the 1.1300 psychological region. Piercing through that wall, the pair could ascend towards the November 2021 resistance of 1.1382. A violation of that zone could pave the way for the February 2022 peak of 1.1494.
In brief, EURUSD’s aggressive short-term rally has stalled as the price is close to overbought conditions, while also battling with the crucial ascending trendline that connects its lows since September 2022. A drop below the trendline could easily trigger a downside correction, but a failure to do so might add more fuel to the bulls' engines.
USD Continues to Struggle
EUR/USD keeps high ground
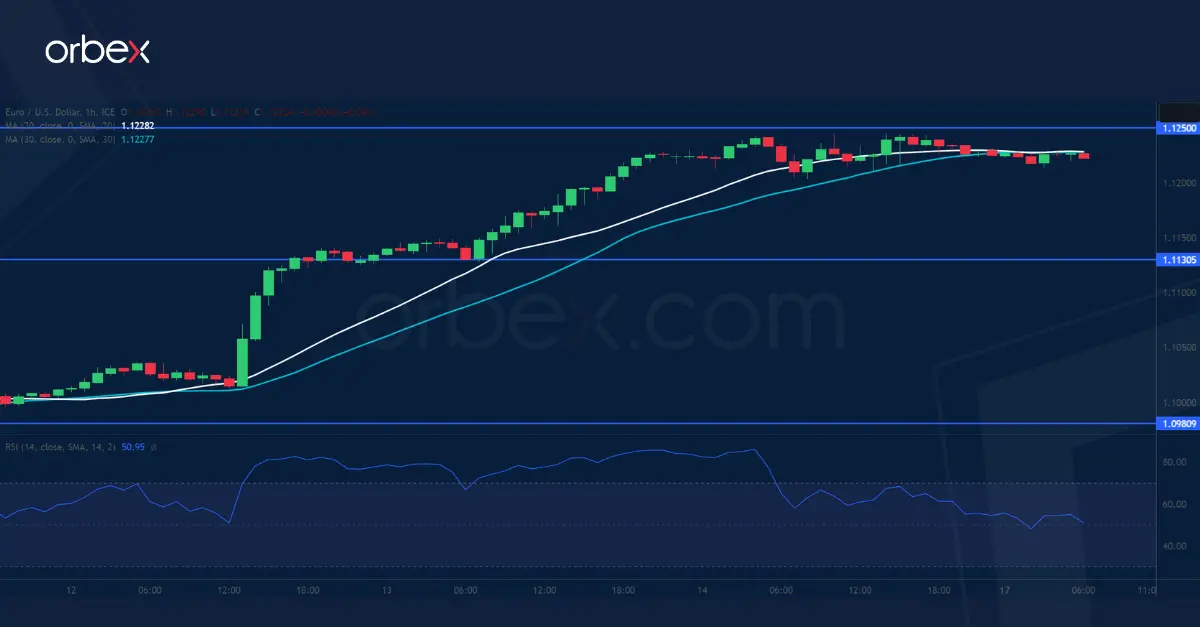
The US dollar stays under pressure as traders adjust to the end of the Fed’s hike cycle. The euro has its way unobstructed after it broke above May’s peak of 1.1080. The pair has reached a near 17-month high at 1.1250 and the RSI’s repeatedly overbought condition may cause some profit-taking, temporarily driving the quote lower. As sentiment is overwhelmingly bullish, trend followers would look to jump in at the next pullback. 1.1130 is the first support and 1.0980 on the 20-day SMA a key level to keep momentum intact.
XAG/USD consolidates gains
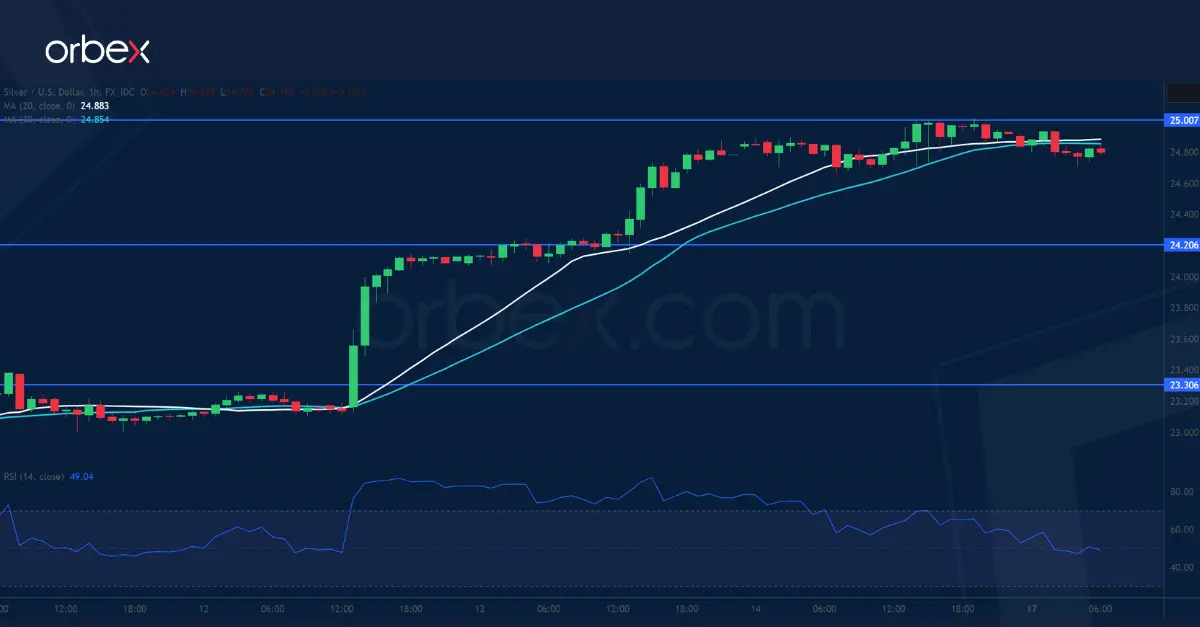
Silver jumps as a weaker US dollar boosts demand for precious metals. A surge above June’s high of 24.50 is a sign of a strong buying pressure, carrying the price to the psychological level of 25.00 which coincides with a former support from a sell-off back in mid-May. The bulls may need to catch their breath after the RSI shot again into the overbought zone. 24.20 is the first level to expect follow-up bids. A close back above 25.00 would flush out the remaining selling interests and open the door to this year’s high of 26.00.
GER 40 hits resistance
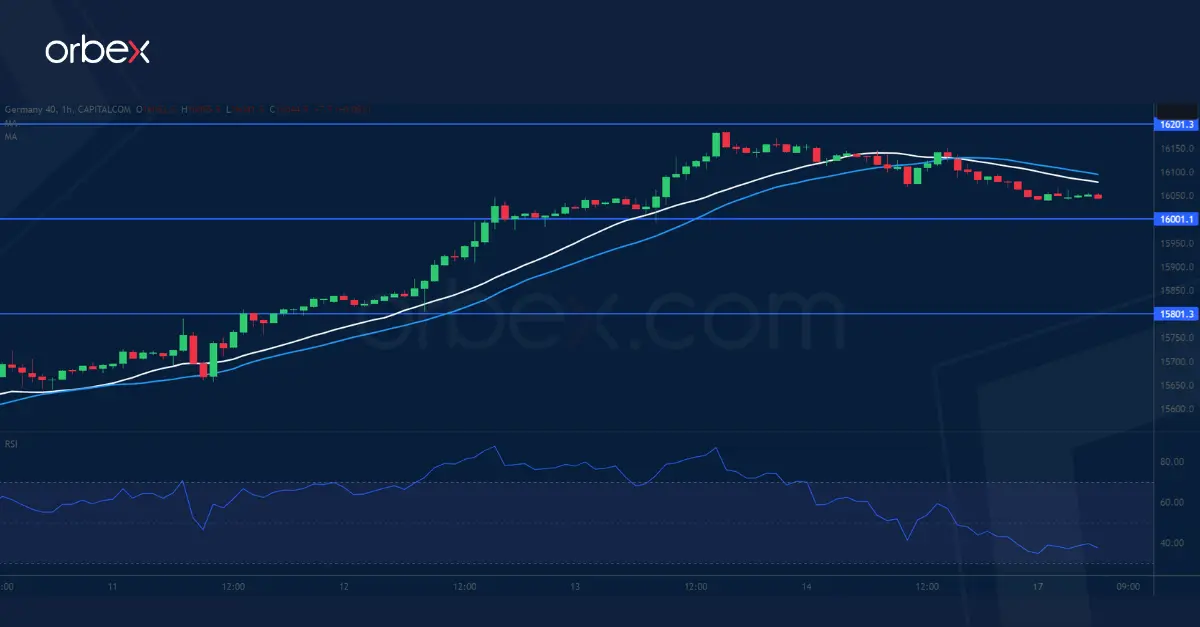
The Dax 40 consolidates gains as risk appetite grows amid easing US inflation. The price has clawed back the losses from earlier this month and is testing the daily resistance of 16200. A bullish breakout would put the bulls back in the driver’s seat and send the index to its recent all-time high of 16420, paving the way for a bullish continuation in the medium-term. The round number of 16000 is the closest level to see if there are enough buyers to cause a rebound. Further down, 15800 would be a second level of support.
Gold Technical Analysis
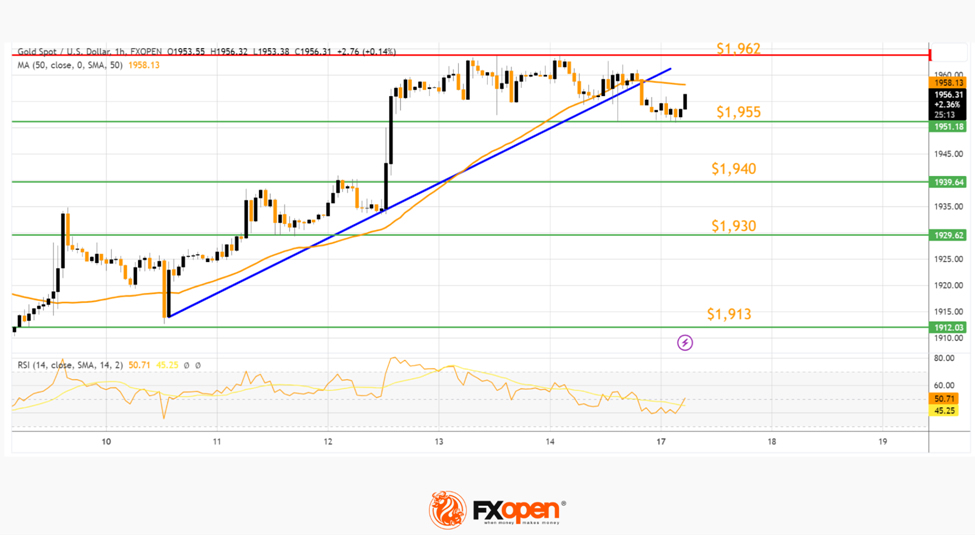
On the hourly chart of Gold at FXOpen, the price started a decent increase from the 1,913 zone against the US Dollar. The price climbed above the $1,940 resistance and the 50-hour simple moving average.
However, bears appeared near $1,962. The price started a downside correction below a connecting bullish trend line with support at $1,958. On the downside, immediate support is near the $1,955 level.
The next major barrier is near the $1,940 level, below which the price might drop toward $1,930. Any more losses may set the tone for a test of the $1,913 zone.
On the upside, the price seems to be facing resistance near $1,962. The next major barrier is near the $1,970 level. A clear move above $1,970 could send the price toward the $1,980 resistance.
EUR/USD Daily Outlook
Daily Pivots: (S1) 1.1207; (P) 1.1226; (R1) 1.1248; More...
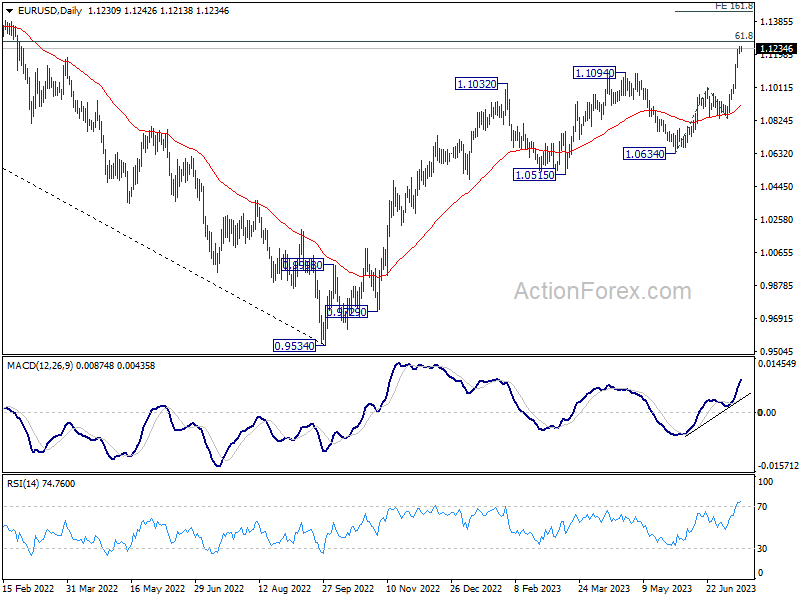
Intraday bias in EUR/USD stays on the upside despite some loss of momentum. Further rally would be seen to 1.1273 fibonacci level. Firm break there will target 161.8% projection of 1.0634 to 1.1011 from 1.0832 at 1.1442 next. On the downside, below 1.1186 minor support will turn intraday bias neutral and bring consolidations first, before staging another rally.
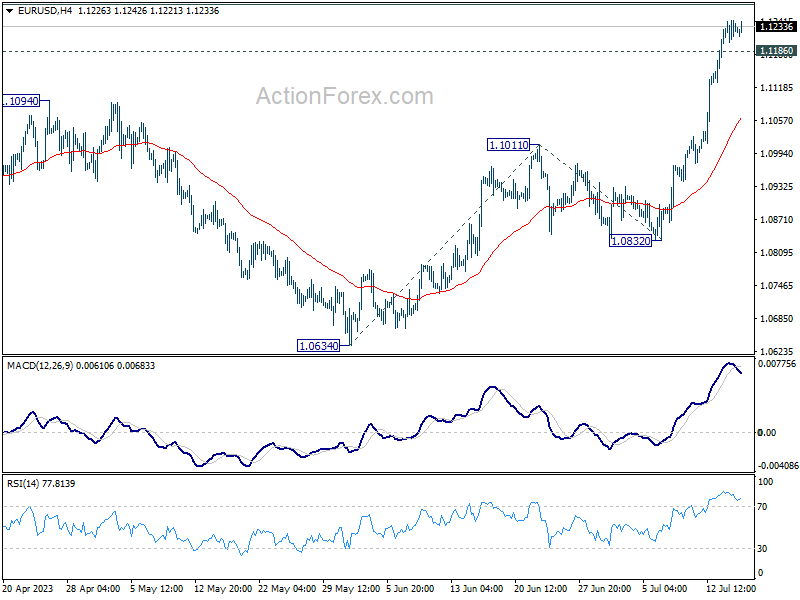
In the bigger picture, as rise from 0.9534 extends, focus is now on 61.8% retracement of 1.2348 (2021 high) to 0.9534 at 1.1273. Sustained break there will solidify the case of bullish trend reversal and target 1.2348 resistance next. Meanwhile, outlook will continue to stay bullish as long as 1.0832 support holds, even in case of deep pull back.
USD/JPY Daily Outlook
Daily Pivots: (S1) 137.63; (P) 138.40; (R1) 139.55; More...
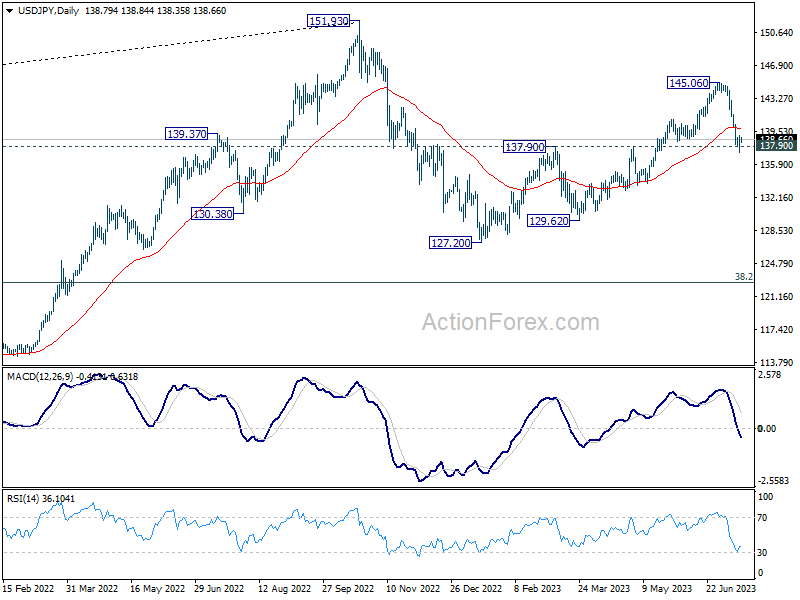
Intraday bias in USD/JPY stays neutral for consolidation above 137.22. Upside of recovery should be limited by 55 4H EMA (now at 140.56) and bring another decline. Break of 137.22 and sustained trading below 137.90 resistance turned support will confirm the larger bearish case, and target 127.20 and below.
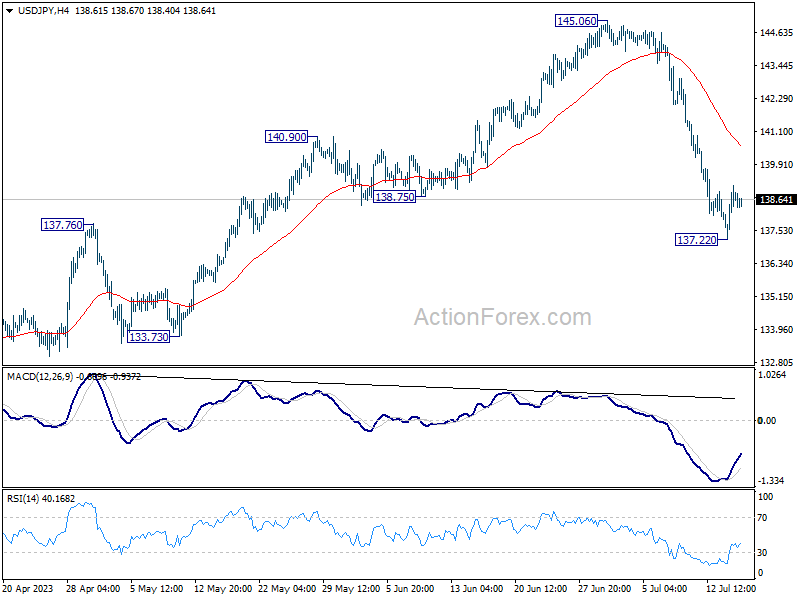
In the bigger picture, fall from 145.06 is seen as the third leg of the corrective pattern from 151.93 (2022 high). Sustained break of 137.90 resistance turned support should confirm this case and target 127.20 (2023 low) and below. For now, this will remain the favored case as long as 145.06 resistance holds, even in case of strong rebound.
GBP/USD Daily Outlook
Daily Pivots: (S1) 1.3075; (P) 1.3108; (R1) 1.3127; More...
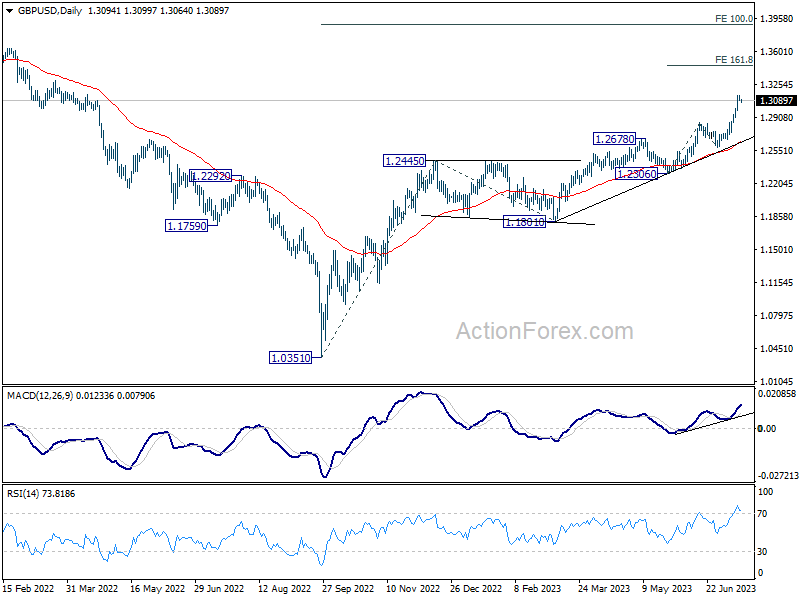
Intraday bias in GBP/USD remains neutral for consolidation below 1.3141 temporary top. Some consolidation should be seen, but downside should be contained above 1.2847 resistance turned support to bring rise resumption. On the upside, break of 1.3141 will resume larger up trend and target 161.8% projection of 1.2306 to 1.2847 from 1.2589 at 1.3464 next.
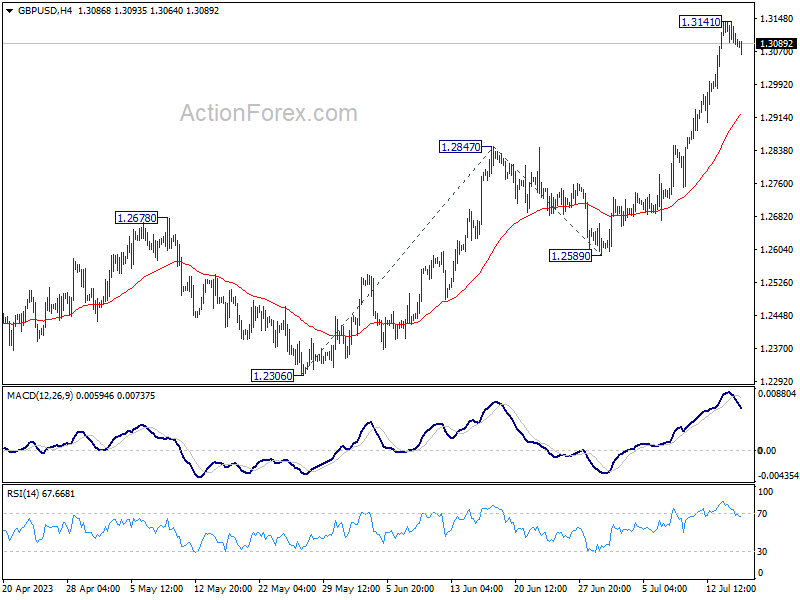
In the bigger picture, rise from 1.0351 medium term bottom (2022 low) is in progress. Next target is 100% projection of 1.0351 to 1.2445 from 1.1801 at 1.3895. Break there will target 1.4248 key long term resistance (2021 high) next. This will now remain the favored case as long as 1.2678 resistance turned support holds.
USD/CHF Daily Outlook
Daily Pivots: (S1) 0.8580; (P) 0.8606; (R1) 0.8646; More...
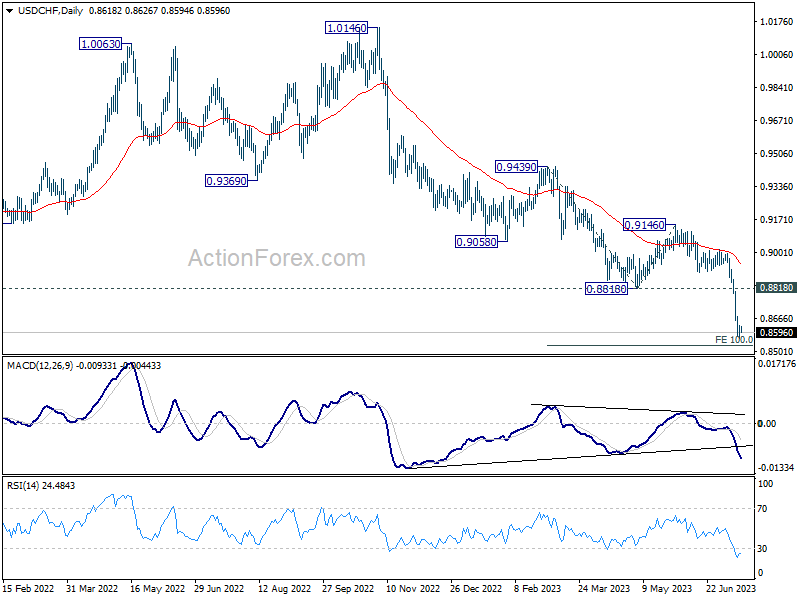
Intraday bias in USD/CHF stays neutral for consolidation above 0.8564 temporary low. Upside of recovery should be limited below 0.8818 support turned resistance to bring another fall. Break of 0.8564 will resume larger down trend and target 100% projection of 0.9439 to 0.8818 from 0.9146 at 0.8525 next.
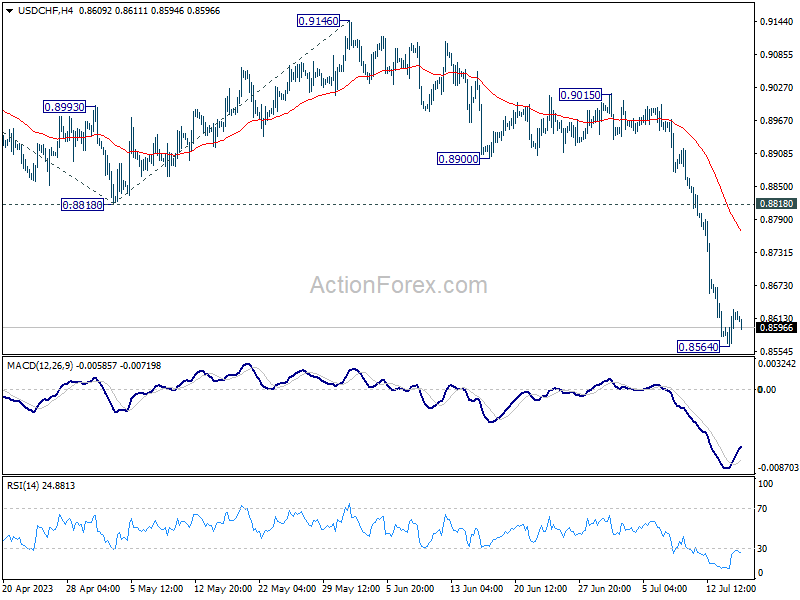
In the bigger picture, the break of 0.8756 (2021 low) indicates break out from the long term range pattern. For now, medium term outlook will stay bearish as long as 0.9146 resistance holds. Further fall would be seen to 61.8% retracement of 0.7065 (2011 low) to 1.0342 (2016 high) at 0.8317 next.
AUD/USD Daily Report
Daily Pivots: (S1) 0.6814; (P) 0.6855; (R1) 0.6878; More...
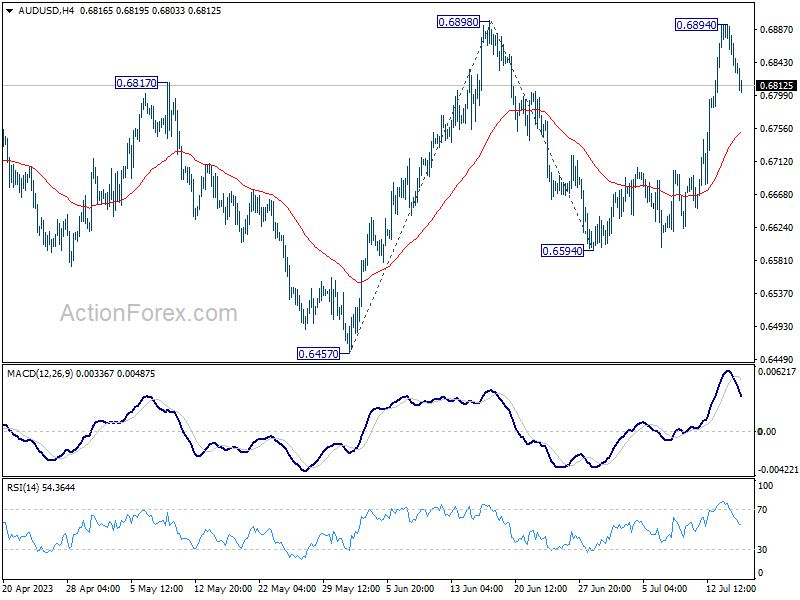
Intraday bias in AUD/USD remains neutral for the moment. On the upside, decisive break of 0.6898 resistance will firstly confirm resumption of rise from 0.6457. Secondly, that should also confirm completion of the fall from 0.7156 at 0.6457. Next target will be 100% projection of 0.6457 to 0.6898 from 0.6594 at 0.7035, and then 0.7156 resistance.
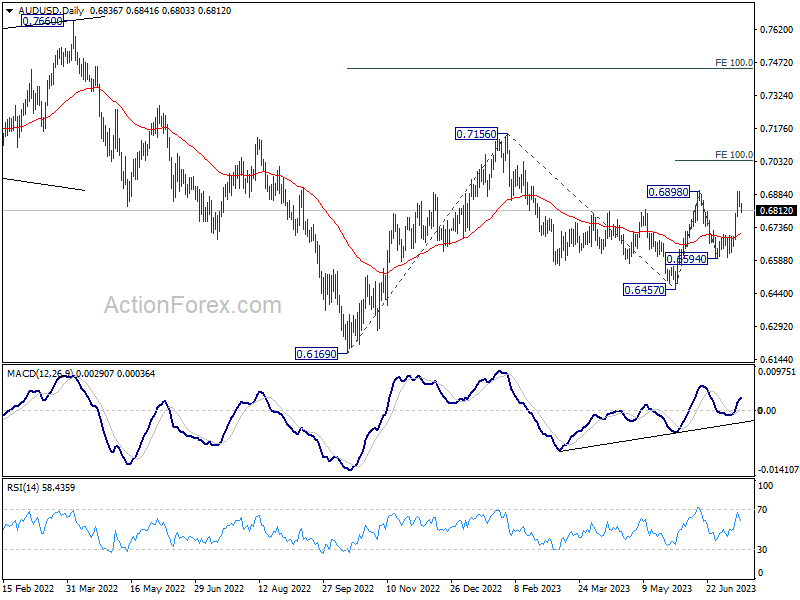
In the bigger picture, price actions from 0.7156 are seen as a correction to the rebound from 0.6169 (2022 low). Break of 0.6898 resistance will argue that rise from 0.6169 is ready to resume through 0.7156. Next target will be 100% projection of 0.6169 to 0.7156 from 0.6457 at 0.7444. For now, this will be the favored case as long as 55 D EMA (now at 0.6703) holds.
USD/CAD Daily Outlook
Daily Pivots: (S1) 1.3132; (P) 1.3179; (R1) 1.3266; More....
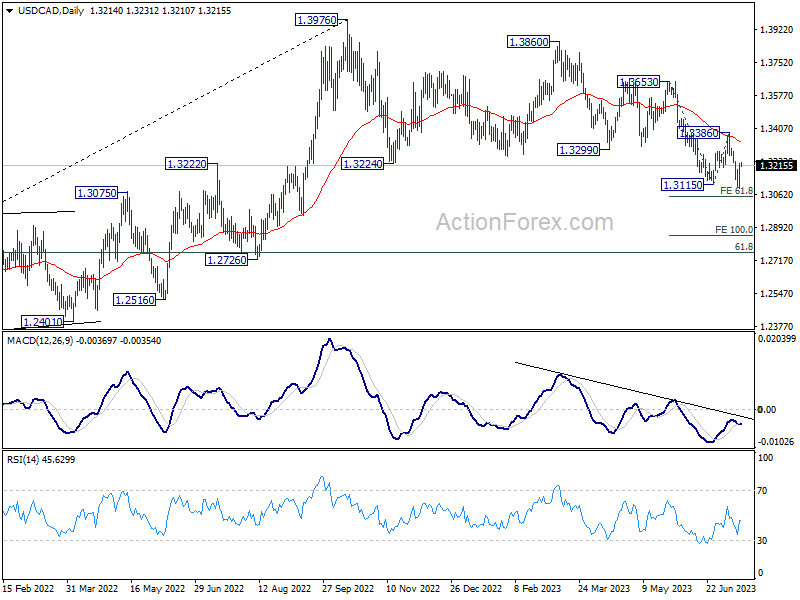
Intraday bias in USD/CAD remains neutral for consolidation above 1.3091. Outlook will remain bearish as long as 1.3386 resistance holds. Break of 1.3091 will resume larger decline to 61.8% projection of 1.3653 to 1.3115 from 1.3386 at 1.3054. However, firm break of 1.3386 will indicate near term reversal and turn outlook bullish.
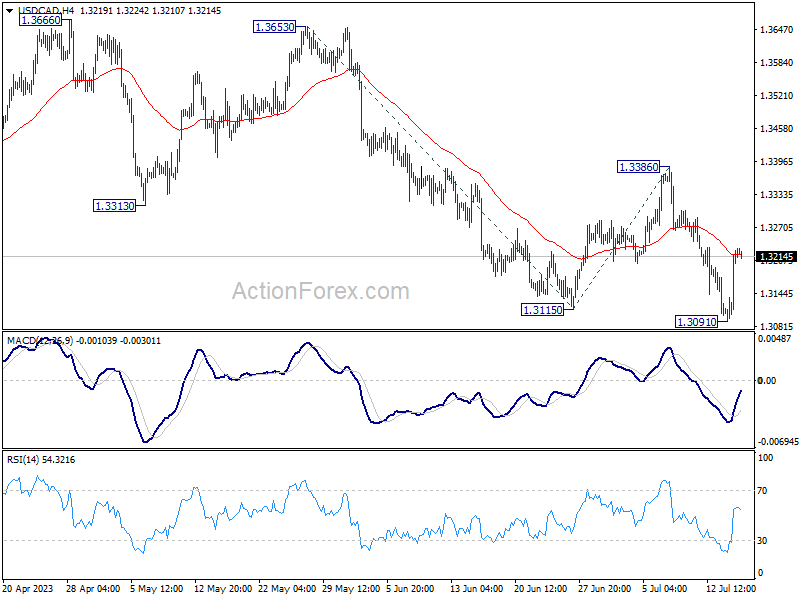
In the bigger picture, price actions from 1.3976 are viewed as a correction to up trend from 1.2005 (2021 low) only. But even so, deeper decline is expected as long as 1.3386 resistance holds. Further fall could be seen to 61.8% retracement of 1.2005 to 1.3976 at 1.2758. Meanwhile, break of 1.3386 will be a sign that the correction has completed and bring stronger rally back to retest 1.3976.