
Sample Category Title
Sunset Market Commentary
Markets
The absence of both US investors (President’s Day) and important eco data set the stage for a quiet start to the trading week. In the second (or even third) tier data category we found January wage tracker data from Indeed Hiring Lab. The data measure growth in wages advertised in job postings for selected country. The euro area series is an employment-weighted average of the five largest nations and Ireland. Data showed wage growth slowing from 2.43% Y/Y to 2.29% which equals the 3m moving average of 2.3% (stable from 2.28% in December; slowest pace since November 2021). On Friday, the ECB publishes more closely-watched quarterly negotiated wage data (Q4). One-off payments pulled the series from 4% Y/Y in Q2 to 1.9% Y/Y in Q3 with markets expecting a rebound to 2.9% Y/Y in Q4 2025. The central bank’s latest forward looking wage tracker, released last week, points to 2.1% wage growth in the first half of this year and 2.7% growth in H2. It still sees forward-looking information in line with negotiated wage growth that might level off at below 3% by the end of 2026. If realized, these kind of wage growth levels support the case for the ECB to hold the policy rate near a 2% neutral level. Wage growth figures for the UK showed a stabilization around 4.14% Y/Y in January with the 3m moving average extending its slide (since July 2024!) from 4.47% to 4.24%, matching the lowest level since March 2022. UK markets are unnerved as they also eye the bigger releases later this week. The labour market report opens the debates tomorrow with weekly earnings (excl) bonuses expect to mirror today’s numbers with a decrease to 4.2% which would be the lowest since January 2022. Any signs of disappointing job growth would be taken as confirmation that the Bank of England could implement its next rate cut as soon as in March. BoE governor Bailey, the decisive vote of late, saw scope for some further easing of policy. He’s growing more confident on the overall path of wage disinflation while also stressing on several occasions the difference between soft comments (on the labour market) coming from business contacts and actual data still pointing a somewhat less worrying picture. On Wednesday and on Friday, CPI inflation and retail sales round up this week’s UK numbers. EUR/GBP 0.8750 resistance is the one to watch if markets find more evidence to lift near term rate cut bets.
News & Views
The Swiss economy bounced back from the 0.5% decline registered in 2025Q3 with a 0.2% recovery (flash estimate). The expansion was less than the 0.3% expected though. Annual growth last year amounted to 1.4%, quickening from 2024’s 1.2% but well below average economic growth of 1.8% (since 1981), the State Secretariat for Economic Affairs said. Services sector growth from a quarterly perspective was muted and the industrial sector stagnated. In annual terms, however, services grew at an above-average rate, while the “challenging international environment” slowed the export-oriented industry. Growth numbers today came after last week’s sub-par (m/m) inflation readings but are unlikely to sway the central bank into more rate cuts short-term. With a 0% policy rate, the bar for the Swiss National Bank to go back into negative territory is high. The Swiss franc underperforms vs most peers today but remains strong from a long-term point of view. EUR/CHF is filling bids in the 0.913 area.
It happened all in silence, but the topic on joining the euro area is gaining traction in Sweden. Its finance minister Svantesson announced her backing for an inquiry into the pros and cons last month, at the request of the Liberal party. It would be another major U-turn, along with NATO accession in 2022 and testament to how the changing (geopolitical) world order is both ripping up and strengthening existing ties as well as forging new ones. Swedish voters back in 2003 rejected the common currency in a referendum and Svantesson suggested that any plans for euro adoption would again be put to a public vote. That poses significant hurdles for short-term accession with still nearly a majority of Swedes against and about one third in favor. That gap is nevertheless much smaller than a decade ago, when three in four Swedes opposed the euro. There is also some tough political opposition to overcome with the Greens, the Left and far-right all against. While the debate may grow, it is expected that the actual evaluation for euro accession (based on the inquiry) won’t start until after the September elections.
EUR/USD Mid-Day Outlook
Daily Pivots: (S1) 1.1849; (P) 1.1867; (R1) 1.1887; More….
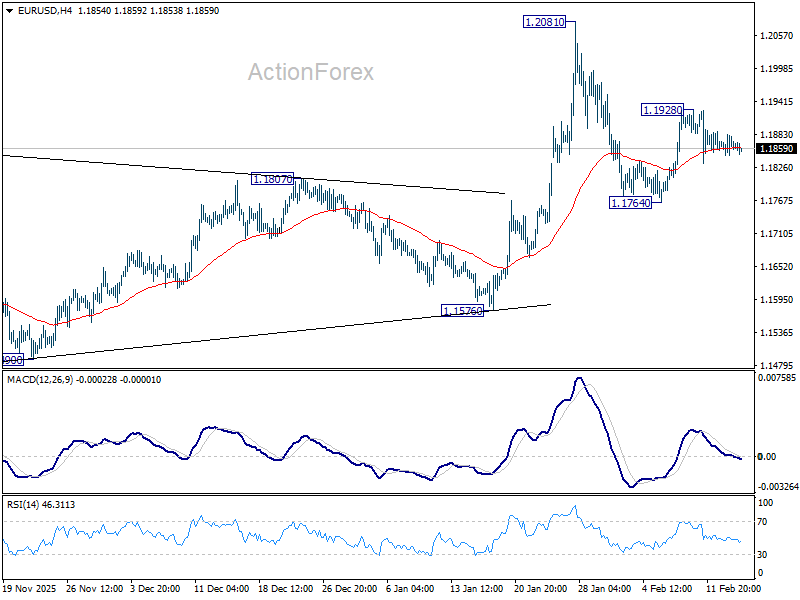
EUR/USD is still bounded in sideway trading and intraday bias remains neutral. On the upside, above 1.1928 will target a retest on 1.2081 high. Decisive break there and sustained trading above 1.2 psychological level will carry larger bullish implications. On the downside, however, sustained trading below 55 D EMA (now at 1.1760) will raise the chance of reversal on rejection by 1.2, and target 1.1576 support for confirmation.
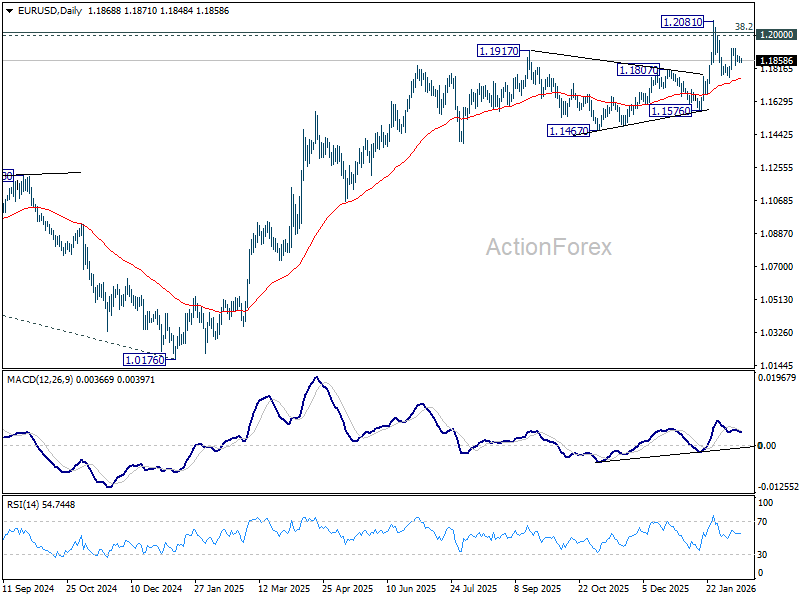
In the bigger picture, as long as 55 W EMA (now at 1.1485) holds, up trend from 0.9534 (2022 low) is still in favor to continue. Decisive break of 1.2 key psychological level will add to the case of long term bullish trend reversal. Next medium term target will be 138.2% projection of 0.9534 to 1.1274 from 1.0176 at 1.2581. However, sustained trading below 55 W EMA will argue that rise from 0.9534 has completed as a three wave corrective bounce, and keep long term outlook bearish.
GBP/USD Mid-Day Outlook
Daily Pivots: (S1) 1.3610; (P) 1.3635; (R1) 1.3679; More...
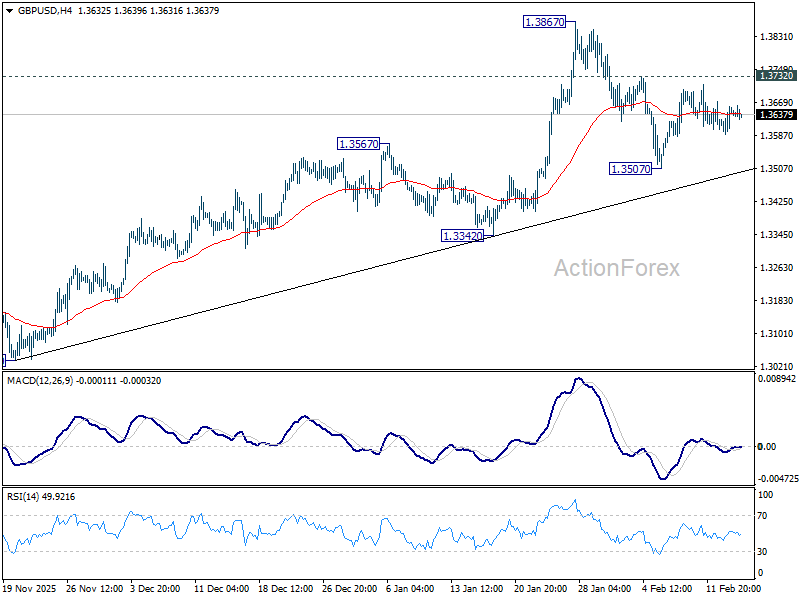
Intraday bias in GBP/USD remains neutral as sideway trading is still in progress. On the upside, firm break of 1.3732 will suggest that pullback from 1.3867 has completed as a correction at 1.3507. Retest of 1.3867 should be seen first. Firm break there will resume larger up trend towards 1.4284 key resistance. On the downside, however, sustained trading below 55 D EMA (now at 1.3511) will raise the chance of larger scale correction, and target 1.3342 support for confirmation.
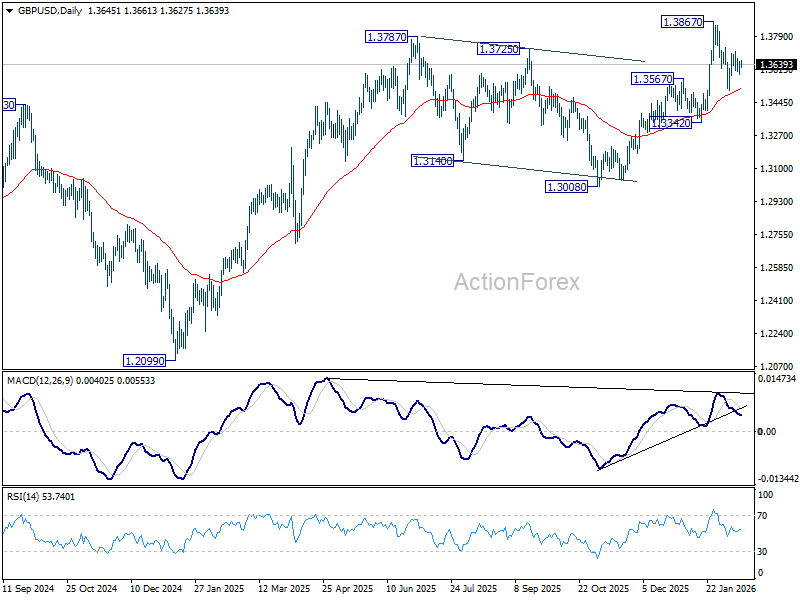
In the bigger picture, rise from 1.0351 (2022 low) still in progress and should target 1.4284 key resistance (2021 high). Decisive break there will add to the case of long term bullish trend reversal. For now, outlook will stay bullish as long as 1.3008 support holds, even in case of deep pullback.
USD/JPY Mid-Day Outlook
Daily Pivots: (S1) 152.31; (P) 152.99; (R1) 153.38; More...
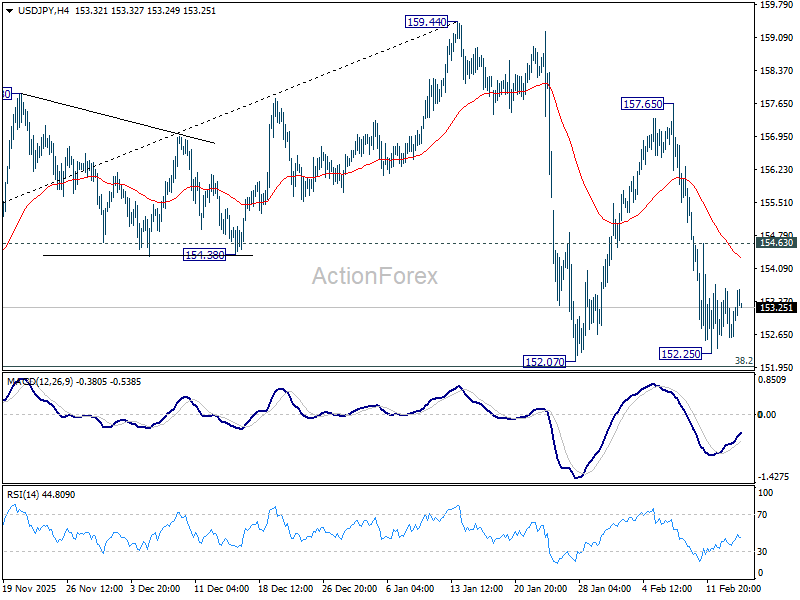
Outlook is unchanged in USD/JPY and intraday bias stays neutral. With 38.2% retracement of 139.87 to 159.44 at 151.96 intact, price actions from 159.44 are seen as a consolidations pattern only. On the upside, firm break of 154.63 minor resistance will bring stronger rebound towards 157.65. However, decisive break of 151.96 will argue that it's reversing the rise from 139.87 already. In this case, deeper fall should then be seen to 61.8% retracement at 147.34, and possibly below.
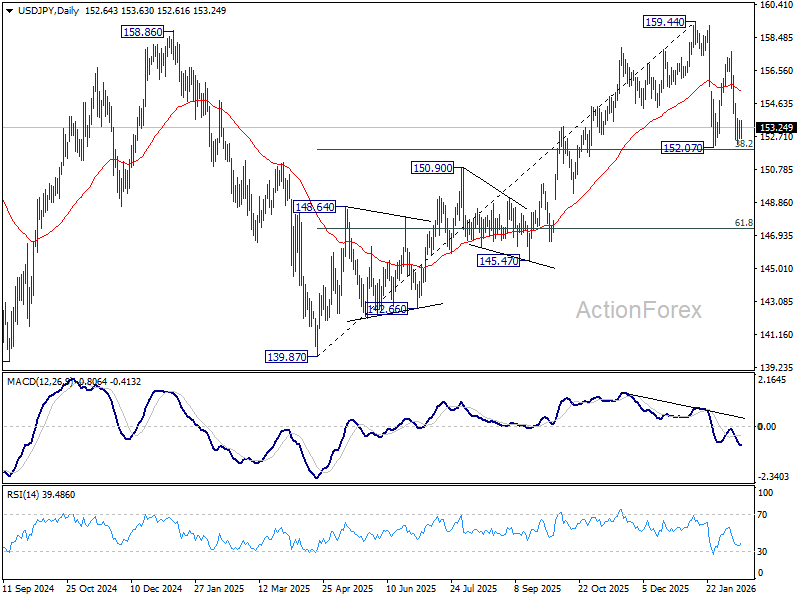
In the bigger picture, outlook is unchanged that corrective pattern from 161.94 (2024 high) should have completed with three waves at 139.87. Larger up trend from 102.58 (2021 low) could be ready to resume through 161.94. This will remain the favored case as long as 55 W EMA (now at 151.77) holds. However, sustained break of 55 W EMA will argue that the pattern from 161.94 is extending with another falling leg.
USD/CHF Mid-Day Outlook
Daily Pivots: (S1) 0.7656; (P) 0.7688; (R1) 0.7707; More….
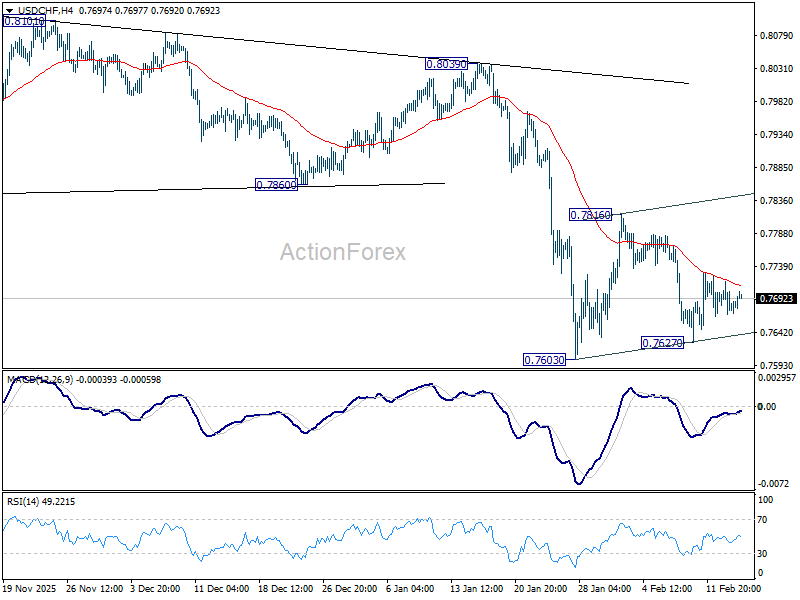
Outlook is unchanged for USD/CHF. Consolidation pattern from 0.7603 is extending and intraday bias stays neutral. Stronger rebound cannot be ruled out but upside should be limited by 55 D EMA (now at 0.7855) to complete the pattern. On the downside, break of 0.7603 will resume larger down trend, and target 0.7382 projection level next.
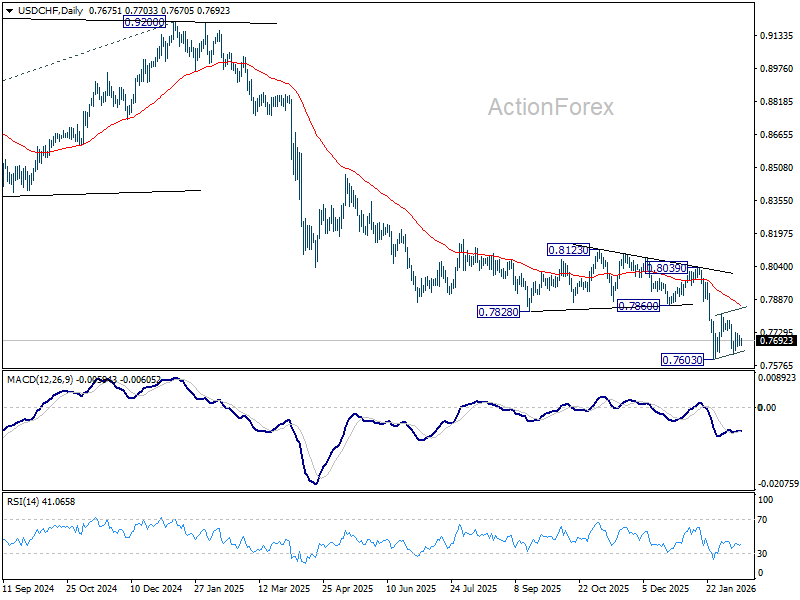
In the bigger picture, down trend from 1.0342 (2017 high) is still in progress. Next target is 100% projection of 1.0146 (2022 high) to 0.8332 from 0.9200 at 0.7382. In any case, outlook will stay bearish as long as 0.8123 resistance holds.
AUD/USD Mid-Day Report
Daily Pivots: (S1) 0.7046; (P) 0.7072; (R1) 0.7100; More...
AUD/USD recovers mildly after hitting 55 4H EMA, but stays below 0.7146 short term top. Intraday bias stays neutral at this point, and more consolidations would be seen. Deeper retreat cannot be ruled out, but downside should be contained above 0.6896 support to bring another rally. On the upside, above 0.7146 will resume larger up trend to 100% projection of 0.5913 to 0.6706 from 0.6420 at 0.7213.
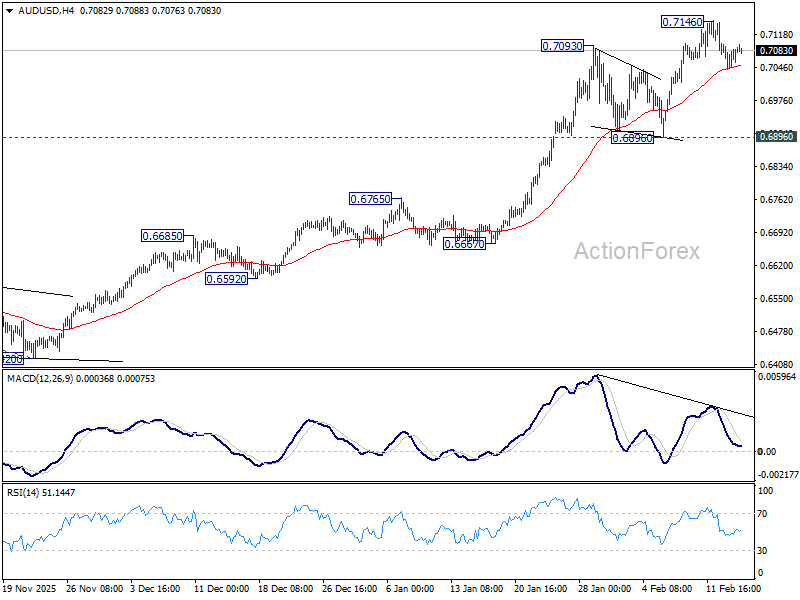
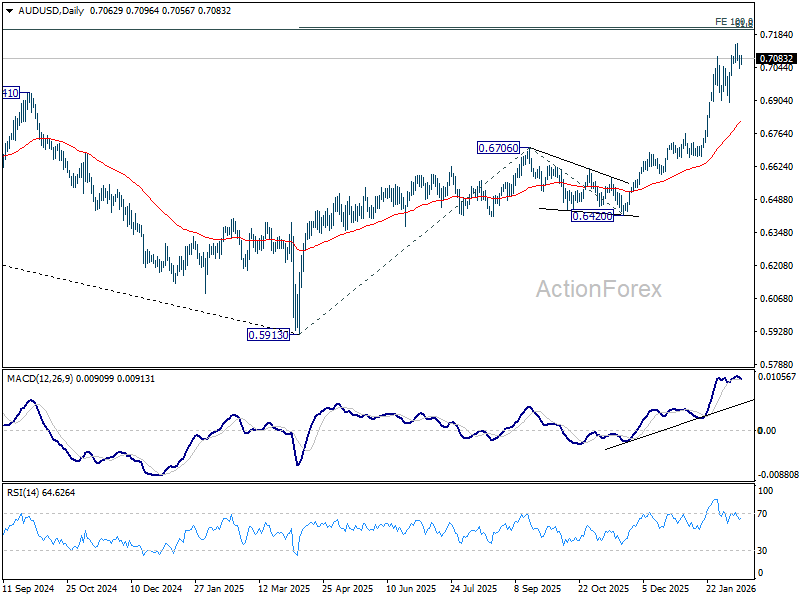
In the bigger picture, current development argues that rise from 0.5913 (2024 low) is reversing whole down trend from 0.8006 (2021 high). Further rally should be seen to 61.8% retracement of 0.8006 to 0.5913 at 0.7206. This will remain the favored case as long as 0.6706 resistance turned support holds, even in case of deep pullback.
Aussie Firms Ahead of RBA Minutes, Jobs Data to Test May Hike Bets
Aussie is mildly firmer in quiet trading, though momentum remains restrained. Broader market conditions are subdued, with most major pairs still trapped inside Friday’s ranges, reflecting wait-and-see stance. RBA February meeting minutes are due tomorrow, followed by January employment data on Thursday. These releases will help shape expectations for whether the central bank is preparing another rate hike.
After raising rates earlier this month, the key question is whether tightening cycle extends further. Markets broadly expect a 25bps hike in May, contingent on Q1 CPI confirming persistent inflation pressure. For now, that remains base case.
However, counterarguments are building too. Aussie has appreciated nearly 5% since start of year, which should help dampen import inflation. Stronger currency, combined with already tight monetary settings and restrained fiscal impulse, may cool growth momentum in coming quarters. That dynamic raises possibility that RBA could be done with policy fine-tuning. If inflation moderates faster than expected, policymakers may opt for extended pause rather than another hike.
The tone of upcoming minutes is likely to emphasize vigilance on inflation risks. Such messaging would reinforce tightening bias and lend near-term support to Aussie. Still, RBA has shown flexibility in rhetoric in recent months, adjusting tone quickly as incoming data shifts.
Ultimately, sustainable direction will hinge more on labor market strength. A firm jobs print would reinforce expectations for May tightening, while softer figures could challenge rate hike pricing.
For now, Aussie leads modest gains, followed by Dollar and Kiwi. Yen underperforms alongside Swiss Franc and Sterling, while Euro and Loonie sit mid-pack. Yet with nearly all major pairs confined to narrow ranges, meaningful direction likely awaits catalysts later this week.
In Europe. at the time of writing, FTSE is up 0.36%. DAX is up 0.01%. CAC is up 0.48%. UK 10-year yield is down -0.022 at 4.398. Germany 10-year yield is down -0.01 at 2.75. Earlier in Asia, Nikkei fell -0.24%. Hong Kong HSI rose 0.52%. China was on holiday. Singapore Strait Times rose 0.02%. Japan 10-year JGB yield rose 0.002 to 2.215.
Eurozone industrial output contracts -1.4% mom in December, capital goods drag
Eurozone industrial production fell -1.4% mom in December, slightly better than expectation of -1.5% mom, but still signaling weak momentum into year-end. .
By category, capital goods output in Eurozone dropped sharply by -1.9%, highlighting fragile business investment conditions. Production of intermediate goods edged down -0.1%, energy slipped -0.3%, and non-durable consumer goods fell -0.3%. Durable consumer goods provided limited offset, rising 0.2%.
Across the broader EU, production declined -0.8% mom. Slovakia (-4.9%), Germany (-2.9%), and Spain (-2.6%) recorded the steepest contractions, while Luxembourg (+6.4%), Sweden (+4.4%), and Malta (+4.2%) posted solid gains.
BoJ’s Ueda holds first post-election talks with Takaichi
BoJ Governor Kazuo Ueda met Prime Minister Sanae Takaichi for the first time since the LDP’s decisive election win, in talks closely watched by markets for clues on policy direction. The timing is notable, with expectations growing that inflation pressures tied to Yen weakness could accelerate interest rate normalization.
Following the meeting, Ueda described the talks as a “general exchange of views on economic and financial developments,” adding that the prime minister made no specific monetary policy requests. Pressed on whether he secured political backing for the BoJ’s rate hikes, Ueda declined to provide details, saying there was nothing he could disclose about the substance of the discussion.
Speculation has intensified in recent weeks that rising cost-of-living pressures may prompt the BoJ to consider raising rates as early as March or April. While the meeting yielded no explicit signals, the absence of public disagreement may be interpreted as tacit support for the central bank’s cautious path toward policy tightening.
Japan sidesteps technical recession as Q4 growth barely grows by 0.1% qoq
Japan’s economy narrowly avoided a technical recession in Q4, but the rebound fell short of expectations. GDP rose just 0.1% qoq, below the 0.4% forecast, though an improvement from Q3’s -0.6% contraction. On an annualized basis, growth came in at 0.2%, recovering from -2.6% but well under the expected 1.6%.
Private consumption, which accounts for more than half of output, edged up 0.1%. Demand for mobile phones provided support, though spending on food and autos declined. External demand was weak, with exports falling -0.3% qoq, dragged down by soft automobile shipments.
Investment provided modest offsets. Business spending rose 0.2%, supported by strong demand for semiconductor-manufacturing equipment, while housing investment jumped 4.8%.
NZ BNZ services falls to 50.9, employment weakness offsets sales strength
New Zealand’s BusinessNZ Performance of Services Index eased from 51.7 to 50.9 in January, slipping further below the survey’s historical average of 52.8. While the index remains marginally in expansion territory, the details reveal a mixed picture. Activity and sales improved from 52.5 to 54.2, but employment deteriorated from 49.6 to 49.1, staying firmly in contraction. New orders edged lower from 52.1 to 51.8, suggesting demand momentum is softening at the margin.
Sentiment remains subdued. The proportion of negative comments rose sharply to 58.7%, up from 50.4% in December and 52.9% in November. Respondents cited seasonal disruptions from Christmas–New Year holidays, fewer enquiries, and a prolonged post-holiday lull. Elevated living and operating costs continue to weigh on business confidence, underscoring fragile recovery conditions.
Still, BNZ Senior Economist Doug Steel struck a more constructive tone, noting that data since late 2025 has reinforced confidence that positive momentum can be sustained. While services growth is hardly robust, the economy appears to be expanding gradually.
AUD/USD Mid-Day Report
Daily Pivots: (S1) 0.7046; (P) 0.7072; (R1) 0.7100; More...
AUD/USD recovers mildly after hitting 55 4H EMA, but stays below 0.7146 short term top. Intraday bias stays neutral at this point, and more consolidations would be seen. Deeper retreat cannot be ruled out, but downside should be contained above 0.6896 support to bring another rally. On the upside, above 0.7146 will resume larger up trend to 100% projection of 0.5913 to 0.6706 from 0.6420 at 0.7213.
In the bigger picture, current development argues that rise from 0.5913 (2024 low) is reversing whole down trend from 0.8006 (2021 high). Further rally should be seen to 61.8% retracement of 0.8006 to 0.5913 at 0.7206. This will remain the favored case as long as 0.6706 resistance turned support holds, even in case of deep pullback.
Bearish Lull in the Crypto Market
Market Overview
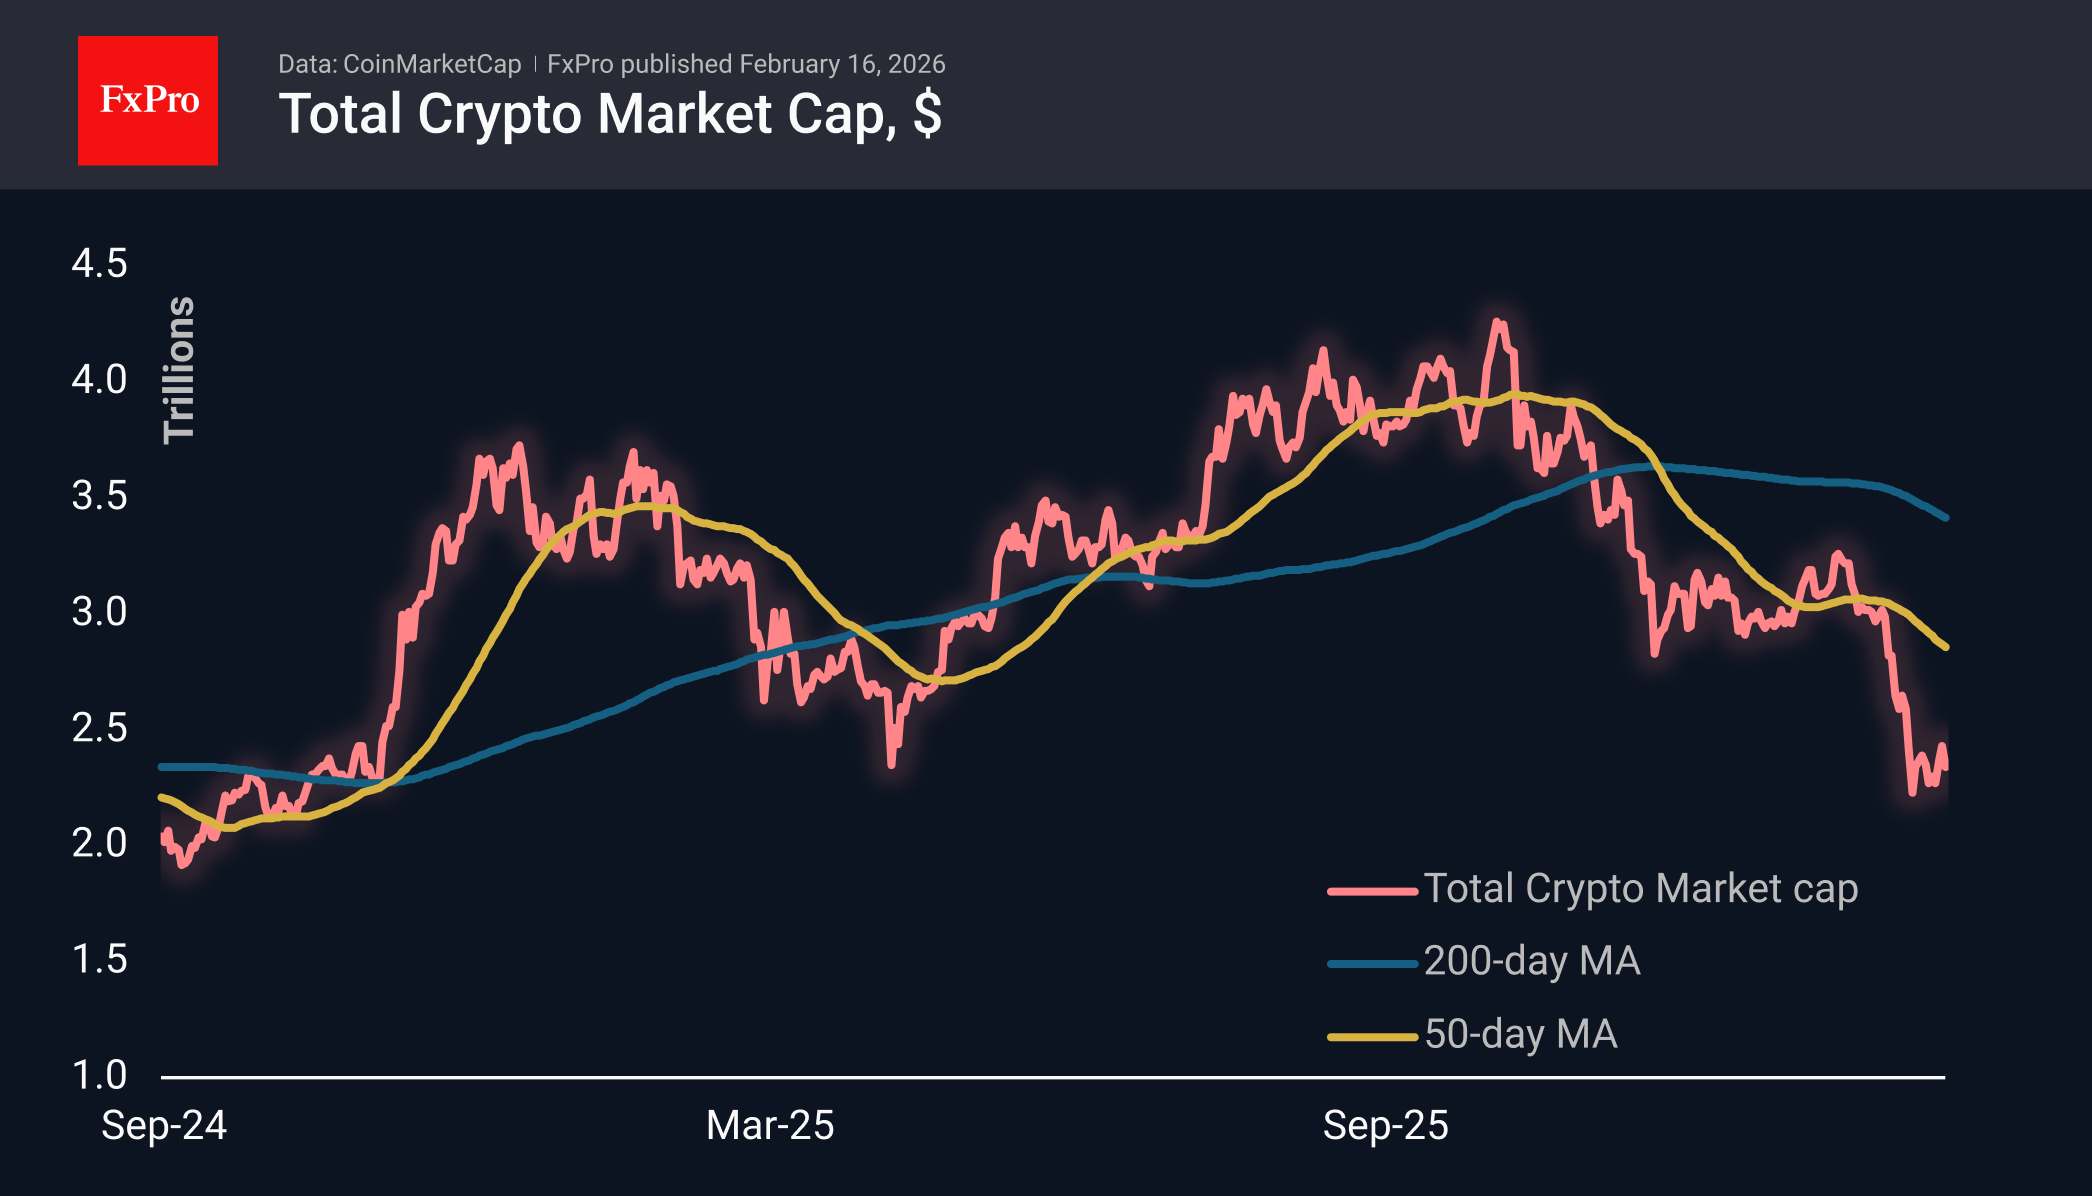
The crypto market has been in a consolidation phase for the past 10 days, trading mainly in the $2.30-2.40T range, as market forces pull it back. As a result, the total capitalisation is now roughly at the same level as a week ago, $2.35T. On closer inspection, a slight upward trend can be seen over the last few days, but it seems too fragile to rely on.
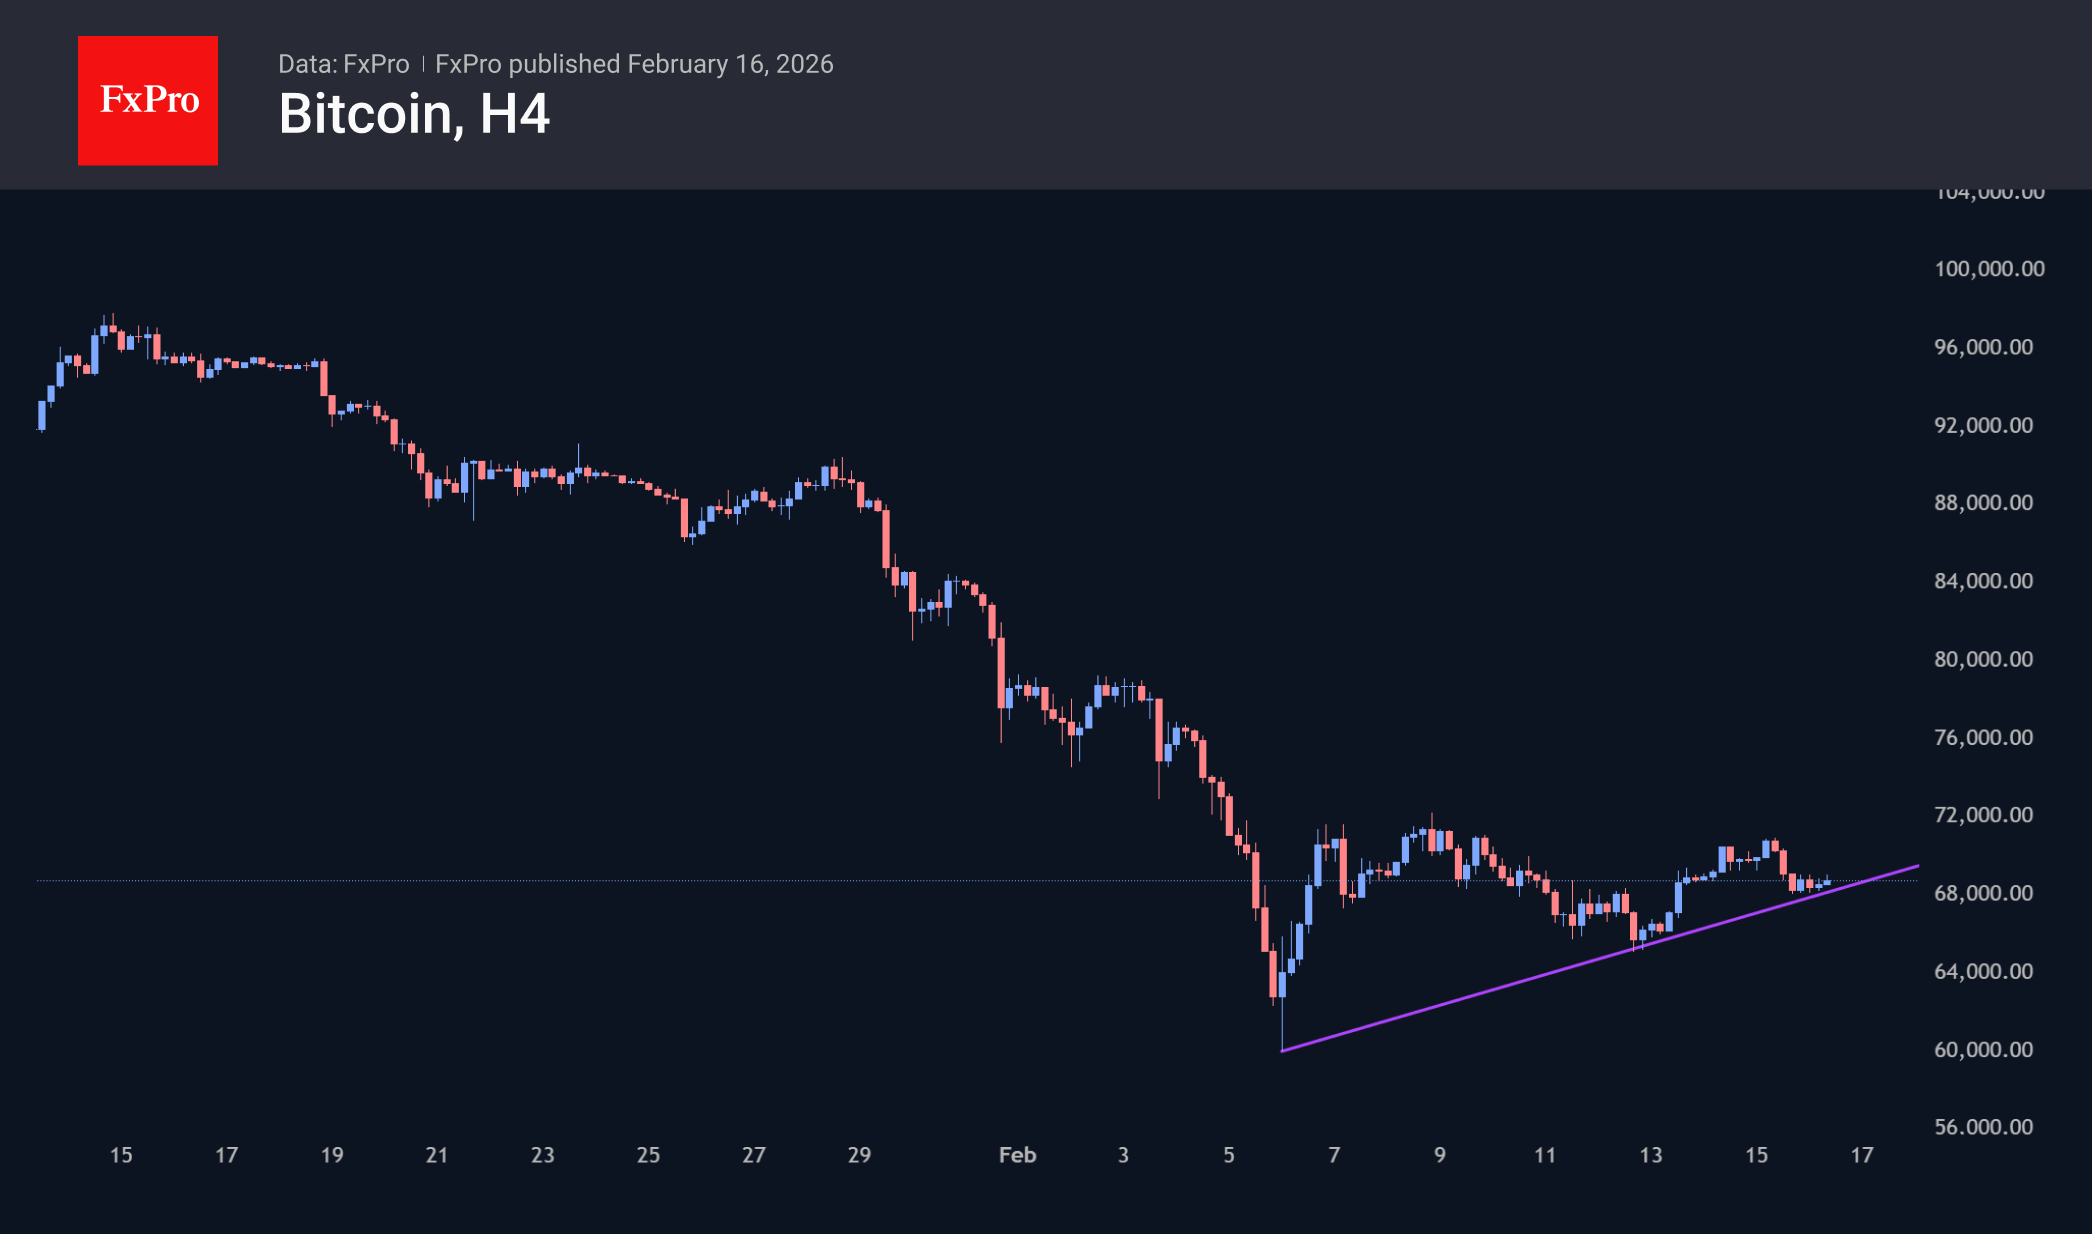
Bitcoin is trading below $69K, but since the start of the day on Monday, it has made several attempts to climb above this resistance. Taking a step back to larger ranges reveals upward support over the last 10 days, with another rebound on Monday morning and resistance at the horizontal level of $71K. Despite a series of higher highs, we view this as a bearish pause due to the weak rebound after a massive decline. Consolidation in such conditions only removes short-term oversold conditions, paving the way for further declines.
News Background
Losses for short-term Bitcoin holders over the past seven days have reached $2.3 billion, one of the largest since the 2021 crash, according to CryptoQuant. On-chain metrics do not yet confirm the formation of a structural bottom. At the same time, BTC has come close to the so-called undervaluation zone.
The crypto market is gradually laying the groundwork for a breakout from the bearish trend, according to Bitwise. The development of real asset tokenisation (RWA) and the influx of corporate investors into decentralised finance (DeFi) could be the main drivers of the cryptocurrency recovery.
Bitcoin investors should be patient, as the bullish trend will come later than expected, said Morgan Creek co-founder Anthony Pompliano. In his opinion, BTC volatility may increase in the near future due to the tense global economic situation.
The Bhutanese authorities are selling bitcoins from their reserves for the third week in a row, Arkham notes. The latest sale of 100 BTC brought in approximately $6.8 million, and the kingdom’s Arkham-identified wallets still hold ~5,600 BTC.
The largest American crypto exchange, Coinbase, reported a net loss of $667 million for the fourth quarter. The main reason for the losses is the negative revaluation of the crypto portfolio and strategic investments.
Darknet platforms are switching en masse to the anonymous cryptocurrency Monero, according to TRM Labs. The trend reversal is happening despite the mass delisting of the asset on centralised platforms.
USD/JPY: Bears Take a Breather After Almost 3% Weekly Drop
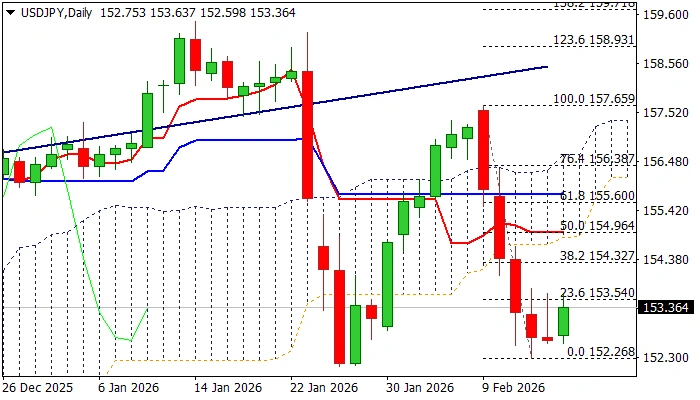
USDJPY bounced on Monday on partial profit taking after last week’s almost 3% drop (the biggest weekly loss since Nov 2024).
Weaker dollar and growing optimism after PM Takaichi’s election victory, contributed to fresh strength of Japanese currency last week.
Recovery attempts were so far repeatedly capped by initial Fibo barrier at 153.54 (23.6% of 157.69/152.26 bear-leg), suggesting that correction is likely to be limited and provide better selling levels.
Technical signals are still mixed as 14-d momentum emerged from negative zone and heads north and stochastic is reversing in oversold territory, conflicting MAs in bearish configuration.
Next good barrier above 153.54 lays at 154.32 (Fibo 38.2%), with 153.90 zone (daily cloud base / 50% retracement) expected to cap extended upticks and mark a healthy correction before bears regain control.
Massive weekly bearish candle (which also completed bearish engulfing pattern) weighs on near-term action and contributes to negative scenario.
Res: 153.75; 154.32; 154.90; 155.68.
Sup: 152.60; 152.26; 152.00; 151.05.
Aussie Dollar Fatigue? Technical Signs Hint at an AUD/USD Pullback
- Technical signs, including upper wicks and an overbought RSI, point to potential fatigue for AUD/USD.
- The long-term bullish outlook remains due to policy divergence but does not rule out a short-term correction.
- Significant volatility is expected from the upcoming RBA and Federal Reserve meeting minutes, as well as high-impact data releases from both Australia and the US.
AUD/USD has been on a tear since January 19, rallying some 500 odd pips since. The move has coincided with US dollar weakness and a renewed appetite for emerging markets and commodity linked currencies like the Australian dollar.
The current rally appears to have found a top around the 0.7150 handle before ending last week with two bearish days. This has raised the question, is a deeper correction on its way for AUD/USD?
Fundamental outlook - Central Bank policy divergence
The longer term fundamental picture still supports further Aussie dollar gains as central bank policy divergence comes into play.
The RBA has raised rates at its recent meeting with the potential for more rate hikes, while the Federal Reserve continues to eye rate cuts at some point this year.
However, in the short-term a pullback still may materialize and looking at the recent price action, there do appear to be signs to support this narrative.
Just looking at implied rates for the Fed and the RBA, and the divergence is evident. According to LSEG data, markets are pricing in around 37 bps of rate hikes for the RBA through December 2026.
RBA implied rates for 2026
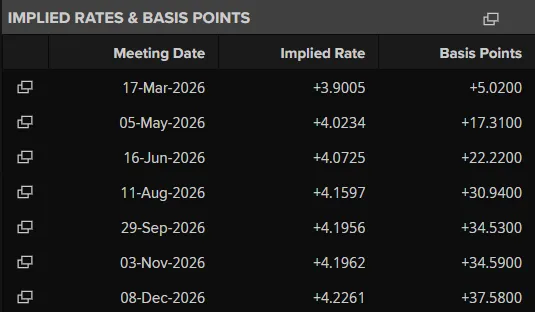
Source LSEG
Now switching to the Federal Reserve and markets are pricing in around 66 bps of rate cuts after last week's softer than expected CPI print. This leaves the Aussie dollar in pole position for more gains as the year progresses.
Federal Reserve implied rates for 2026
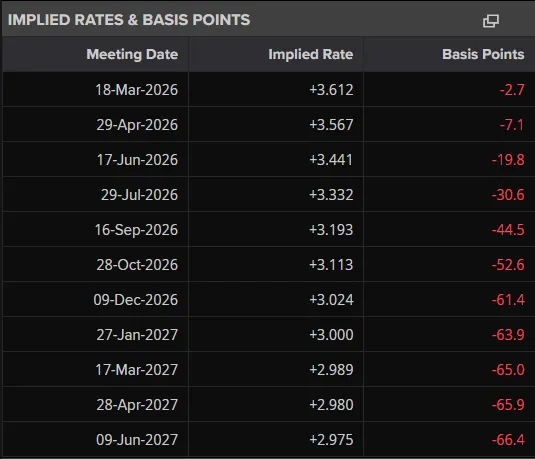
Source: LSEG
Technical Analysis - AUD/USD
From a technical point of view, the best place to start is the weekly chart.
On a weekly timeframe we have seen upper wicks which may be a sign that bullish momentum is fading.
If you couple that with the period-14 RSI which is in overbought territory.
Are these signs of fatigue?
AUD/USD Weekly Chart, February 16, 2026
Source:TradingView.com
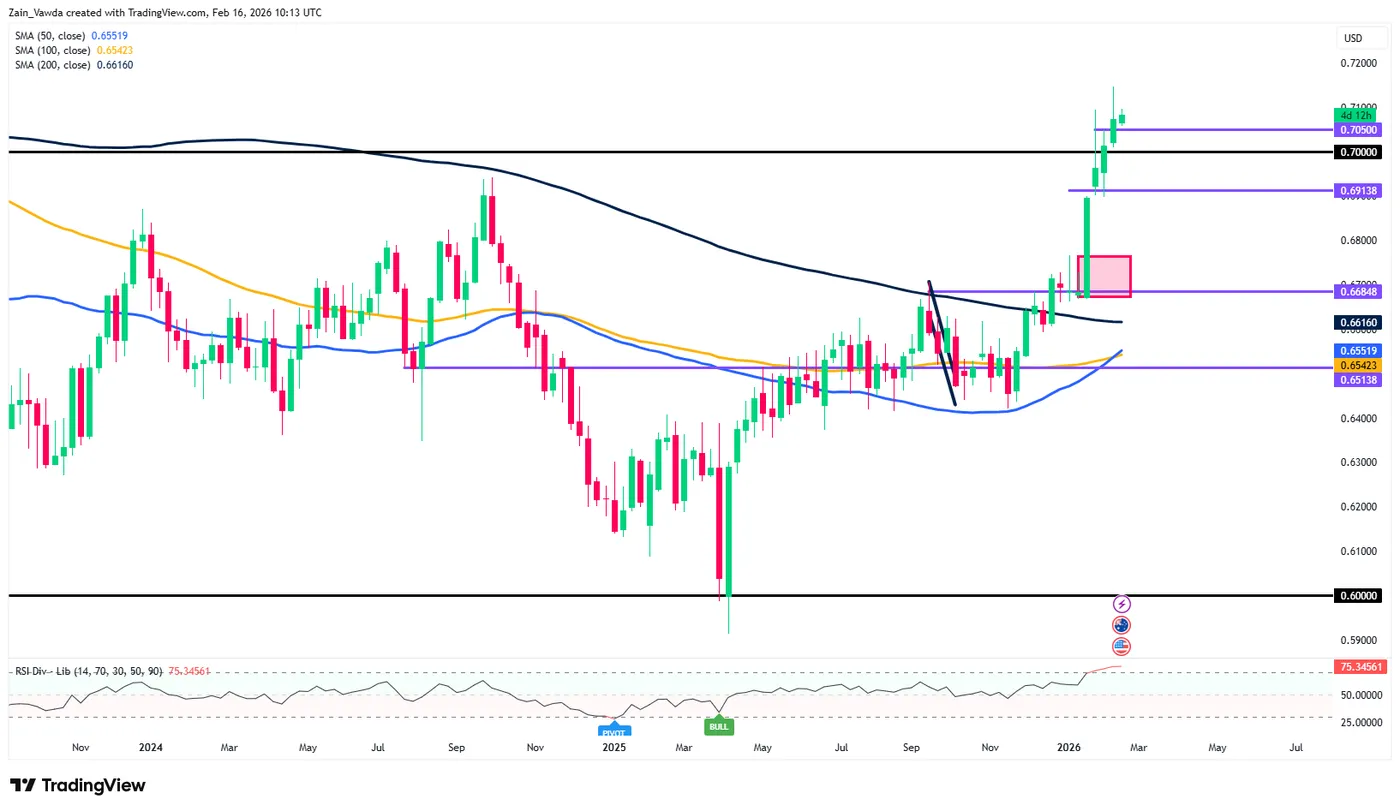
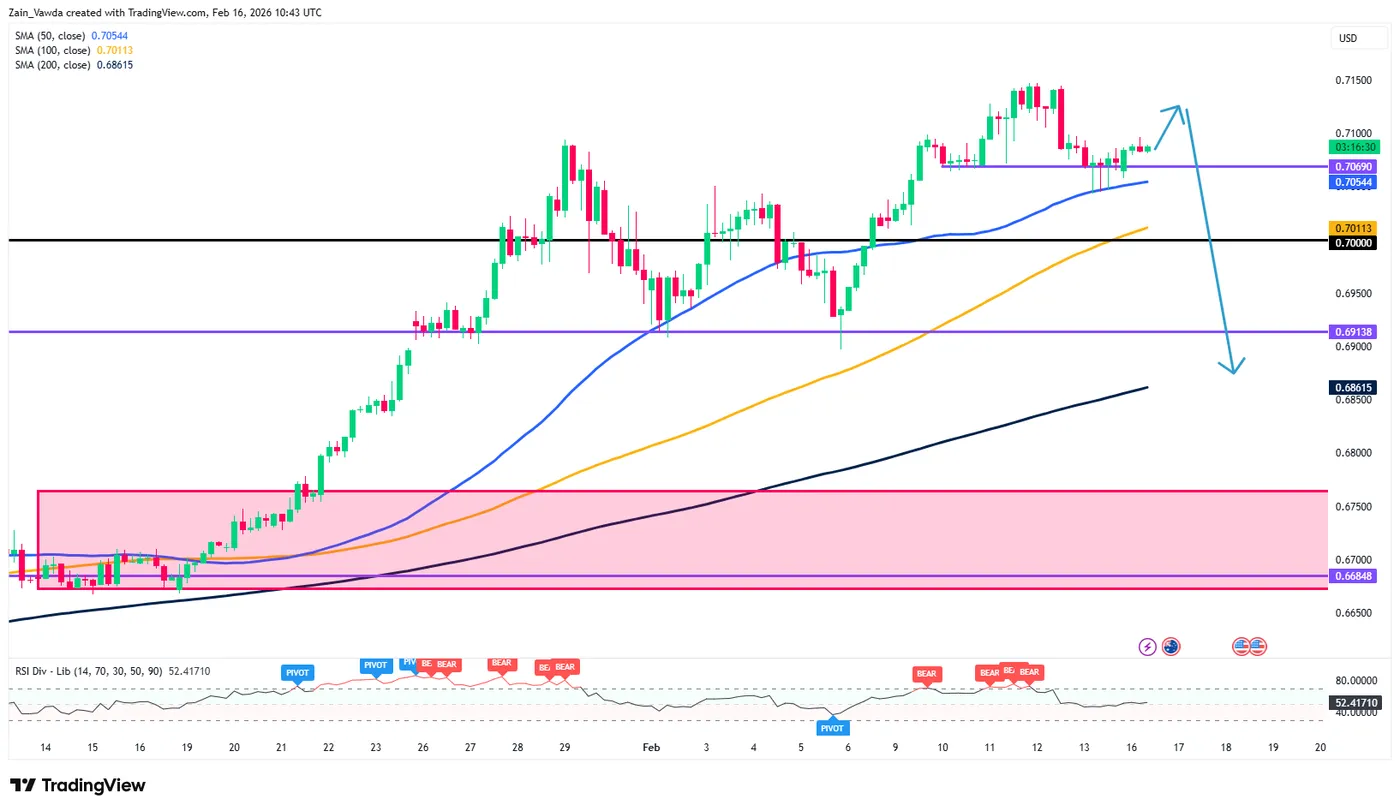
Dropping down to a four-hour timeframe, and support at 0.70690 is key.
A break of this level though still faces significant hurdles with the 50 and 100-day MAs resting just below at 0.7054 and 0.7011 respectively.
A break of these levels as well as the 0.7000 handle could open up a deeper retracement toward the 0.6913 and potentially the 200-day MA at 0.6861.
This would be considered the safety play for market participants.
The more aggressive traders may look at any move higher toward the recent highs as a potential trade opportunity.
Stops would need to go just above the recent highs with a bit of breathing room in the event of any spikes, around the 0.7170 handle.
Such a move will present a better risk-to-reward opportunity but is also a higher risk trade setup.
AUD/USD Four-Hour Chart, February 16, 2026
Source:TradingView.com
Client sentiment data - AUD/USD
Looking at OANDA client sentiment data and market participants are short on AUD/USD with 59% of traders net-short. I prefer to take a contrarian view toward crowd sentiment and thus the fact that so many traders are short means AUD/USD could rise in the near-term before a potential selloff.
Looking ahead at potential catalysts for AUD/USD
This week will bring both the RBA and Federal Reserve meeting minutes which will shed further light on the monetary policy positions moving forward. These events culd stoke significant volatility in AUD/USD.
From a data perspective, we will also get the Australian employment change data. The US has a few high impact data releases ahead with PCE, GDP and PMI data all ahead before the end of the week.
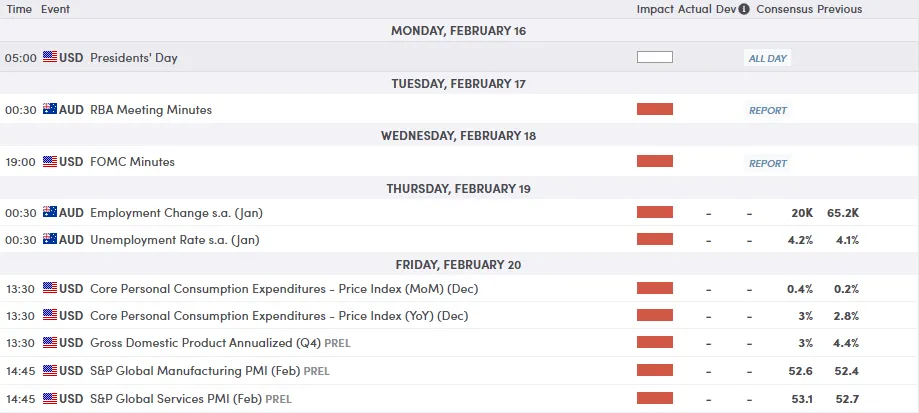
For all market-moving economic releases and events, see the MarketPulse Economic Calendar. (click to enlarge)