Sample Category Title
Japan’s nominal wages surge, yet real wages and household spending stumble
Japanese workers saw their nominal wages surge 2.5% yoy in May, significantly surpassing expected increase of 1.2% yoy. Regular pay, which includes basic salaries, rose by an impressive 1.8% yoy, marking the highest gain since February 1995. Meanwhile, overtime and other non-regular pay saw a modest increase of 0.4% yoy, while special pay including bonuses skyrocketed by 22.2% yoy.
However, inflation-adjusted real wage index tells a different story. It dropped by -1.2% yoy in May, marking a 14-month declining streak. The reduction, nonetheless, was less severe than -3.2% yoy drop experienced a month earlier. This appears to mirror the effects of pay raise agreements established during this year's "shunto" spring labor-management negotiations.
Despite these wage increases, separate data revealed that Japanese household spending fell -4.0% yoy in May , outpacing median market forecast for a -2.4% yoy drop. This decline extended for the third month and affected a range of expenses from food to clothing to transportation. On a seasonally adjusted monthly basis, household spending dipped by -1.1% mom, This represents the fourth consecutive month of decline.
BoJ’s Uchida cautions against premature policy shift
BoJ Deputy Governor Shinichi Uchida voiced caution over a hasty shift in monetary policy amid current economic climate. In an interview with Nikkei, Uchida emphasized that Japan was far from needing to hastily raise interest rates.
"The risk of missing the opportunity to achieve our 2% target with a premature policy shift is bigger than that of being too late in tightening policy and allowing inflation to continue running above 2%," Uchida explained.
Uchida noted the budding changes in Japanese companies' behavior, which have been rooted in the country's deflationary period. He stressed the importance of nurturing these developments with care. However, he cautioned that uncertainty remains high over inflation outlook, including impact of pricing behaviors and wage hikes by companies.
"We have not reached a point where we can foresee the 2 percent price stability target can be attained stably and sustainably," Uchida said. He also recognized the burden placed on households due to more than 2% rise in core CPI, reinforcing the importance of supporting the economy with current monetary easing to stabilize inflation at 2%, in tandem with wage growth.
Uchida also touched on foreign exchange rates, noting the unwanted uncertainty caused by Yen's rapid and one-sided depreciation. He highlighted the importance of stable foreign exchange rates, which should reflect economic and financial fundamentals. "The BOJ will coordinate with the government, and closely monitor developments in the foreign exchange market and their impact on the economy and prices," he added.
Cliff Notes: A Short Pause as Central Banks Near Expected Peak Rates
Key insights from the week that was.
Seeing need for time to assess the outlook after a cumulative 400bps of tightening since last May, the RBA decided to leave the cash rate unchanged in July. As discussed by Chief Economist Bill Evans, this outcome reflects a clear preference from the Board to base their next decision on updated staff forecasts and the quarterly inflation report. We do not believe this decision will give way to a prolonged pause. Instead, in August, the Board will be faced with another elevated read on inflation. We expect the headline and trimmed mean inflation measures to print at 6.3%yr and 6.1%yr respectively in Q2, more than twice the top-end of the RBA’s 2-3% medium-term inflation target.
With Governor Lowe having recently cited persistent upside risks to inflation, we believe such an outcome will lead the RBA to act in August and September, resulting in a 4.60% cash rate in September which we see as the peak. The economic consequences of such a contractionary policy stance are, in our view, material, with GDP growth to slow to just 0.6%yr in 2023 and remain well below trend in 2024 at 1.0%yr. A series of rate cuts from May 2024 through late-2025 will be required to return GDP growth to trend. For more detail on Australia’s outlook, see our latest edition of Market Outlook.
Despite the anticipated further tightening and weak outlook for activity, this week’s housing market updates were generally constructive. CoreLogic’s home value index managed to post another broad-based gain in June, at least in part thanks to weak turnover. The rise in housing finance approvals in May further highlighted borrowers interest in the market; but, whether this uptrend can be sustained given elevated and rising interest rates remains an open question. A sizeable pipeline of work is currently holding up housing construction but, abstracting for high-rise volatility, dwelling approvals' weak trend suggests housing construction activity will decline over the coming year. Housing supply is therefore likely to remain constrained to end-2024 and beyond, supporting the level of both prices and rents.
Offshore, the US was in focus this week.
The FOMC minutes emphasised that June's pause came as members sought to assess the lagged impact of tightening thus far. The decision was unanimous, though Fedspeak suggests some members were in favour of a hike – overnight Dallas Fed President Logan opined that it would have been “entirely appropriate to raise the federal funds target range at the FOMC's June meeting”.
The revised dot plot from the June meeting suggests only two members of the Committee are comfortable to leave the fed funds rate where it is, with the median expectation being two more hikes this year. However, apparent in the minute’s Committee discussion is the high degree of uncertainty clouding the outlook. As an example, while nonfarm payrolls continue to show strong momentum, averaging 339k per month the past year, other measures of employment are much softer. In particular, household employment has averaged 202k and job openings have declined by 2mn positions since March 2022, albeit from a stellar peak of 12mn.
Other forward-looking indicators of activity and employment are troubled by month-to-month volatility. The ISM services survey is a case in point. Both the headline and employment measures were robust in June, respectively 53.9 and 53.1. However, over the past year, they have each traded wide ranges, 49.2-54.0 for employment and 49.2-56.4 for activity. Also, at its current level, the activity measure is 2.8pts below the average of the 5 years preceding the pandemic. On that basis, it is unsurprising that the price measures from the ISM surveys continue to retreat, pointing to a sustained downtrend in inflation.
The ISM manufacturing survey meanwhile was unquestionably weak in June, deteriorating to 46.0, a full 8pts below the 5-year pre-pandemic average. Further, June’s weakness was broad based, as production, employment, export orders and prices all deteriorated. All manufacturing sub-indices are now in contractionary territory. While there was an improvement in new orders in the month, the sub-index is almost 11pts below its 5-year pre-COVID average.
Of the other US data to hand, new factory orders rose a modest 0.3%mth, though ex-transportation, factory orders slipped 0.5%mth. The strong 3.8%mth jump in transportation reflects broad global trends: an uptick in car manufacturing as manufacturers seek to fulfill a backlog of existing orders; and the ramping up of EV production. Residential construction spending meanwhile grew 2.1%mth in April, driving a 0.9%mth increase in total spending. Increased demand for housing and limited inventory warrant continued growth in residential construction.
Out late last Friday, China’s official NBS PMIs are also worthy of note. Both the services and manufacturing PMIs were in line with the market’s downbeat expectations at 53.2 and 49.0 and so were taken as further evidence of downside risks to the outlook. However, contrasted against the above outcomes for the US as well as China’s pre-pandemic experience, these outcomes actually speak of resilience – the NBS manufacturing survey being just 1.5pts below the average of the 5 years to 2019 against the US ISM’s -8pts. In stark contrast to the US data, Chinese manufacturing also continues to expand capacity, fixed asset investment in May up 6%yr year-to-date. Within the sector, value add is also on the rise, high-tech sector investment growing 15%yr year-to-date.
Those in the market anticipating a surge in policy measures from Chinese authorities are therefore likely to be disappointed as progress towards the Central Government’s long-term ambitions continue to be made. Instead a multi-faceted but passive approach is likely to incentivise local government authorities, SOEs and the private sector to move the economy forward.
USD/JPY Could Resume Rally, US NFP Report Next
Key Highlights
- USD/JPY remained stable above 143.50 and eyes a fresh rally.
- It is facing a key declining channel with resistance near 144.65 on the 4-hour chart.
- EUR/USD failed to clear 1.0920 and started another decline.
- The US nonfarm payrolls could change by 225K in June 2023, down from 339K.
USD/JPY Technical Analysis
The US Dollar started a downside correction from 145.00 against the Japanese Yen. USD/JPY tested the 143.50 zone and recently started a fresh increase.
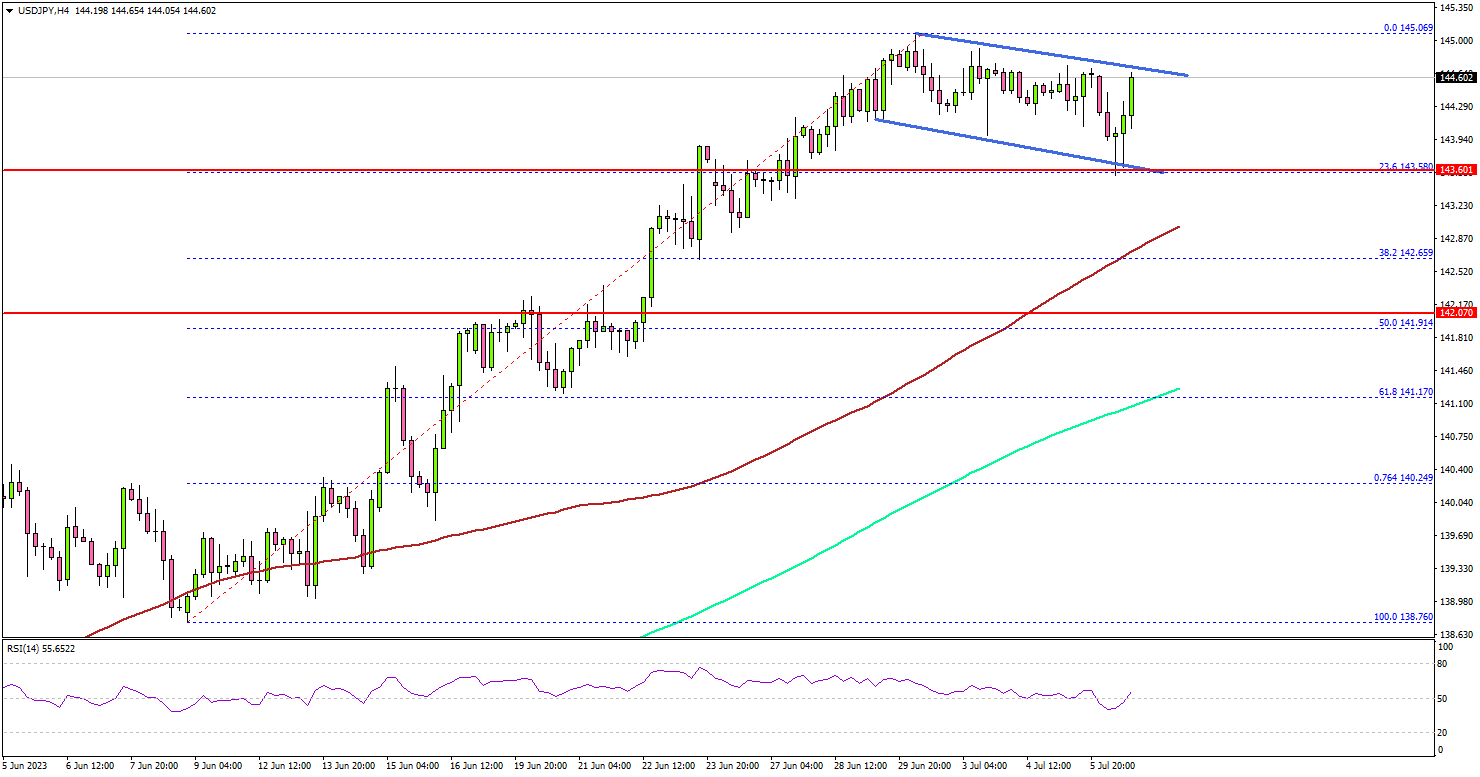
Looking at the 4-hour chart, the pair remained stable above 143.50, the 200 simple moving average (green, 4 hours), and the 100 simple moving average (red, 4 hours). The pair tested the 23.6% Fib retracement level of the upward move from the 138.76 swing low to the 145.06 high.
It is now rising and trading above the 144.00 level. It is facing a key declining channel with resistance near 144.65 on the same chart.
The next major resistance is near 145.00. If there is a move above the 145.00 resistance, the pair could rise toward 145.80. Any more gains might send the pair toward the 146.20 level.
Immediate support is near the 143.50 zone. The next major support is near the 142.80 level or the 100 simple moving average (red, 4 hours). If there is a downside break below the 142.80 support, the pair could decline toward the 50% Fib retracement level of the upward move from the 138.76 swing low to the 145.06 high or 142.00.
Looking at EUR/USD, the pair struggled to clear the 1.0920 resistance zone and the bears were able to push it lower once again.
Economic Releases
- US nonfarm payrolls for June 2023 – Forecast 225K, versus 339K previous.
- US Unemployment Rate for June 2023 - Forecast 3.6%, versus 3.7% previous.
- Canada’s employment Change for June 2023 – Forecast 20K, versus -17.3K previous.
- Canada’s Unemployment Rate April 2023 - Forecast 5.3%, versus 5.2% previous.
Dow Jones Wave Analysis
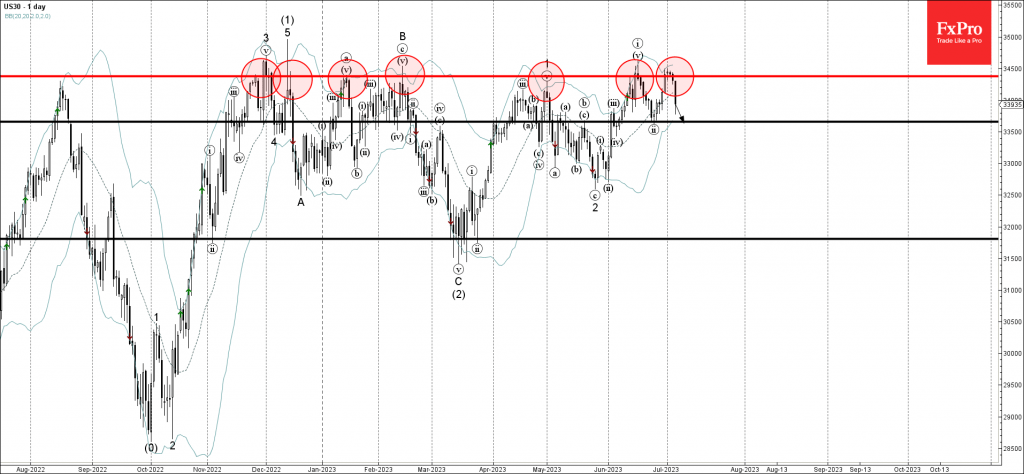
- Dow Jones reversed from powerful resistance level 34370.00
- Likely to fall to support level 33655.00
Dow Jones index recently reversed down from the powerful resistance level 34370.00, which has been repeatedly reversing the index from last November
The resistance level 34370.00 was further strengthened by the upper daily Bollinger Band.
Given the strength of the resistance level 34370.00, Dow Jones index can be expected to fall further toward the next support level 33655.00 (low of the previous minor correction (ii)).
GBPCAD Wave Analysis
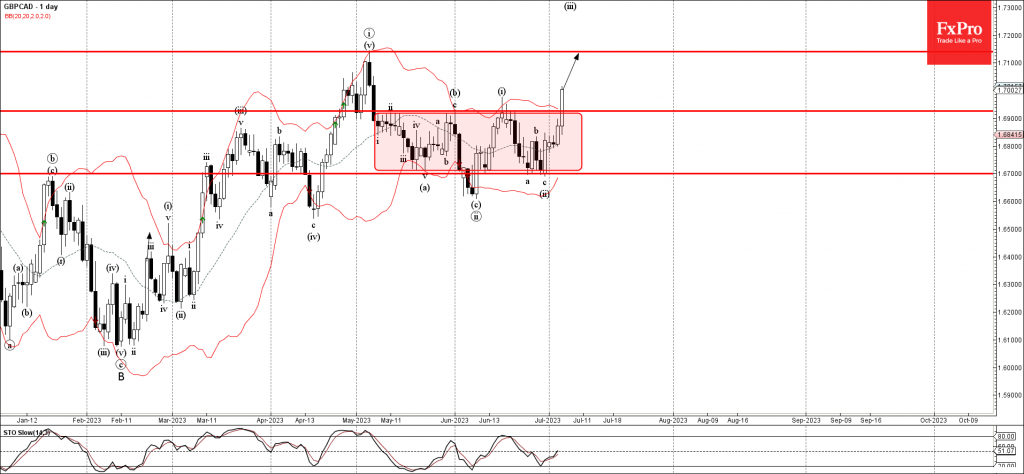
- GBPCAD broke sideways price range
- Likely to rise to resistance level 1.7140
GBPCAD currency pair recently broke out of the narrow sideways price range inside which the pair has been trading from the start of May.
The breakout of this price range accelerated the active impulse waves (iii) and iii – which belong to the multi-month impulse sequence C from February.
Given the prevailing daily uptrend, GBPCAD currency pair can be expected to rise further toward the next resistance level 1.7140 (previous monthly high from May).
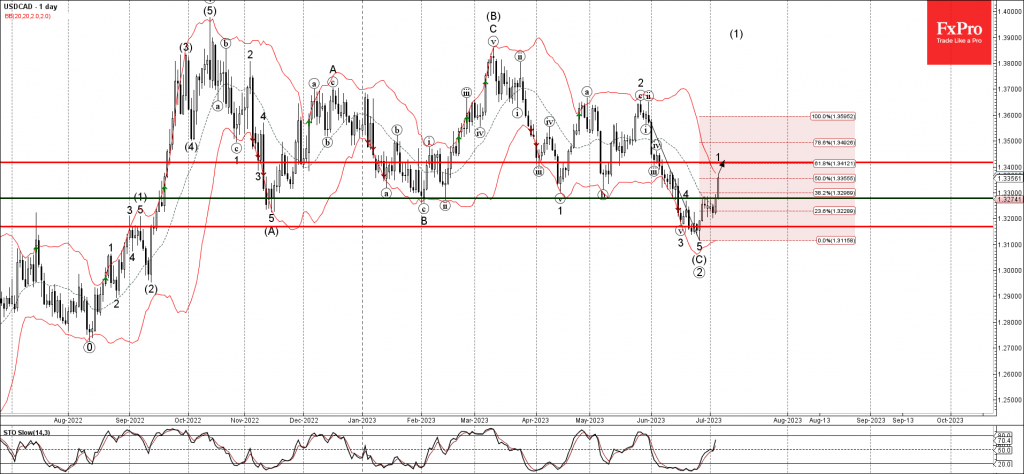
USDCAD Wave Analysis
- USDCAD broke resistance level 1.3300
- Likely to rise to resistance level 1.3400
USDCAD currency pair continues to rise inside the minor impulse wave 1, which recently broke the resistance level 1.3300 (which has been reversing the pair from last week).
The breakout of the resistance level 1.3300 coincided with the breakout of the 38.2% Fibonacci correction of the downward impulse from May.
Given the strongly bullish USD sentiment, USDCAD currency pair can be expected to rise further toward the next resistance level 1.3400 (target price for the completion of the active impulse wave 1).
Will Analysts Get NFP Right This Time?
Economists are more optimistic about how many jobs were created in the US last month. But, that might be an over-correction from consistently underestimating the resilience of the labor market this year. But, there are other factors that make predicting Friday's release a little more difficult, meaning there is more chance for volatility in the markets.
Because of the holidays earlier in the week, several key pre-NFP labor data points have been delayed. That includes ADP and JOLTS numbers. The latter is particularly important because of why the number of jobs has been consistently underestimated. All of this feeds into expectations for what the Fed might do in the coming meetings, as focus now switches to the labor market.
Why are they wrong so often?
The US labor market is in a somewhat unique situation, which we've been talking about all year. The number of open job spots far exceeds the number of people looking for work. That means that NFP numbers don't depend so much on economic factors, as personal decisions, which can be more arbitrary.
For example, the unemployment distribution in the US is not even. Nebraska has an unemployment rate of 1.9%, and, along with the Dakotas is desperate for workers. California and the District of Columbia have the highest unemployment rates, with few job opportunities. But, people are reluctant to move from the cities to the rural areas where there are vacancies. Just how many people decide to uproot and move isn't a factor that is consistent, or economically predictable, since the reasons for staying or moving are often personal.
Future trends
The last JOLTS release showed that the number of open jobs actually increased, widening the gap between openings and seekers. If that pattern persisted through late spring, then that could exaggerate the problem of accurately predicting the NFP number this time around.
The other factor is the Fed, which so far has been focused almost exclusively on inflation. That is, ignoring the second part of its mandate on maintaining full employment. The jobless rate has been pretty consistently below structural level, leading to tightness in the labor market. That pushes up labor costs, which can translate to persistently high inflation. This is a problem that Fed officials are increasingly talking about, and could indicate that the Fed will keep hiking even as inflation comes closer to target.
What the data says
The consensus is that June NFP will come in at 250K, below the 339K reported in the prior month. But the unemployment rate is expected to remain steady at 3.7%, with an unchanged participation rate.
Where focus could be turning to is the average hourly earnings, which are forecast to show growth of 4.1% annual, compared to 4.3% prior. The issue is that inflation was last reported at 4.0%, meaning that labor costs could soon be rising faster than inflation. The Fed is likely to see that as a problem, and therefore markets could react more to this figure. Higher labor costs would imply a higher chance of Fed hikes in the future.
ETHUSD Pulls Back from 2-month Peak
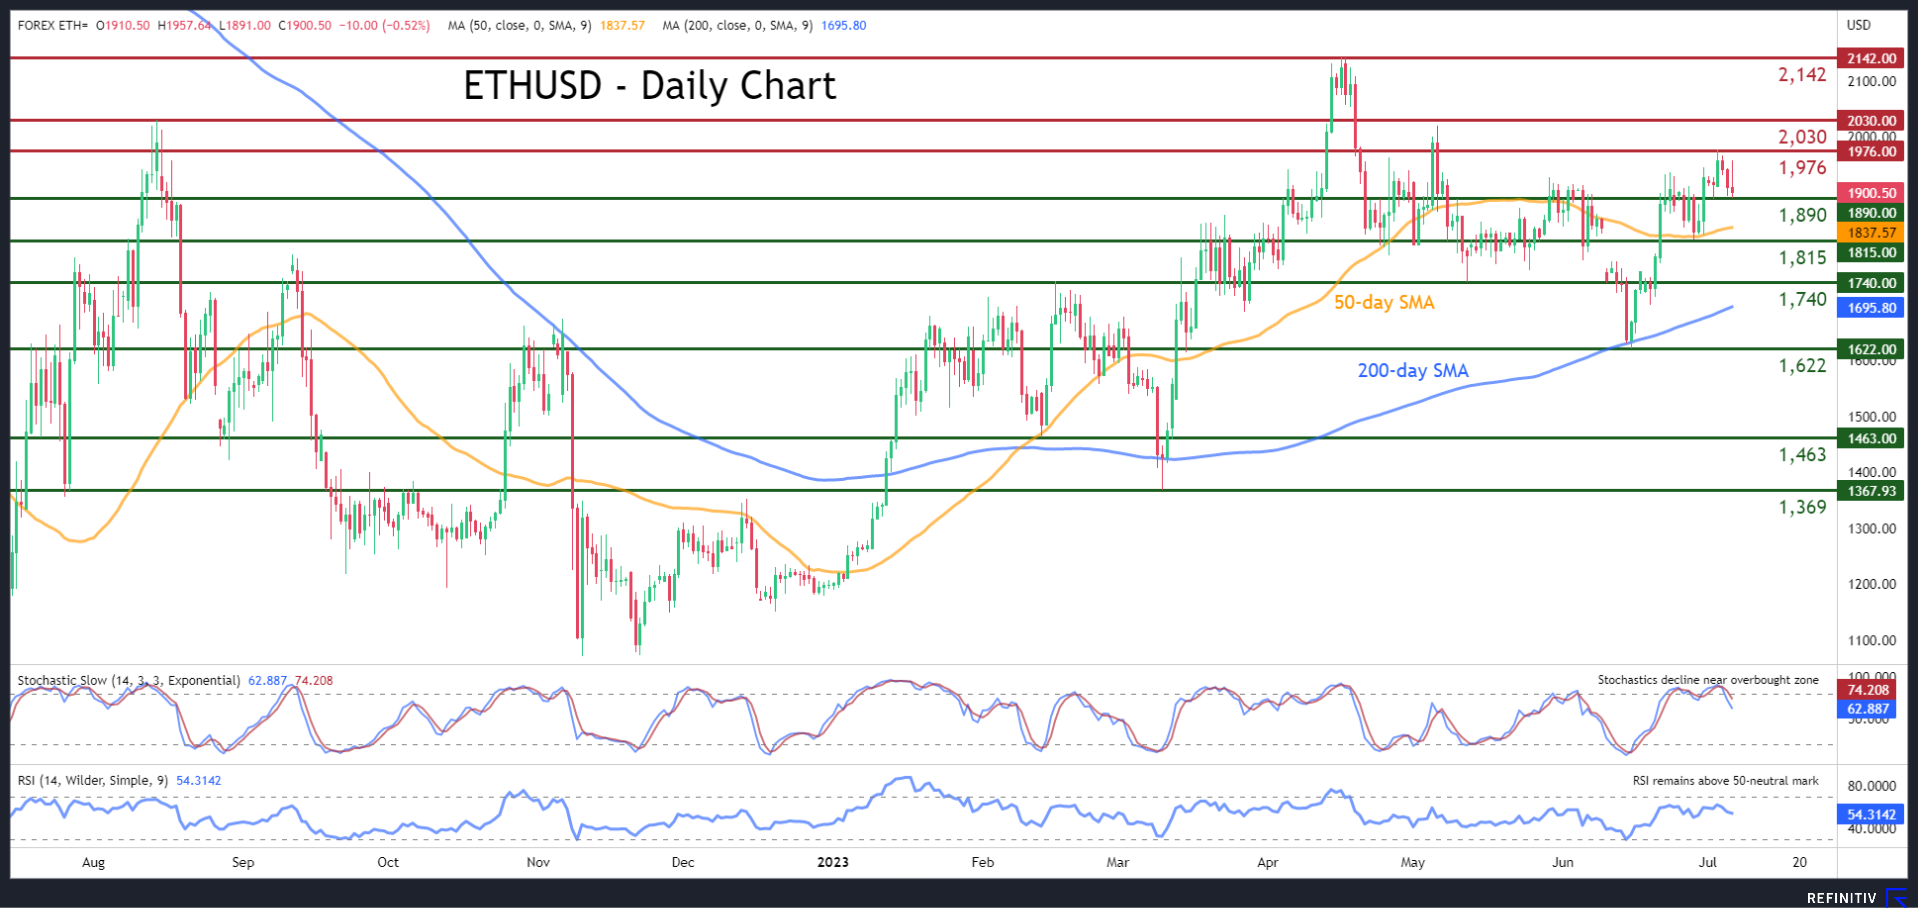
ETHUSD (Ethereum) had been in a steady advance since mid-June, posting a fresh two-month high of 1,976 on Monday. However, the digital coin quickly surrendered some gains, with the bears currently attacking the 1,900 region.
The momentum indicators currently suggest that bullish forces are subsiding but have not totally surrendered yet. Specifically, the stochastic oscillator is ticking down near its overbought zone, while the RSI is losing some ground but holds comfortably above its 50-neutral mark.
Should sellers try to push the price lower, the recent support of 1,890 could act as the first line of defense. Dipping beneath that wall, the price might slide towards the 50-day simple moving average (SMA), a violation of which could open the door for the 1,815 hurdle. Even lower, the May bottom of 1,740 may prove to be the next obstacle for sellers to overcome.
On the flipside, bullish actions could propel the price towards the recent two-month high of 1,976. If that barricade fails, the bulls might aim for the August 2022 peak of 2,030. Failing to halt there, the digital coin could ascend to challenge the one-year high of 2,142.
Overall, ETHUSD has been experiencing a correction from its recent high, but it has failed to post a fresh lower low so far. If that scenario materializes, we could see further losses for Ethereum.