

Sample Category Title
Jobs Surprise
497’000 is the number of private jobs that the US economy added last month. 497’000. The number of quits rose to 250’000. But happily, the job openings fell by almost half a million, and more importantly for the Federal Reserve (Fed) – who is fighting to abate inflation and not necessarily jobs, the sector that saw the biggest jobs gains – which is leisure and hospitality which accounted for more than 230’000 of the jobs added – also saw the sharpest decline in annual pay growth. The pay for this sector’s workers grew 7.9% last year, down from 8.4% printed a month earlier. But that detail went a bit unheard, and under the shadow of the stunning 497’000 new jobs added. And the too-strong ADP report that, again, hinted at a too-resilient US jobs market to the Fed’s very aggressive rate hikes, ended up further fueling the Fed rate hike expectations. The US 2-year yield spiked above 5%, and above the peak that we saw before the mini banking crisis hit the US in March, while the 10-year yield took a lift as well, and hit 4%, on indication that, recession doesn’t look around the corner… at least if you follow the US jobs numbers.
So today, the official US jobs data could or could not confirm the strength in the ADP figures, but we are all prepared for another month of strong NFP data, and lower unemployment. If anything, we could see the wages growth slow. If that’s the case, investors could still have a reason to see the glass half full and bet that the US economy could achieve the soft landing that it’s hoping for.
Equities pressured
The S&P500 and Nasdaq fell yesterday as the US yields spiked on expectation that the Fed won’t stop hiking rates with such a strong jobs data, as such a strong jobs market means resilient consumer spending, which in return means sticky inflation.
Other data confirmed the US’ economy’s good health as well. ISM services PMI showed faster-than-expected growth and faster-than-expected employment, and slower but higher-than-expected price growth in June. If we connect the dots, the US manufacturing is slowing but services continue to grow, and services account for around 80% of the US economic activity, so no wonder the US jobs data remains solid and consumer spending remains resilient, and the US GDP growth comes in better than expected, and we haven’t seen that recession showing up its nose yet.
But the darker side of the story is, this much economic strength means sticky inflation, and tighter monetary conditions, and the dirty job of pricing it is done by the sovereign markets. And many investors think that when there is such a divergence of opinion between stock and bond traders, bond traders tend to be right.
But at the end of the day, the stock market’s performance will depend on how much pain the Fed will put on the Wall Street from the balance sheet reduction. If the Fed just continues hiking the rates and do little on the balance sheet front, it will only hit Main Street, and there will be no reason for the equity rally to stall. Voila.
USD/CAD Daily Outlook
Daily Pivots: (S1) 1.3304; (P) 1.3339; (R1) 1.3402; More....
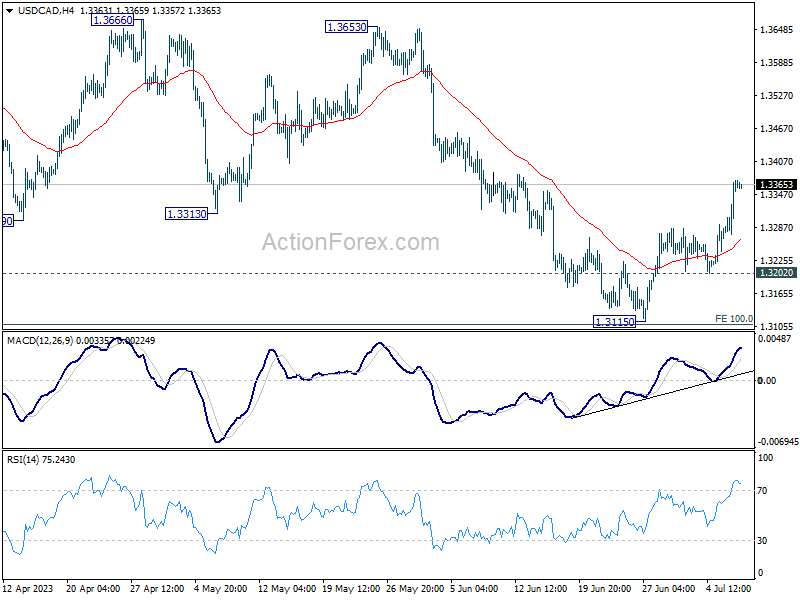
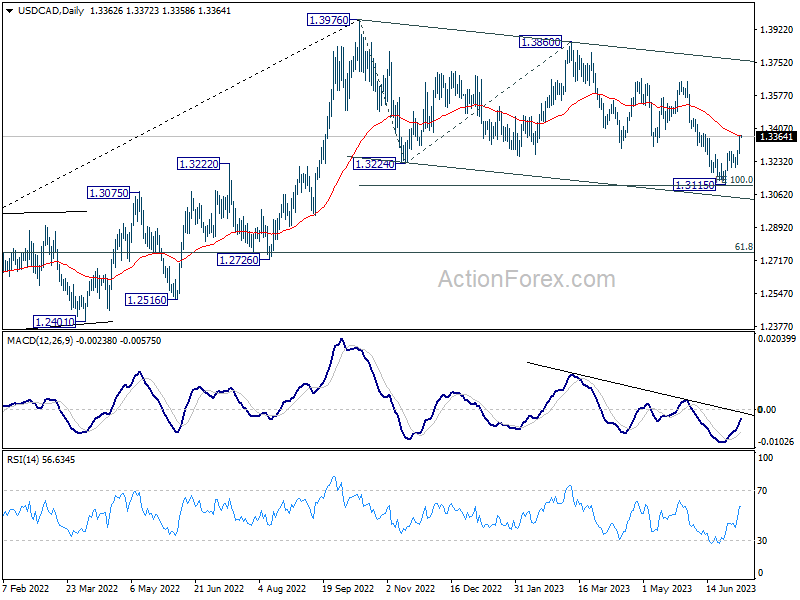
USD/CAD's rebound from 1.3115 short term bottom extended higher and it's now pressing 55 D EMA (now at 1.3369). Intraday bias stays on the upside for the moment. Sustained trading above 55 D EMA will argue that whole corrective pattern from 1.3976 has completed with three waves down to 1.3115. Further rally should then be seen to 1.3653 resistance next. Nevertheless, break of 1.3202 support will bring retest of 1.3115 low instead.
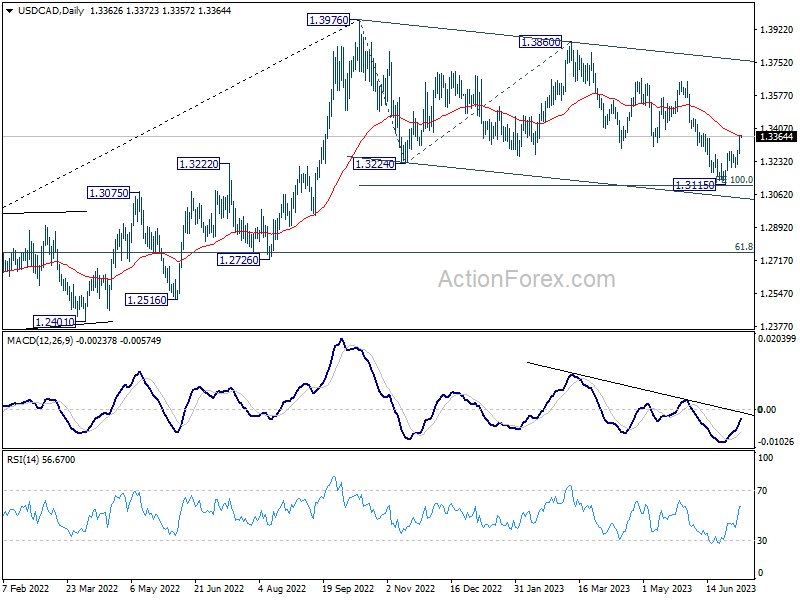
In the bigger picture, price actions from 1.3976 are viewed as a correction to up trend from 1.2005 (2021 low) only. Hence, the up trend is in favor to resume through 1.3976 at a later stage. Nevertheless, another fall below 1.3115 will extending the decline from 1.3976 to 61.8% retracement of 1.2005 to 1.3976 at 1.2758, and raise the chance of bearish trend reversal.
AUD/USD Daily Report
Daily Pivots: (S1) 0.6587; (P) 0.6638; (R1) 0.6676; More...
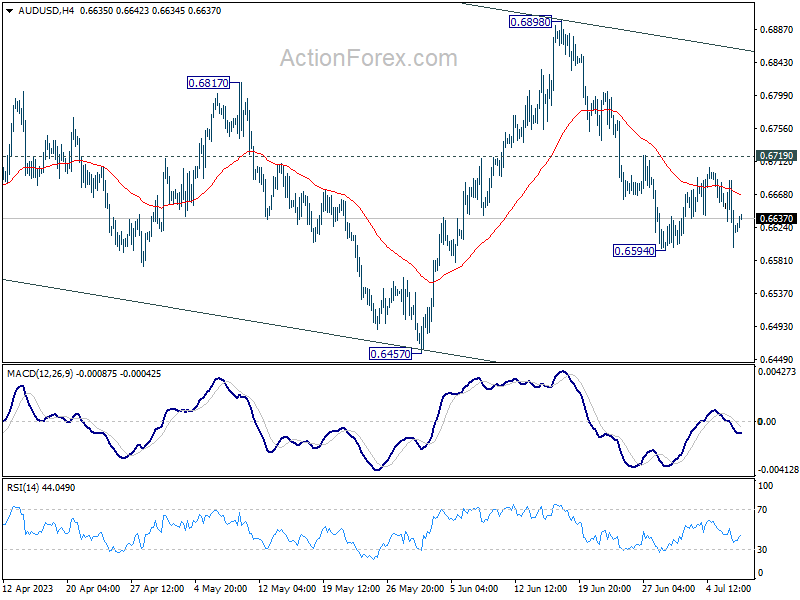
AUD/USD recovered ahead of 0.6594 support and intraday bias remains neutral first. More consolidations could still be seen. With 0.6710 resistance intact, further decline is in favor. On the downside, break of 0.6594 will resume the decline from 0.6898 to 0.6457 support next. Nevertheless, firm break of 0.6719 will turn bias back to the upside for stronger rebound.
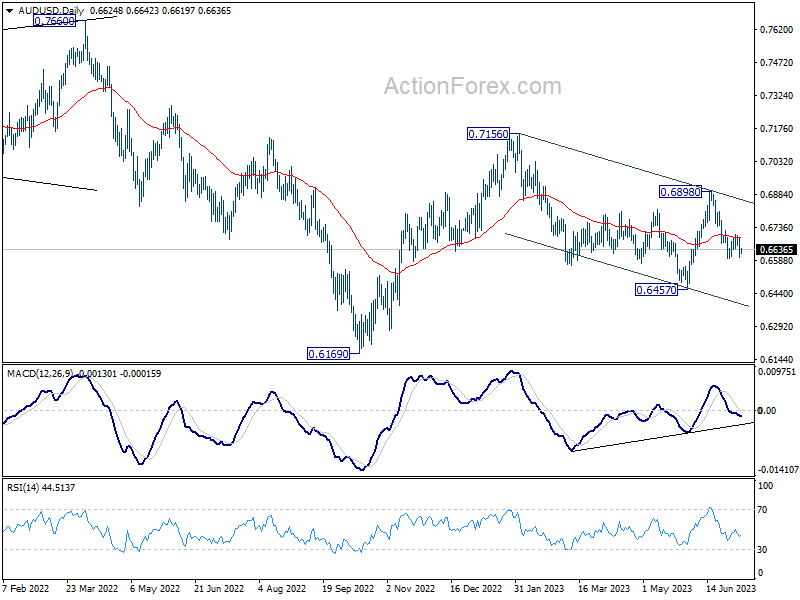
In the bigger picture, price actions from 0.7156 are seen as a correction to the rebound from 0.6169 only, rather than part of larger down trend from 0.8006 (2021 high). Break of 0.6457 could be seen but downside should be contained above 0.6169. This will now remain the favored case as high as 0.6898 resistance holds. Nevertheless, break of 0.6898 resistance will argue that rise form 0.6169 is ready to resume through 0.7156.
EUR/USD Daily Outlook
Daily Pivots: (S1) 1.0851; (P) 1.0875; (R1) 1.0917; More...
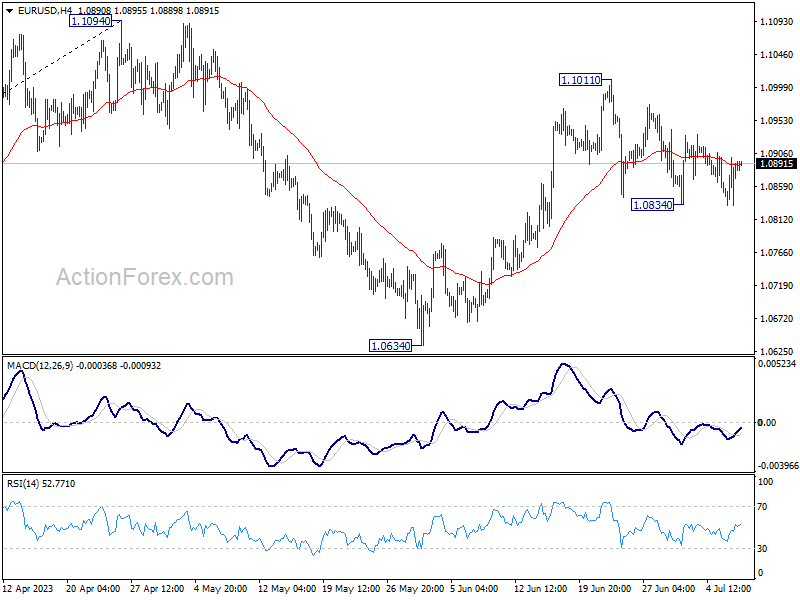
Range trading continues in EUR/USD and intraday bias remains neutral at this point. Further rise is still mildly in favor. On the upside, break of 1.1011 will resume the rise from 1.0634 and target 1.1094 resistance. Decisive break there will resume larger up trend from 0.9534 to 1.1273 fibonacci level. However, firm break of 1.0834 will turn bias to the downside for 1.0634 support instead.
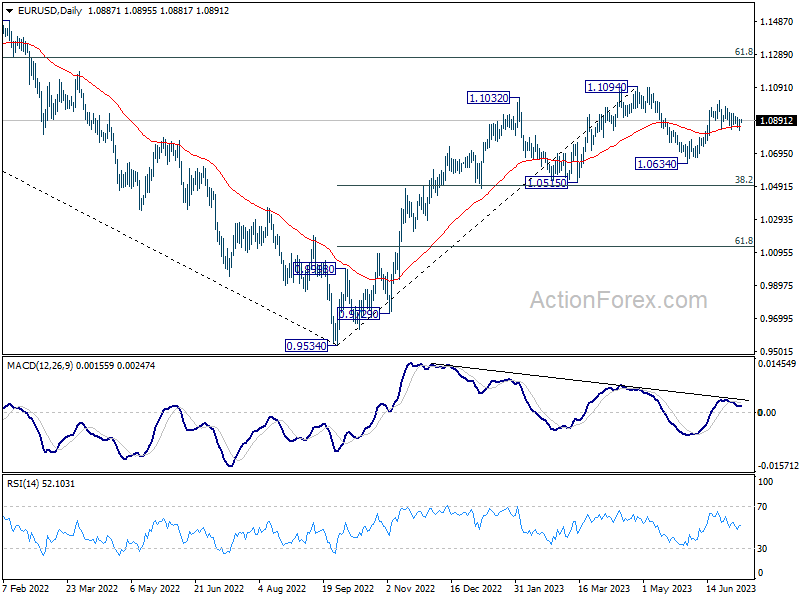
In the bigger picture, as long as 1.0515 support holds, rise from 0.9534 (2022 low) would still extend higher. Sustained break of 61.8% retracement of 1.2348 (2021 high) to 0.9534 at 1.1273 will solidify the case of bullish trend reversal and target 1.2348 resistance next (2021 high).
GBP/USD Daily Outlook
Daily Pivots: (S1) 1.2682; (P) 1.2731; (R1) 1.2789; More...
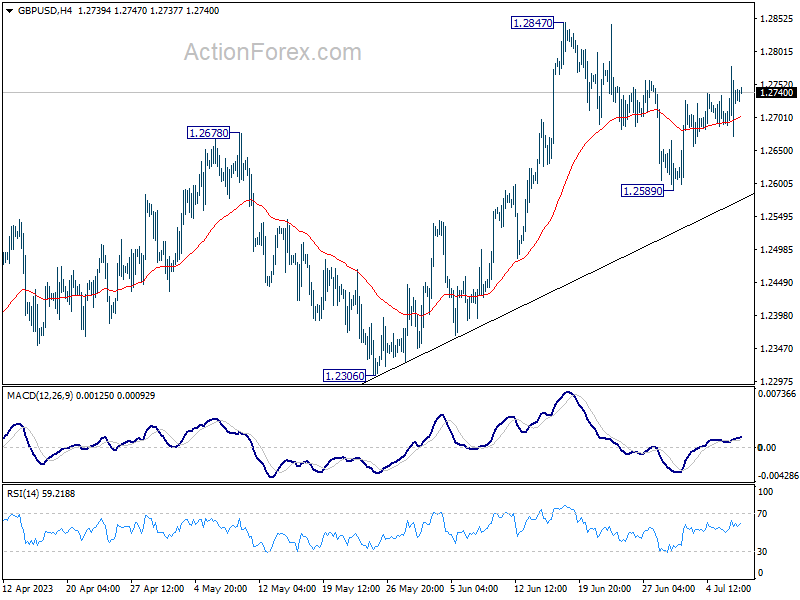
Intraday bias in GBP/USD stays neutral at this point as consolidation from 1.2847 is extending. On the upside, firm break of 1.2847 will resume larger up trend from 1.0351 to 61.8% projection of 1.0351 to 1.2445 from 1.1801 at 1.3095. On the downside, though, break of 1.2589 will extend the fall from 1.2847 to 55 D EMA (now at 1.2558).
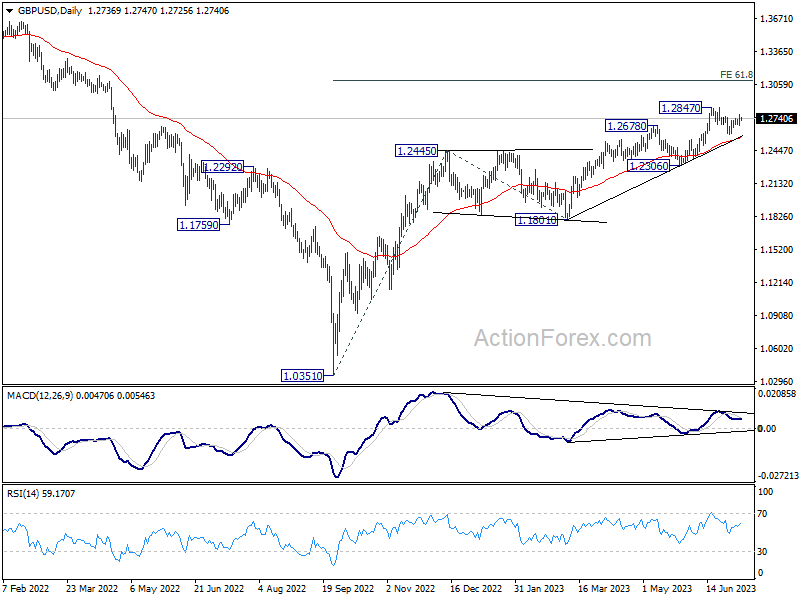
In the bigger picture, the strong support from 55 W EMA (now at 1.2341) is a medium term bullish sign. Outlook will stay bullish as long as 1.2306 support holds. Rise from 1.0351 medium term bottom (2022 low) is expected to extend further to retest 1.4248 key resistance (2021 high).
USD/CHF Daily Outlook
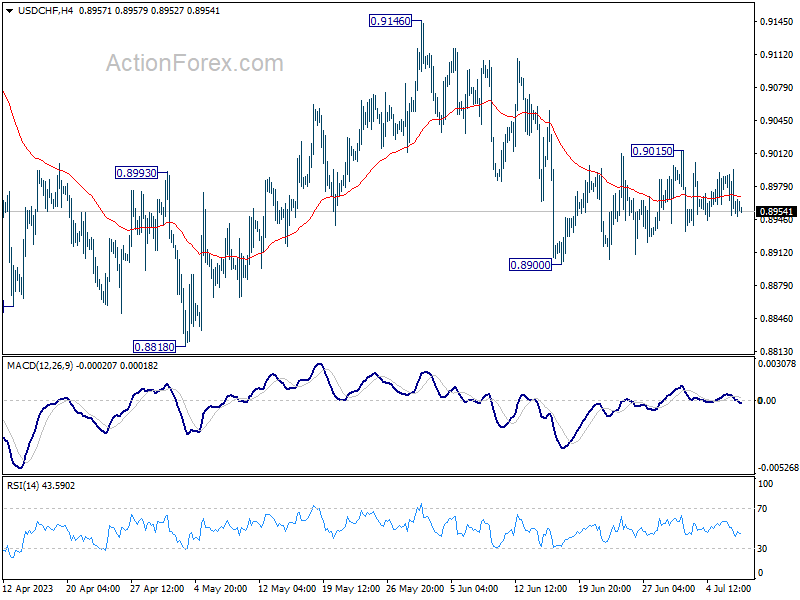
Daily Pivots: (S1) 0.8936; (P) 0.8968; (R1) 0.8984; More...
No change in USD/CHF's outlook as consolidation from 0.8900 is extending. Intraday bias stays neutral and further decline is expected. On the downside, break of 0.8900 will resume the fall from 0.9146 to 0.8818 low or below. On the upside, above 0.9015 will bring stronger rise towards 0.9146 resistance instead.
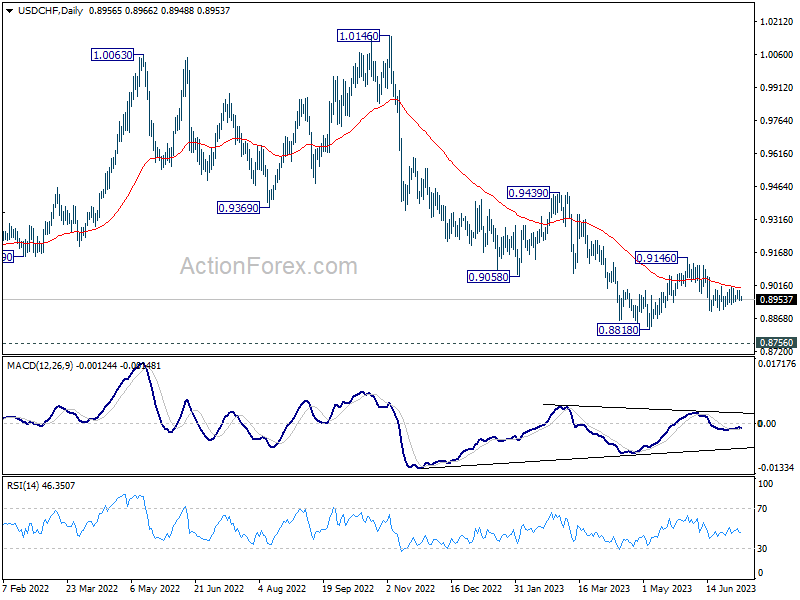
In the bigger picture, fall from 1.1046 (2022 high) is seen as a leg in the long term range pattern from 1.0342 (2016 high). While further decline cannot be ruled out, strong support is expected from 0.8756 long term support to bring reversal. Firm break of 0.9146 resistance should confirm medium term bottoming.
Technical Outlook and Review
DXY:
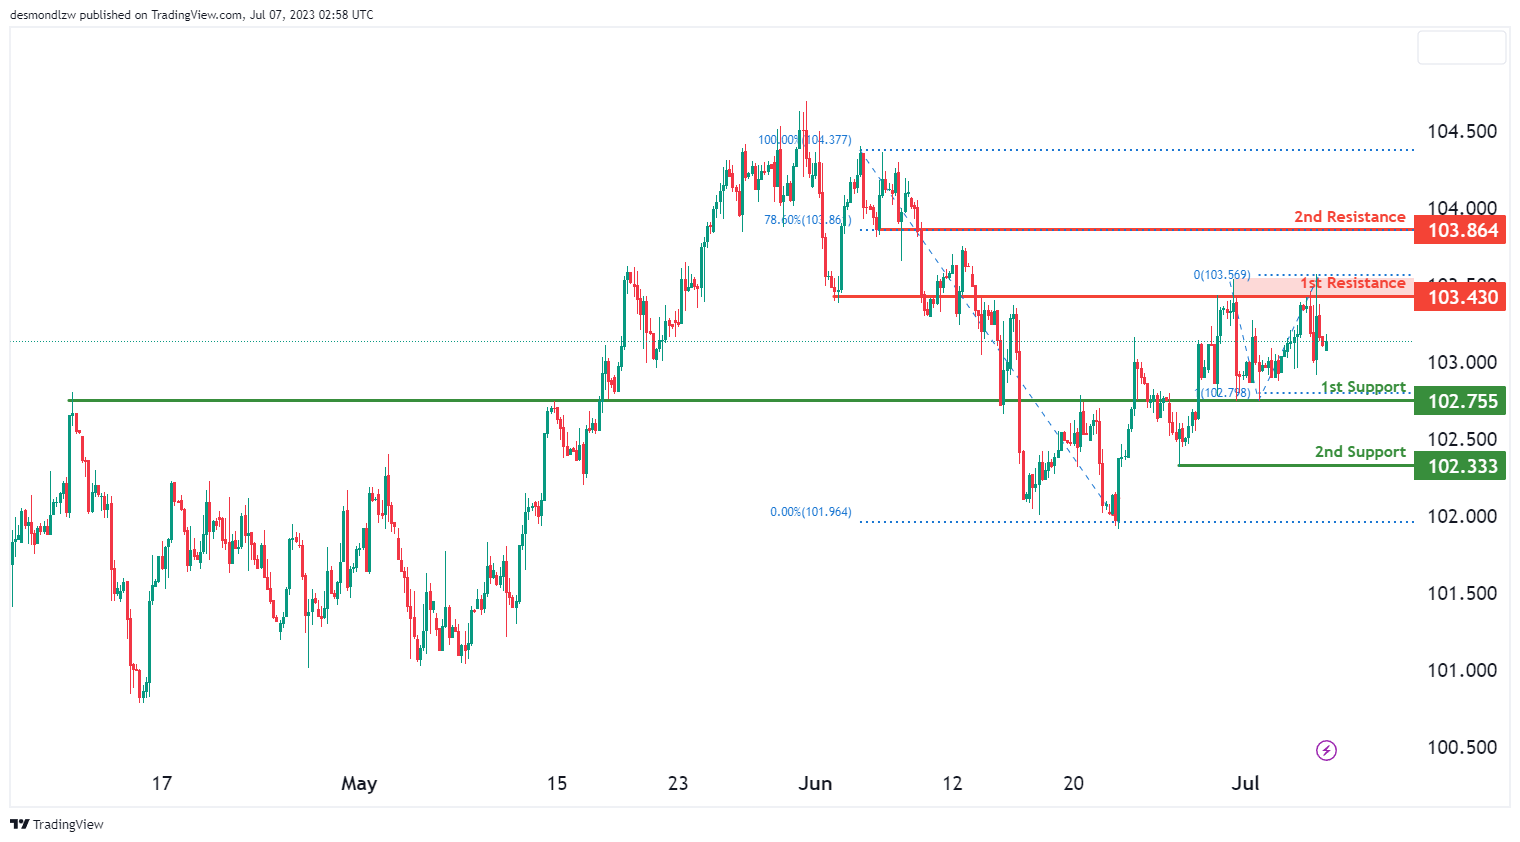
The DXY chart indicates a prevailing bearish momentum, implying a likelihood of further downward movement in the market. The price has the potential for a bearish continuation, targeting the 1st support level located at 102.75. This support level is significant as it aligns with an overlap support and corresponds to a 100% Fibonacci Retracement level. Furthermore, the 2nd support at 102.33 serves as a swing low support, adding to its significance.
In terms of resistance levels, the 1st resistance at 1103.43 represents a prominent area of price resistance, characterized by overlap resistance. Conversely, the 2nd resistance at 103.86 acts as a pullback resistance, substantiated by its association with a 78.60% Fibonacci Retracement level.
EUR/USD:
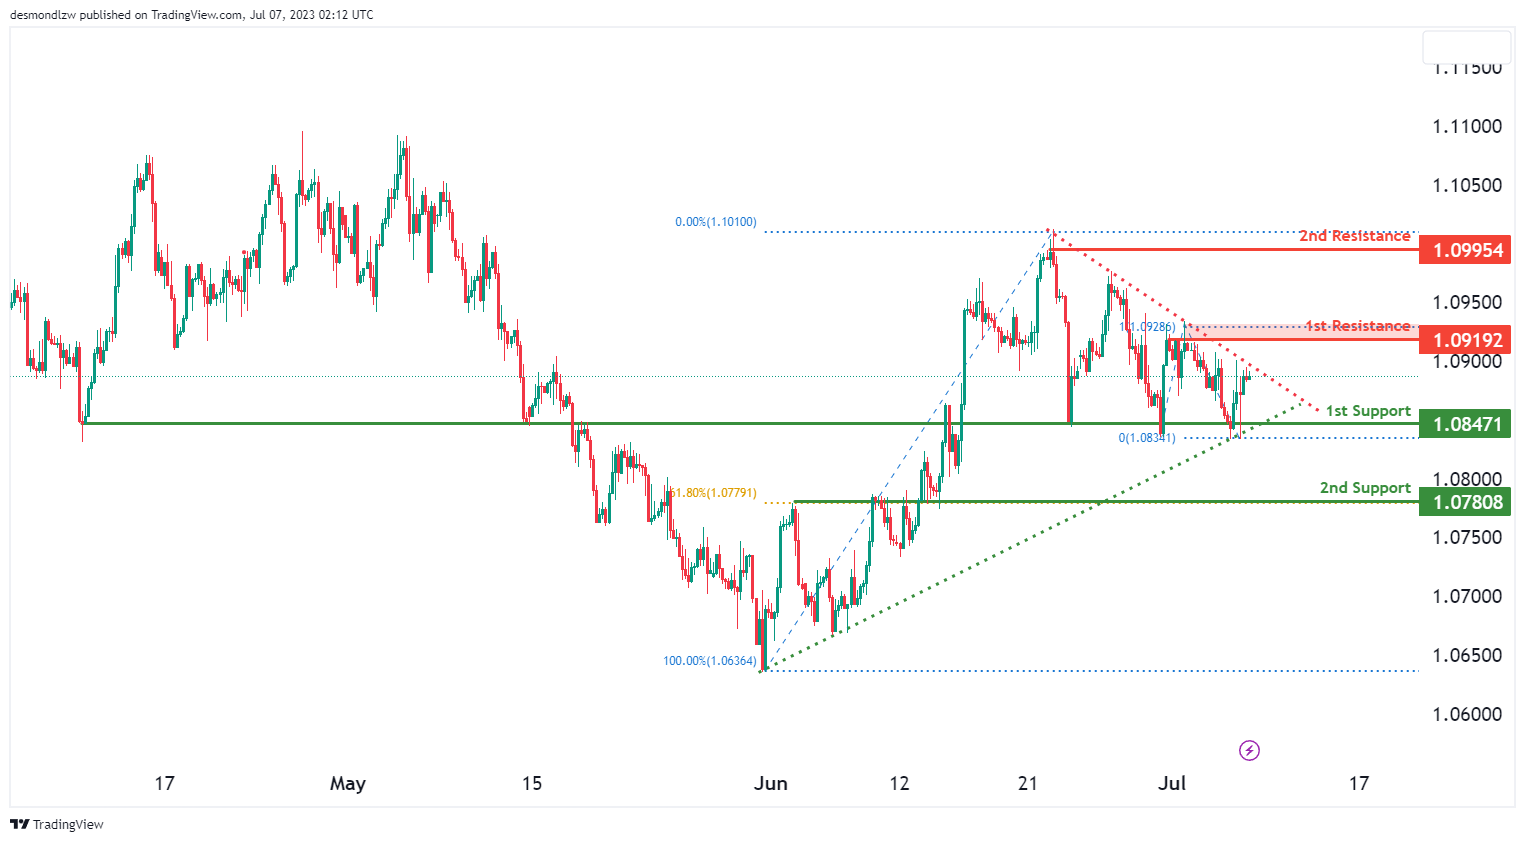
The EUR/USD chart currently exhibits a neutral momentum, indicating a lack of clear direction in the market. There is a possibility of price fluctuating between the 1st support level at 1.0847, which is an ov
erlap support, and the 1st resistance level at 1.0919, representing a multi-swing high resistance with a 100% Fibonacci Retracement. The 2nd support level at 1.0780 serves as an additional overlap support, while the 2nd resistance level at 1.0995 is a swing high resistance.
Furthermore, the presence of a symmetrical triangle chart pattern suggests a period of consolidation, potentially preceding a breakout or breakdown. A bullish breakout may occur if the upper trendline is breached, while a bearish breakdown may happen if the lower trendline is breached.
EUR/JPY:
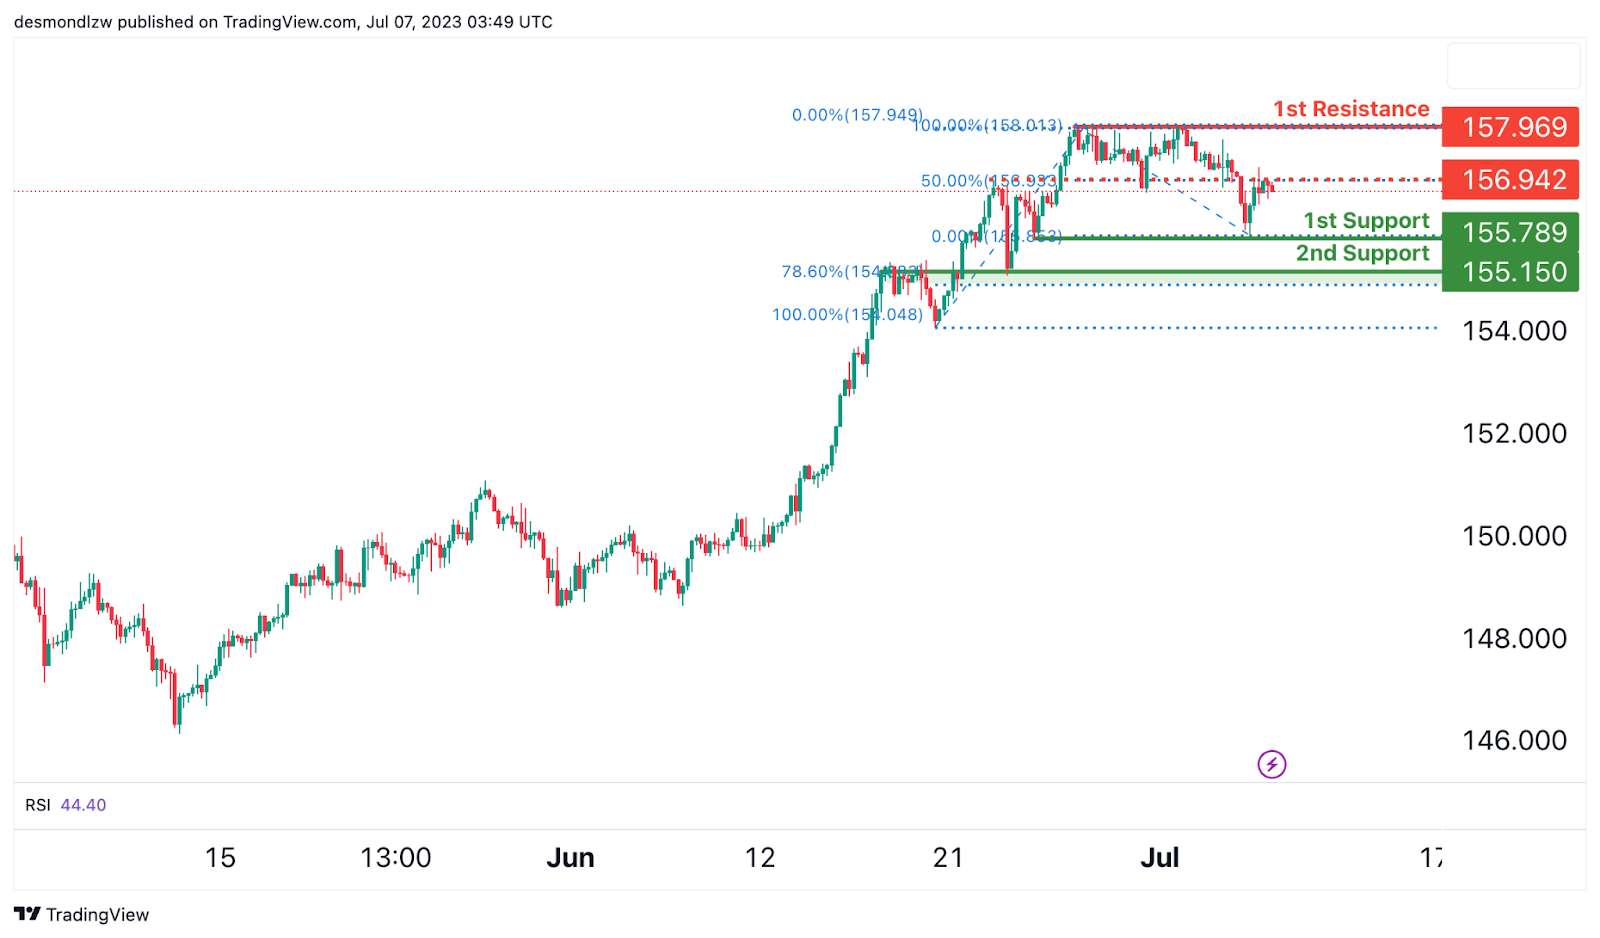
The EUR/JPY chart currently demonstrates a bearish momentum, indicating the potential for further downward movement.
There is a possibility of a bearish continuation towards the 1st support level at 155.78, which is identified as a significant multi-swing low support. Additionally, the 2nd support level at 155.15 acts as an overlap support and exhibits Fibonacci confluence with a 78.60% Fibonacci Retracement, further reinforcing its importance.
On the upside, the 1st resistance level at 1916.21 represents a notable overlap resistance. Similarly, the 2nd resistance level at 1975.62 serves as a swing high resistance, indicating a potential barrier for price advancement.
In addition, there is an intermediate resistance at 155.94, which is an overlap resistance and aligns with a 50% Fibonacci Retracement, further emphasizing its significance.
EUR/GBP:
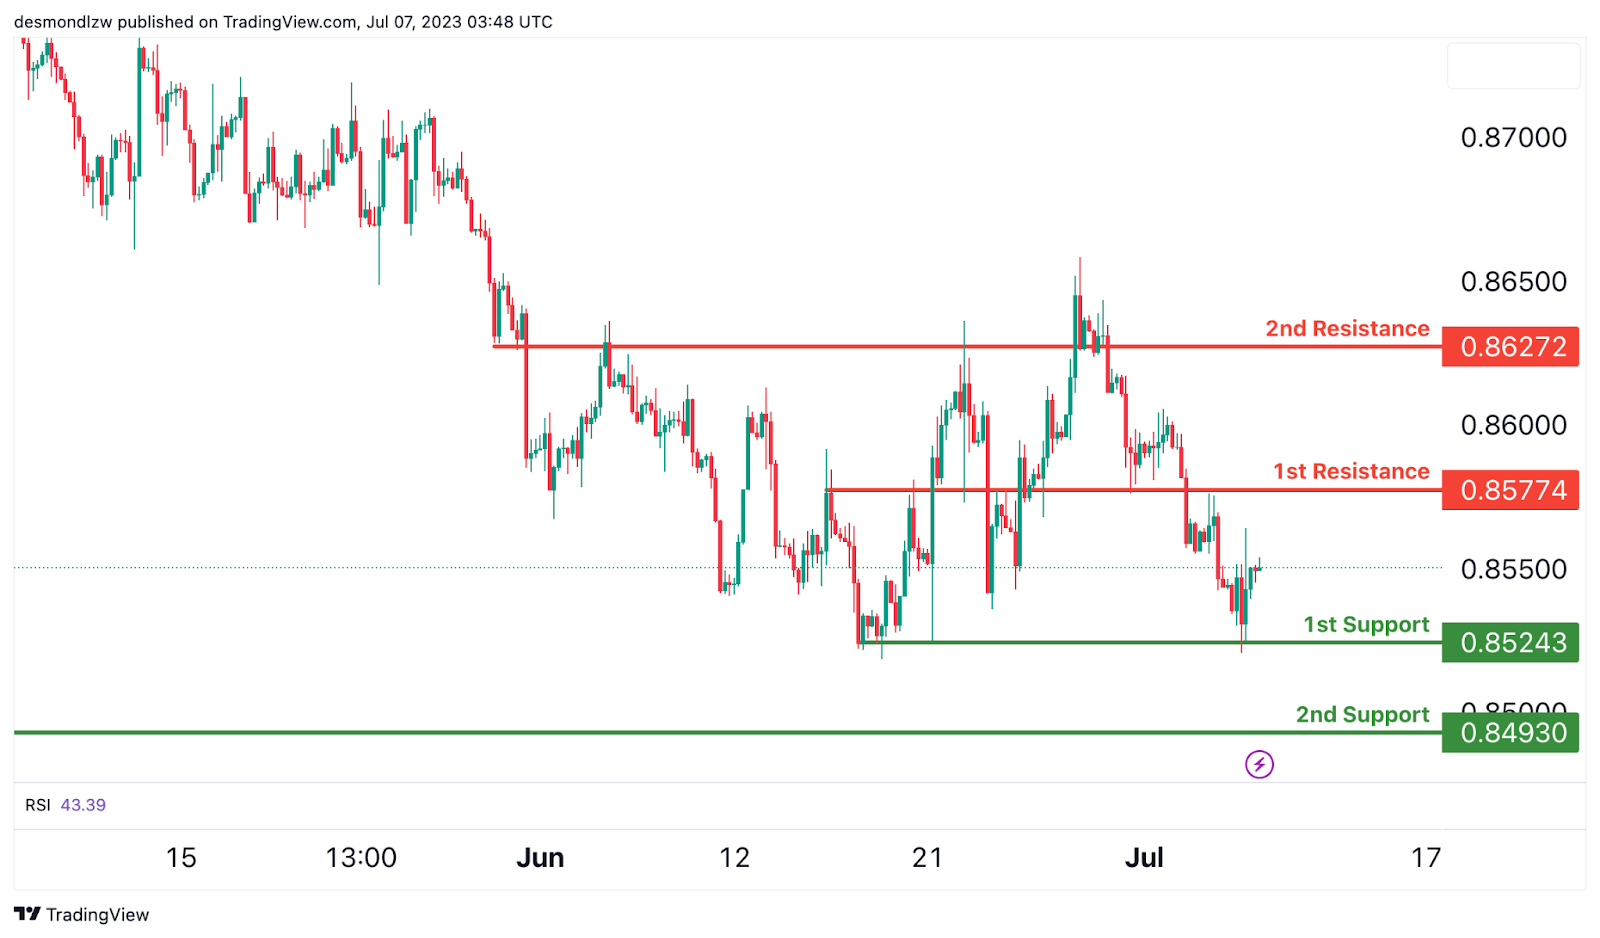
The EUR/GBP chart currently demonstrates a bullish overall momentum, suggesting the potential for further upward movement.
The 1st support level at 0.8524 serves as a significant multi-swing low support, indicating a potential area for price to bounce from. Additionally, the 2nd support level at 0.8493 acts as an overlap support, further reinforcing its significance.
On the upside, the 1st resistance level at 0.8577 represents an important overlap resistance, indicating a potential barrier for price advancement. Similarly, the 2nd resistance level at 0.8627 also functions as an overlap resistance, further solidifying its role as a potential price ceiling.
GBP/USD:
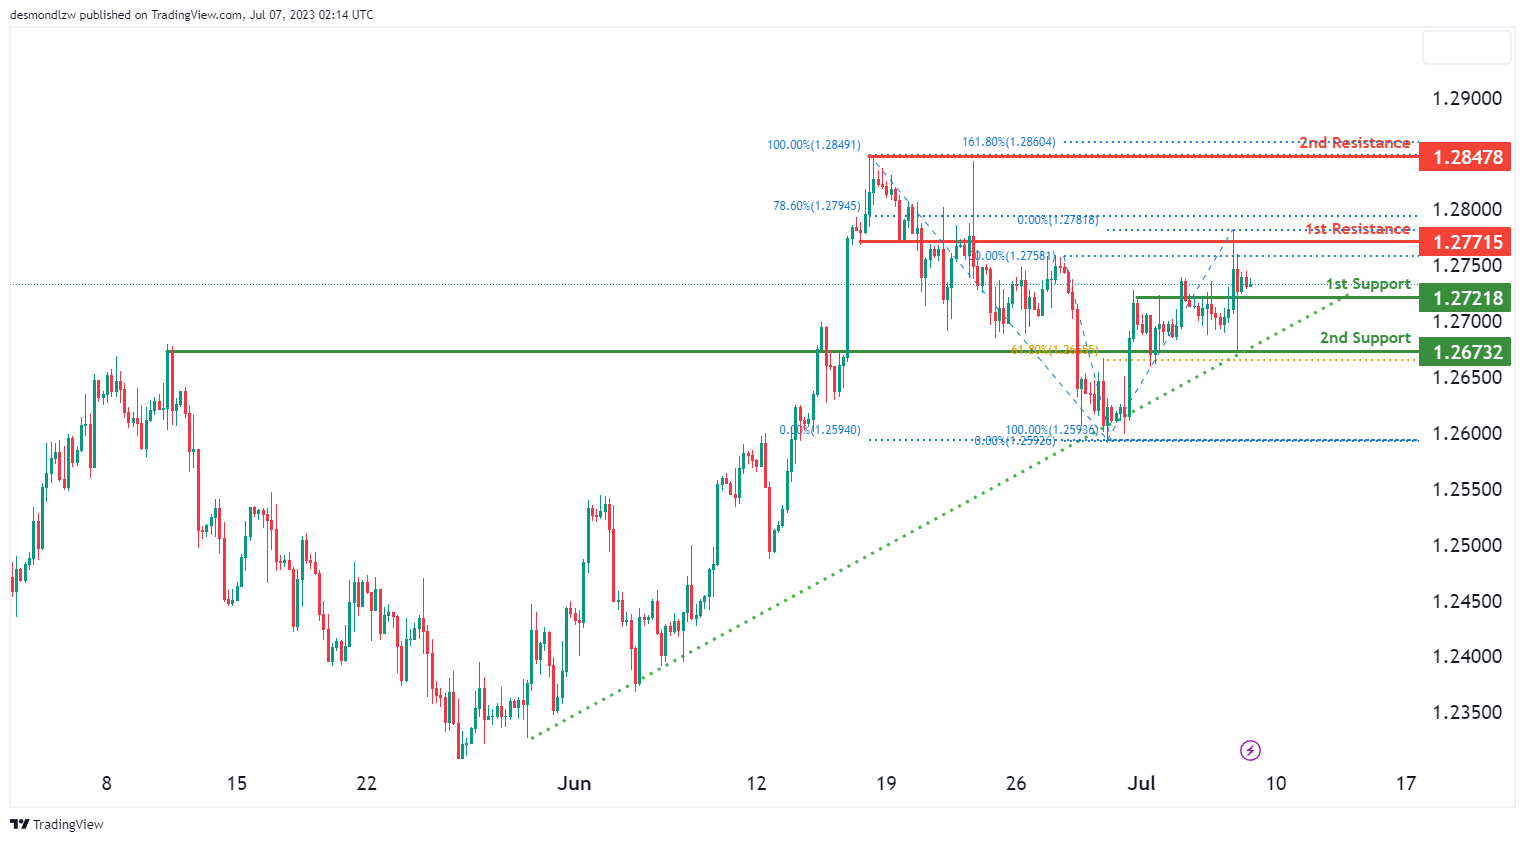
The GBP/USD chart currently demonstrates a bullish momentum, supported by the price being above a major ascending trend line and an ascending trend line acting as support.
There is a potential for a bullish bounce off the 1st support level at 1.2721, which is considered as pullback support. The 2nd support level at 1.2673 also acts as an overlap support and aligns with a 61.80% Fibonacci Retracement.
On the upside, the 1st resistance level at 1.2771 represents an overlap resistance with a 78.60% Fibonacci Retracement. Additionally, the 2nd resistance level at 1.2847 is a multi-swing high resistance.
GBP/JPY:
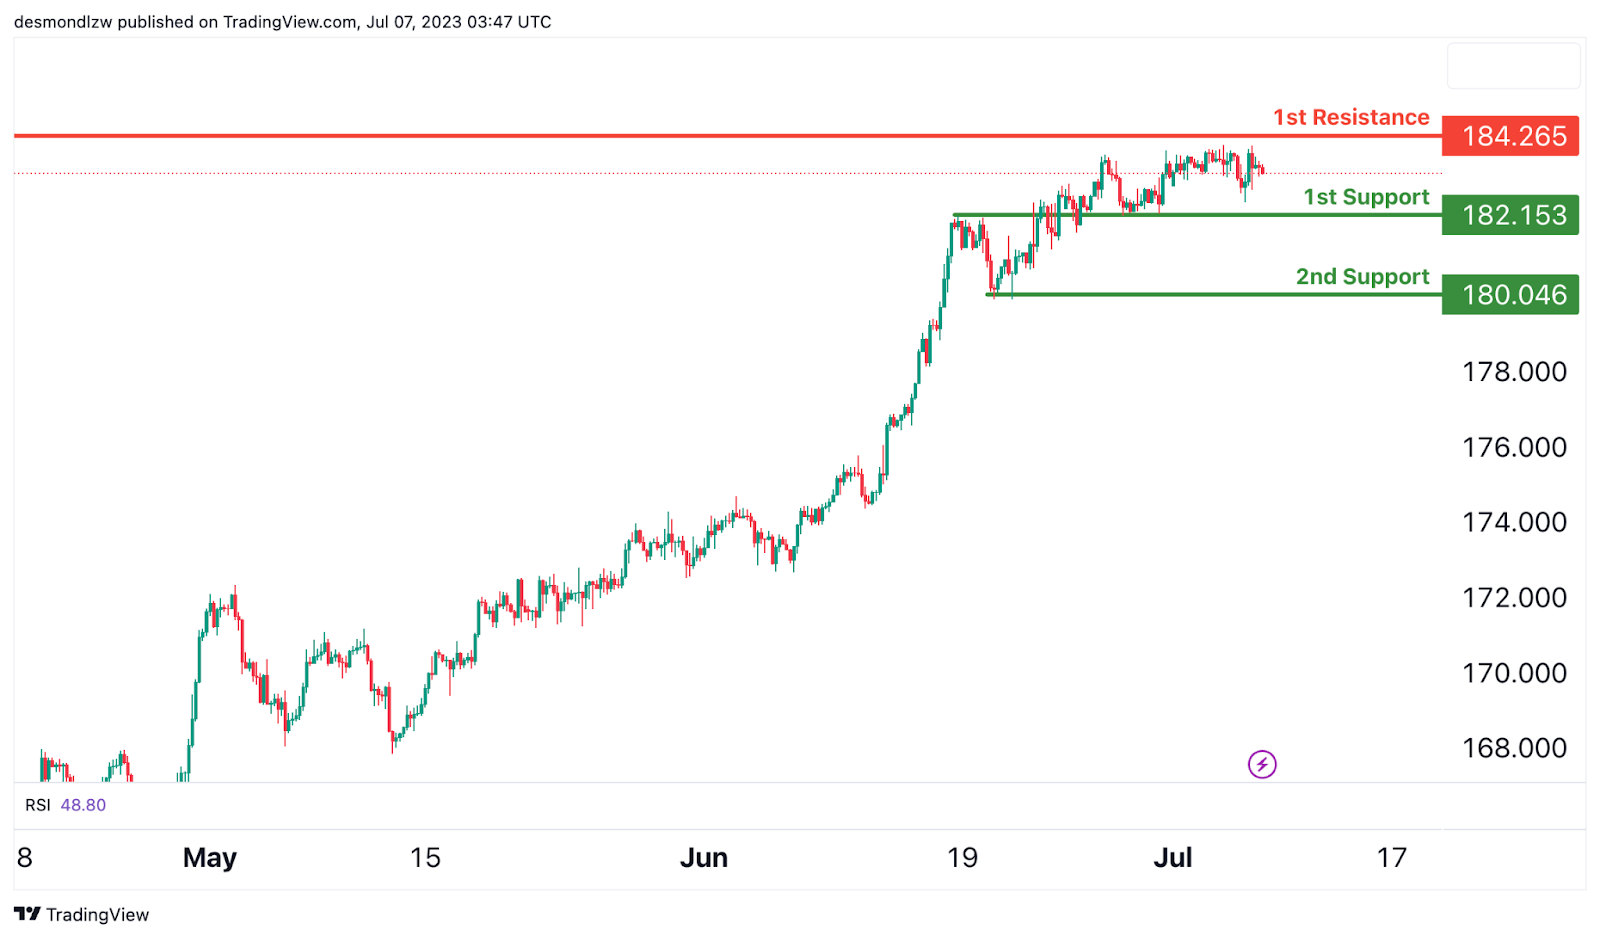
The GBP/JPY chart currently shows a neutral momentum, suggesting a lack of clear direction in the market. There is a potential for price to fluctuate between the 1st resistance and 1st support level.
The 1st support level is located at 182.153 and is considered significant due to its overlap support. Additionally, the 2nd support level at 180.046 aligns with an overlap support, further reinforcing its significance. On the upside, the 1st resistance level at 184.265 represents a significant overlap resistance.
USD/CHF:
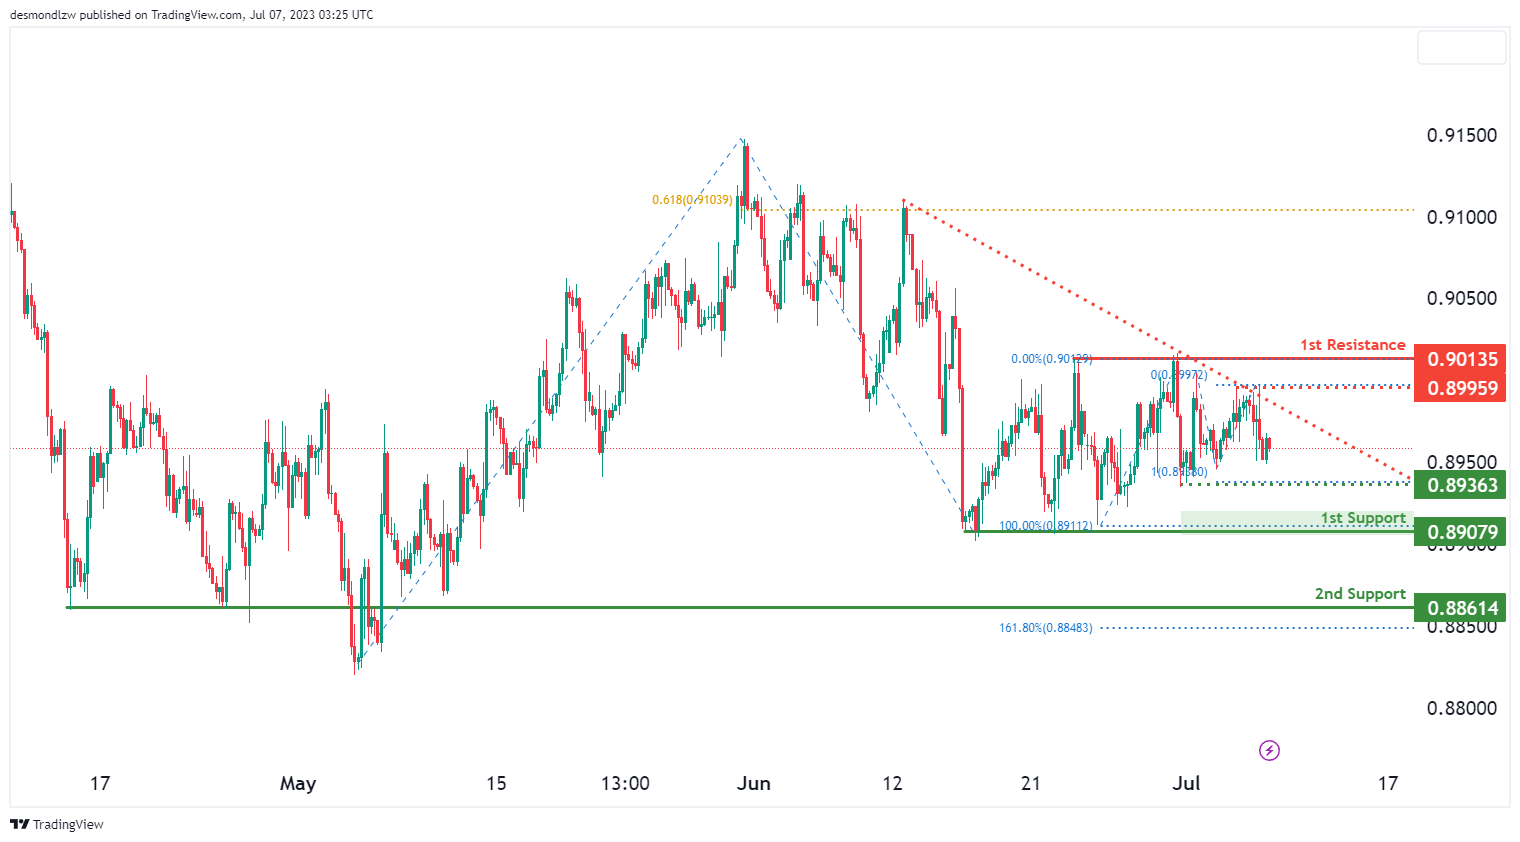
The USD/CHF chart currently exhibits a bearish momentum, indicated by the price being below a major descending trend line and a descending trend line acting as resistance.
There is a potential for a bearish continuation towards the 1st support level at 0.8907, which is identified as a multi-swing low support. The 2nd support level at 0.8861 acts as a pullback support and aligns with a 161.80% Fibonacci Extension.
On the upside, the 1st resistance level at 0.9013 represents a multi-swing high resistance. Additionally, there are intermediate resistance and support levels at 0.8936, with the former indicating multi-swing high resistance and the latter representing swing low support with a 100% Fibonacci Projection.
USD/JPY:
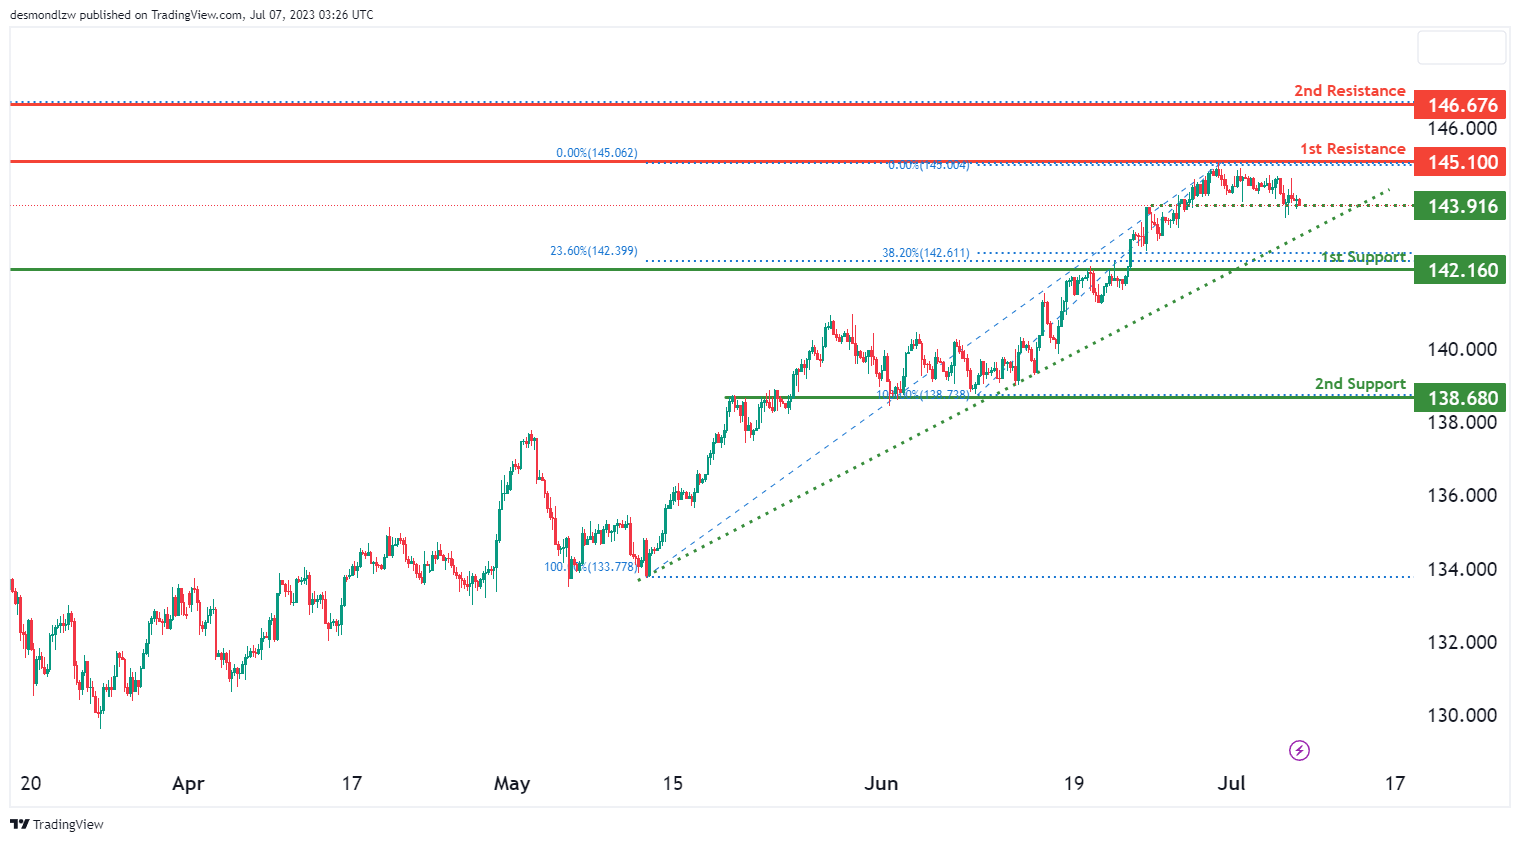
The USD/JPY chart currently demonstrates a bullish momentum, supported by the price being above a major ascending trend line and testing an ascending trend line acting as support.
There is a possibility of a bearish continuation towards the 1st support level at 142.16, which is identified as an overlap support and shows Fibonacci confluence with a 23.60% and 38.20% Fibonacci Retracement. The 2nd support level at 138.68 is also an overlap support.
On the upside, the 1st resistance level at 145.10 represents a pullback resistance. Additionally, there is a 2nd resistance level at 146.67, coinciding with a 78.60% Fibonacci Retracement. An intermediate support level at 143.91 is also present as an overlap support.
USD/CAD:
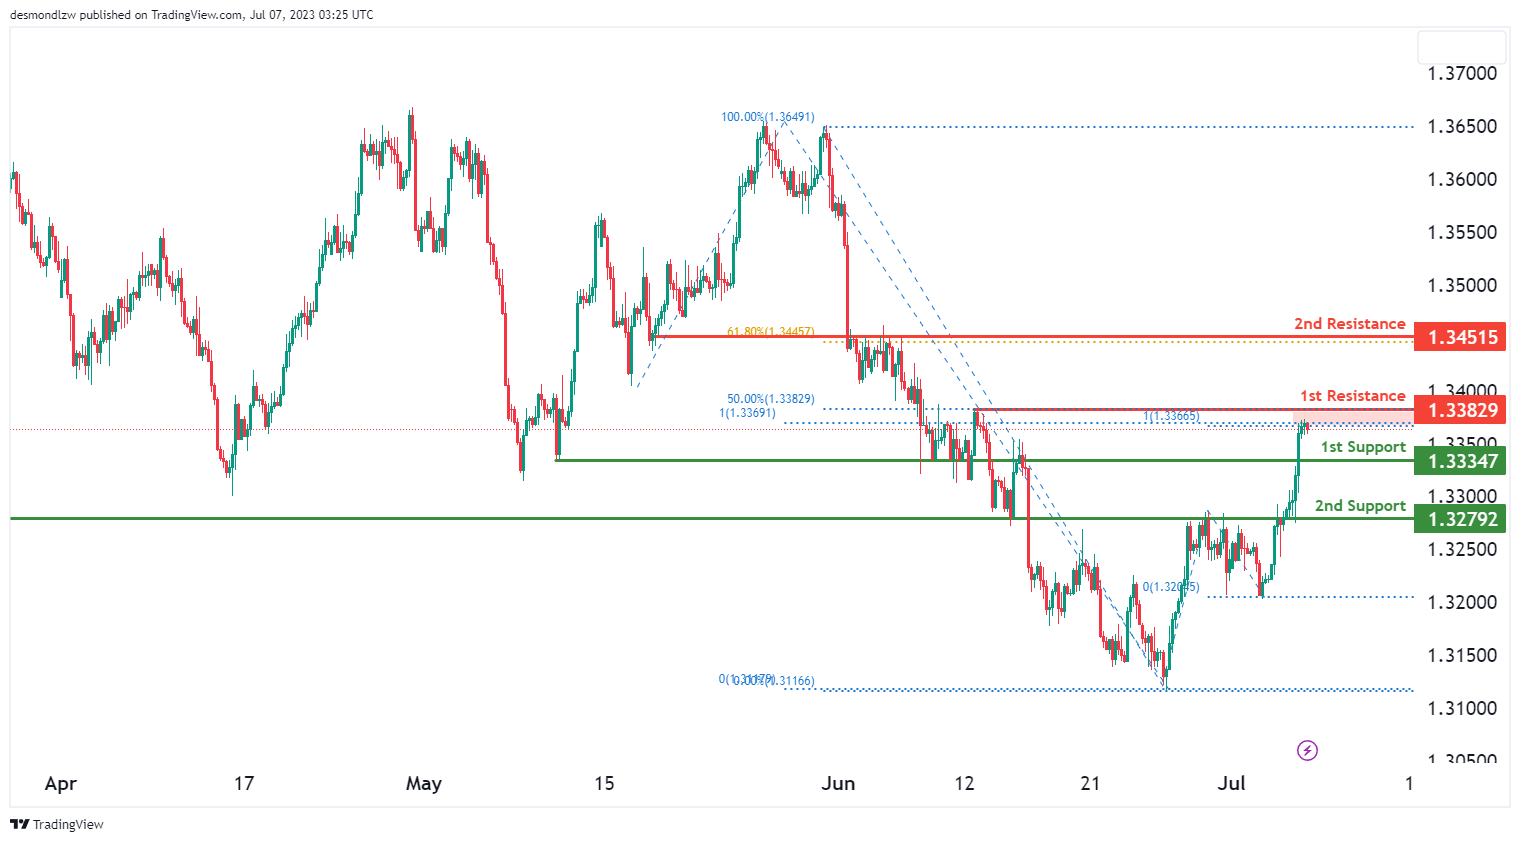
The USD/CAD chart exhibits a weak bullish momentum with low confidence. There is a potential for a bullish continuation towards the 1st resistance level at 1.3383, which is an overlap resistance and aligns with the 50% Fibonacci Retracement level and 100% Fibonacci Projection level.
The 1st support level at 1.3335 and the 2nd support level at 1.3279 act as reliable support levels, providing potential downside support.
On the upside, the 2nd resistance level at 1.3452 represents an overlap resistance and coincides with the 61.80% Fibonacci Retracement level.
AUD/USD:
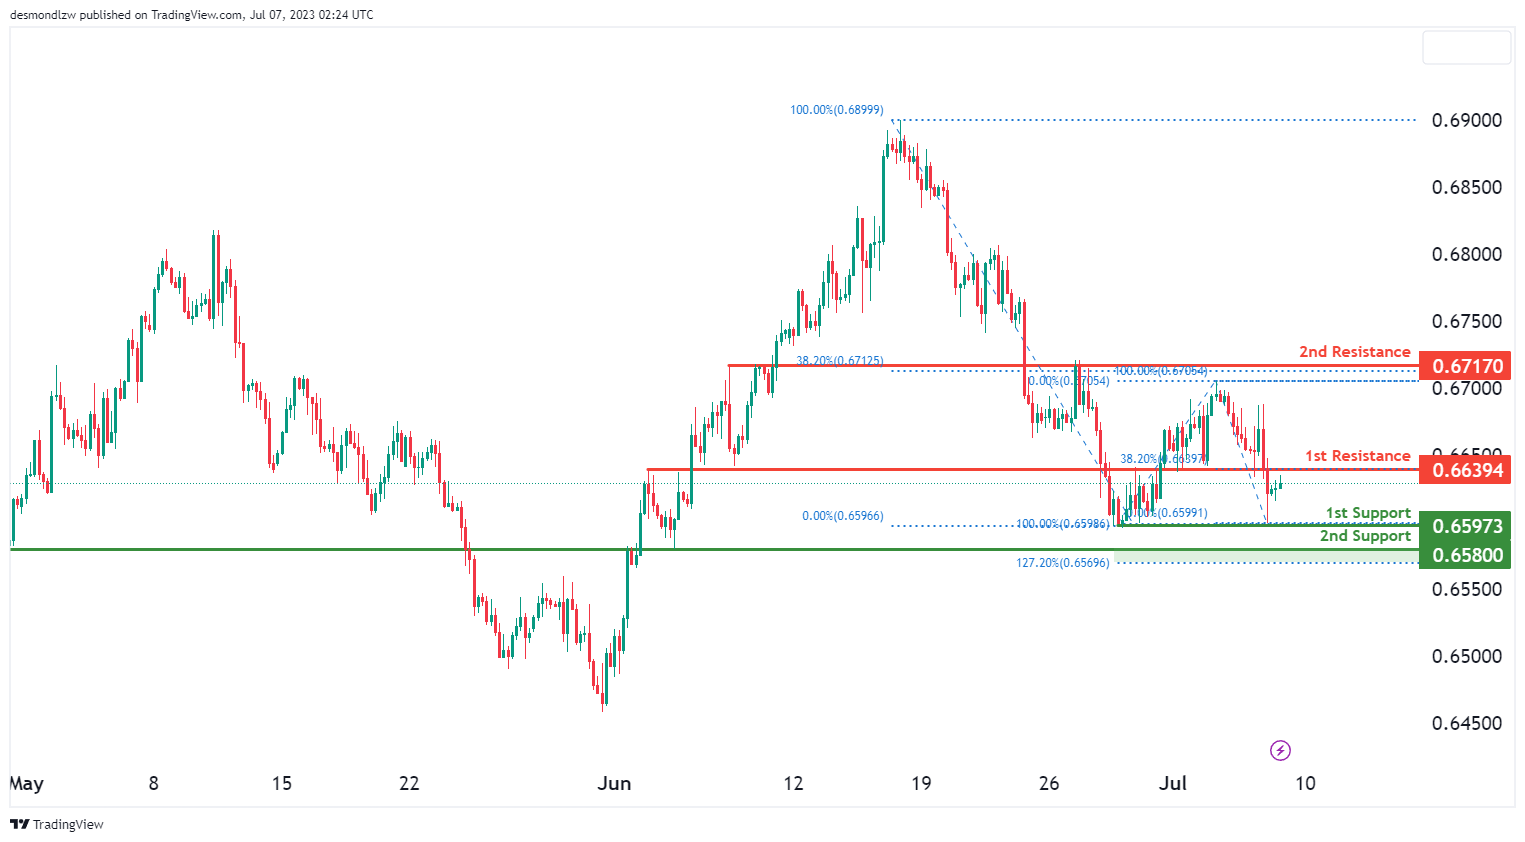
The AUD/USD chart indicates a weak bullish momentum with low confidence. There is a potential for a bullish continuation towards the 1st resistance level at 0.6639, which is an overlap resistance and coincides with a 38.20% Fibonacci Retracement level.
The 1st support level at 0.6597 and the 2nd support level at 0.6580 both act as overlap supports. The 2nd support level also aligns with a 127.20% Fibonacci Extension level.
On the upside, the 2nd resistance level at 0.6717 is an overlap resistance and coincides with a 38.20% Fibonacci Retracement level.
NZD/USD
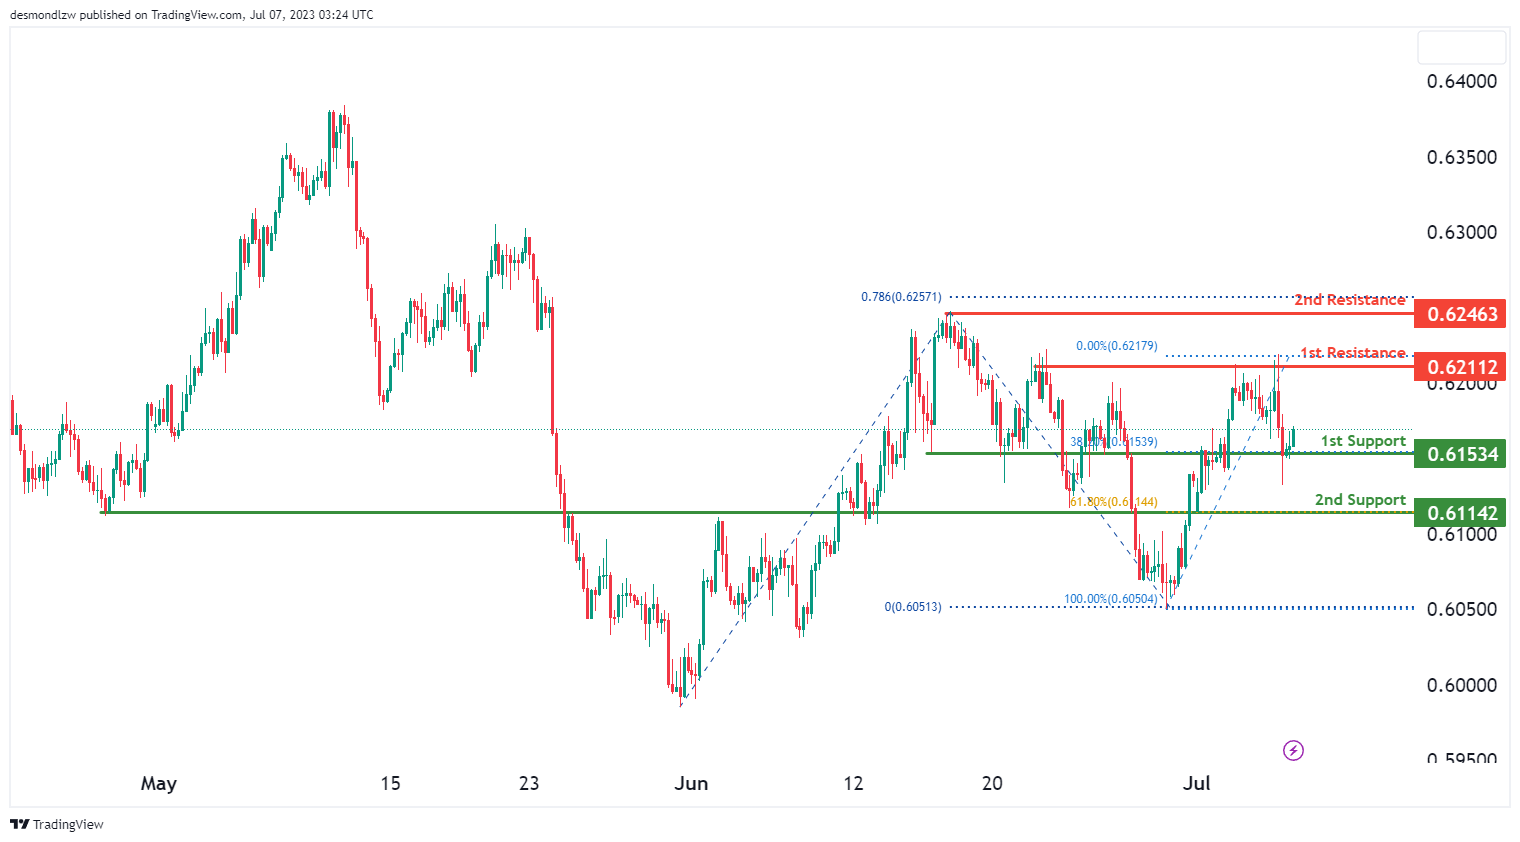
The NZD/USD chart shows a bullish momentum, indicating the potential for further upward movement. There is a possibility of a bullish continuation towards the 1st resistance level at 0.6211, which is an overlap resistance.
The 1st support level at 0.6153, along with the 38.20% Fibonacci Retracement level, provides good support. Additionally, the 2nd support level at 0.6114, aligned with the 61.80% Fibonacci Retracement level, further strengthens the support.
On the upside, the 2nd resistance level at 0.6246, accompanied by the 78.60% Fibonacci Projection level, acts as a significant resistance.
DJ30:
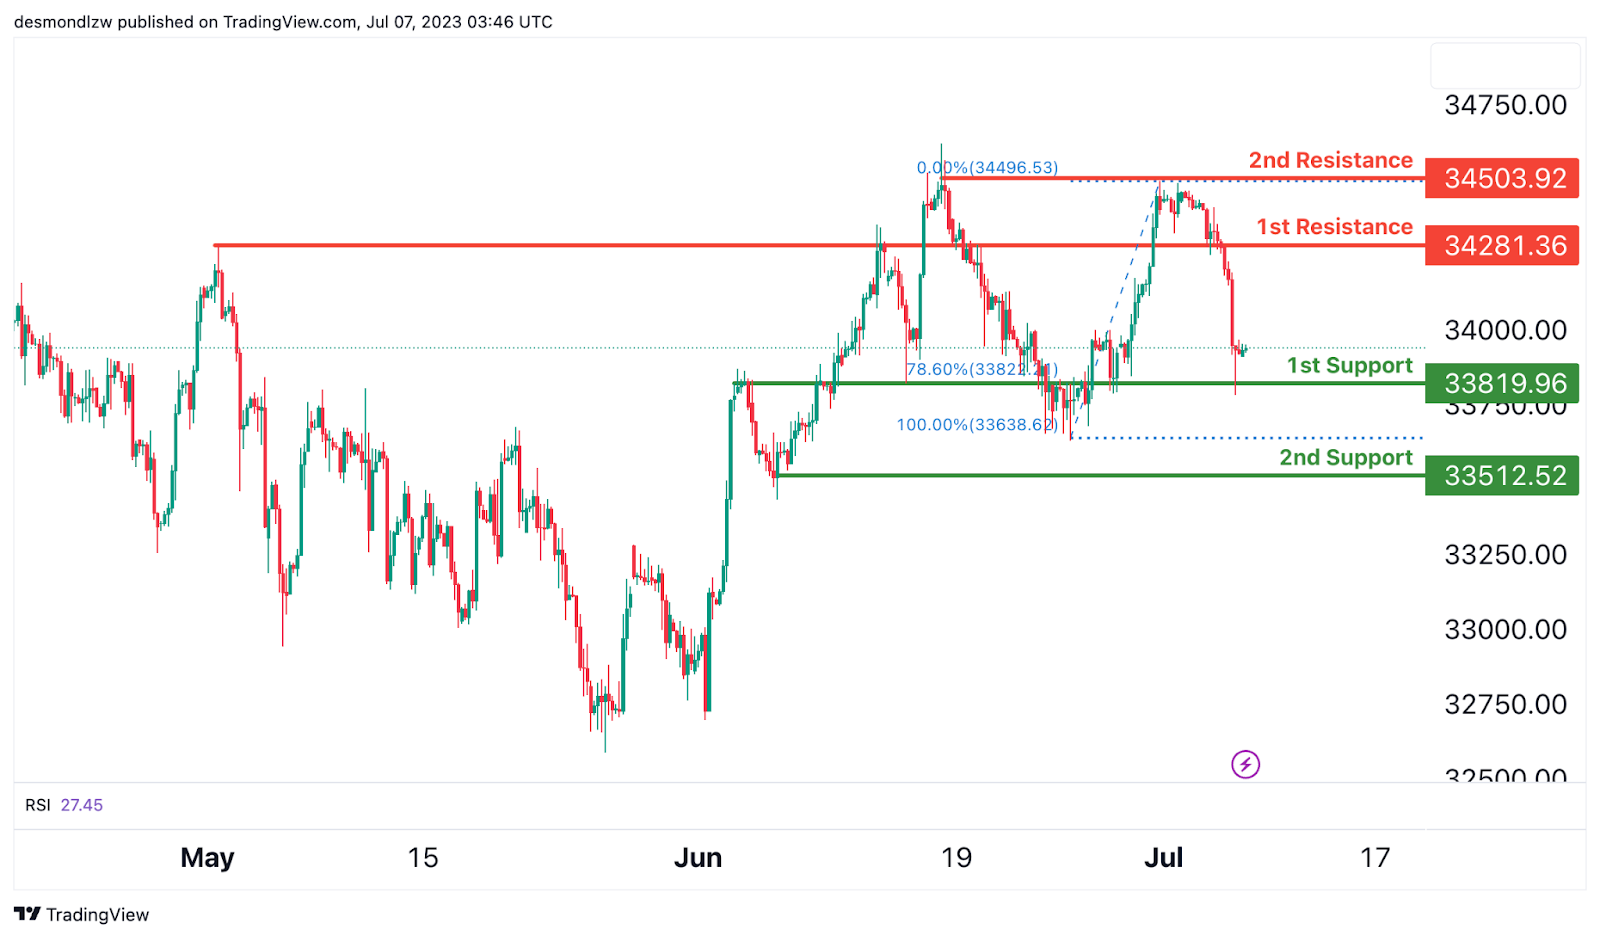
The DJ30 (Dow Jones Industrial Average) chart currently displays a strong bullish momentum, indicating a favorable market sentiment for upward movement.
There is a possibility for a bullish rebound from the reliable 1st support level located at 33819.96, which serves as a significant overlap support. This support level also aligns with a 78.60% Fibonacci Retracement, further reinforcing its importance. Additionally, the 2nd support level at 33512.52 acts as a swing low support, providing further potential downside support.
On the upside, it is worth noting that the 1st resistance level positioned at 34281.36 represents a significant overlap resistance, suggesting a potential area of price resistance. Furthermore, the 2nd resistance level at 34503.92 represents a multi-swing high resistance, indicating a noteworthy level that may act as a barrier to further price advancement.
GER30:
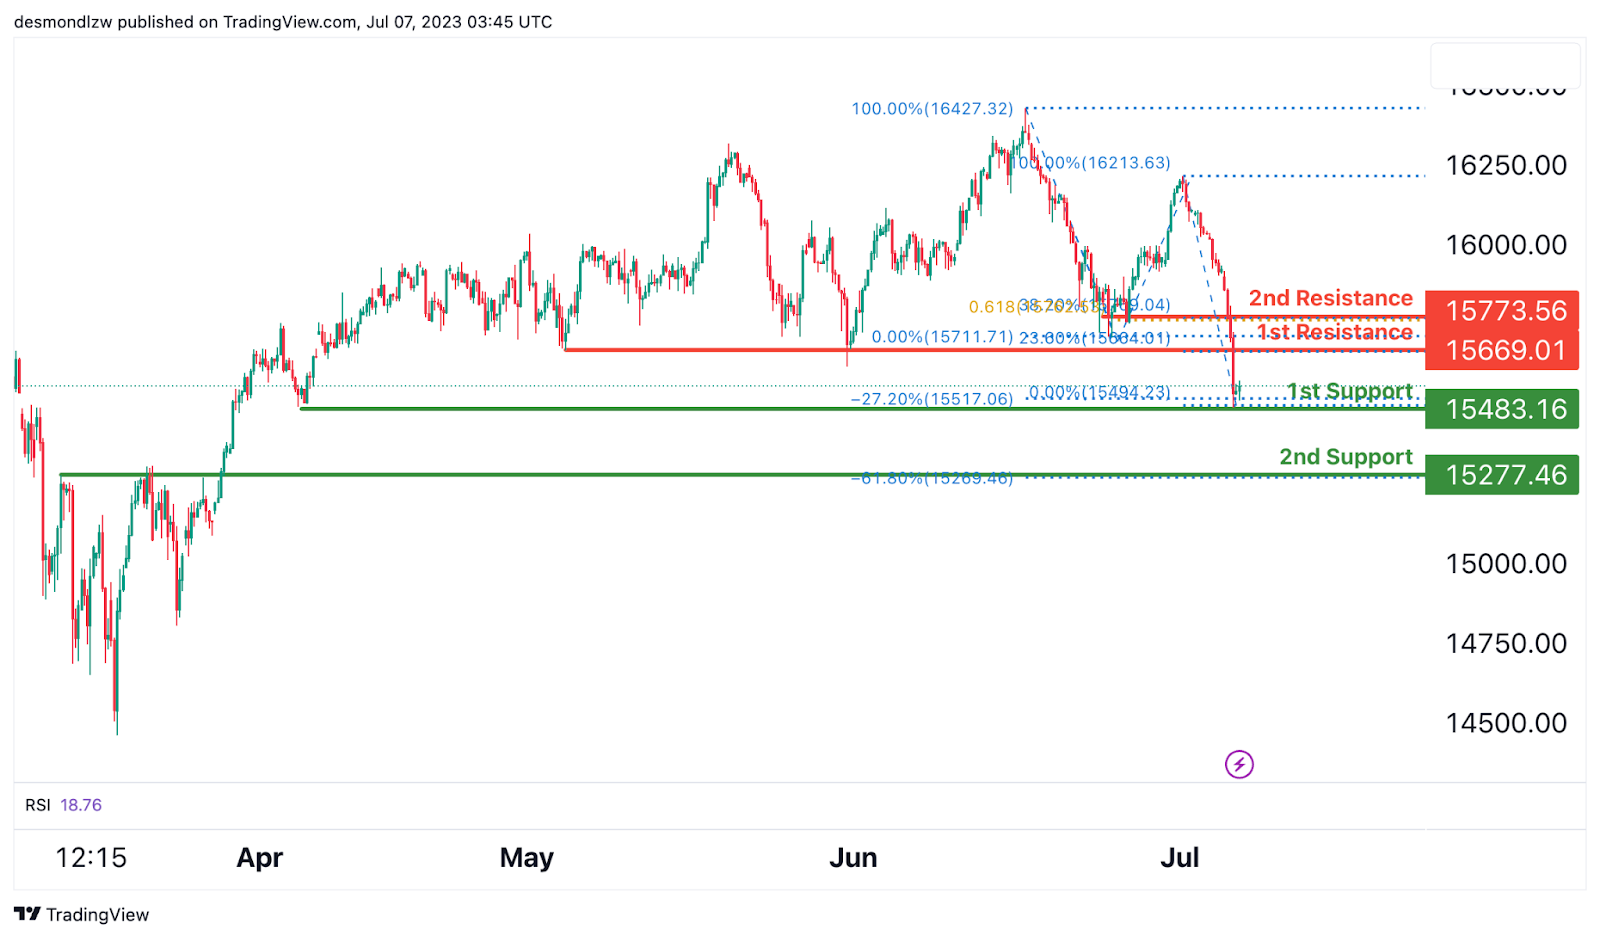
The GER30 (DAX) chart currently exhibits a strong bullish momentum, indicating a favorable market sentiment for upward movement.
There is a potential for a bullish rebound from the reliable 1st support level located at 15483.16, which is characterized as a significant multi-swing low support. This level also aligns with a -27% Fibonacci Expansion, further enhancing its significance.
On the upside, it is worth noting that the 1st resistance level positioned at 15669.01 represents a notable overlap resistance, indicating a potential area of price congestion. Moreover, the 2nd resistance level at 15773.56 coincides with a 61.80% Fibonacci Projection and acts as an additional overlap resistance, adding to its importance.
US500
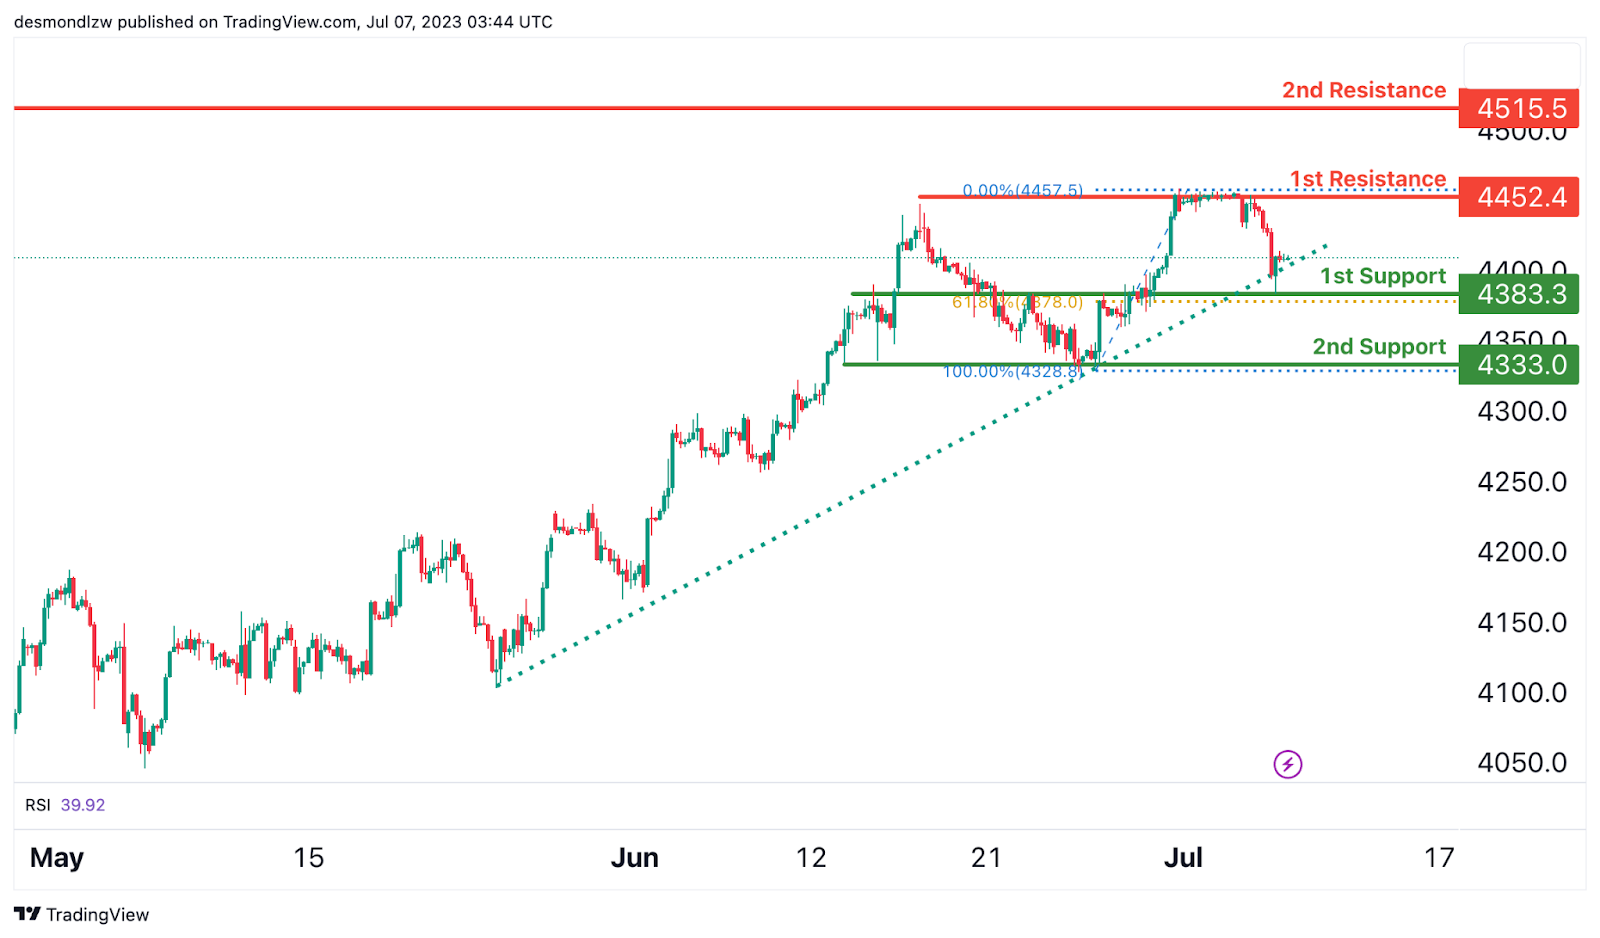
The US500 (S&P 500) chart currently demonstrates a robust bullish momentum, suggesting a strong inclination for upward movement in the market.
There is a distinct possibility of witnessing a bullish rebound from the well-established 1st support level located at 4383.3, which is recognized as a significant multi-swing low support area.
On the upside, it is noteworthy that the 1st resistance level positioned at 4452.4 represents a notable overlap resistance, indicating a potential level of price congestion. Moreover, the 2nd resistance level situated at 4515.5 is considered a prominent swing high resistance, underscoring its significance in terms of potential price barrier.
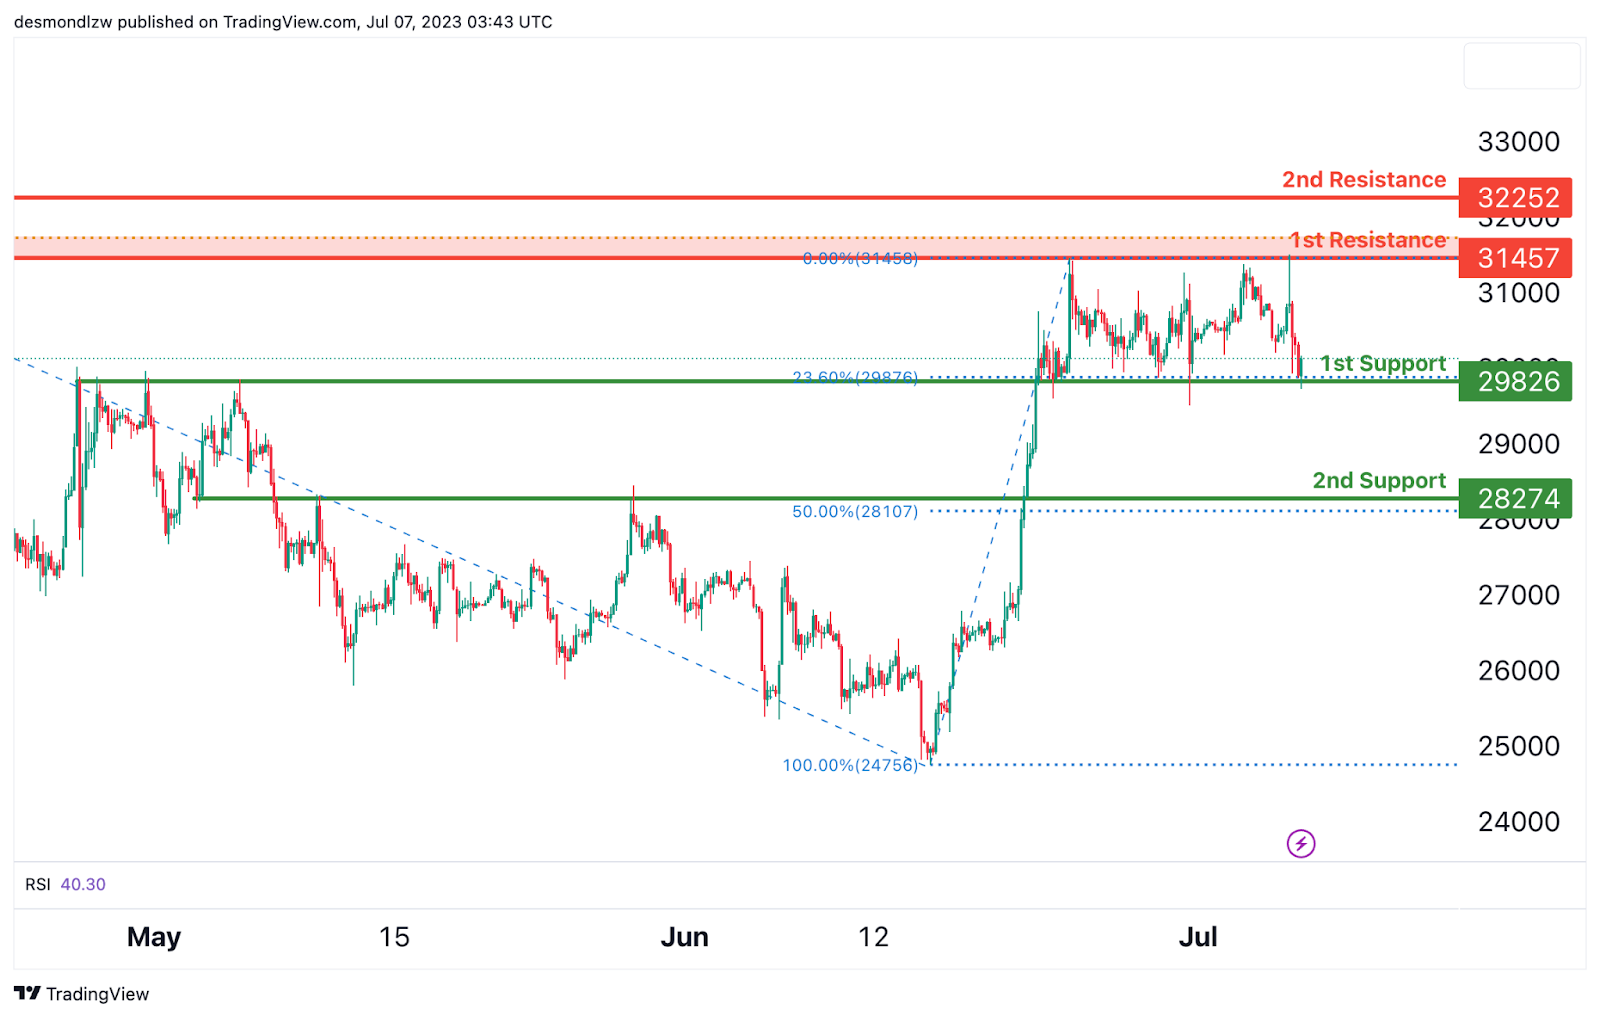
BTC/USD:
The BTC/USD (Bitcoin) chart currently demonstrates bullish momentum, indicating the potential for upward movement in the market.
There is a possibility of a bullish bounce off the 1st support level at 29826, which is identified as an overlap support and coincides with a 23.60% Fibonacci Retracement. Additionally, the 2nd support level at 28274 acts as an overlap support and aligns with a 50% Fibonacci Retracement.
On the upside, the 1st resistance level at 31457 represents a multi-swing high resistance with a 61.80% Fibonacci Projection. Furthermore, the 2nd resistance level at 32252 is identified as a swing high resistance.
ETH/USD:
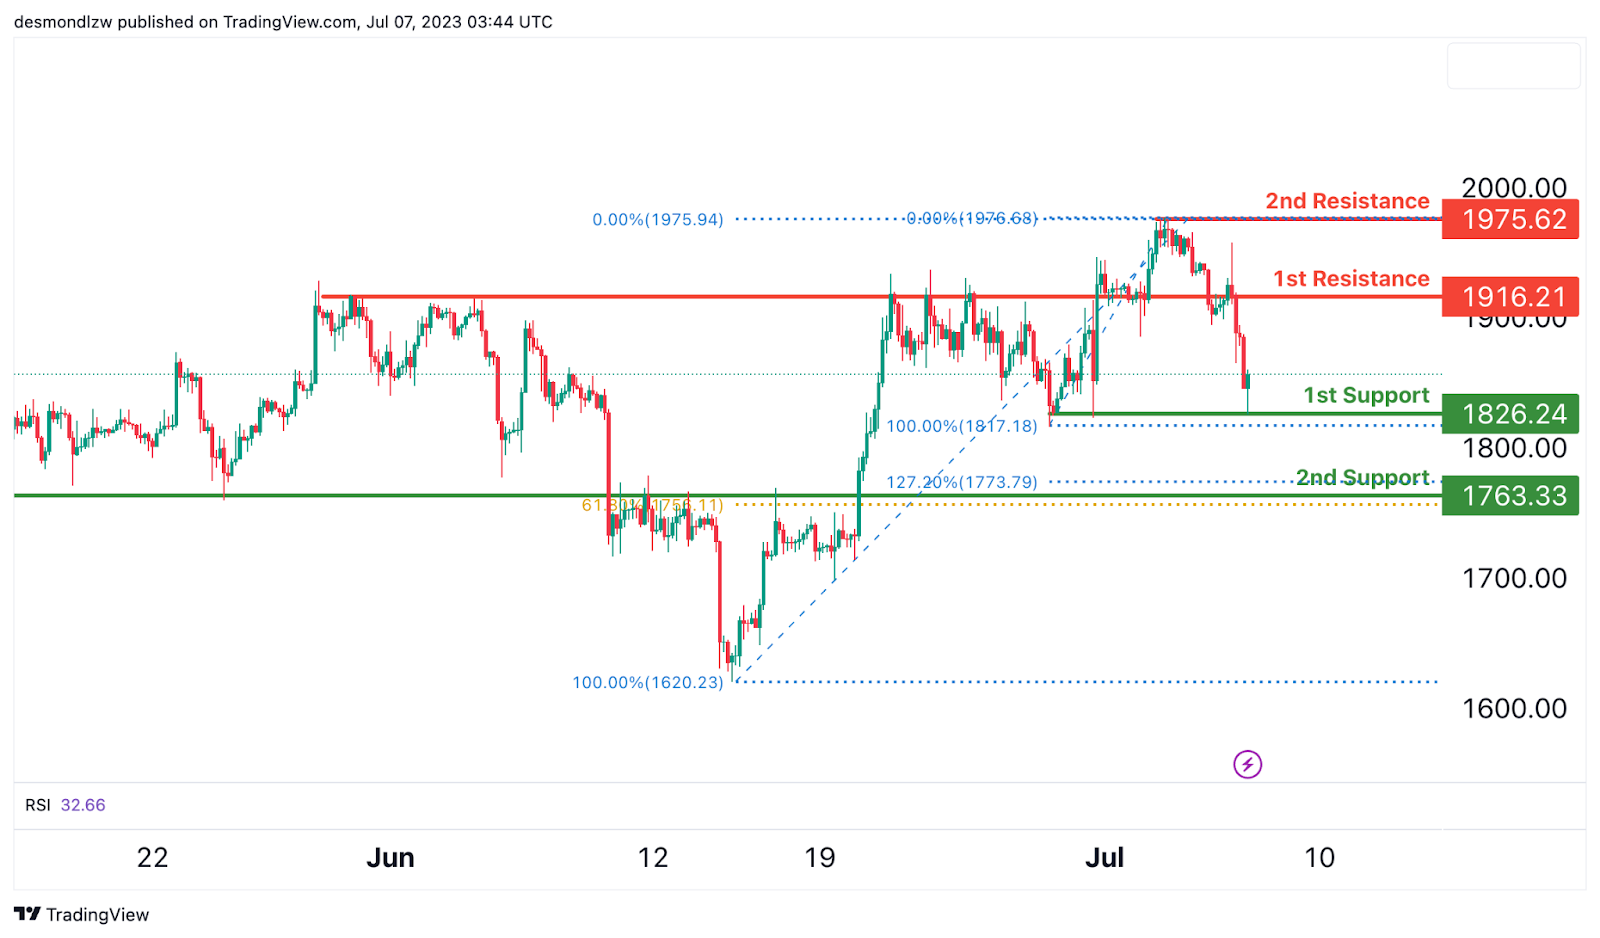
The ETH/USD (Ethereum) chart currently displays bullish momentum, suggesting the potential for upward movement in the market.
There is a possibility of a bullish bounce off the 1st support level at 1826.24, which is considered an overlap support and coincides with a 23.60% Fibonacci Retracement. Additionally, the 2nd support level at 1763.33 acts as an overlap support and shows Fibonacci confluence with a 127.20% Fibonacci Extension and a 61.80% Fibonacci Retracement.
On the upside, the 1st resistance level at 1916.21 represents an overlap resistance and aligns with a 61.80% Fibonacci Projection. Furthermore, the 2nd resistance level at 1975.62 is identified as a swing high resistance.
WTI/USD:
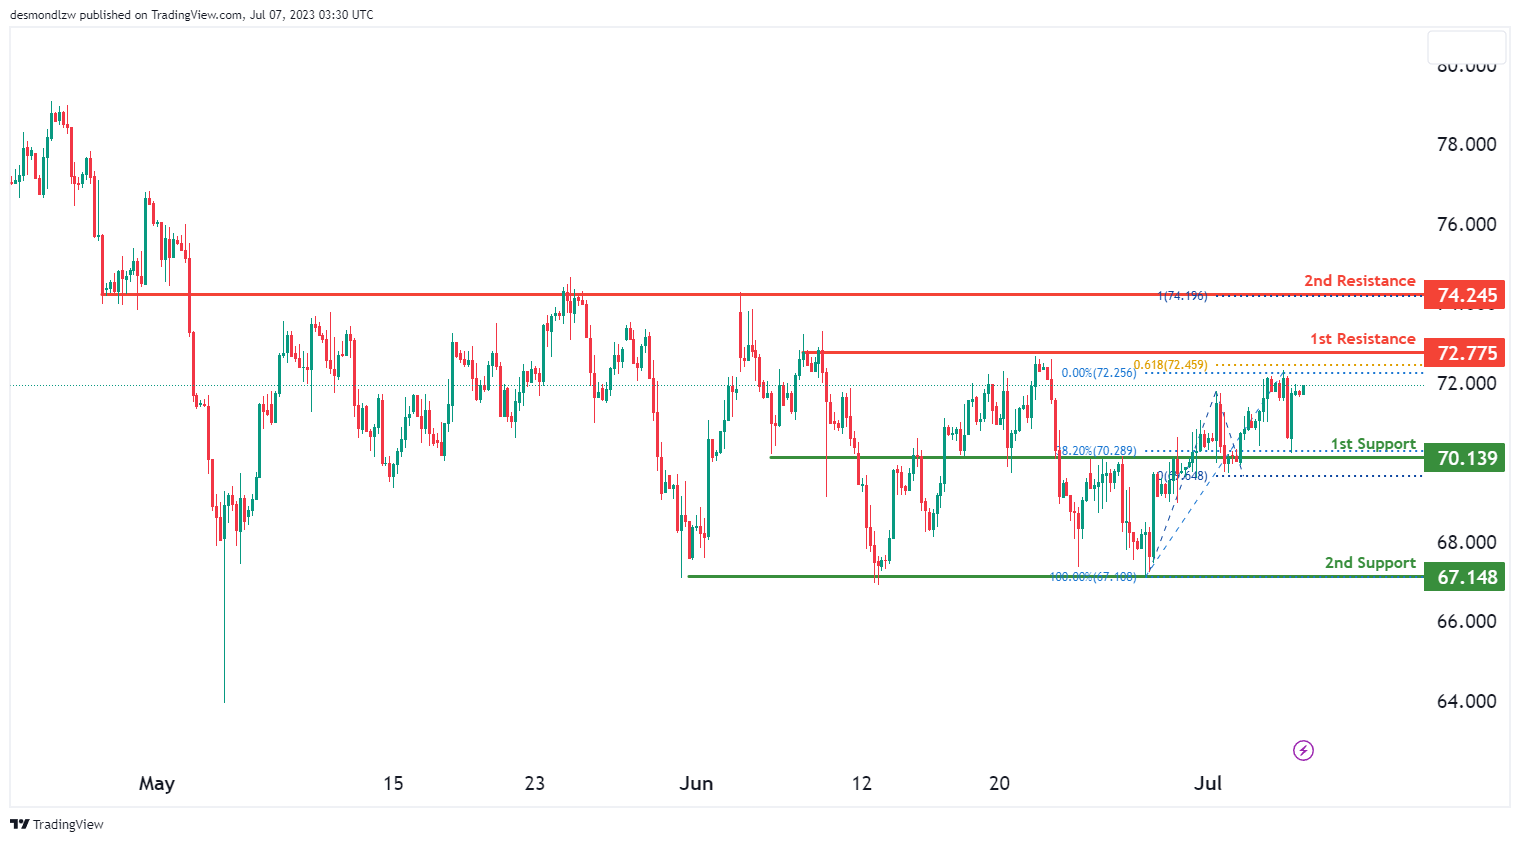
The WTI/USD (Crude Oil) chart currently demonstrates bullish momentum, indicating a potential upward movement in the market.
There is a possibility of a bullish continuation towards the 1st resistance level at 72.78, which is identified as an overlap resistance and aligns with a 61.80% Fibonacci Projection.
The 1st support level at 70.14 is considered strong as it represents an overlap support and coincides with a 38.20% Fibonacci Retracement. Additionally, the 2nd support level at 67.15 acts as another overlap support.
On the upside, the 2nd resistance level at 74.25 is an important level as it represents an overlap resistance and aligns with a 100% Fibonacci Projection.
XAU/USD (GOLD):
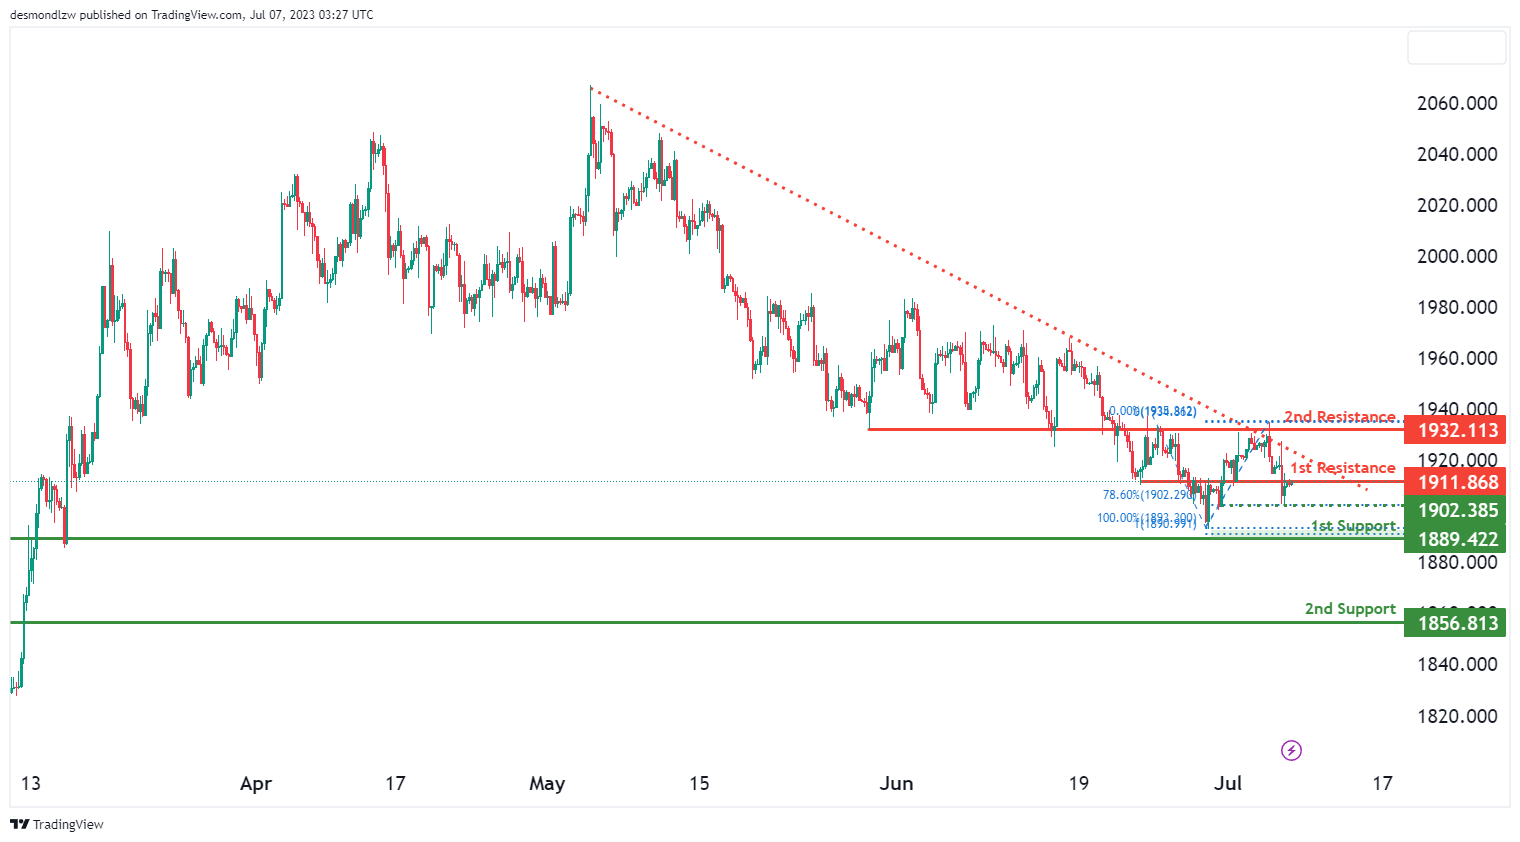
The XAU/USD (Gold) chart currently exhibits a bearish momentum, supported by the price being below a major descending trend line and a descending trend line acting as resistance.
There is a potential for a bearish reaction off the 1st resistance level at 1911.86, identified as an overlap resistance. This could lead to a drop towards the 1st support level at 1889.42, characterized as an overlap support with a 100% Fibonacci Projection. The 2nd support level at 1856.81 also acts as a pullback support.
Additionally, there is an intermediate support level at 1902.38, which serves as a multi-swing low support with a 78.60% Fibonacci Retracement. The 2nd resistance level at 1932.11 is significant as it represents an overlap resistance and aligns with a 78.60% Fibonacci Retracement.
USD/JPY Daily Outlook
Daily Pivots: (S1) 143.53; (P) 144.10; (R1) 144.63; More...
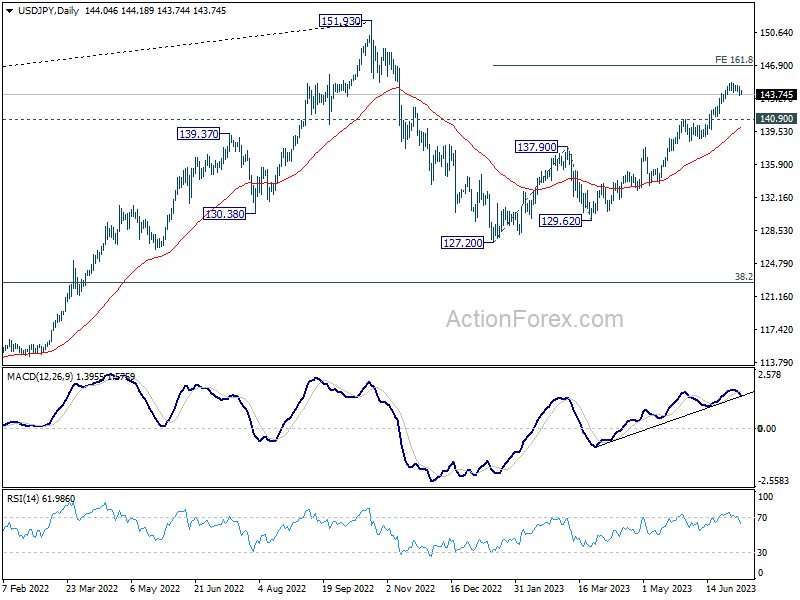
Intraday bias in USD/JPY remains neutral at this point. Correction from 145.06 is in progress and break of 143.54 will turn bias to the downside for deeper fall. Still, overall outlook remains bullish with 140.90 resistance turned support intact. Break of 145.06 will resume larger rise to 161.8% projection of 127.20 to 137.90 from 129.62 at 146.93.
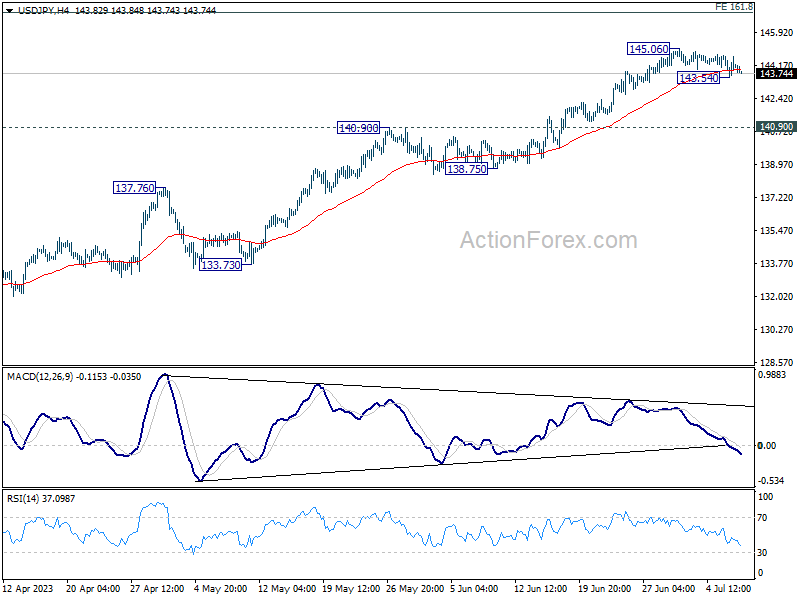
In the bigger picture, rise from 127.20 is currently seen as the second leg of the corrective pattern from 151.93 high. Further rally is expected as long as 138.75 support holds, to retest 151.93. But strong resistance could be seen there to limit upside. Break of 138.75 will indicate the the third leg has started back towards 127.20.
Risk-Off Sentiment Grips Markets ahead of NFP, But Currencies Mixed
Markets are firmly entrenched in a risk-off mode as focus shifts to impending US Non-Farm Payroll data. Expectations for two additional Fed hikes have been gaining traction this week following a string of strong employment data. The deep pullback in US equities overnight extended into Asian trading hours. Concurrently, benchmark 10-year yield managed to close above 4% level and continues to remain strong in Asia. Despite these significant developments, the currency markets are yet to reflect the shifts in sentiment noticeably.
At the moment, New Zealand Dollar stands out as the week's top performer, while its fellow commodity currencies, Canadian and Australian Dollars, find themselves at the opposite end of the spectrum. Both Euro and Swiss Franc are leaning towards weakness, whereas Sterling shines as the second-best performer. Dollar's performance appears mixed, with Yen showcasing slight outperformance, even amidst the robust surge in US yields. Today's job data is expected to provide a more precise directional cue for currencies for the remainder of the month.
From a technical perspective, the USD/CAD pair is one to watch, particularly as both US and Canada are slated to release their job data today. It's now pressing 55D EMA (now at 1.3369) as rebound form 1.3115 short term bottom accelerated higher yesterday. Sustained break of this EMA will bolster the case that could corrective pattern from 1.3976 has completed with three waves down to 1.3115. In this case, stronger rally would be seen back to 1.3860/3976 resistance zone later in the month. Meanwhile, rejection by the EMA will maintain near term bearishness through 1.3115 low at a later stage. We'll know which one it goes pretty soon.
In Asia, at the time of writing, Nikkei is down -0.54%. Hong Kong HSI is down -1.03%. China Shanghai SSE is down -0.36%. Singapore Strait Times is down -0.38%. Japan 10-year JGB yield is up 0.0304 at 0.442. Overnight, DOW dropped -1.07%. S&P 500 dropped -0.79%. NASDAQ dropped -0.82%. 10-year yield rose 0.096 to 4.041.
BoJ's Uchida cautions against premature policy shift
BoJ Deputy Governor Shinichi Uchida voiced caution over a hasty shift in monetary policy amid current economic climate. In an interview with Nikkei, Uchida emphasized that Japan was far from needing to hastily raise interest rates.
"The risk of missing the opportunity to achieve our 2% target with a premature policy shift is bigger than that of being too late in tightening policy and allowing inflation to continue running above 2%," Uchida explained.
Uchida noted the budding changes in Japanese companies' behavior, which have been rooted in the country's deflationary period. He stressed the importance of nurturing these developments with care. However, he cautioned that uncertainty remains high over inflation outlook, including impact of pricing behaviors and wage hikes by companies.
"We have not reached a point where we can foresee the 2 percent price stability target can be attained stably and sustainably," Uchida said. He also recognized the burden placed on households due to more than 2% rise in core CPI, reinforcing the importance of supporting the economy with current monetary easing to stabilize inflation at 2%, in tandem with wage growth.
Uchida also touched on foreign exchange rates, noting the unwanted uncertainty caused by Yen's rapid and one-sided depreciation. He highlighted the importance of stable foreign exchange rates, which should reflect economic and financial fundamentals. "The BOJ will coordinate with the government, and closely monitor developments in the foreign exchange market and their impact on the economy and prices," he added.
Japan's nominal wages surge, yet real wages and household spending stumble
Japanese workers saw their nominal wages surge 2.5% yoy in May, significantly surpassing expected increase of 1.2% yoy. Regular pay, which includes basic salaries, rose by an impressive 1.8% yoy, marking the highest gain since February 1995. Meanwhile, overtime and other non-regular pay saw a modest increase of 0.4% yoy, while special pay including bonuses skyrocketed by 22.2% yoy.
However, inflation-adjusted real wage index tells a different story. It dropped by -1.2% yoy in May, marking a 14-month declining streak. The reduction, nonetheless, was less severe than -3.2% yoy drop experienced a month earlier. This appears to mirror the effects of pay raise agreements established during this year's "shunto" spring labor-management negotiations.
Despite these wage increases, separate data revealed that Japanese household spending fell -4.0% yoy in May , outpacing median market forecast for a -2.4% yoy drop. This decline extended for the third month and affected a range of expenses from food to clothing to transportation. On a seasonally adjusted monthly basis, household spending dipped by -1.1% mom, This represents the fourth consecutive month of decline.
Bets on two more Fed hikes gaining traction ahead of NFP
Financial markets are awaiting with bated breath today's US non-farm payrolls data, as labor market tightness continues to be a crucial variable in shaping Fed future policy trajectory. Market consensus predicts a healthy growth of 220k jobs in June, while unemployment rate is forecast to remain steady at 3.70%. Average hourly earnings are projected to see a moderate increase of 0.3% mom.
With the backdrop of this week's related data, risks appear to be tilted towards a positive surprise. ADP reported private employment growth of 497k, which is almost double the anticipated 250k. ISM services employment bounced back from 49.2 to 53.1, while ISM manufacturing employment slipped from 51.4 to 48.1. The robust surge in service sector seems capable of more than compensating for the downturn in manufacturing sector.
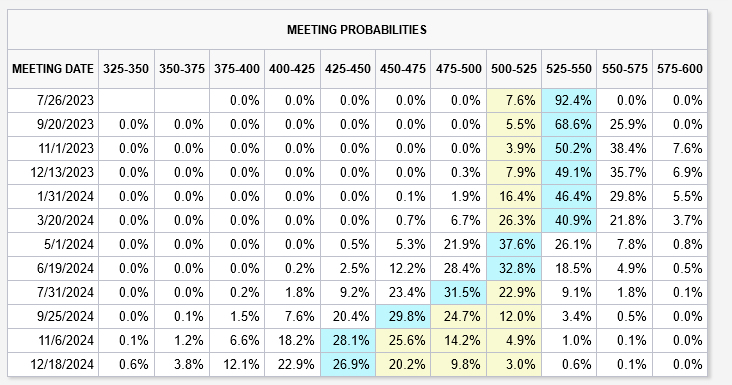
Ahead of the job report, Fed funds futures are pricing in a 92.4% likelihood of an additional 25 bps hike, which would bring rates to 5.25-5.50% at FOMC meeting in July.
Market participants appear to remain somewhat skeptical of FOMC members' "strong majority" opinion that two or more rate hikes are necessary in 2023. However, probability of more tightening beyond July is gaining traction. Chance of interest rate reaching 5.50-5.75% in November currently stands at 46%.
Simultaneously, expectation for the first rate cut continues to be deferred, with odds remaining below 50% until March 2024.
Elsewhere
Swiss unemployment rate and foreign currency reserves, Germany industrial production, France trade balance and Italy retail sales will be released in European session. Canada will also publish job data in US session.
USD/JPY Daily Outlook
Daily Pivots: (S1) 143.53; (P) 144.10; (R1) 144.63; More...
Intraday bias in USD/JPY remains neutral at this point. Correction from 145.06 is in progress and break of 143.54 will turn bias to the downside for deeper fall. Still, overall outlook remains bullish with 140.90 resistance turned support intact. Break of 145.06 will resume larger rise to 161.8% projection of 127.20 to 137.90 from 129.62 at 146.93.
In the bigger picture, rise from 127.20 is currently seen as the second leg of the corrective pattern from 151.93 high. Further rally is expected as long as 138.75 support holds, to retest 151.93. But strong resistance could be seen there to limit upside. Break of 138.75 will indicate the the third leg has started back towards 127.20.
Economic Indicators Update
| GMT | Ccy | Events | Actual | Forecast | Previous | Revised |
|---|---|---|---|---|---|---|
| 23:30 | JPY | Labor Cash Earnings Y/Y May | 2.50% | 1.20% | 1.00% | 0.80% |
| 23:30 | JPY | Overall Household Spending Y/Y May | -4.00% | -2.40% | -4.40% | |
| 05:00 | JPY | Leading Economic Index May P | 109.5% | 97.50% | 96.80% | |
| 05:45 | CHF | Unemployment Rate Jun | 2.00% | 2.00% | ||
| 06:00 | EUR | Germany Industrial Production M/M May | 0.10% | 0.30% | ||
| 06:45 | EUR | France Trade Balance (EUR) May | -9.5B | -9.7B | ||
| 07:00 | CHF | Foreign Currency Reserves (CHF) Jun | 734B | |||
| 08:00 | EUR | Italy Retail Sales M/M May | 0.10% | 0.20% | ||
| 12:30 | USD | Nonfarm Payrolls Jun | 220K | 339K | ||
| 12:30 | USD | Unemployment Rate Jun | 3.70% | 3.70% | ||
| 12:30 | USD | Average Hourly Earnings M/M Jun | 0.30% | 0.30% | ||
| 12:30 | CAD | Net Change in Employment Jun | 19.8K | -17.3K | ||
| 12:30 | CAD | Unemployment Rate Jun | 5.30% | 5.20% | ||
| 14:00 | CAD | Ivey PMI Jun | 50.9 | 53.5 |
Bets on two more Fed hikes gaining traction ahead of NFP
Financial markets are awaiting with bated breath today's US non-farm payrolls data, as labor market tightness continues to be a crucial variable in shaping Fed future policy trajectory. Market consensus predicts a healthy growth of 220k jobs in June, while unemployment rate is forecast to remain steady at 3.70%. Average hourly earnings are projected to see a moderate increase of 0.3% mom.
With the backdrop of this week's related data, risks appear to be tilted towards a positive surprise. ADP reported private employment growth of 497k, which is almost double the anticipated 250k. ISM services employment bounced back from 49.2 to 53.1, while ISM manufacturing employment slipped from 51.4 to 48.1. The robust surge in service sector seems capable of more than compensating for the downturn in manufacturing sector.
Ahead of the job report, Fed funds futures are pricing in a 92.4% likelihood of an additional 25 bps hike, which would bring rates to 5.25-5.50% at FOMC meeting in July.
Market participants appear to remain somewhat skeptical of FOMC members' "strong majority" opinion that two or more rate hikes are necessary in 2023. However, probability of more tightening beyond July is gaining traction. Chance of interest rate reaching 5.50-5.75% in November currently stands at 46%.
Simultaneously, expectation for the first rate cut continues to be deferred, with odds remaining below 50% until March 2024.