

Sample Category Title
EUR/AUD Daily Outlook
Daily Pivots: (S1) 1.6313; (P) 1.6377; (R1) 1.6504; More...
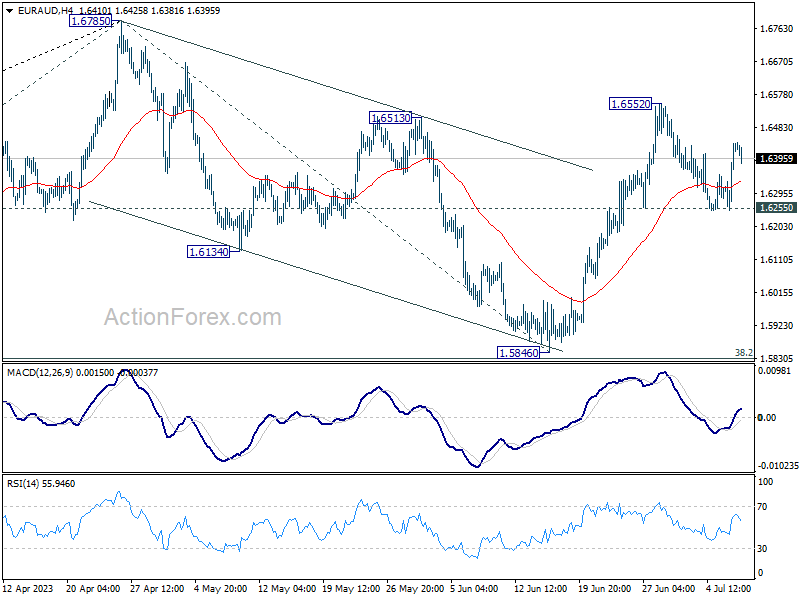
EUR/AUD rebounded after drawing support from 1.6255 but stays below 1.6552 resistance. Intraday bias remains neutral first. Further rally is expected with 1.6255 support intact. As noted before, correction from 1.6785 should have completed with three waves down to 1.5846. Above 1.6552 will target a retest on 1.6785 high next. Nevertheless, on the downside, firm break of 1.6255 will dampen this view and turn bias to the downside for 1.5846 support.
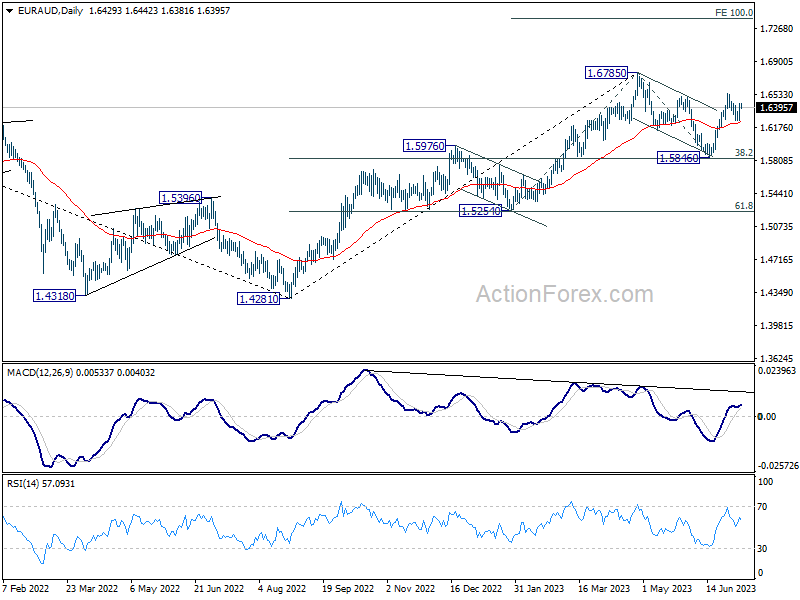
In the bigger picture, with 38.2% retracement of 1.4281 to 1.6785 at 1.5828 intact, rally from 1.4281 is still in progress. Firm break of 1.6785 will confirm rise resumption. Next target is 100% projection of 1.5254 to 1.6785 from 1.5846 at 1.7377. On the other hand, rejection by 1.6785 will extend the corrective pattern with another fall leg. But outlook will stay bullish as long as 1.5828 holds.
EUR/CHF Daily Outlook
Daily Pivots: (S1) 0.9738; (P) 0.9752; (R1) 0.9766; More...
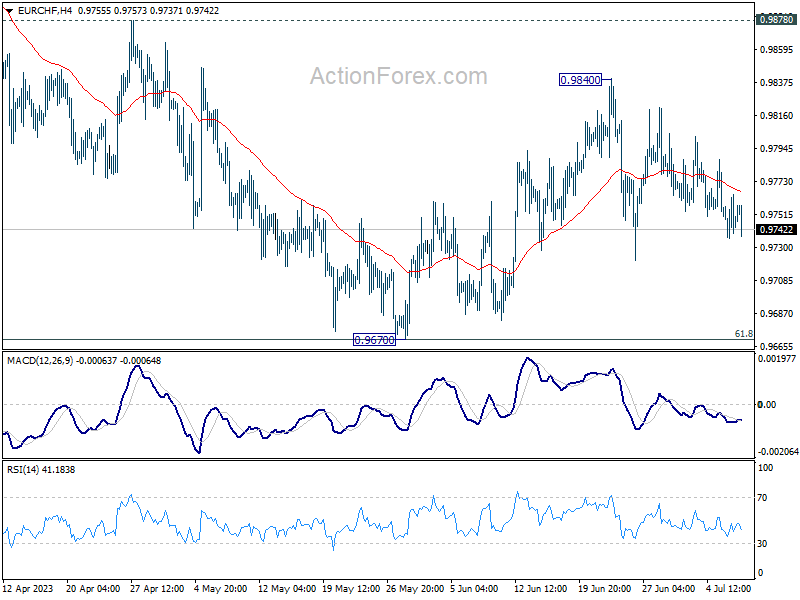
Intraday bias in EUR/CHF stays neutral as recent sideway trading is extending. On the upside break of 0.9840 will resume the choppy rebound from 0.9670. That will also revive the case that whole corrective decline from 1.0095 has completed at 0.9670. Further rally should be seen to 0.9878 resistance next. However, sustained trading below 0.9670 will resume the whole fall from 1.0095.
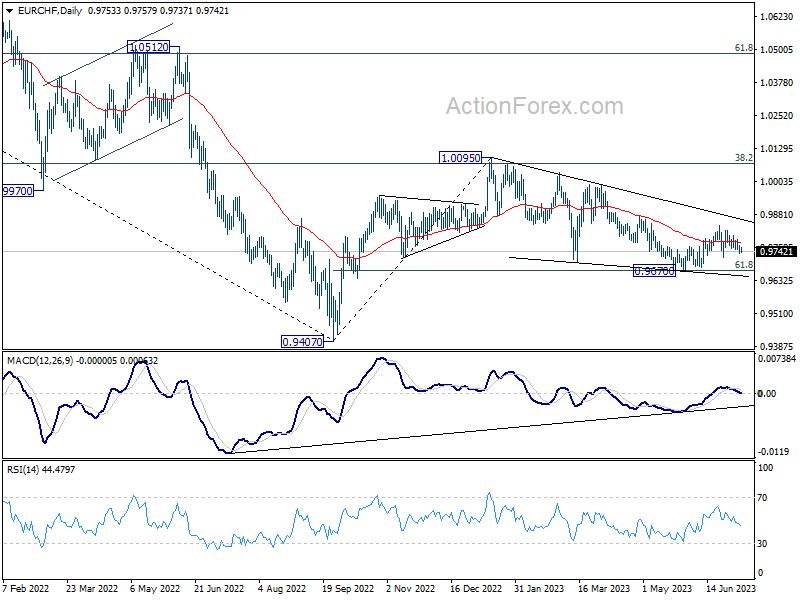
In the bigger picture, medium term outlook is staying bearish as the pair is capped below falling 55 W EMA (now at 0.9913). Down trend form 1.2004 (2018 high) is in favor to extend through 0.9407 at a later stage. Nevertheless, decisive break of 38.2% retracement of 1.1149 to 0.9407 will raise the chance of bullish trend reversal.
ECB Lagarde warns of simultaneous rise in company profits and wages
ECB President Christine Lagarde voiced concerns over lingering inflation risks in a recent interview with Geneviève Van Lède, conducted on July 5.
Lagarde noted that while inflation "has started to decline," it remains "still higher than our medium-term target of 2%," according to the ECB's staff projections. The expectation is for it to remain above target in 2024 and 2025, indicating a continued need to work towards reigning in inflation to meet the target.
On the economic growth front, Lagarde highlighted that growth "has been flat in the last two quarters." However, she added, "We estimate euro area growth to be around 0.9% in 2023." She further asserted that "we should see a return to potential growth over the period 2024-25."
Lagarde also pointed out an interesting development in the context of high inflation. She noted that current period of high inflation did not correspond with a decrease in firms' profit margins; in fact, margins saw an increase in certain instances, especially where demand for goods and services surpassed supply. Simultaneously, wages have experienced an unexpected rise.
In this complex backdrop, Lagarde stressed, "it is important to know whether firms are going to reduce their margins a little to meet their employees' expectations of higher wages and to restore some of their purchasing power," a trend typically seen during past inflation episodes.
Alternatively, there could be a twofold increase in margins and wages. She warned that a simultaneous increase in both would exacerbate inflation risks, cautioning that "we would not stand idly by in the face of such risks."
Gold Price Struggles While Crude Oil Price Aims Higher
Gold price is moving lower below the $1,918 support. Crude oil price is rising as the bulls aim for a move above the $72.20 resistance.
Important Takeaways for Gold and Oil Prices Analysis Today
- Gold price failed to clear the $1,930 resistance and start a fresh decline against the US Dollar.
- A major bearish trend line is forming with resistance near $1,925 on the hourly chart of gold at FXOpen.
- Crude oil prices are also moving higher above the $71.50 resistance zone.
- There is a key bullish trend line forming with support near $70.50 on the hourly chart of XTI/USD at FXOpen.
Gold Price Technical Analysis
On the hourly chart of Gold at FXOpen, the price struggled to start a fresh increase above the $1,930 resistance. The price started a fresh decline below the $1,918 support.
There was a close below the 50-hour simple moving average and $1,912. It tested the $1,910 support zone. A low is formed at $1,902.60 and the price is now consolidating losses above the 23.6% Fib retracement level of the downward move from the $1,927 swing high to the $1,902 low.
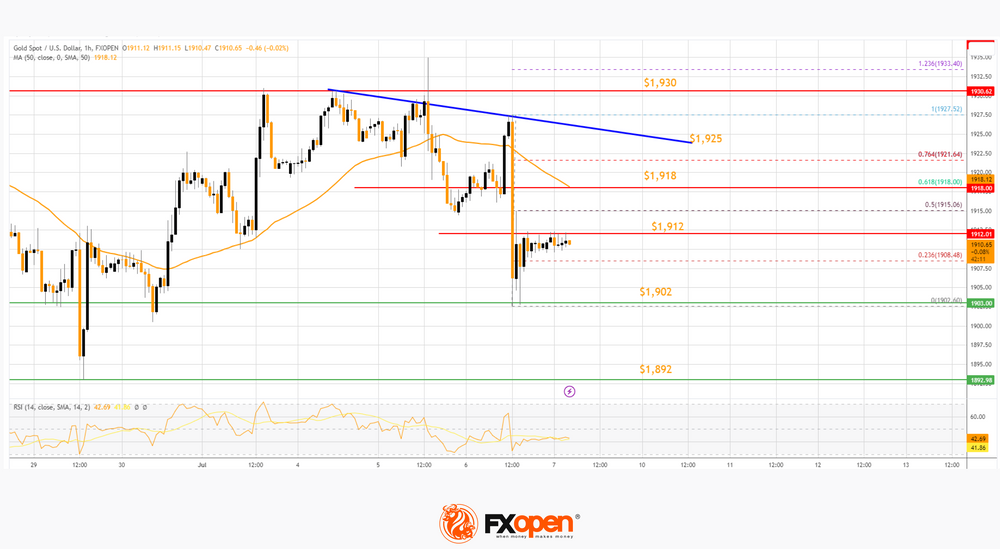
The price is now facing resistance near the $1,912 level. The next major resistance is near the 50-hour simple moving average at $1,918. It is close to the 61.8% Fib retracement level of the downward move from the $1,927 swing high to the $1,902 low.
The main resistance is near a bearish trend line at $1,925 and then $1,930. An upside break above the $1,930 resistance could send Gold price toward $1,938. Any more gains may perhaps set the pace for an increase toward the $1,950 level.
Initial support on the downside is near the $1,902 level. The first major support is near the $1,892 level. If there is a downside break below the $1,892 support, the price might decline further. In the stated case, the price might drop toward the $1,880 support.
Oil Price Technical Analysis
On the hourly chart of WTI Crude Oil at FXOpen, the price remained stable above the $69.50 support against the US Dollar. A base was formed and the price started a decent increase above the $71 level.
There was a clear move above the 50% Fib retracement level of the downward move from the $72.32 swing high to the $70.23 low. It is now trading above the 50-hour simple moving average and the RSI is rising toward 60.
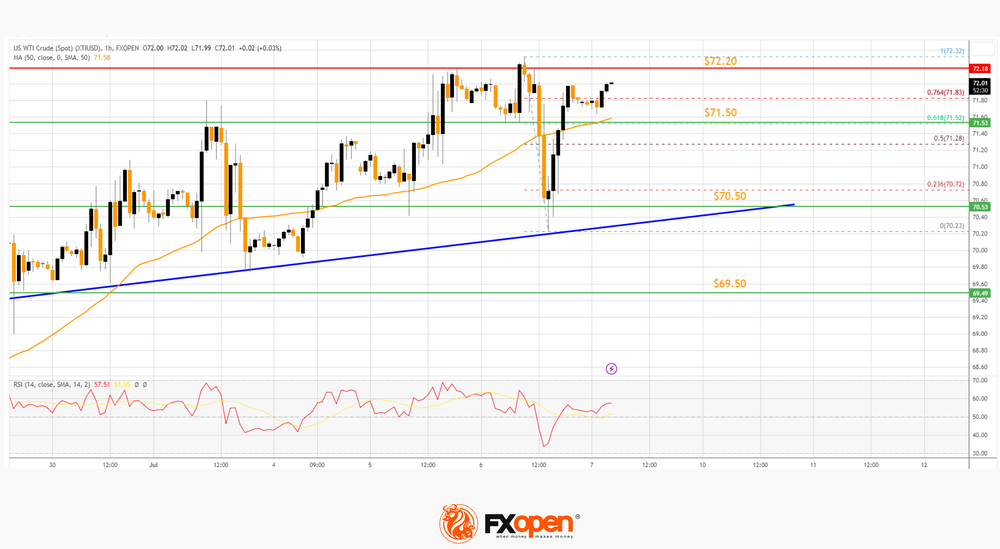
The bulls are showing strength above the 76.4% Fib retracement level of the downward move from the $72.32 swing high to the $70.23 low.
If the price climbs further higher, it could face resistance near $72.20. The first major resistance is near the $72.50 level. Any more gains might send the price toward the $74.00 level in the coming days.
Conversely, the price might correct gains and retest the 50-hour simple moving average at $71.50. The next major support on the WTI crude oil chart is near $70.50 and a connecting bullish trend line. If there is a downside break, the price might decline toward $69.50. Any more losses may perhaps open the doors for a move toward the $68.20 support zone.
Is It Finally Time for a Meaningful Correction in CHFJPY?
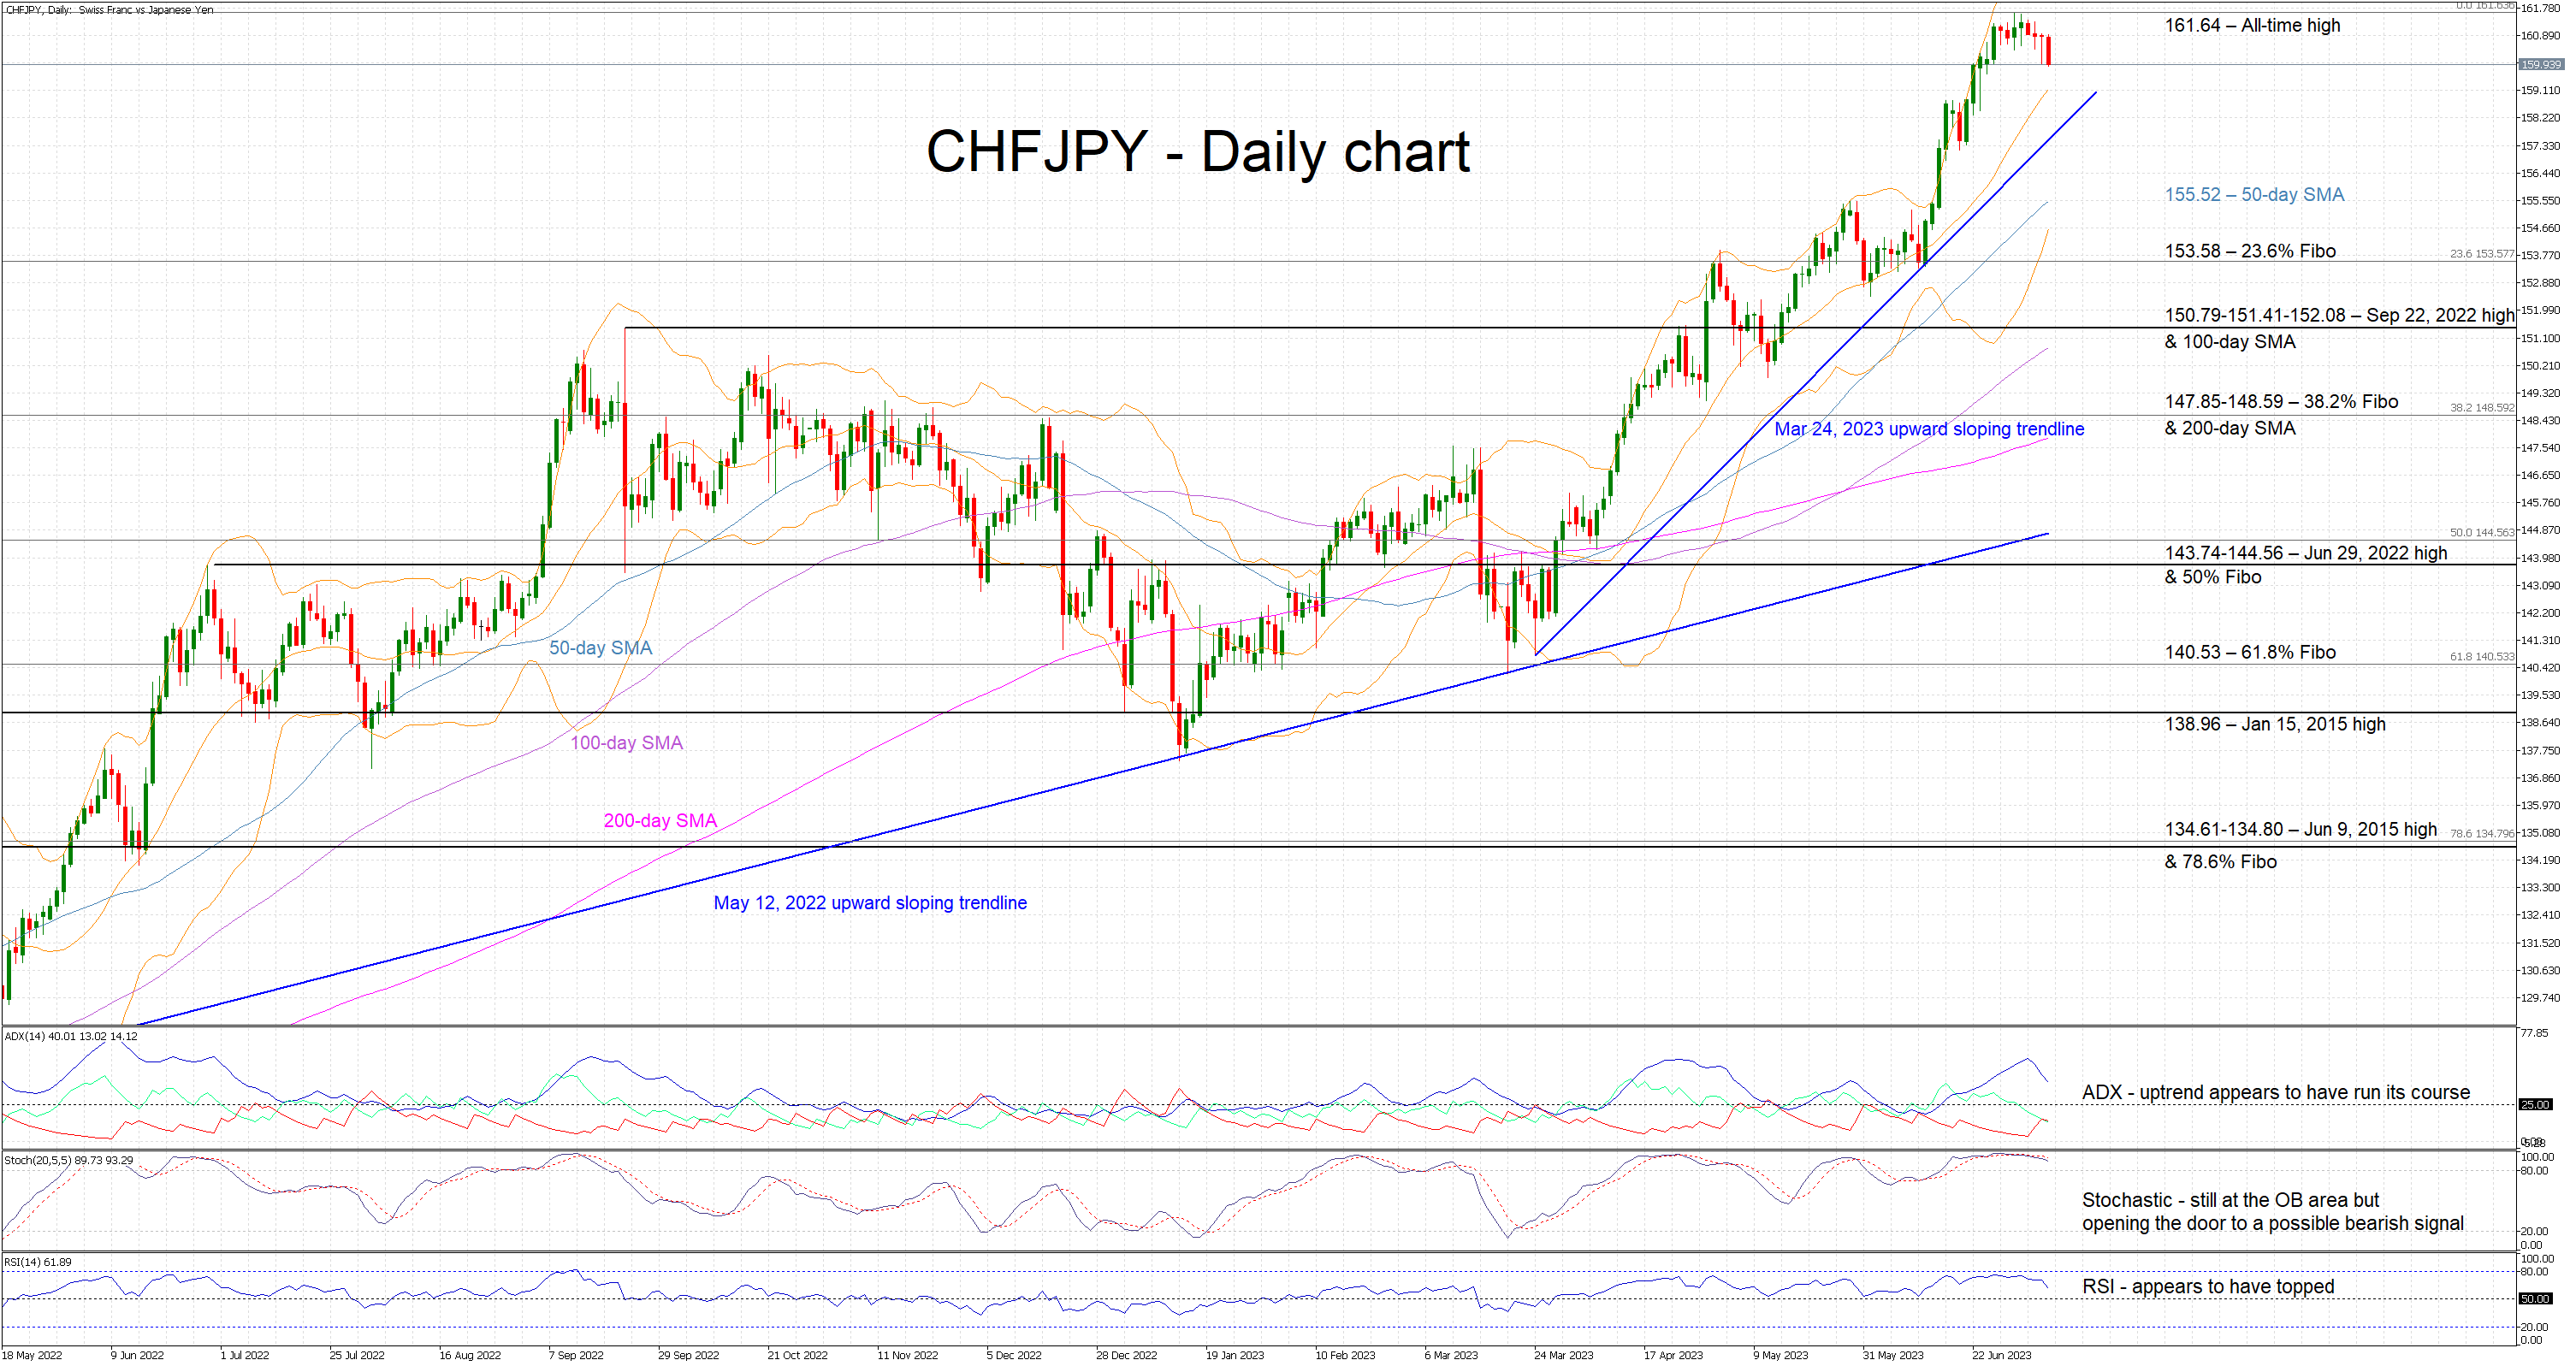
CHFJPY is experiencing its fourth consecutive red-candle session after recording an all-time high of 161.64. It has been an almost exponential move from the January 13, 2023 low of 137.42 and like other JPY pairs, CHFJPY has not experienced a proper correction since the mid-March sell-off.
The momentum indicators are gradually opening the door to a sizeable pullback. The stochastic oscillator is gliding lower but remains in its overbought (OB) territory. A break below its OB area would be clearly seen as a bearish sign. Similarly, the RSI appears to have topped and it is now heading towards its 50-midpoint. More interestingly, the Average Directional Movement Index (ADX) seems to give the strongest rally-exhaustion signal. It is moving aggressively lower, supporting the argument that the recent bullish trend has potentially run its course for now.
Should the bearish signals multiply, the CHFJPY bears would be keen for a move towards the 50-day simple average (SMA) at 155.52, provided that they successfully overcome the March 24, 2023 upward sloping trendline. They could then set their eyes on the 23.6% Fibonacci retracement of the May 15, 2022 – June 30, 2023 uptrend at 153.58.
On the other hand, the bulls’ aim seems easier despite the fact that they continue to venture into uncharted waters. They may decide to make another all-time high, above the current high of 161.64, aiming for the 165 level.
To sum up, CHFJPY bulls remain comfortably in control of the market, but the chances of a correction are gradually increasing. Bulls could begrudgingly accept a short-term sell-off provided that it does not push CHFJPY below the March 24, 2023 upward sloping trendline.
USDCAD Rebounds Strongly from 9-month Lows
USDCAD had been in a steady downtrend since late May, generating a clear structure of lower lows. However, the pair found its feet at the nine-month bottom of 1.3115 and retraced back higher, with the price challenging the ascending trendline that connects the pair's higher lows from November 2022 since early May.
The momentum indicators currently suggest that near-term risks are tilted to the upside. Specifically, the RSI is flatlining comfortably above its 50-neutral mark, while the stochastics are positively charged within the 80-overbought zone.
Should the price extend its advance above the trendline and the 50-day simple moving average (SMA), initial resistance could be found at 1.3460. Jumping above the latter, the pair could face the April peak of 1.3666. Even higher, the spotlight could turn to the 1.3700 psychological mark, which held strong in December 2022.
Alternatively, if the recovery falters and the pair dives lower again, the May support of 1.3319 may curb any downside attempts. A break below that zone could trigger a retreat towards the February low of 1.3262. Failing to halt there, the price might then revisit the August 2022 bottom of 1.3225.
In brief, USDCAD has been in a recovery phase after its steep decline came to a halt at a fresh 2023 low. For that rebound to resume, the price needs to reclaim its 50-day SMA.

EUR/USD Technical Analysis
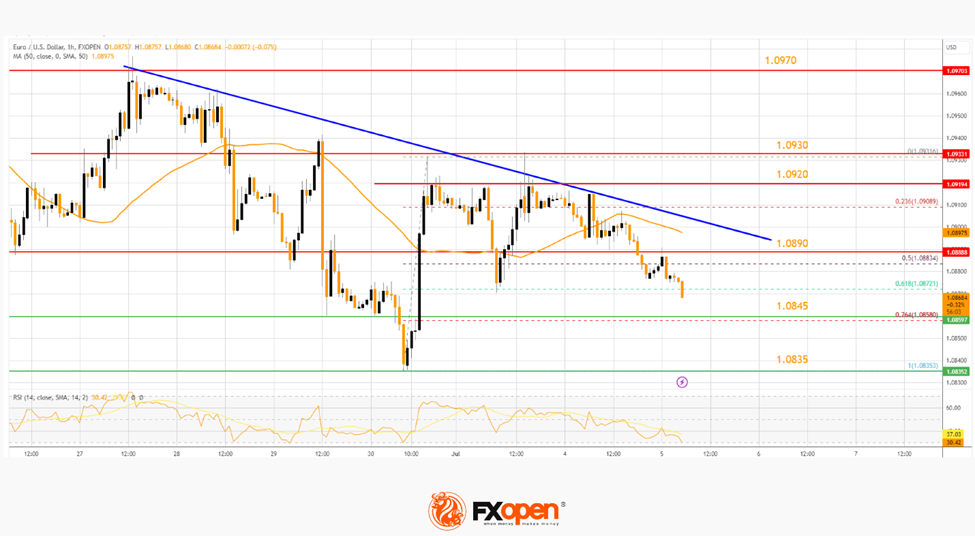
On the hourly chart of EUR/USD at FXOpen, the pair started a decent increase from the 1.0835 zone. The Euro climbed above the 1.0860 resistance against the US Dollar.
There was a break above the 50-hour simple moving average. It is now facing strong resistance near a connecting bearish trend line at 1.0890. A clear move above the trend line might send the pair toward the 1.0920 resistance.
The next major resistance is near the 1.0930 zone. Any more gains might send the pair toward the 1.0980 resistance.
Conversely, the pair might start another decline and retest the 50-hour simple moving average at 1.0875. The next major support is near 1.0860, below which EUR/USD could test the 1.0835 support. Any more losses could send the pair to 1.0810.
No Summer Lull for Global Equities
- Bullish breakout seen in US Treasury 10-year yield above 3.90%, next resistance at 4.46%.
- Long-duration assets (fixed income & growth stocks) sold off and underperformed in the past two days.
- Record low level of implied correlation among S&P 500 stocks may lead to a spike in VIX.
- Asian stocks underperformed reinforced by a weak yuan despite subtle interventions by PBoC.
Déjà vu, it’s all about government bond yields again
In the past two days, we have seen several significant movements in the global financial markets. First, let’s start with the sovereign bond yields, which are considered the all-important “risk-free” interest rates to be used as a benchmark to price a wide myriad of financial instruments from plain-vanilla corporate, consumer loans to exotic structured products that involve derivatives. Hence, any big moves in these “risk-free” interest rates will have a huge ripple effect and may trigger abrupt vibration across cross-assets.
Since the start of June 2023, sovereign bond yields across the curve (different maturities) have started to revert to their respective medium-term uptrend phases with the shorter-dated yields rising a higher magnitude over their long-term dated peers reinforced by “higher interest rates for longer-periods” monetary policies guidance advocated major developed central banks with the exception in Japan and China.
Long-dated sovereign yields increased at a faster rate than shorter-dated yields
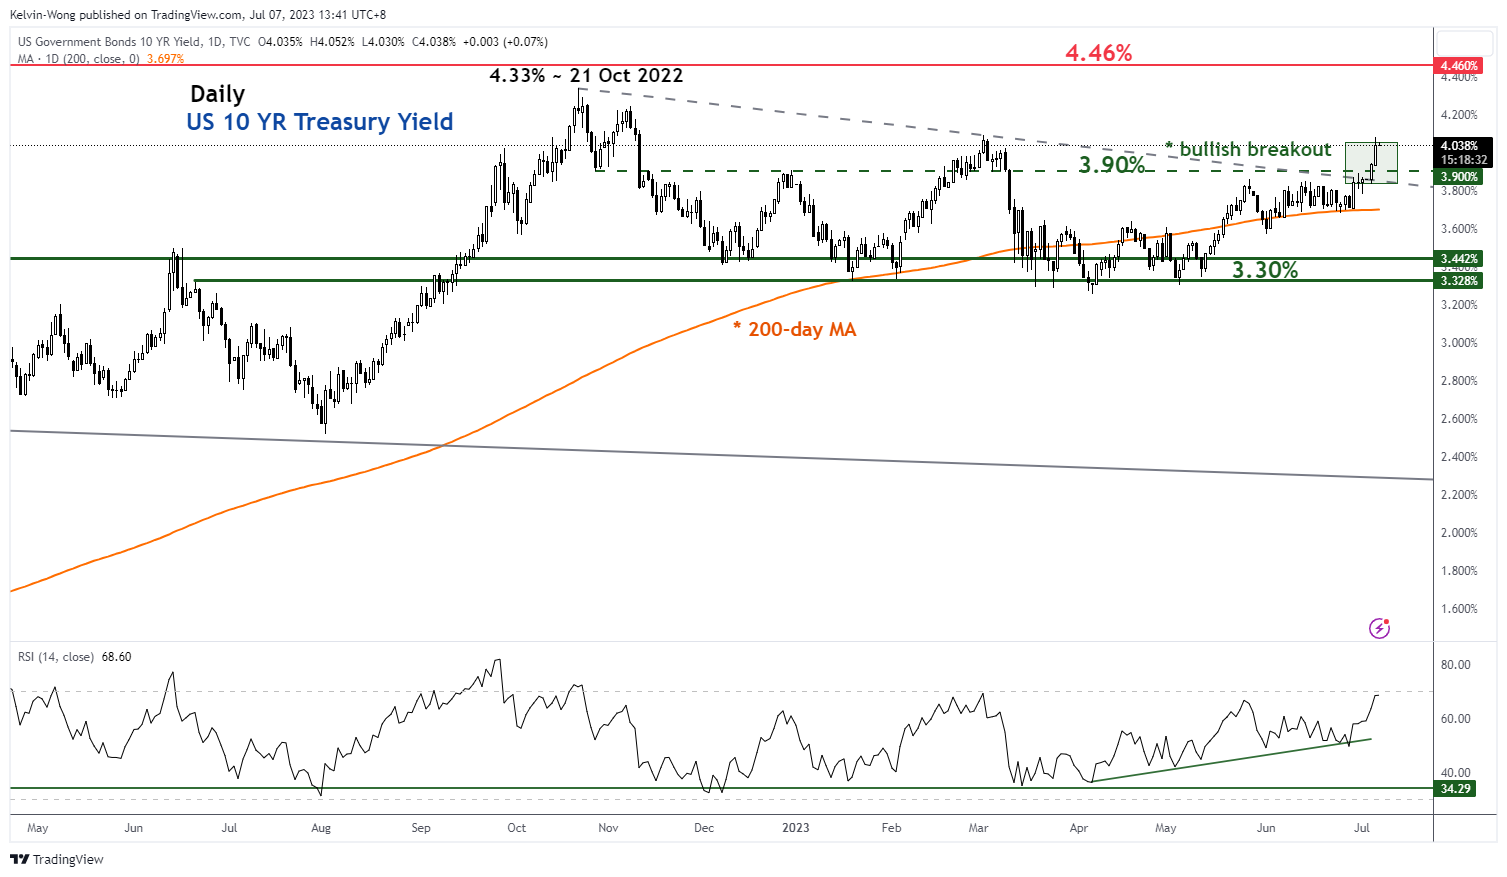
Fig 1: US Treasury 10-year yield medium-term trend as of 7 Jul 2023 (Source: TradingView, click to enlarge chart)
Interestingly in the past two days, the pendulum has shifted where the momentum of the longer-dated yields rose at a faster pace; the US Treasury 10-year yield rallied by 18 basis points (bps) versus the 2-year yield with a gain of 8 bps. It is likely to be triggered by flows and technical factors where the US Treasury 10-year yield has finally managed to clear a key intermediate resistance level of 3.90% on Wednesday, 5 July which has capped its prior price actions within a range-bound environment since 21 October 2022.
Duration risk and implied volatilities increase
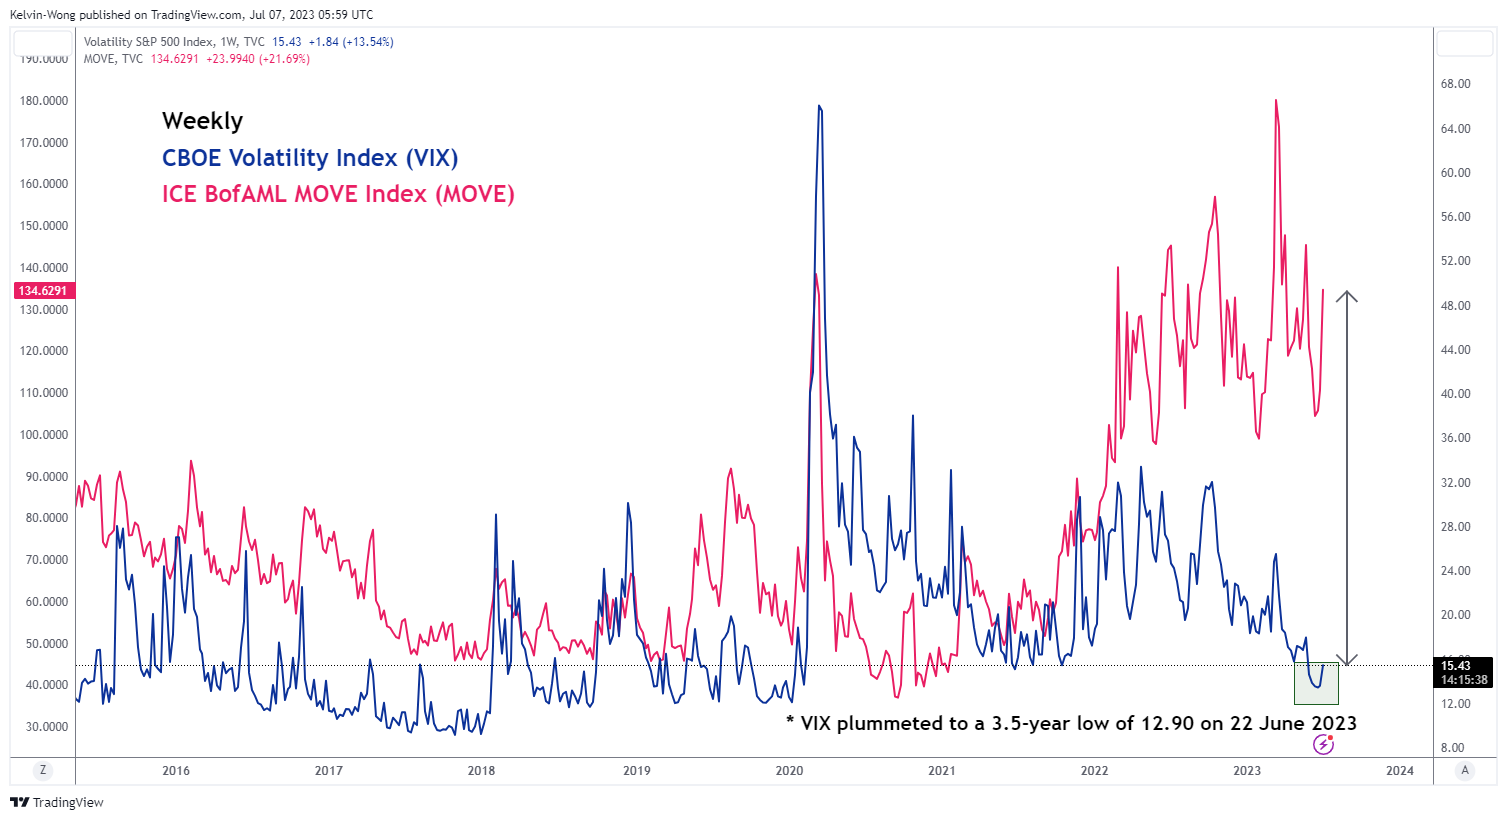
Fig 2: CBOE VIX & ICE BofAML MOVE as of 6 Jul 2023 (Source: TradingView, click to enlarge chart)
Duration risk embedded in long-duration financial assets has increased due to changes in the potential repricing behaviour of market participants. Longer-dated bonds sold off and long-duration growth equities that tend not to have stable or negligible dividend payouts underperformed.
The iShares US 20+ year Treasury Bond exchange-traded fund dropped by -2.33% in the past two days to its lowest level last seen in late December 2022. Over the same period in the equities space, the Russell 2000 consists of small-caps declined by 2.88% and semiconductors, a key emerging technology sector theme play that rallied by 45% in the first six months of this year fuelled by the optimism in artificial intelligence’s future productivity gains for the economy shed -3.44% seen in the iShares PHLX Semiconductor exchange-traded fund.
The ICE BofAML MOVE Index which tracks the aggregate US Treasuries’ yield implied volatility across different maturities via options has jumped by 35% from Monday, 3 July to a level not seen early March this year before the flared up of US regional banks turmoil. Hence, US banking stocks also took a severe beating in the last two trading sessions where the SPDR S&P Bank and Regional Banking exchange-traded funds declined by -2.89% and -2.92% respectively due to heightened fears of duration risk mismatch in their balance sheets.
In general, equities’ implied volatility inferred from the CBOE VIX index has started to tick up as well but at a lower magnitude, it has jumped up to 15.43 from a 3.5-year low of 12.90 printed on 22 June 2023.
Low correlation among S&P 500 constituents may lead to a further spike in VIX
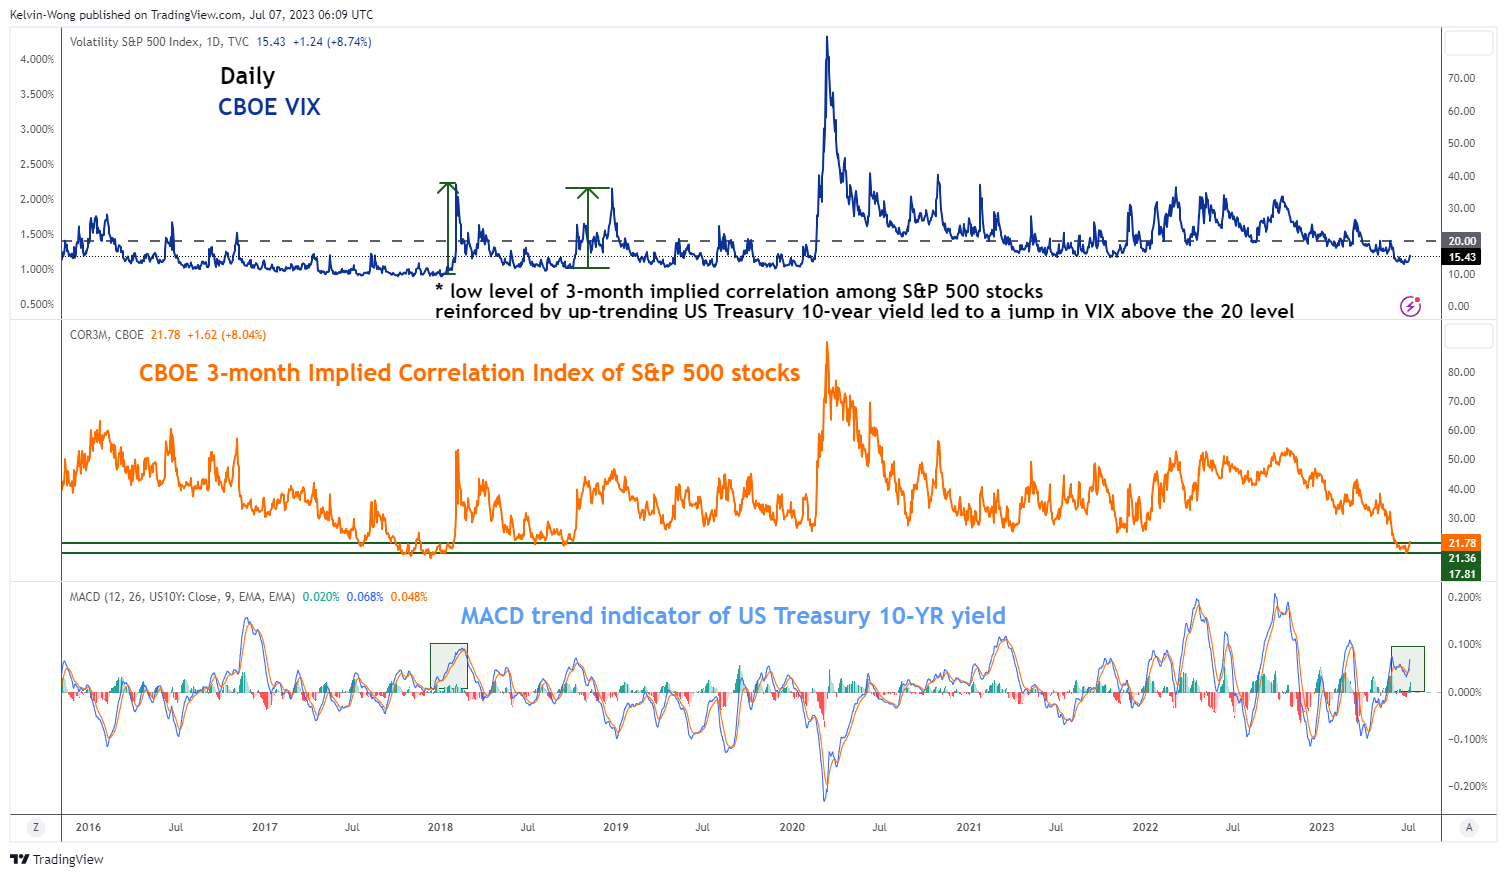
Fig 3: CBOE VIX, implied correlation index of S&P 500 stocks & MACD trend indicator of UST 10-year yield as of 6 Jul 2023
(Source: TradingView, click to enlarge chart)
An interesting point to note is that the prior low level of VIX has coincided with market participants’ perceptions of future low correlation readings of the US S&P 500 index constituents reinforced by a significant portion (more than 80%) of the gains of the S&P 500’s first 6-month return of +15.91% has been contributed by just a handful of mega-cap technology stocks and Tesla.
The CBOE 3-month Implied Correlation Index that measures the 3-month expected correlation across the top 50 value-weighted S&P 500 constituents has dipped close to a 5.5-year low of 17.81 on Wednesday, 5 July which suggests a potential high degree of calm and complacency among market participants.
Based on past data, such low compressed levels of 3-month expected correlation across the top 50 value-weighted S&P 500 constituents and the VIX can set up a significant increase in equities’ volatility triggered by a macro systemic negative shock.
For example, during the period from January to February 2018, the VIX jumped above the 20 level with the MACD trend indicator of the US Treasury 10-year yield that exhibited an uptrend condition, and such a similar condition has been depicted recently at the start of June 2023.
Double whammy for Asian stocks
Since the start of this week, Asian benchmark indices have underperformed the US. The MSCI All Country Asia ex Japan has declined by 1.49% with Japan’s Nikkei 225 loss of -2.17%, surpassing the US S&P 500 (-0.87%) dragged down by China proxies and a weak yuan. The Hang Seng indices were the worst performer so far In Asia; the Hang Seng Index (-2.40%) and Hang Seng China Enterprises Index (-2.67%) intra-week performances at this time of the writing.
Despite various subtle interventions conducted this week by China’s central bank, PBoC where it directed the major state banks to cut their US dollar deposits rates for the second time in a month to 2.8% from 4.3% previously as well as published a commentary in a state-backed media that China has ample tools to stabilize the foreign exchange market even if the yuan suffers a bout of panic selling, the USD/CNH (offshore yuan) just dipped slightly lower by -0.11% to 7.2465 from last week’s closing level of 7.2675.
The current weakness seen in the yuan is being supported by the widening of the positive yield spread of US Treasuries over China sovereign bonds, further reinforced by the past two days of rallies seen in the US Treasuries yields. All these movements trigger a negative feedback loop back into Asian stocks.
S&P 500 (SPX) Looking for Short Term Pullback
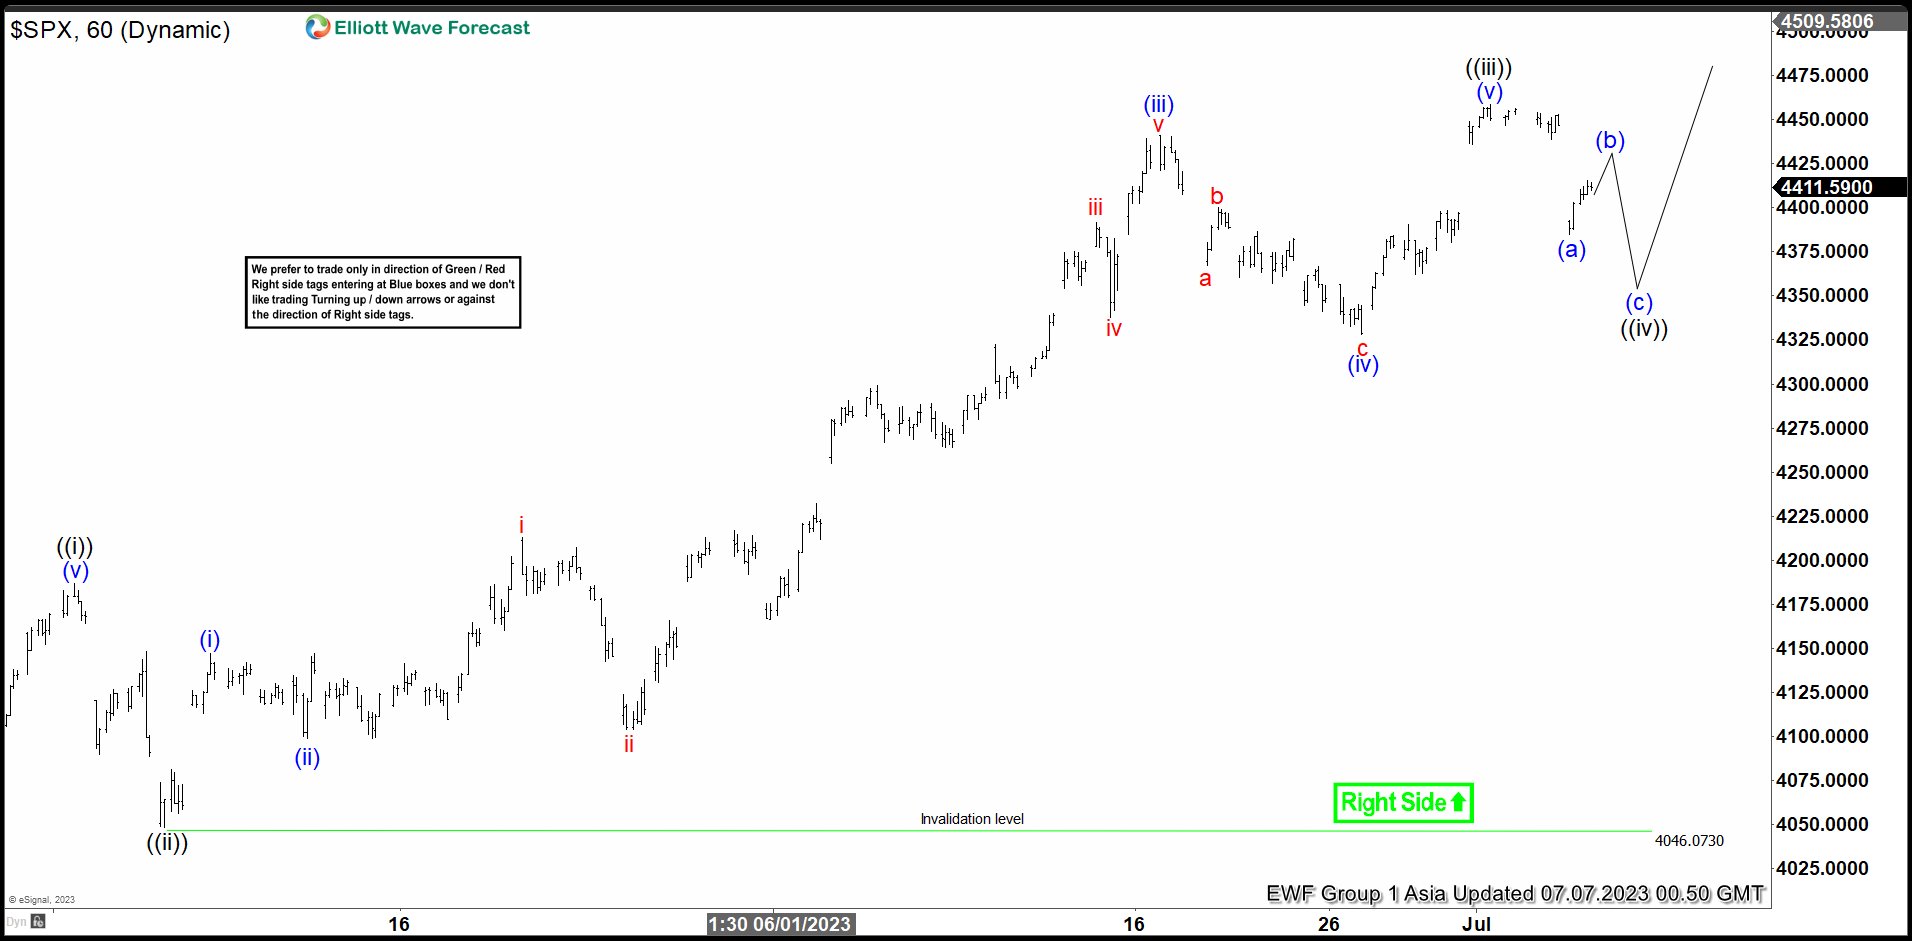
Short term Elliott Wave view in S&P 500 (SPX) suggests that the rally from 3.13.2023 low is unfolding as a 5 waves impulse structure. Up from 3.13.2023 low, wave ((i)) ended at 4186.92. Dips in wave ((ii)) ended at 4046.07 as the 60 minutes chart below shows. Up from there, wave (i) ended at 4147.02 and pullback in wave (ii) ended at 4098.92. Index extends higher in wave (iii) towards 4441.2 and dips in wave (iv) ended at 4328.08.
Final leg higher wave (v) ended at 4458.48 which completed wave ((iii)). Pullback in wave ((iv)) is in progress to correct cycle from 5.4.2023 low in 3, 7, or 11 swing. Down from wave ((iii)), wave (a) ended at 4385.05. Expect wave (b) rally to fail below 4458.48 and the Index to turn lower in wave (c) before it completes wave ((iv)) and resumes higher. Wave ((iv)) typically ends somewhere at the 23.6 – 38.2% Fibonacci retracement of wave ((iii)). That area is at 4301.2 – 4361.1. From here, the Index can find buyers for further upside. Near term, as far as pivot at 4046.07 low stays intact, expect pullback to find support in 3, 7, or 11 swing for further upside.
SPX 60 Minutes Elliott Wave Chart
SPX Elliott Wave Video
https://www.youtube.com/watch?v=YrzV8LRDrcc
Focus Evidently Turns to US Payrolls
Markets
Most major central banks recently said that they moved to ‘data dependent modus’. For some of them, this translates into a pause/skip or some other term giving them time to assess the impact of previous policy tightening on inflation and on growth. At least part of the policy makers and the market community assumed/feared that the tightening already put in place over the previous 12-18 months was at risk putting the economy on a path straight to recession. Quod non, so told yesterday’s US data. ADP June private job growth jumped an astonishing 497k (from 267k and 225k expected). Weekly Jobless claims at 248k stayed off the ‘highs’ recorded a few weeks. Last but not least, the US services ISM unexpectedly jumped from 50.3 to 53.9, with strong details too. (prices paid 54.1; employment again in outspoken growth territory at 53.1, orders reaccelerating to a strong 55.5). This kind of monthly data swings evidently needs confirmation. Even so, combined with mostly decent other data of late, one should be open to the idea that the (US) economy was only going through a temporary dip, with a solid labour market still putting a strong flow for demand. In this scenario, the CB’s wait-and-see pause only caused a loss of precious time in their attempt to bring inflation back under control. A reacceleration/catching up move in the pace of policy action then pops up as a logical conclusion. US yields jumped between 3.6 bps (2-y) and 9.75 bps (5 &10-y) with even higher peak levels intraday. The US 2-y yield touched a new cycle top at 5.12%, the highest level since mid-2007! The US 10-y yield almost touched the March top near 4.09%. The move was again mainly driven by a jump in the real yield (10-y hitting a new cycle top at 1.82). German yields added between 6.3 bps (2-y) and 14.8 bps (10-y). The rise in real yields this time triggered a setback on equity markets (S&P -0.79%, EuroStoxx 50 -2.93%). As was mostly the case of late, the impact on major currency cross rates again was modest. Smaller currency were hit by a jump in volatility. Despite the sharp rise in US real yields, the dollar even lost marginal ground (DXY close 103.17, EUR/USD 1.0089). The yen slightly outperformed on risk-aversion (USD/JPY 144.07).
Asian markets this morning open in risk-off modus, but given volatility on bond markets, the damage could have been bigger (Nikkei -0.93%). After yesterday’s barrage of ‘hawkish’ US data, the focus evidently turns to the US payrolls. A report slightly above expectations or even in line might already be enough to extend yesterday’s price pattern and push US yields on track of a break beyond key resistance levels (2-y 5/5.12%, US10-y 4.10% area). In theory a growing risk-off also should put the dollar (and the yen) in pole position.
News and views
Japanese wages rose more than expected in May. Labour cash earnings increased by 2.5% Y/Y vs 1.2% expected. It’s only the fourth time since the early 90’s that they rose at such pace (or more). It reflects the pay boost agreed in spring wage talks. Key unions and their employers reached an agreement to raise overall wages by the most since 1993 (3.8%) earlier this year. Adjusted for the cost of living though, real cash earnings fell 1.2% Y/Y (vs -2.7% Y/Y expected). Pressure on the Bank of Japan will nevertheless increase to pivot away from its ultra-accommodative monetary policy stance. The wage data clear an important hurdle on putting inflation on a sustained path to the 2% inflation target with BoJ governor Ueda at the ECB’s Sintra forum saying that wage growth should be slightly or well above 2% to achieve this. Japanese markets aren’t frontrunning any policy change. The Japanese yen has a small advantage over other majors (USD/JPY 143.70) with risk-off sentiment beating rising core (real) rates as main market driver. Japanese yields follow the global momentum with the 10y benchmark currently at 0.44% vs 0.40% yesterday morning. The BoJ has a 50 bps tolerance band around its 0% target for the 10y yield..
The National Bank of Poland kept its policy rate unchanged at 6.75% for a 10th straight meeting. Updated inflation forecasts show a faster CPI drop next year compared to March: 11.9% in 2023 (vs 11.85%), 5.25% in 2024 (vs 5.7%) and 3.6% in 2025 (vs 3.5%). Updated growth prognoses stand at 0.55% for this year (vs 0.85%), 2.35% next year (vs 2.1%) and 3.25% in 2025 (vs3.15%). The overall tone and forward guidance in the statement are again broadly unaltered (steady as they go). NBP governor Glapinski will hold a press conference this afternoon. The Polish zloty got hammered in yesterday’s market climate just like CZK and HUF. EUR/PLN bounced off recent lows the past two days to test 4.50 from 4.41.