Sample Category Title
BTC/USD Market Analysis: Happy Bitcoin Pizza Day
Exactly 13 years ago, programmer Laszlo Heinitz, for the first time in history, paid for a real product with bitcoins — two Papa John's mushroom pizzas with sausages, tomatoes and onions. The purchase cost him “only” 10k bitcoins (25 USD at the exchange rate at that time, almost $270 million at the current price of 1 bitcoin in US dollars).
Then cryptocurrencies were practically unknown, now they are being discussed at the G7 summit. At a meeting in Japan, the leaders agreed to continue consultations on how to regulate digital assets.
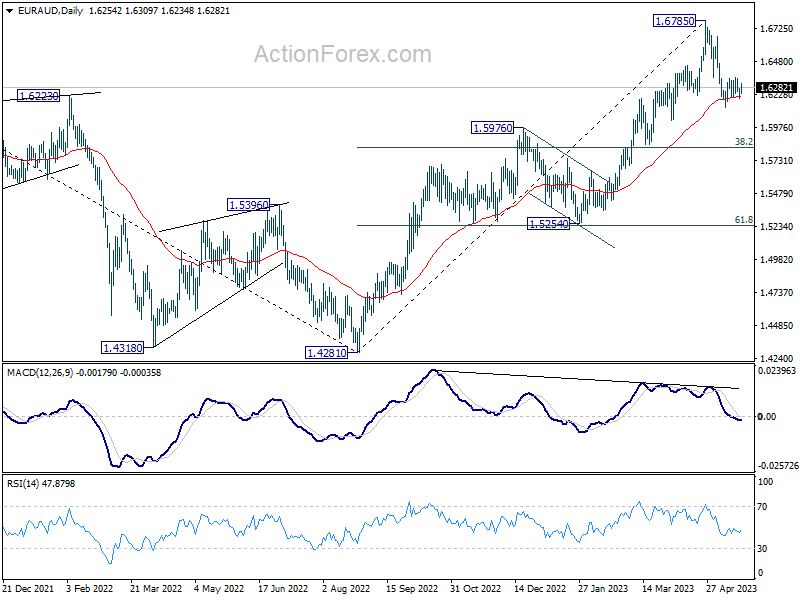
Meanwhile, bitcoin traders are looking with apprehension at the BTC/USD chart, which is forming a bearish head and shoulders (SHS) pattern. According to the classics of technical analysis, the breakdown of the “neck” level around 26,800 can lead to a downtrend. However, for this, sellers will have to apply serious pressure to overcome the support from the bottom line (1) of the ascending channel and the psychological mark (2) of USD 25k per bitcoin.
GBP/USD Struggles Below 1.2500 While EUR/GBP Remains at Risk
GBP/USD is struggling to clear the 1.2500 resistance zone. EUR/GBP is now consolidating losses below the 0.8700 resistance.
Important Takeaways for GBP/USD and EUR/GBP Analysis Today
- The British Pound is trading in a bearish zone below 1.2500 against the US Dollar.
- There was a break above a key bearish trend line with resistance near 1.2445 on the hourly chart of GBP/USD at FXOpen.
- EUR/GBP started a fresh decline from the 0.8710 resistance zone.
- There is a major bearish trend line forming with resistance near 0.8700 on the hourly chart at FXOpen.
GBP/USD Technical Analysis
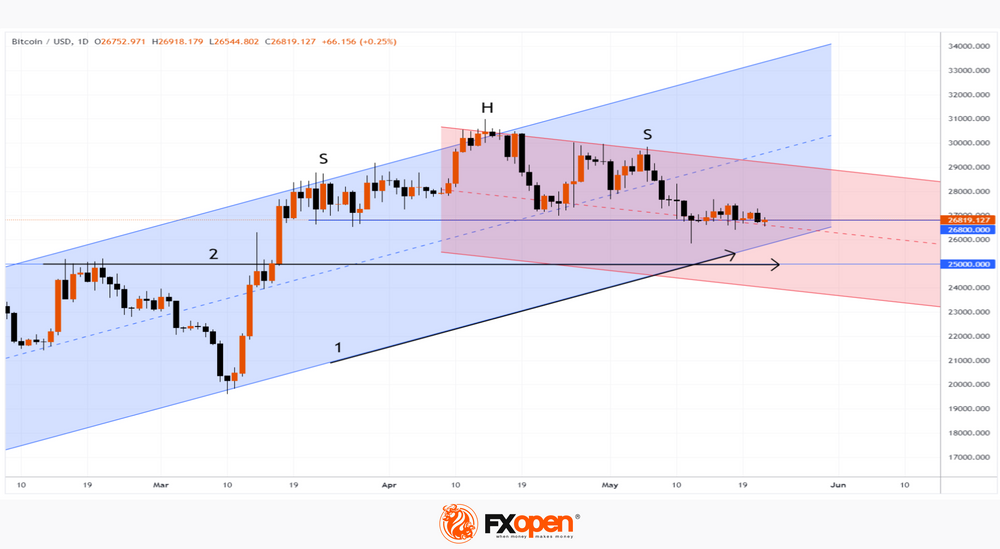
On the hourly chart of GBP/USD at FXOpen, the pair started a major decline from well above 1.2520. The British Pound traded below the 1.2500 support zone against the US Dollar.
The pair tested the 1.2390 support zone. A low was formed near 1.2391 and recently the pair started a fresh increase. There was a decent move above the 50-hour simple moving average at 1.2445. More importantly, there was a break above a key bearish trend line with resistance near 1.2445.
Finally, it spiked above the 61.8% Fib retracement level of the downward move from the 1.2510 swing high to the 1.2391 low. The GBP/USD chart indicates that the pair is facing resistance near the 1.2475 level.
The 76.4% Fib retracement level of the downward move from the 1.2510 swing high to the 1.2391 low is also near 1.2445. The next major resistance is near the 1.2500 level. A clear move above the 1.2500 level could spark a rally toward the 1.2540 level considering the RSI is above 50.
On the downside, there is a major support forming near the 1.2445 level. If there is a downside break below the 1.2445 support, the pair could accelerate lower.
The next major support is near the 1.2390 level, below which the pair could test 1.2350. In the stated case, GBP/USD may perhaps revisit the 1.2320 support. Any more losses could lead the pair toward the 1.2250 support.
EUR/GBP Technical Analysis
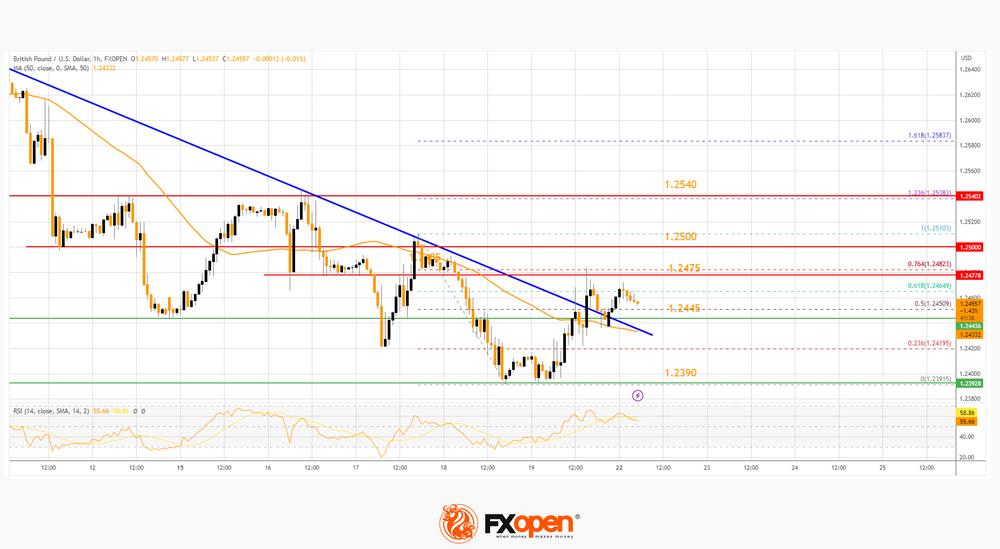
On the hourly chart of EUR/GBP at FXOpen, the pair started a fresh decline from the 0.8720 resistance. The Euro traded below the 0.8700 support to move into a bearish zone against the British Pound.
The EUR/GBP chart suggests that the pair settled below the 50-hour simple moving average and 0.8700. A low is formed near 0.8667 and the pair is slowly moving higher and the hourly RSI is back above 50. There was a break above the 23.6% Fib retracement level of the downward move from the 0.8734 swing high to the 0.8667 low.
Immediate resistance is near a major bearish trend line at 0.8700. It coincides with the 50% Fib retracement level of the downward move from the 0.8734 swing high to the 0.8667 low.
The next major resistance for the bulls is near the 0.8720 level. A close above the 0.8720 level might accelerate gains. In the stated case, the bulls may perhaps aim for a test of 0.8740. Any more gains might send the pair toward the 0.8780 level.
If there is no move above 0.8700, the pair could decline again. Immediate support sits at 0.8670. The next major support is near 0.8650.
A downside break below the 0.8650 support might call for more downsides. In the stated case, the pair could drop toward the 0.8600 support level.
Dollar Index Shows Positive Uptrend as US Debt Limit Negations Ready to Eesume
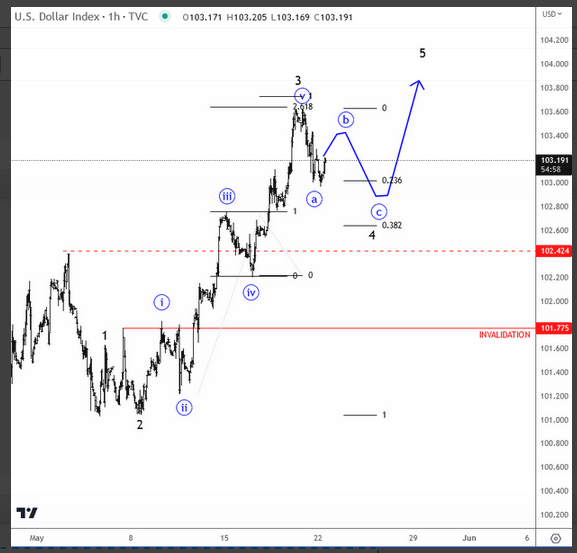
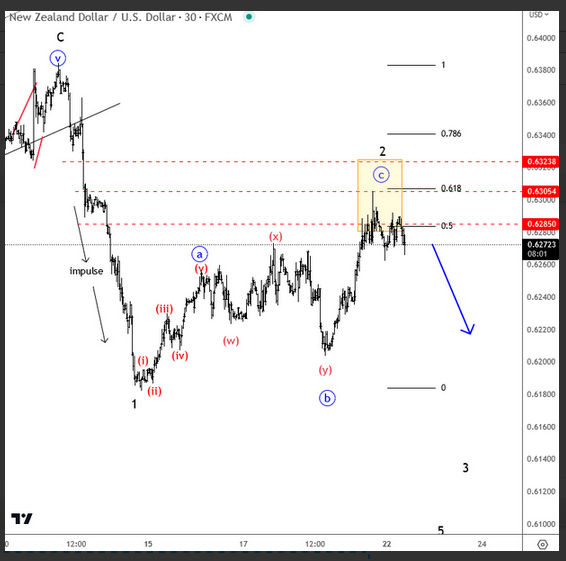
Markets can be volatile this week as US debt limit negations are ready to resume today. Then we have the EU PMI data tomorrow, followed by the RBNZ rate decision, FOMC meeting minutes and important UK CPI data on Wednesday. For now the USD remains strong, showing a clear uptrend on the hourly DXY chart where we track a bullish impulse that should resume after the current wave four set-back. Support is at 102.60/103 from where we will look higher, so at the same time other XXX/USD pairs can drop. We see kiwi forming an interesting recovery; a clear corrective rally after that shape leg down from May highs so I think that new sellers may show up this week, possibly after RBNZ rate decision.
USD/JPY: Bulls to Pause for Consolidation Before Resuming
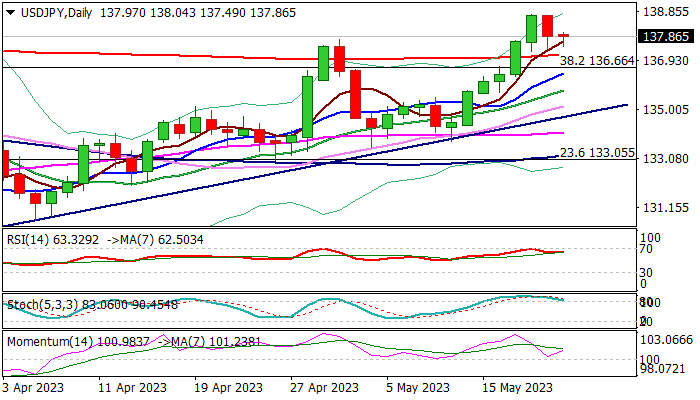
The USDJPY is consolidating under new multi-month high (138.74) as traders collected some profits after last week’s 1.65% advance.
Friday’s close above former tops at 137.90/77 (Mar 8 / May 2) added to bullish signals, however, overbought stochastic in daily chart suggest that consolidation would precede attack at 139.58/140.00 targets (50% retracement of 151.94/127.22 downtrend/psychological barrier).
Daily studies remain in full bullish setup and support the action, with consolidation to ideally stay above 137.13 (broken 200DMA) to maintain immediate upside prospects intact.
Extended dips should find ground above 136.66/44 zone (broken Fibo 38.2% of 151.94/127.22/rising 10DMA), to keep larger bulls in play.
The dollar was dented by surprise change in rhetoric of Fed Chair Powell, who said that it is unclear if interest rates will need to rise further, as inflation is proving hard to control, but full results of sharp increase in borrowing costs are still to be seen.
The Fed is likely to be more cautious, due to high uncertainty, and would make decision on meeting by meeting basis.
Debt ceiling negotiations unexpectedly broke off on Friday, adding pressure on dollar, but optimism about finding a deal persists and so far limiting negative impact on greenback.
Res: 138.74; 139.00; 139.58; 140.00.
Sup: 137.13; 136.66; 136.44; 135.75.
Gold Price Technical Analysis
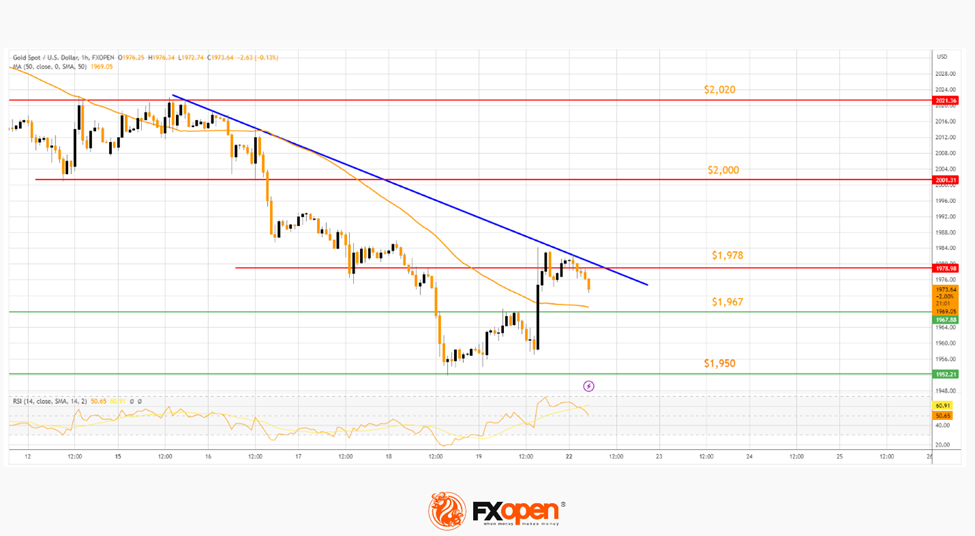
Gold price started a fresh decline from the $2,020 zone against the US Dollar. The price traded below the $2,000 level to move into a short-term bearish zone.
There was a clear move below the $1,967 level and the 50-hour simple moving average. A low was formed near $1,950 before the price started a recovery wave. It climbed above $1,967 and now facing resistance near a connecting bearish trend line at $1.978 on the hourly chart.
The next main resistance could be near the $2,000 level, above which the price could extend its rally toward the $2,020 level. Any more gains might send the price toward $2,050.
On the downside, immediate support is near the $1,967 level. The next major support is near the $1,950 level, below which the price might decline toward the $1,932 support level in the near term.
EURCHF Retreats to its Lowest Levels Since October 2022
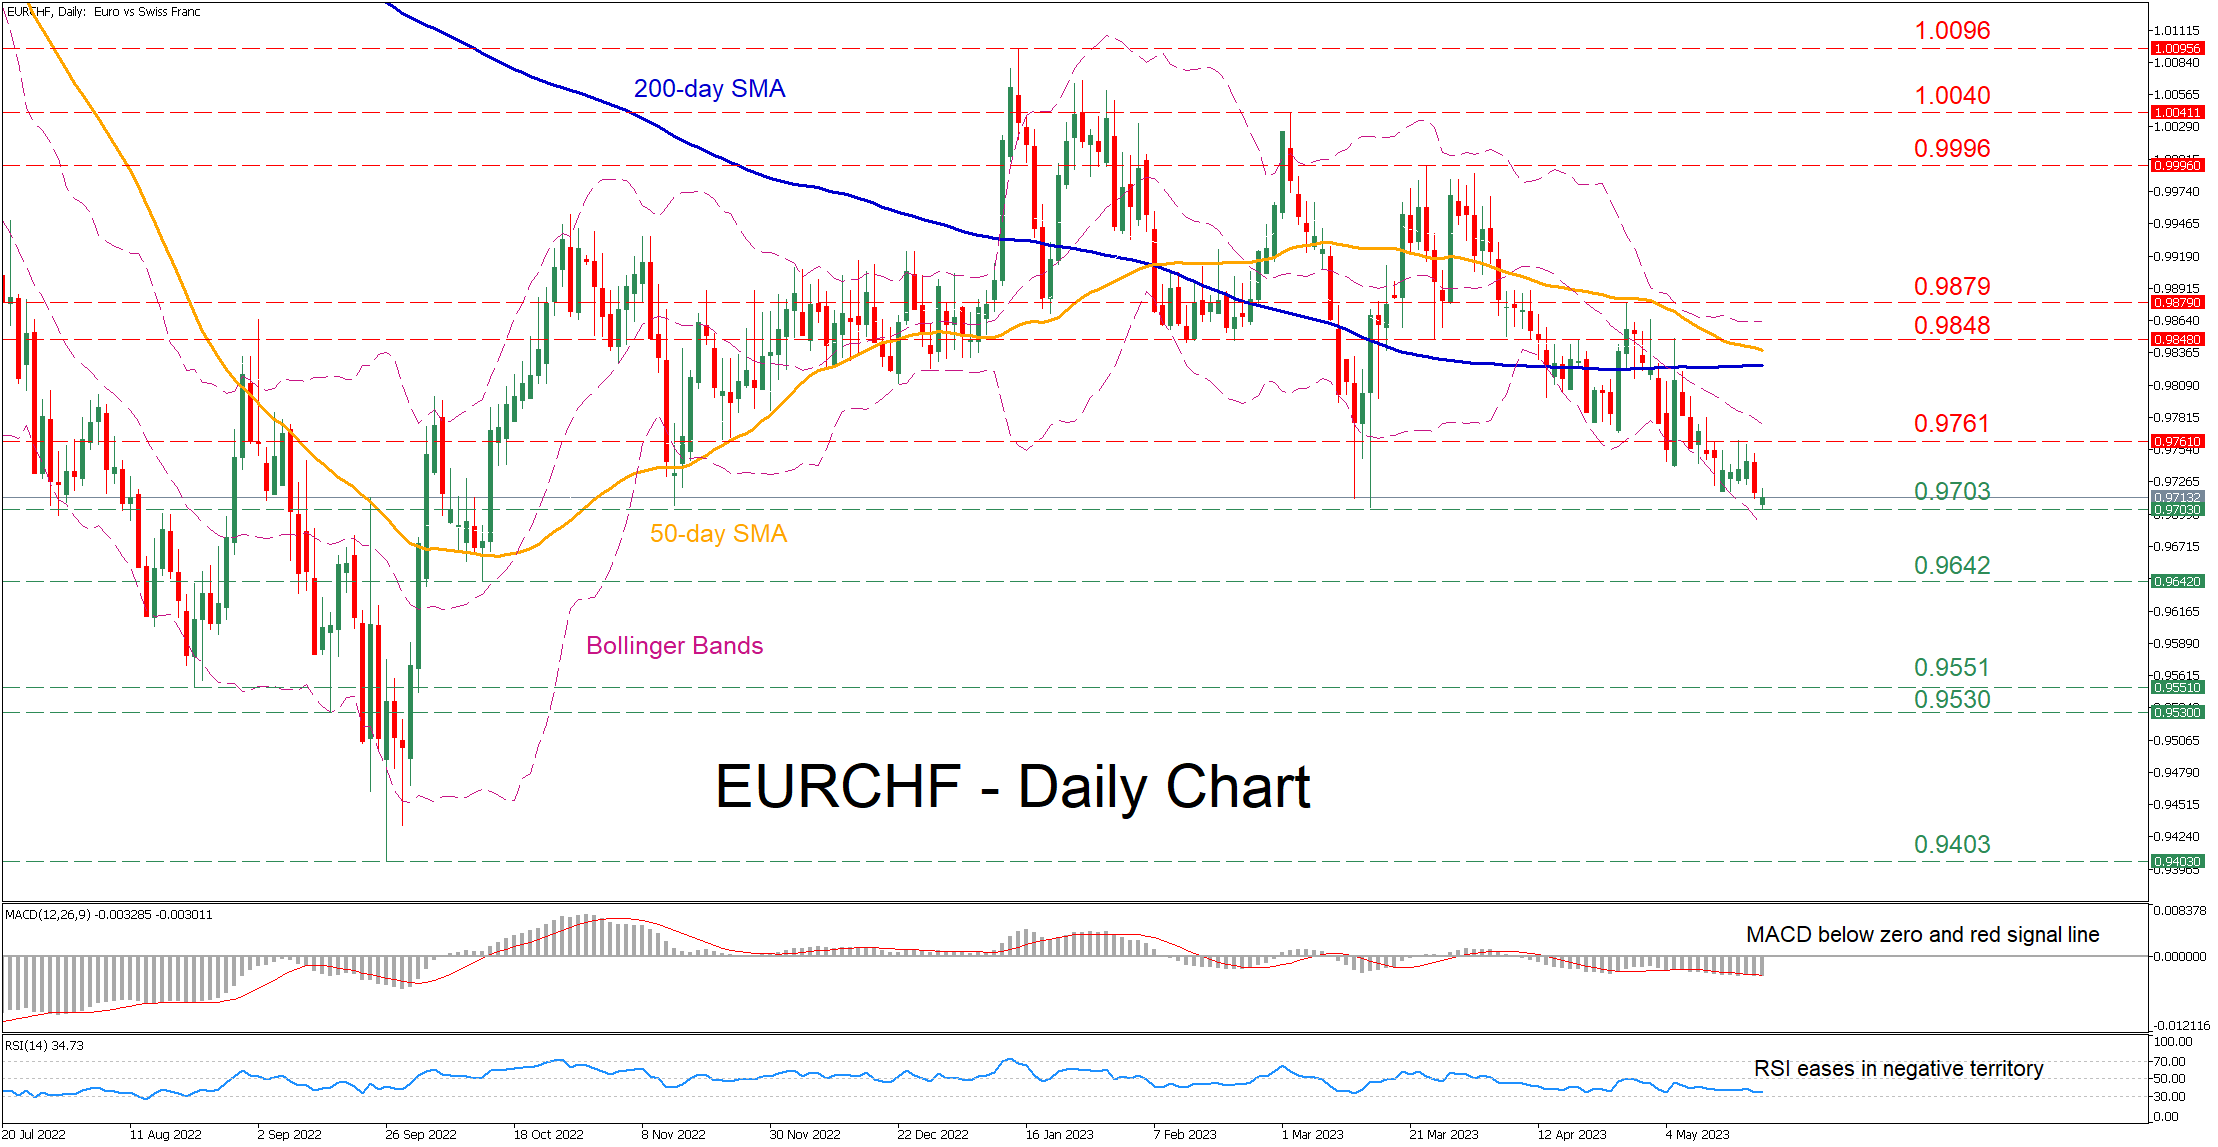
EURCHF has been trending lower since its latest rebound got rejected just shy of the parity level in late March. In today’s session, the pair posted a fresh seven-month low of 0.9703 before recouping some losses, indicating that this recent downtrend could resume.
The momentum indicators currently suggest that bearish forces are holding the upper hand. Specifically, the MACD is softening below both zero and its red signal line, while the RSI is flatlining near its 30-oversold zone.
If the price extends its retreat below today’s seven-month low, the October 2022 support of 0.9642 might prove to be a tough obstacle for the pair to overcome. If that barricade fails, the spotlight could turn to the August low of 0.9551 before the September support of 0.9530 appears on the radar. A violation of the latter may open the door for the 2022 bottom of 0.9403.
Alternatively, should the decline falter and the price reverse upwards, the bulls could attack the recent resistance of 0.9703. Crossing above that zone, the price could ascend towards 0.9848 or higher to challenge the April resistance of 0.9879. Further advances could then cease at the 0.9996 region.
Overall, EURCHF seems ready to extend its structure of lower highs and lower lows, while a potential completion of a death cross between the 50-day simple moving average (SMA) and the 200-day SMA could induce further negative pressures.
GBP/JPY Daily Outlook
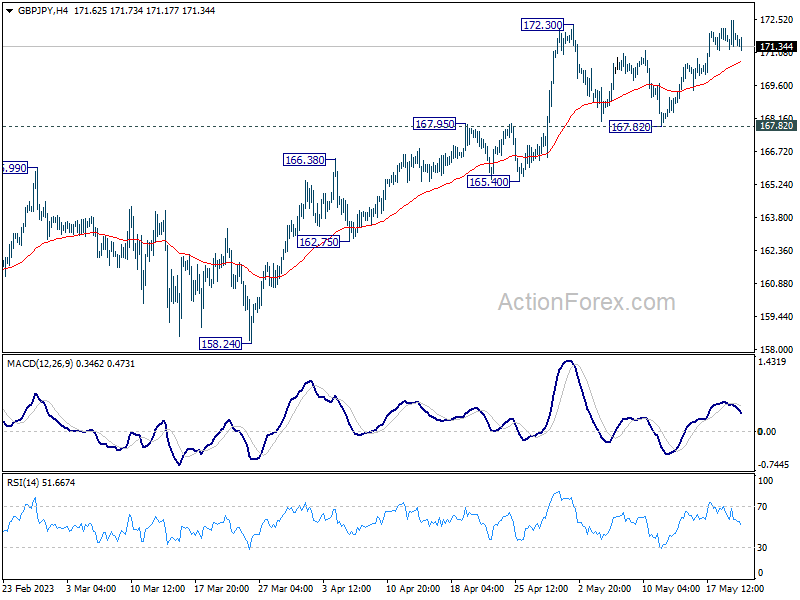
Daily Pivots: (S1) 171.13; (P) 171.82; (R1) 172.39; More...
Further rise is in favor in GBP/JPY for the momentum. Current rally is part of the larger up trend and should target 100% projection of 148.93 to 172.11 from 155.33 at 178.51. Nevertheless, firm break of 167.82 support should confirm short term topping, and turn bias back to the downside for deeper pull back to 165.40 support and possible below instead.
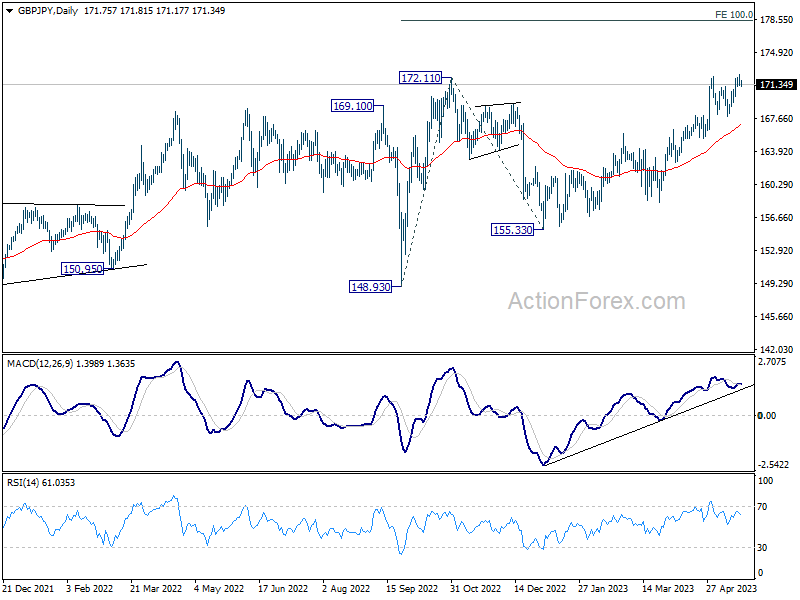
In the bigger picture, focus stays on 172.11 resistance (2022 high). Decisive break there will resume whole up trend from 123.94 (2020 low). Next target will be 161.8% projection of 122.75 (2016 low) to 156.59 (2018 high) from 123.94 at 178.69. Nevertheless, firm break of 165.40 support will indicate rejection by 172.11 and extend the corrective pattern from there with another falling leg.
EUR/JPY Daily Outlook
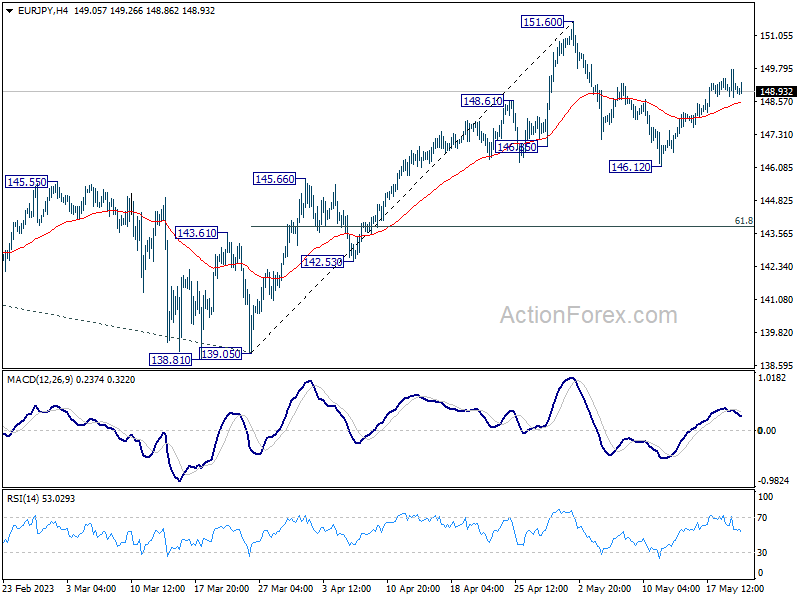
Daily Pivots: (S1) 148.61; (P) 149.20; (R1) 149.69; More....
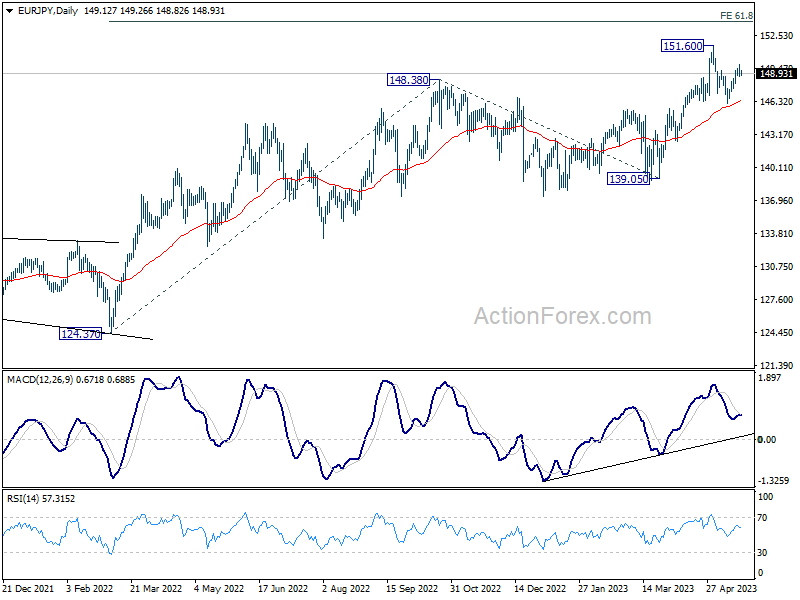
Further rise is mildly on the upside in EUR/JPY for retesting 151.60 high. Decisive break there will resume larger up trend. On the downside, however, break of 146.12 will resume the fall to 61.8% retracement of 139.05 to 151.60 at 143.84.
In the bigger picture, rise from 114.42 (2020 low) is in progress. Next target is 61.8% projection of 124.37 to 148.38 from 138.81 at 153.64. Sustained break there will pave the way to 100% projection at 162.82. For now, medium term outlook will remain bullish as long as 139.05 support holds, even in case of deep pull back.
EUR/GBP Daily Outlook
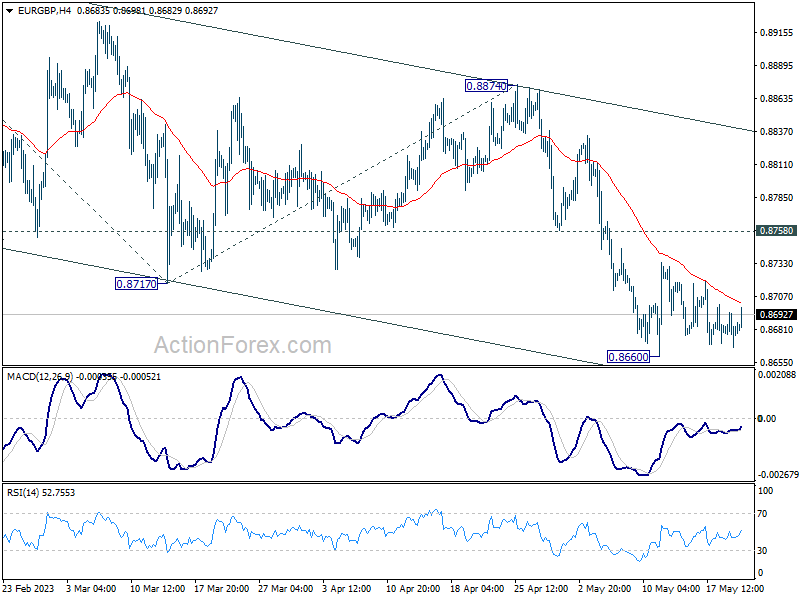
Daily Pivots: (S1) 0.8669; (P) 0.8682; (R1) 0.8696; More...
Intraday bias in EUR/GBP remains neutral for the moment. Further decline is expected as long as 0.8758 resistance holds. On the downside, break of 0.8660 will resume recent decline from 0.8977 to 100% projection of 0.8977 to 0.8717 from 0.8874 at 0.8614. Nevertheless, break of 0.8758 minor resistance will turn bias back to the upside for stronger rebound.
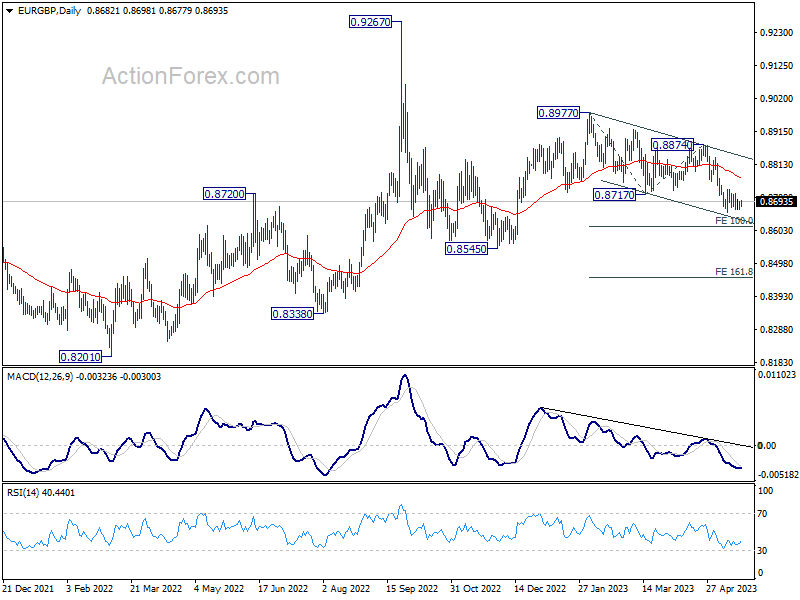
In the bigger picture, current development argues that whole decline from 0.9267 (2022 high) is still in progress. This is part of the long term range pattern from 0.9499 (2020 high). Deeper fall would be seen through 0.8545 support. This will now remain the favored case as long as 0.8874 resistance holds.
EUR/AUD Daily Outlook
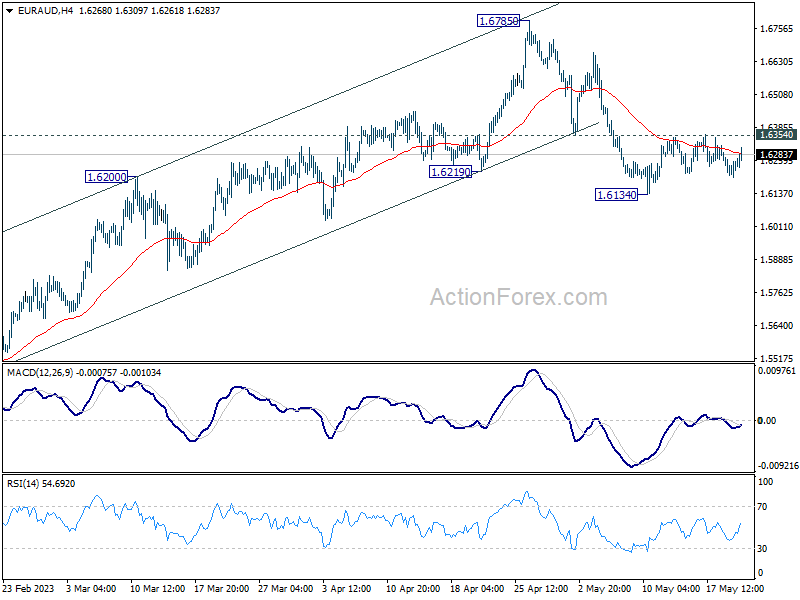
Daily Pivots: (S1) 1.6206; (P) 1.6242; (R1) 1.6285; More...
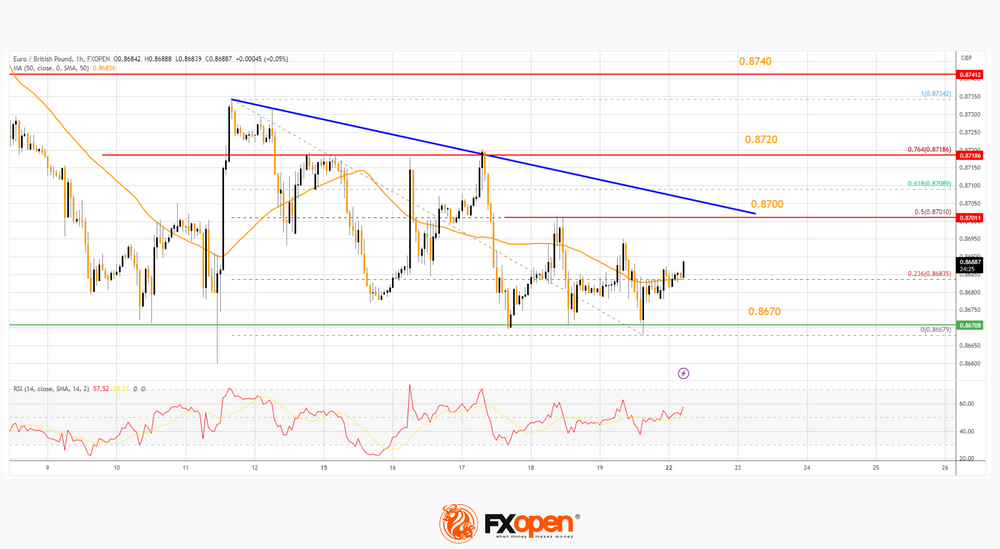
Intraday bias in EUR/AUD remains neutral at this point. Fall from 1.6785 might be a correction to whole up trend from 1.4281. Break of 1.6134 will target 38.2 retracement of 1.4281 to 1.6785 at 1.5828, which is inside 1.5254/5976 support zone. Nevertheless, sustained break of 1.6354 minor resistance will turn bias back to the upside for retesting 1.6785 high instead.
In the bigger picture, whole down trend from 1.9799 (2020 high) should have completed at 1.4281 (2022 low). Further rise should be seen to 61.8% retracement of 1.9799 to 1.4281 at 1.7691 next. For now, outlook will stay bullish as long as 1.5976 resistance turned support holds, even in case of deep pull back.