Sample Category Title
Oil Market Outlook
Oil prices rebounded slightly on Friday but are still expected to show losses for the week due to concerns about slowing growth in the US and China. US crude futures rose 2.7% to $70.41 per barrel, while the Brent contract increased by 2.5% to $74.33 per barrel. However, the Brent contract is more than 6% lower for the week, and the Nymex contract has fallen by over 8%. The market remains negative, suggesting there could be more downside in the near term, though support near $70 per barrel is expected. Despite the downturn, the crude market is still expected to be in deficit over the second half of 2023, which should drive prices up. Let's now go over to the charts to decipher whatever the price action has in store.
USDCAD - Daily Timeframe
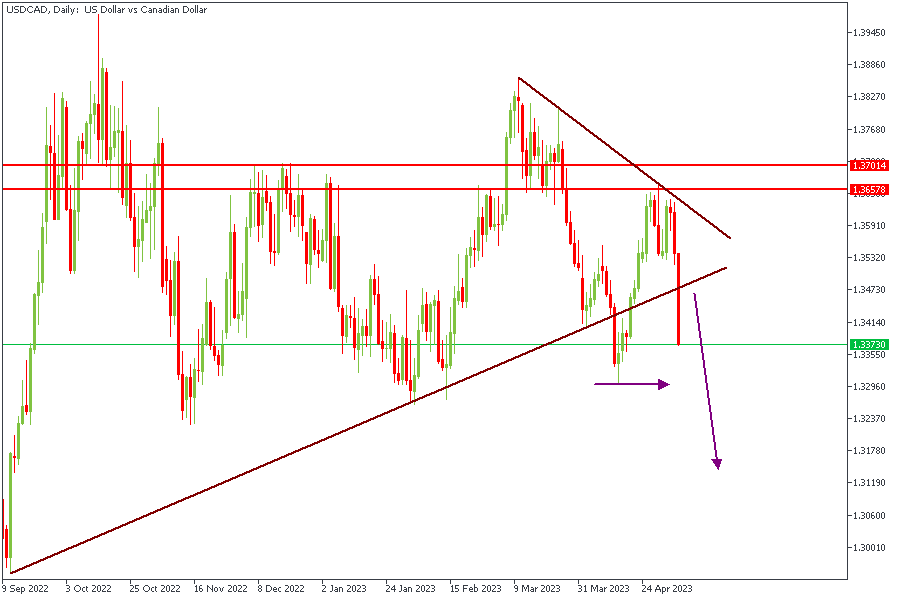
USDCAD on the daily timeframe has just recently broken below the resistance trendline of a wedge pattern. The most recent low has been marked with a horizontal arrow, and I expect the price to create a new low that would be lower than that area. What this means is that the Canadian may get stronger, leading to higher Oil prices.
Analysts’ Expectations:
- Direction: Bearish
- Target: 1.32795
- Invalidation: 1.34540
XTIUSD - Daily Timeframe
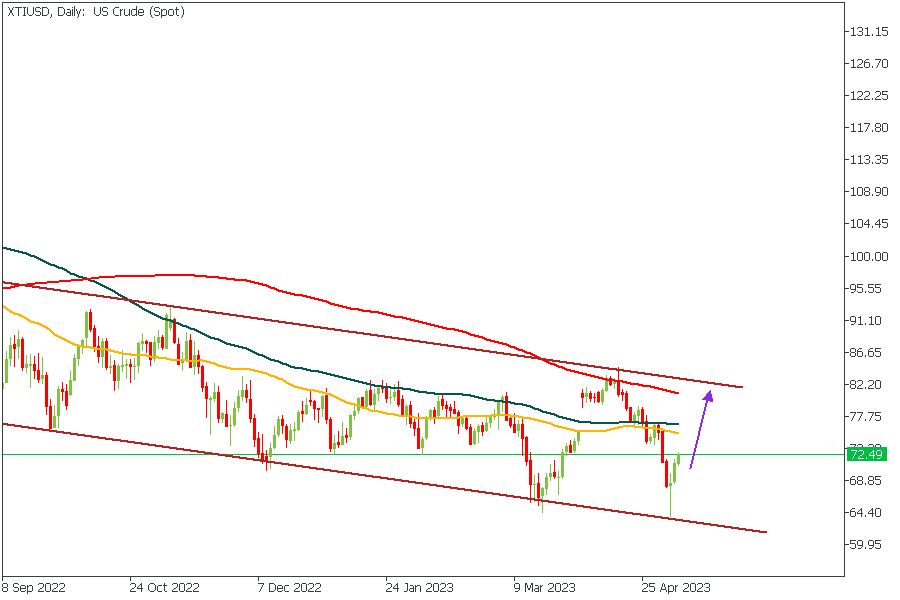
US Crude, as seen in the chart above, is trading within a descending channel, with a recent rejection of the trendline support of the same channel. Price will apparently head for the 200-period moving average, but I'll also cautiously watch for reactions from the 100 MA.
Analysts’ Expectations:
- Direction: Bullish
- Target: $77.04
- Invalidation: $69.58
XBRUSD - Daily Timeframe
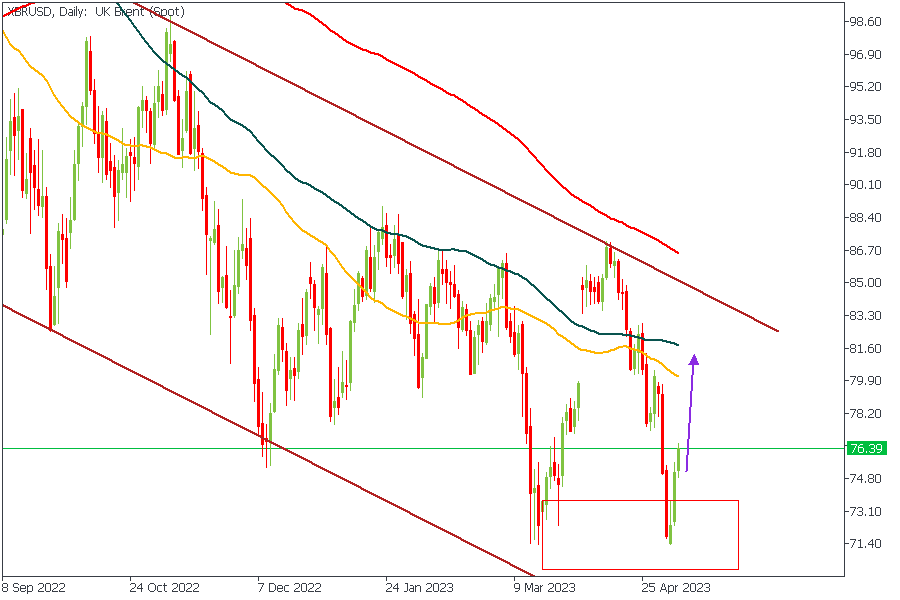
Brent (XBRUSD) has recently bounced off the drop-base-rally demand zone within the descending channel it has been riding in for almost a year. The price action suggests that the price is in search of a strong resistance that may be capable of pushing prices lower; in the meantime, however, I think we're bullish until that resistance level is found - possibly at the 100-day moving average.
Analysts’ Expectations:
- Direction: Bearish
- Target: $80.86
- Invalidation: $74.71
CONCLUSION
The trading of CFDs comes at a risk. Thus, to succeed, you have to manage risks properly. To avoid costly mistakes while you look to trade these opportunities, be sure to do your due diligence and manage your risk appropriately.
JP225 Index Retests 16-month High
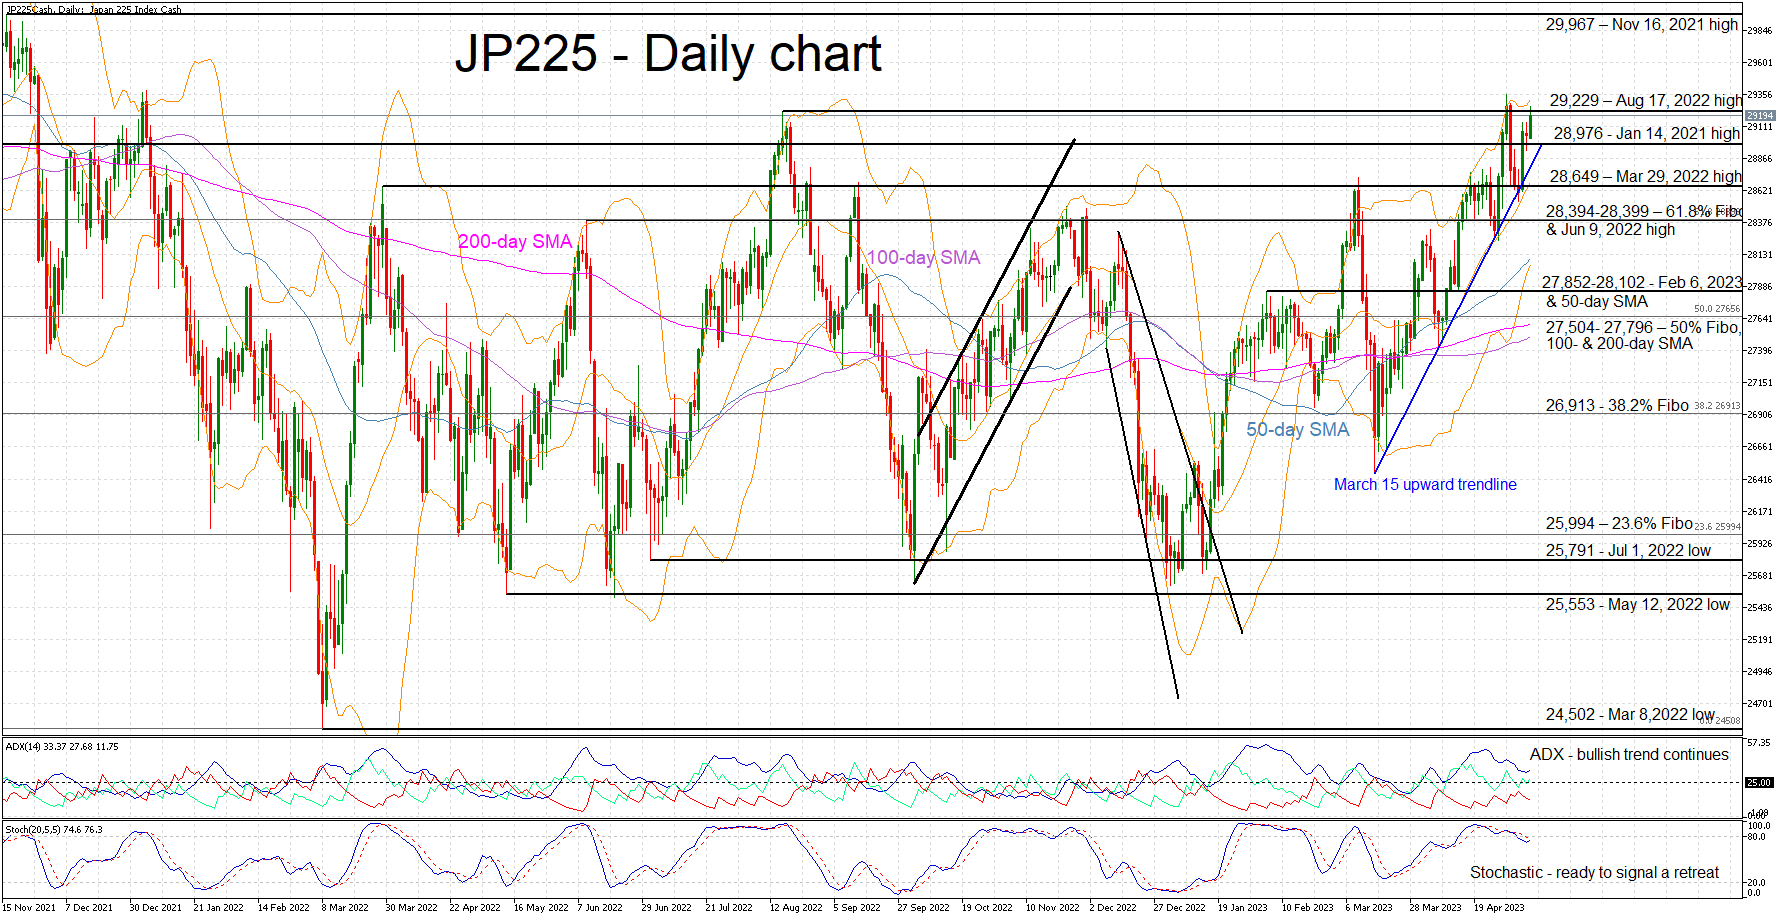
The JP225 cash index is edging higher today, a tad below the May 1, 2023 print of 29,352, which is the highest traded level for 16 months. Despite the aggressive rally since the March 15 low, the bulls seem to be still hungry for higher highs even though the momentum indicators are sending mixed signals.
While the Average Directional Movement Index (ADX) appears to be stabilizing at decent levels signaling a bullish trend, the stochastic oscillator has broken below its overbought territory. It is now testing the resistance set by its moving average (MA) and the next move is key for market sentiment. A failure to break above its MA could be perceived as a strong bearish signal.
Should this be the case, a retest of the January 14, 2021 and March 29, 2022 high at 28,976 and 28,649 respectively will come first. The busy 28,394-28,399 area, defined by the 61.8% Fibonacci retracement level of the September 14, 2021 – March 8, 2022 downtrend and the June 9, 2022 high, would then come into play.
If the bulls decide to ignore the mixed technical signs, they will most likely have another go at the crucial 29,229 level. The path appears to be clear then until the 29,967 level set by the November 16, 2021 high.
To conclude, JP225 index bulls seem ready for a higher high, but the market appears to be extra fragile. A bearish move from the stochastic can quickly turn the sentiment in favour of the bears.
EUR/USD Mid-Day Outlook
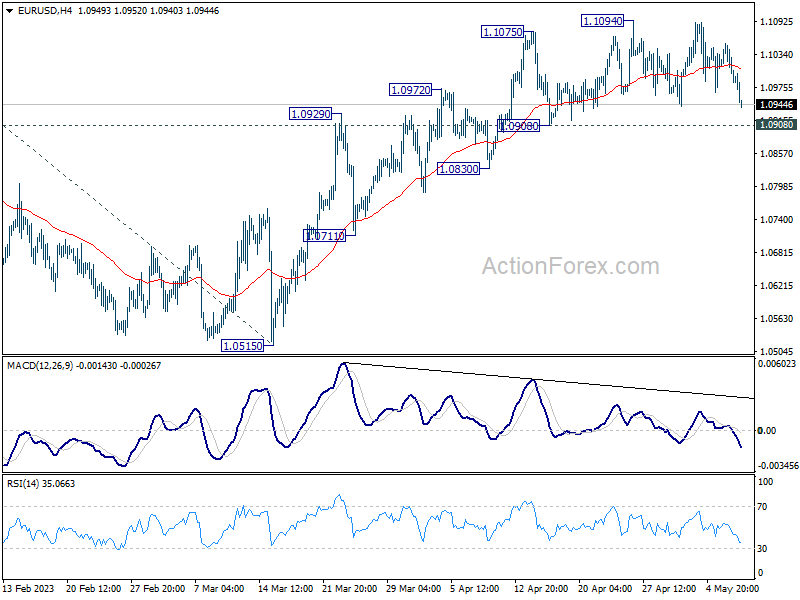
Daily Pivots: (S1) 1.0985; (P) 1.1019; (R1) 1.1039; More...
EUR/USD dips notably today but stays above 1.0908 support. Intraday bias remains neutral for the moment. Further rally could still be seen with 1.0908 support intact. On the upside, firm break of 1.1094 will resume larger up trend to 1.1273 fibonacci level. Break there will target 61.8% projection of 0.9534 to 1.1032 from 1.0515 at 1.1441 However, considering bearish divergence condition in 4H MACD, break of 1.0908 support will indicate short term topping and turn bias back to the downside.
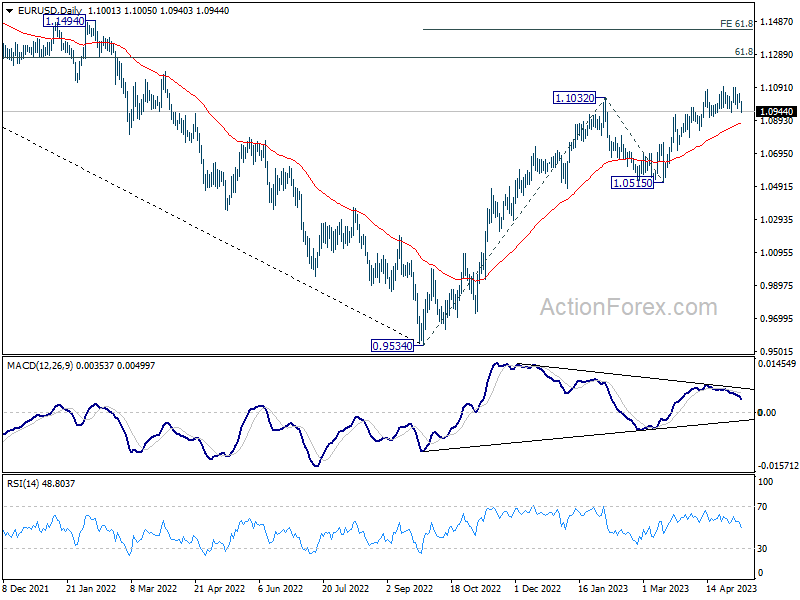
In the bigger picture, rise from 0.9534 (2022 low) is in progress for 61.8% retracement of 1.2348 (2021 high) to 0.9534 at 1.1273. Sustained break there will solidify the case of bullish trend reversal and target 1.2348 resistance next (2021 high). This will now remain the favored case as long as 1.0515 support holds, even in case of deeper pull back.
GBP/USD Mid-Day Outlook
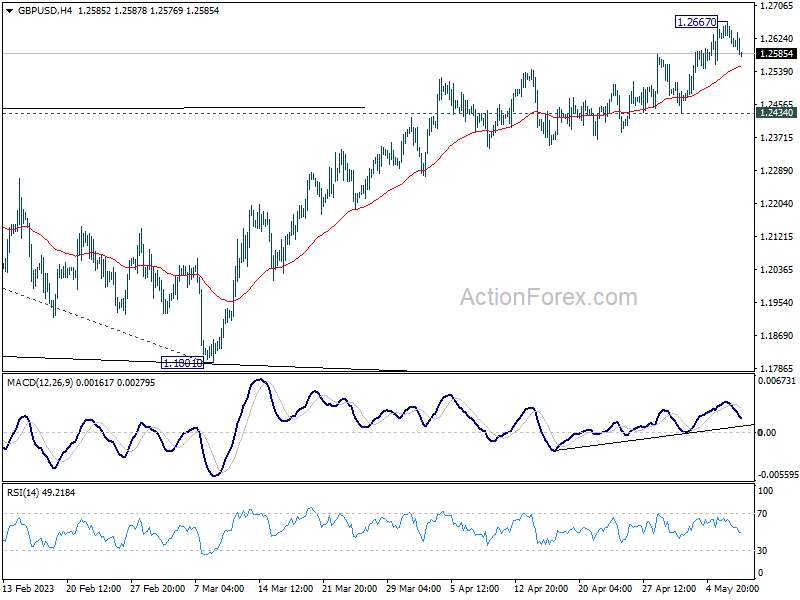
Daily Pivots: (S1) 1.2598; (P) 1.2634; (R1) 1.2654; More...
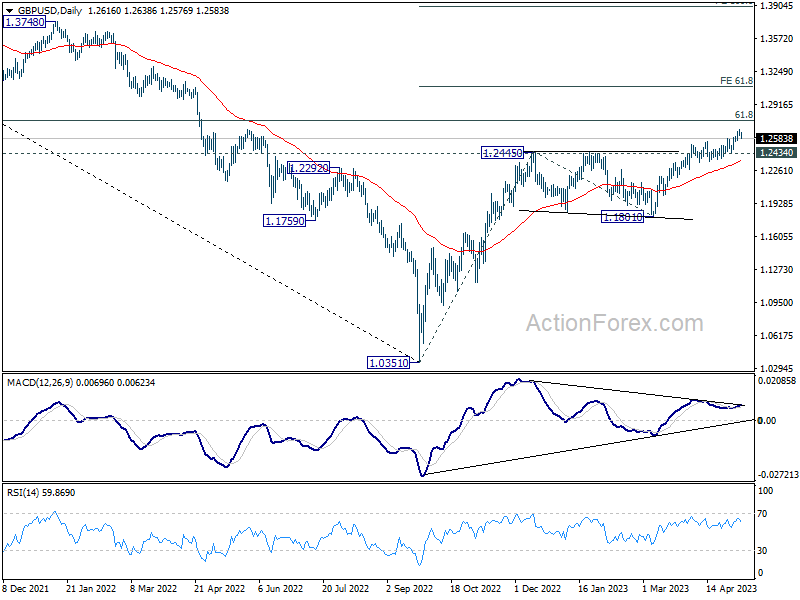
Intraday bias in GBP/USD stays neutral for consolidations below 1.2667. Near term outlook will stay bullish as long as 1.2434 support holds. Break of 1.2667 will resume larger up trend to 1.2759 fibonacci level first. Firm break there will target 61.8% projection of 1.0351 to 1.2445 from 1.1801 at 1.3095.
In the bigger picture, the rise from 1.0351 medium term term bottom (2022 low) is in progress for 61.8% retracement of 1.4248 (2021 high) to 1.0351 at 1.2759. Sustained break there will add to the case of long term bullish trend reversal. Further break of 61.8% projection of 1.0351 to 1.2445 from 1.1801 at 1.3095 could prompt upside acceleration to 100% projection at 1.3895. For now, this will remain the favored case as long as 1.1801 support holds, even in case of deep pull back.
USD/JPY Mid-Day Outlook
Daily Pivots: (S1) 134.75; (P) 135.02; (R1) 135.40; More...
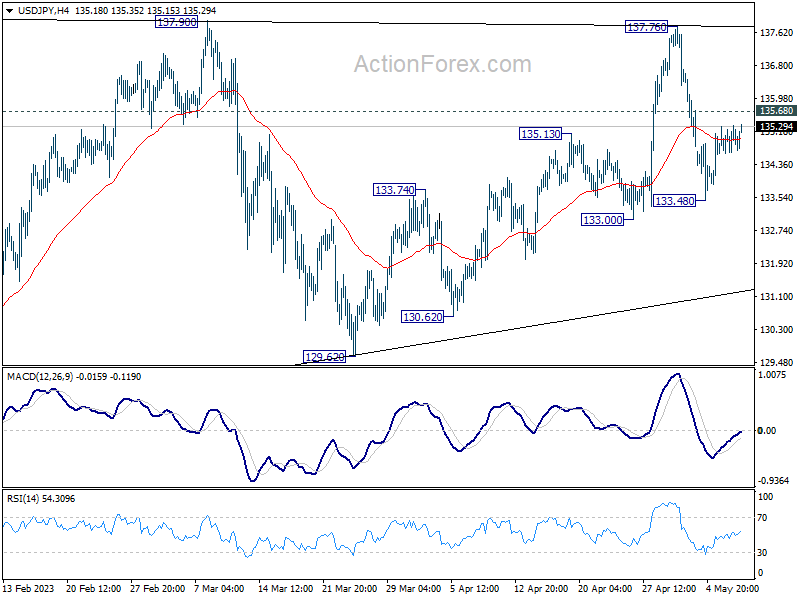
Intraday bias in USD/JPY stays neutral and outlook is unchanged. Deeper decline is mildly in favor with 135.68 minor resistance intact. Fall from 137.76 is seen as the third leg of the pattern from 137.90. Below 133.48 will target 133.00 first, break will target 129.62 support. Still, as long as 129.62 holds, larger rebound from 127.20 is still in favor to resume at a later stage. On the upside, above 135.68 minor resistance will turn bias back to the upside for 137.76/90 instead.
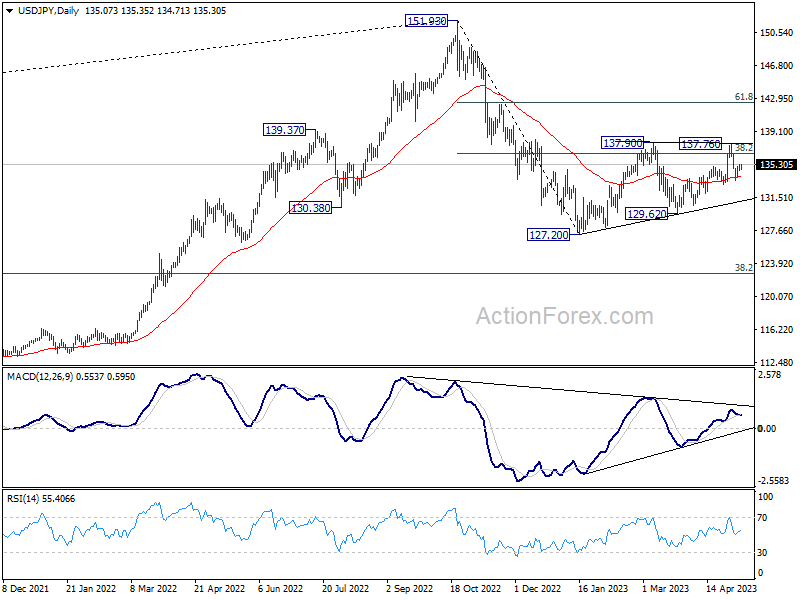
In the bigger picture, price actions from 151.93 high are currently seen as a corrective pattern to the long term up trend. The first leg should have completed at 127.20. Rebound from there is seen as the second leg. Sustained break of 38.2% retracement of 151.93 to 127.20 at 136.34 will bring stronger rebound to 61.8% retracement at 142.48. Meanwhile, break of 129.62 will argue that the third leg is starting through 127.20 low.
USD/CHF Mid-Day Outlook
Daily Pivots: (S1) 0.8871; (P) 0.8892; (R1) 0.8915; More...
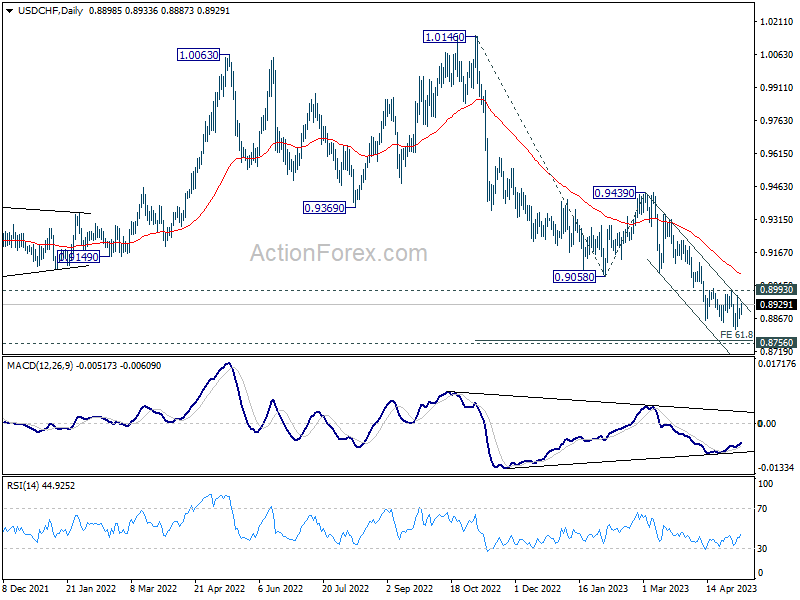
Range trading continues in USD/CHF and intraday bias remains neutral first. While down trend from 1.0146 could still extend lower, strong support should be seen from 61.8% projection of 1.0146 to 0.9058 from 0.9439 at 0.8767, which is close to 0.8756 long term support, to bring rebound, at least on first attempt. On the upside, break of 0.8993 resistance will indicate short term bottoming, on bullish convergence condition in 4H MACD, and turn bias back to the upside for stronger rebound.
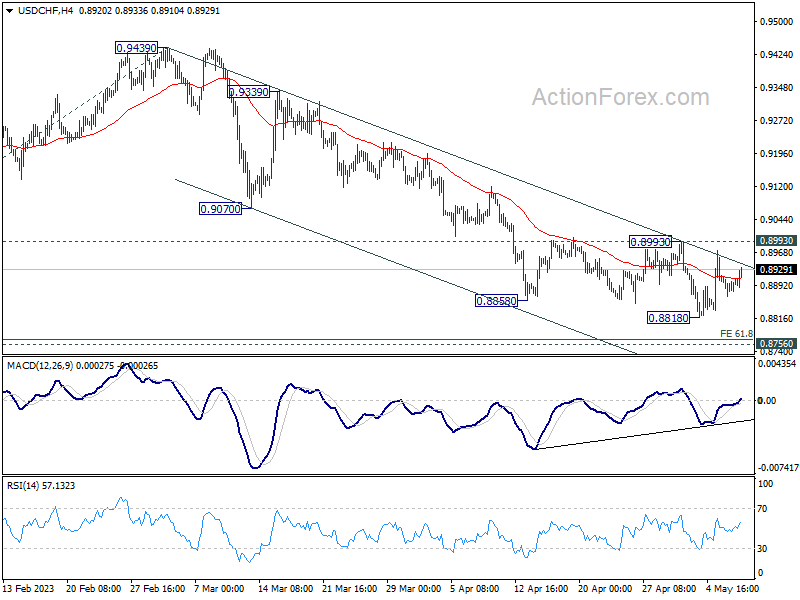
In the bigger picture, fall from 1.1046 (2022 high) is seen as a leg in the long term range pattern from 1.0342 (2016 high). So, downside should be contained by 0.8756 to bring reversal. Sustained break of 0.9058 support turned resistance will be the first sign of medium term bottoming. However, decisive break of 0.8756 will carry larger bearish implications.
Dollar and Yen Strike Back as Biden-McCarthy Meeting Eyed
Dollar and Yen are striking back on mild risk-off sentiment while Commodity currencies are paring some gains too. Eyes will be on the meeting between US President Joe Biden and Republican House Speaker Kevin McCarthy on debt ceiling. A final agreement on raising the debt limit is not expected today, but any rhetorics will be closely scrutinized, especially by American stocks and bonds investors.
Euro continues to be under broad based pressure today, shrugging off hawkish comments from ECB policymakers. Though, for now, Swiss Franc is slightly worse. Sterling is regaining some ground, with weak momentum, with traders largely holding their bets ahead of BoE rate decision and economic projections later this week.
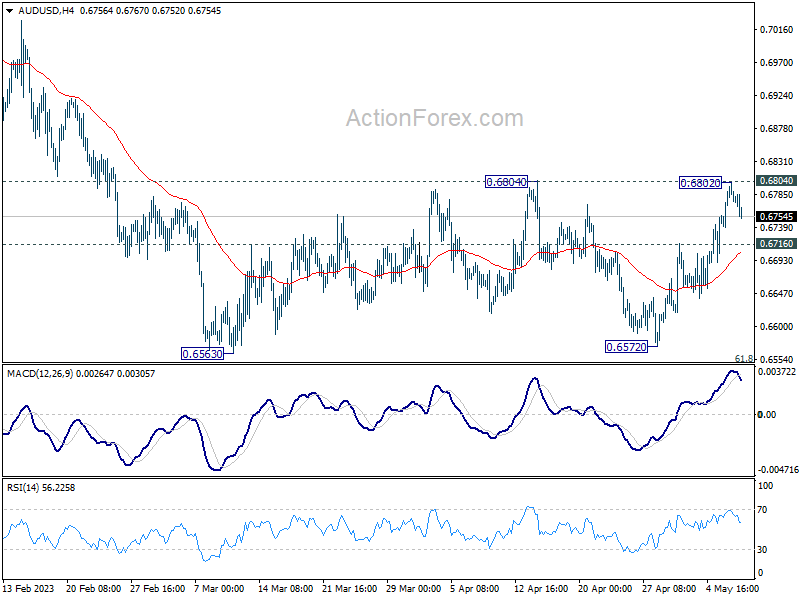
Technically, AUD/USD retreats just ahead of 0.6804 resistance. Break of 0.6716 support will turn near term bias back to the downside back towards 0.6563 low. Meanwhile, USD/CAD also recovers ahead of 1.3299 support. Reversal in risk sentiment could list USD/CAD back towards 1.3668 resistance.
In Europe, at the time of writing, FTSE is down -0.44%. DAX is down -0.38%. CAC is down -0.97%. Germany 10-year yield is down -0.0074 at 2.322. Earlier in Asia, Nikkei rose 1.01%. Hong Kong HSI dropped -2.12%. China Shanghai SSE dropped -1.10%. Singapore Strait Times dropped -0.45%. Japan 10-year JGB yield rose 0.0121 to 0.425.
ECB Kazaks asserts need for further rate hikes
In face of high inflation, ECB Governing Council member Martins Kazaks has voiced his belief that further interest rate hikes will be necessary to contain it. His remarks counter market expectations for borrowing costs to be cut as early as next spring, a notion Kazaks has described as "significantly premature."
He outlined a dual strategy to bring the current inflation rate of 7% back to ECB's target of 2%. "The first is raising the rates and of course we don't know where the terminal rate is," he commented. "Another thing is keeping those rates at elevated and sufficiently restrictive levels."
Despite concerns about potential economic risks from higher interest rates, Kazaks emphasized that the risk of doing too little to counter inflation was far greater than the risk of over-tightening. "Persistently high inflation is a bigger problem for society than a relatively short and shallow recession," he warned.
Underlining the importance of effective policy response, Kazaks cautioned, "Failing to contain inflation would be a failure because then the policy response in the second go would then need to be much tighter."
ECB Kazimir: We will have to keep raising interest rates for longer than anticipated
ECB might need to keep raising interest rates for longer than initially anticipated, according to Governing Council member Peter Kazimir. His comments indicate an evolving stance within ECB as it grapples with stubbornly high inflation in the Eurozone.
"Based on today's data, we will have to keep raising interest rates for longer than anticipated," Kazimir stated. He suggested a slower pace of rate hikes, at 25 basis points increments, as a measured approach that allows for longer-term adjustments, should incoming data warrant it. "So, slowing down the pace to 25 bps is a step that will allow us to go gradually higher for longer, should that be necessary and warranted by incoming data," he explained.
Kazimir pointed to core inflation trends, rising wage pressures, and high-profit margins as factors necessitating vigilance and the continued pursuit of ECB's current monetary policy trajectory. "The development of core inflation, the continued buildup of wage pressures, and high-profit margins call for vigilance and reconfirm the need to continue on our path," he said.
However, the true effectiveness of ECB's measures and the trajectory of inflation towards the target will not be fully assessed until the September forecast. "Our September forecast will be the earliest date to answer how effective our measures are and whether inflation is moving towards the target," Kazimir added.
BoJ Ueda sees position signs in trend inflation
BoJ Governor Kazuo Ueda pointed to encouraging signs in trend inflation during a recent parliamentary session. "We're seeing some positive signs in trend inflation, including inflation expectations," Ueda said. He added that once the BOJ could foresee inflation stably and sustainably meeting their 2% target, they would "abandon yield curve control and then move towards shrinking the bank's balance sheet."
Ueda also spoke about the upcoming monetary policy review, stating it would critically examine the benefits and side effects of past monetary policies. The review process will include workshops with private academics. However, the governor clarified that the central bank did not have any preconceived notions about how the review could influence future monetary policy decisions.
"We will take necessary policy steps at each of our rate reviews, with an eye on financial and price developments, even while we conduct the review," Ueda stated.
Australia sees second consecutive quarter of falling retail sales volume amidst rising living costs
Australia's retail sales volume declined by -0.6% qoq to AUD 96.17 billion in Q1 2023. Through the year, sales volume only managed to register a modest 0.3% yoy growth in the quarter.
ABS's head of retail statistics, Ben Dorber, noted that this marked the second consecutive quarter of falling retail sales volumes, primarily influenced by mounting cost of living pressures that continue to burden household spending.
"Outside of the COVID-19 pandemic period, this is the largest fall in retail sales volumes since the September quarter of 2009," Dorber stated, underlining the gravity of the situation.
Meanwhile, retail prices growth has slowed to 0.6% qoq in Q1. "Retail prices rose for the sixth straight quarter, but price growth this quarter is the smallest since September 2021," Dorber added.
He attributed the slowdown in price growth mainly to discounts on clothing and larger household items such as furniture and electronic goods. However, he noted that food retailing prices continued their upward trajectory.
China exports rose 8.5% yoy in Apr, exports to Russia surged 153% yoy
China's April exports outperformed expectations, growing by 8.5% yoy to reach USD 295.4B. This marked the second consecutive month of growth, exceeding anticipated 8.0% yoy. However, imports dropped by -7.9% yoy to USD 205.2B, falling short of expected 0.0% yoy. As a result, trade surplus widened from USD 88.2B to USD 90.2B, significantly surpassing the forecasted USD 69.0B.
Breaking down the numbers, exports to EU experienced a modest growth of 3.7% yoy, while imports from the bloc saw a slight decrease of -0.12% yoy. Trade with the US reflected a downturn, with exports dropping by -6.5% yoy and imports declining by -3.1% yoy.
Trade relations with ASEAN region were mixed, with exports increasing by 4.49% yoy, while imports fell by -6.25% yoy. Meanwhile, trade with Russia exhibited a significant surge. Chinese exports to Russia skyrocketed by a staggering 153.09% yoy, and imports also rose, though at a more modest rate of 8.06% yoy.
USD/CHF Mid-Day Outlook
Daily Pivots: (S1) 0.8871; (P) 0.8892; (R1) 0.8915; More...
Range trading continues in USD/CHF and intraday bias remains neutral first. While down trend from 1.0146 could still extend lower, strong support should be seen from 61.8% projection of 1.0146 to 0.9058 from 0.9439 at 0.8767, which is close to 0.8756 long term support, to bring rebound, at least on first attempt. On the upside, break of 0.8993 resistance will indicate short term bottoming, on bullish convergence condition in 4H MACD, and turn bias back to the upside for stronger rebound.
In the bigger picture, fall from 1.1046 (2022 high) is seen as a leg in the long term range pattern from 1.0342 (2016 high). So, downside should be contained by 0.8756 to bring reversal. Sustained break of 0.9058 support turned resistance will be the first sign of medium term bottoming. However, decisive break of 0.8756 will carry larger bearish implications.
Economic Indicators Update
| GMT | Ccy | Events | Actual | Forecast | Previous | Revised |
|---|---|---|---|---|---|---|
| 23:30 | JPY | Labor Cash Earnings Y/Y Mar | 0.80% | 1.00% | 1.10% | |
| 23:30 | JPY | Overall Household Spending Y/Y Mar | -1.90% | 0.40% | 1.60% | |
| 03:00 | CNY | Trade Balance (USD) Apr | 90.2B | 69.0B | 88.2B | |
| 06:45 | EUR | France Trade Balance (EUR) Mar | -8.0B | -9.5B | -9.9B | -9.3B |
| 10:00 | USD | NFIB Business Optimism Index Apr | 89.0 | 89.6 | 90.1 |
BTCUSD Analysis: Three Black Crows Pattern below $29,829
Bitcoin was unable to continue its bullish momentum from last week, and after touching a high of $29,829 on May 06, we can see a continuous decline in the bitcoin price, with immediate targets located in the range of $26500 and $27000.
We can clearly see a bearish three black crows pattern below the $29,829 handle on the H1 timeframe.
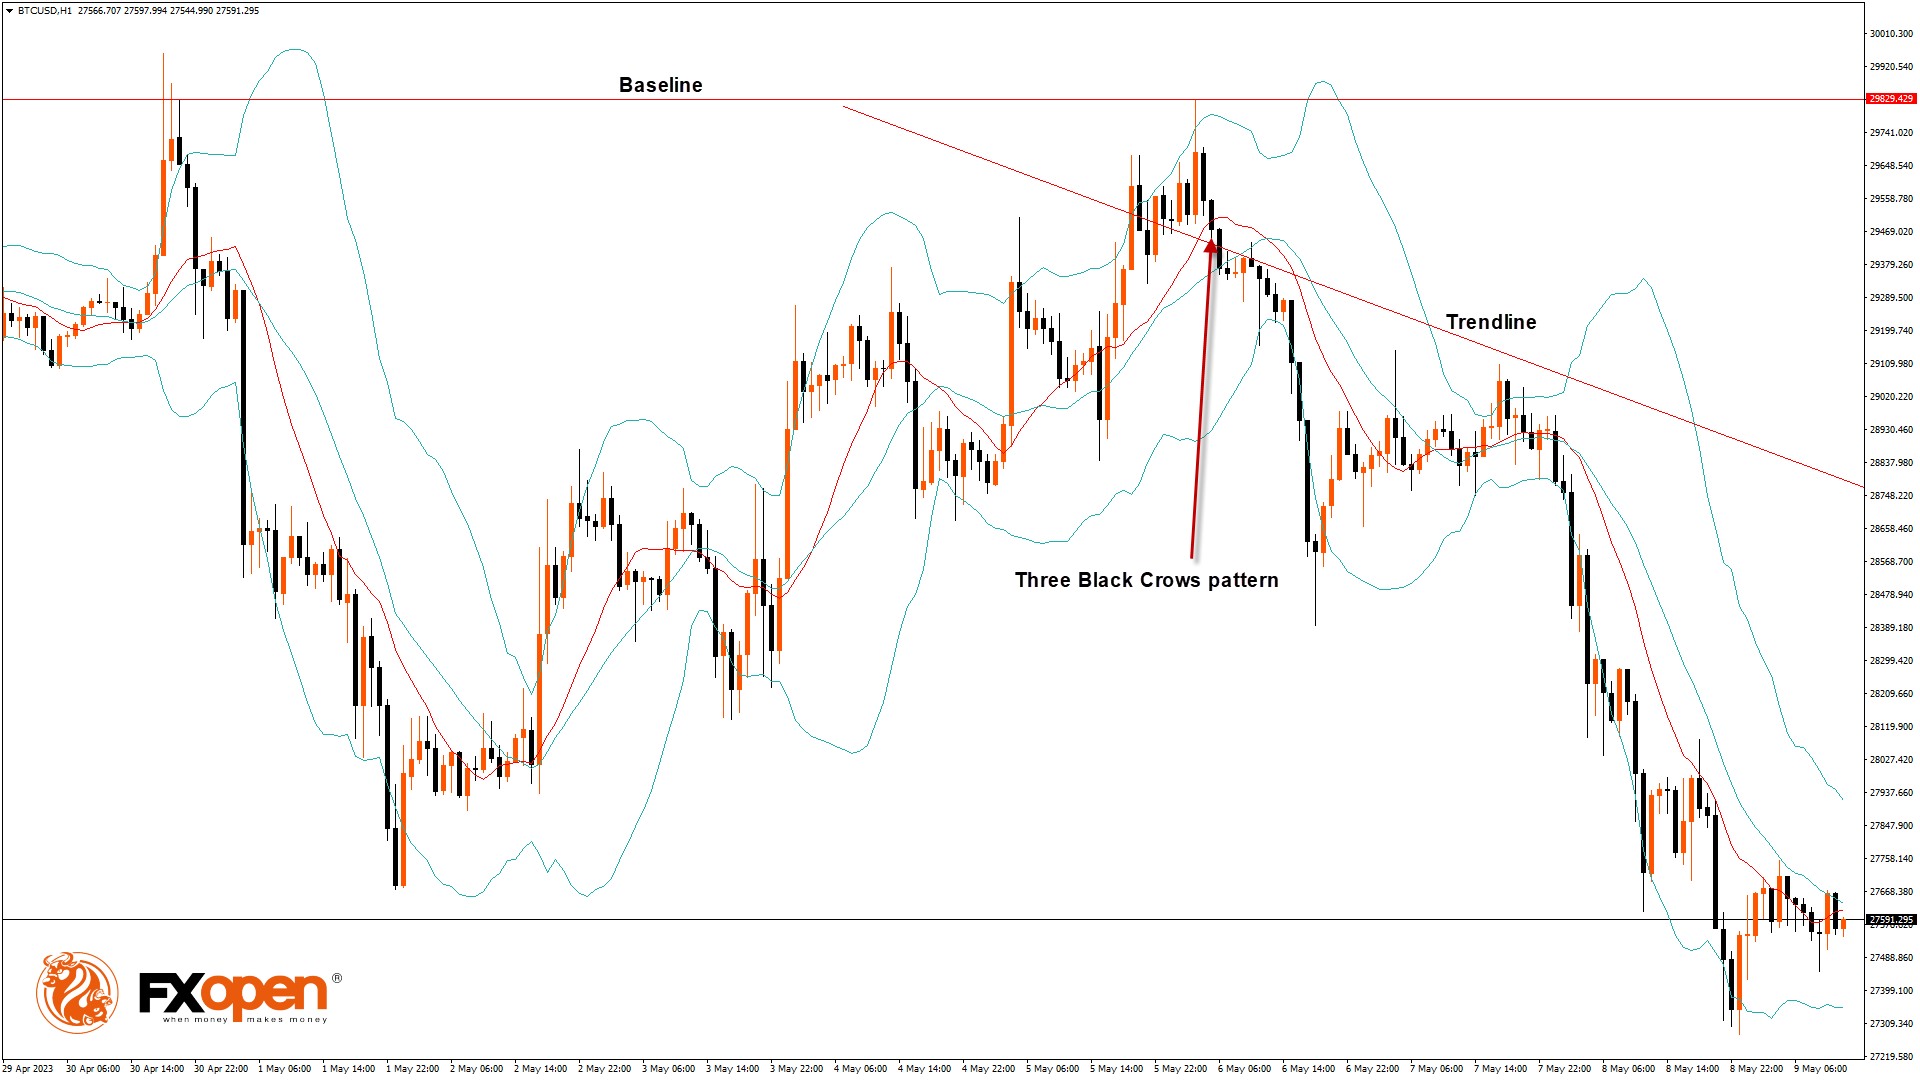
The price of Bitcoin continues to move in a bearish momentum, which is expected to continue towards the $27,000 handle.
Both the STOCH and Williams’s percent range indicate overbought levels, which means that in the immediate short term, a decline in the price is expected.
The Bitcoin chart is ranging near a new record low for 1 month.
The relative strength index is at 39.90, indicating a very weak demand for Bitcoin and the continuation of the selling pressure in the markets.
Bitcoin is now moving below its 100-hour exponential moving average and below its 200-hour exponential moving average.
Most of the major technical indicators are giving a bearish signal, which means that in the immediate short term, we are expecting targets of $26,500 and $27,000.
The average true range indicates less market volatility with mild bearish momentum.
- Bitcoin bearish reversal is seen below $29,829.
- The RSI remains below 50, indicating a bearish market.
- The price is now trading below its pivot level of $27,622.
- The short-term range is mildly bearish.
- The momentum indicator is back under zero.
Bitcoin Bearish Reversal Seen below $29,829
The price of Bitcoin entered into a consolidation zone above the $27,000 handle after which we can see the continuation of the bearish moves.
There is a bullish trend reversal pattern with adaptive moving average AMA-20 and AMA-50 in the daily timeframe.
We can see the formation of bearish engulfing lines in the 4-hourly timeframe.
We have also seen a bearish harami cross pattern located in the 15-minutes timeframe.
A support zone is located at $26,092, which is a 61.8% retracement from the 52 week low, and at $26,670, which is a 3-10 day MACD oscillator stalls .
BTCUSD is now facing its classic support level of $27,454 and Fibonacci resistance level of $27,583 breaking which the price will be able to move to $27,000.
There is an increase of 3.08% in the daily trading volume, which is normal. The short-term outlook for Bitcoin is bearish, the medium-term outlook has turned bearish, and the long-term outlook remains neutral under present market conditions.
The Week Ahead
We can see that Bitcoin price remains well supported above the $27,000 handle and the continuation pattern is seen, with the current support at $25,281, which is a 50% retracement from 13 week high/low.
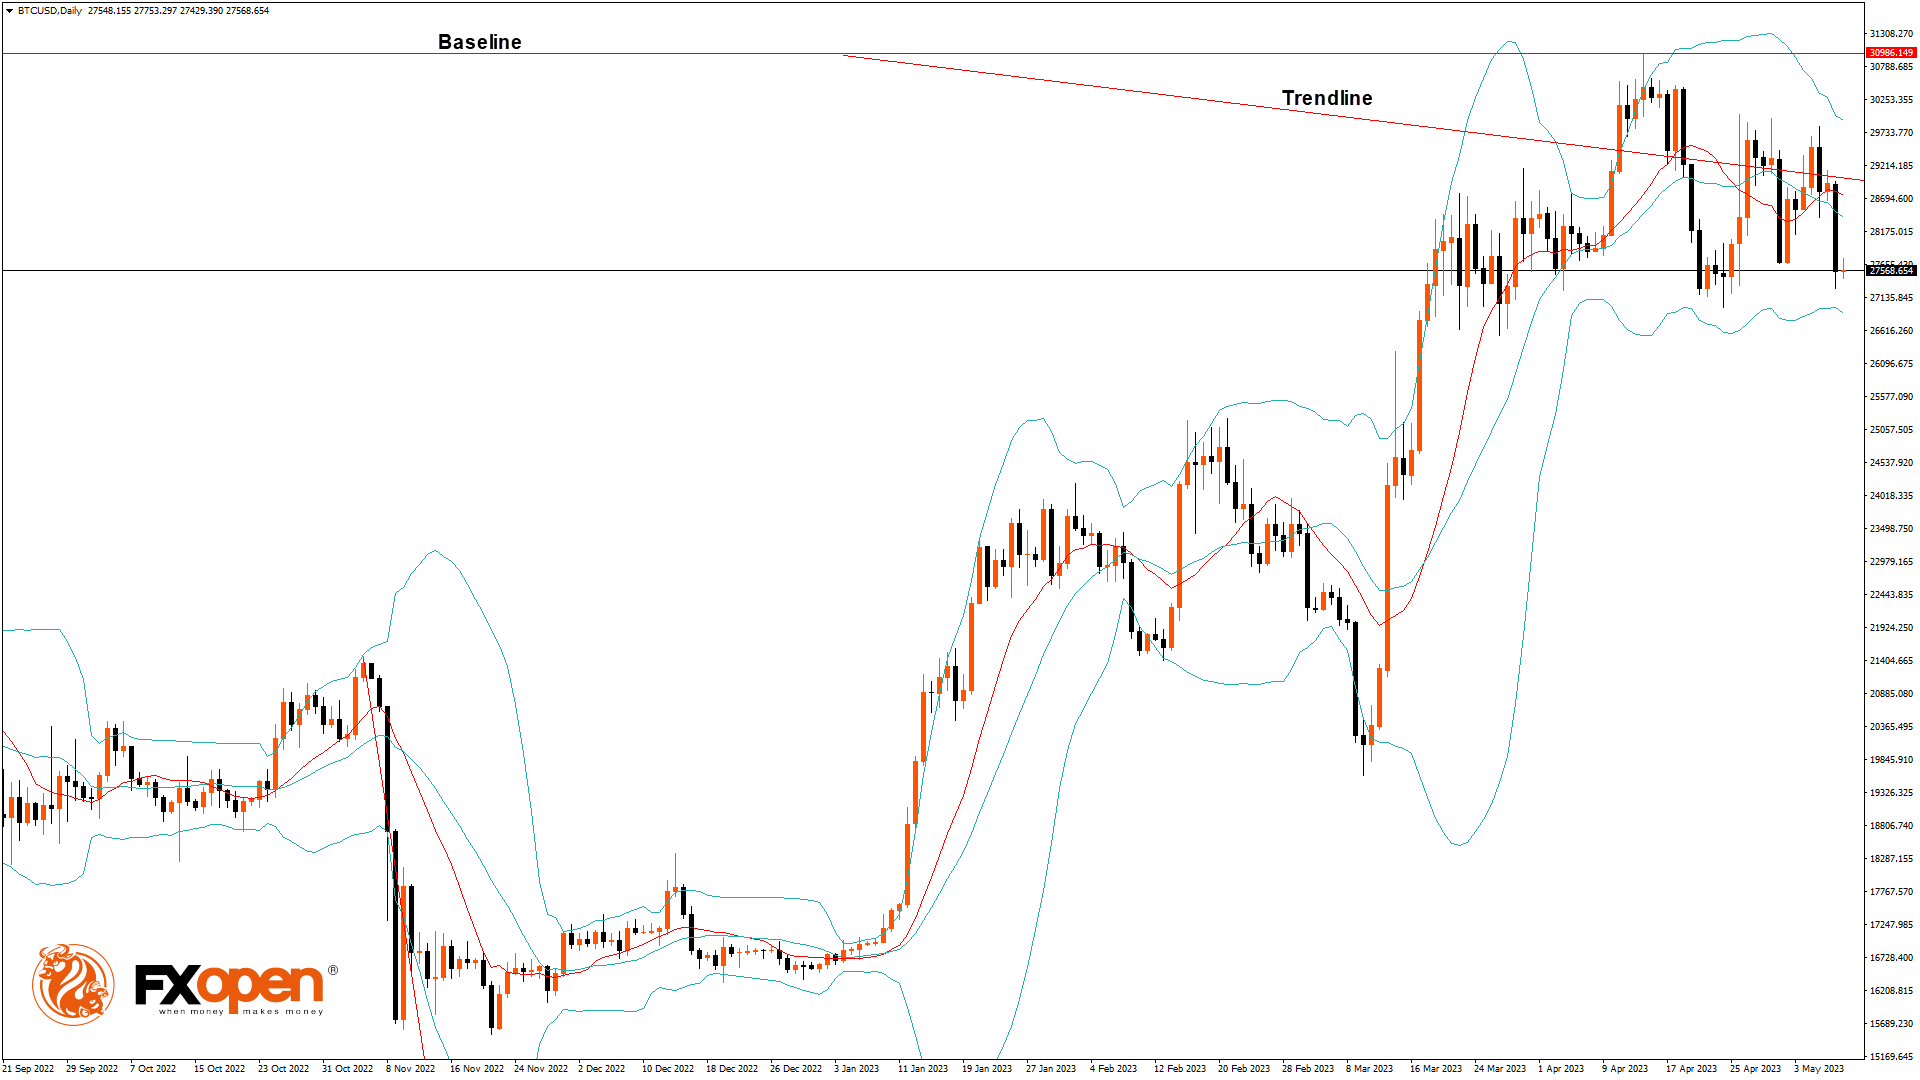
The immediate expected target is $26,500, after which we may see some consolidation in the zone of the $27,000 level.
Monthly RSI is at 49.79, which indicates the Neutral market and the shift towards the consolidation zone in the medium-term range.
We can see the formation of a bearish trend line from $29,829 to $27,356.
The BTCUSD is now facing resistance at $28,051, which is a 14-3 day raw stochastic at 30%, and at 28,266 which is a 14 day RSI at 50%.
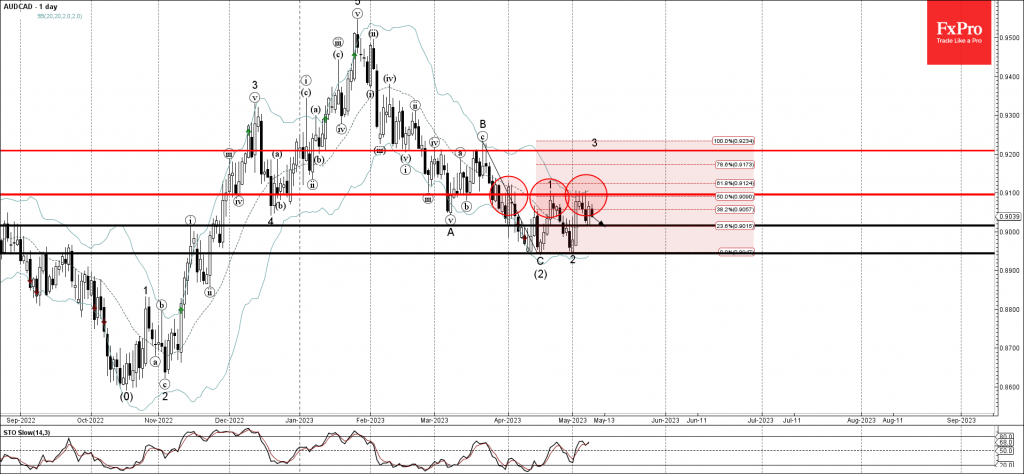
AUDCAD Wave Analysis
- AUDCAD reversed from resistance level 0.9100
- Likely to fall to support level 0.9015
AUDCAD earlier reversed down from the pivotal resistance level 0.9100 (which has been repeatedly reversing the price from the start of April).
The downward reversal from the resistance level 0.9100 is the 4th consecutive downward reversal from this price level – signalling its strength.
Given the strength of the resistance level 0.9100, AUDCAD can be expected to fall further toward the next support level 0.9015 (yesterday’s low).
USDCHF Wave Analysis
- USDCHF reversed from key support level 0.8860
- Likely to rise to resistance level 0.8965
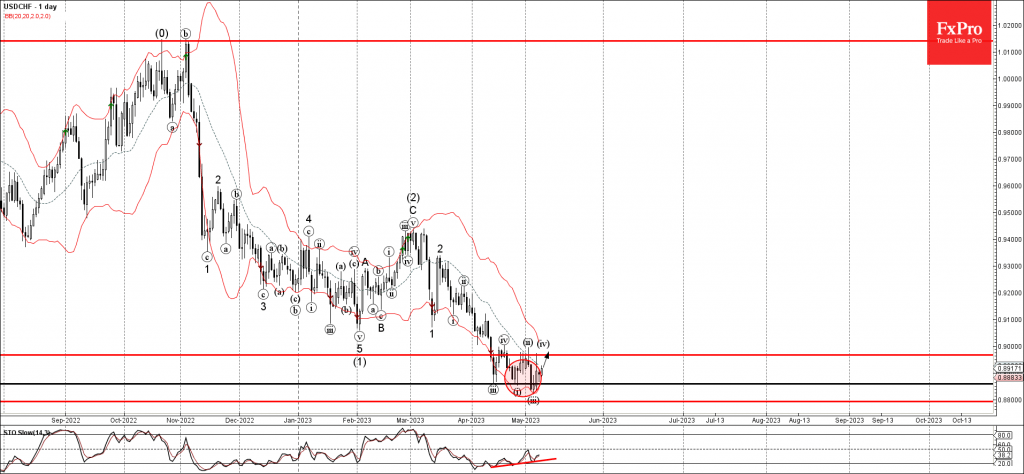
USDCHF currency pair recently reversed up from the key support level 0.8860 (which has been steadily reversing the pair from the middle of April).
The upward reversal from the support level 0.8860 follows the earlier upward reversal which created the daily Morning Star Doji.
Given the triple bullish divergence on the daily Stochastic, USDCHF can be expected to rise further toward the next resistance level 0.8965 (which stopped the earlier waves (iv) and (ii)).