Sample Category Title
EUR/USD Faces Significant Resistance, Dollar Weakens Further
Key Highlights
- EUR/USD is facing strong resistance near 1.1090.
- A key bullish trend line is forming with support at 1.0975 on the 4-hour chart.
- GBP/USD climbed further above the 1.2620 resistance.
- Gold price corrected gains and traded below $2,030.
EUR/USD Technical Analysis
The Euro made another attempt to clear 1.1090 against the US Dollar. However, EUR/USD failed to gain strength and corrected gains from the 1.1091 high.
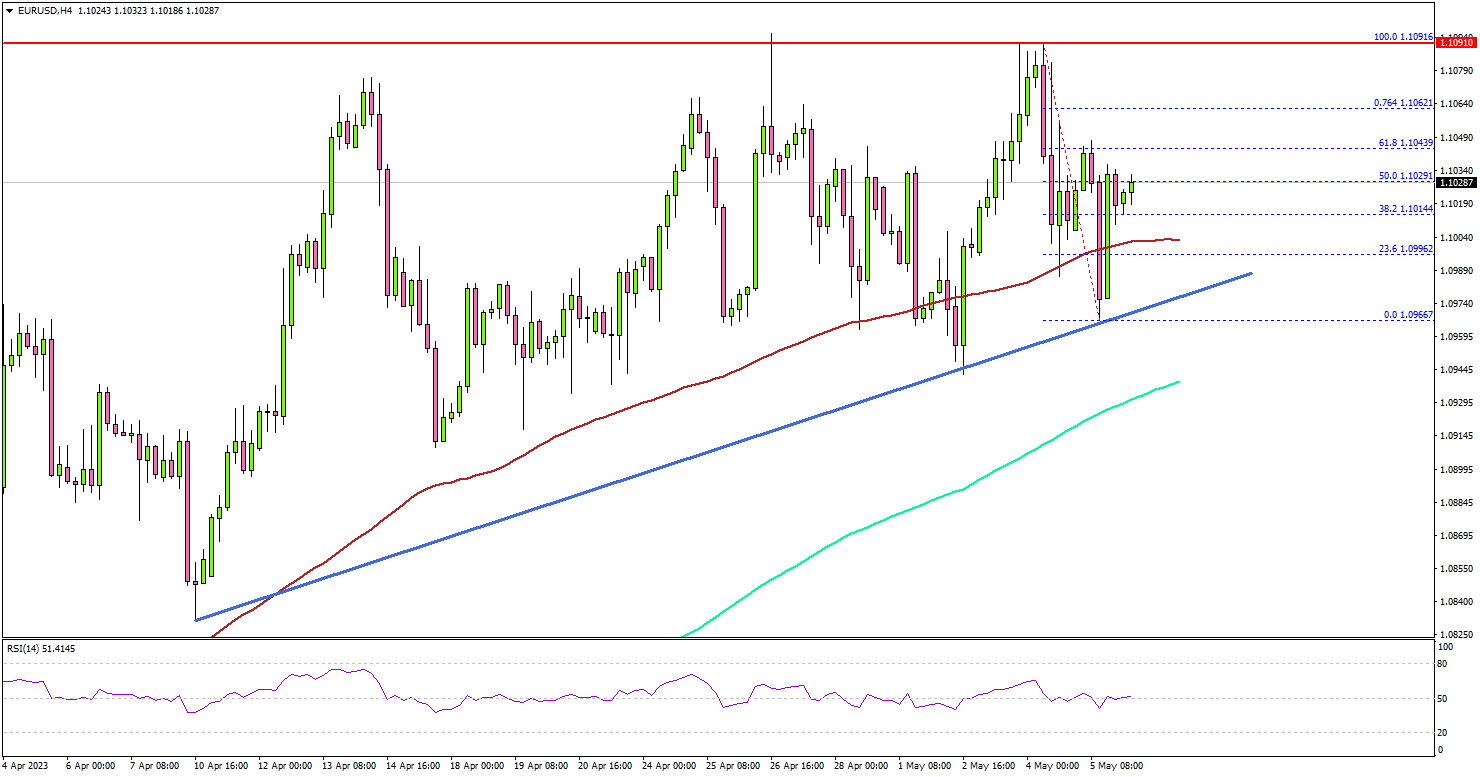
Looking at the 4-hour chart, the pair started a downside correction below the 1.1020 support. It even spiked below the 1.1000 level and the 100 simple moving average (red, 4 hours).
A low is formed near 1.0966 and the pair is now stuck in a broad range. There is also a key bullish trend line forming with support at 1.0975 on the same chart. Immediate resistance on the upside is near the 1.1050 level.
The next key resistance is near the 1.1090 level. A clear upside break and close above the 1.1090 resistance might start a steady increase. The next key resistance is near the 1.1150 zone. Any more gains might send the pair toward 1.1200.
On the downside, the bulls might remain active near 1.0980. The next major support is near the 1.0950 level or the 200 simple moving average (green, 4 hours).
If there is a downside break below the 1.0950 support, the pair could accelerate lower. In the stated case, the pair might even test 1.0880.
Looking at Gold price, it traded to a new all-time high at $2,079.84 before the bears appeared and initiated a downside correction to $2,000.
Economic Releases
- Germany’s Industrial Production for March 2023 (MoM) - Forecast -1%, versus +2 % previous.
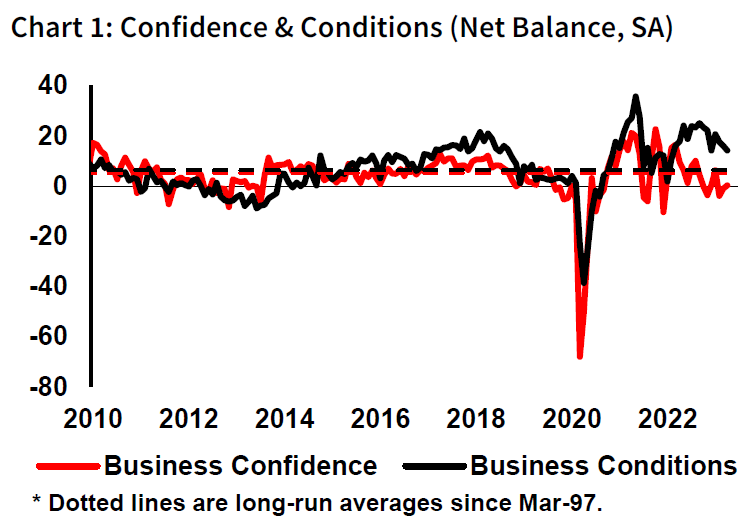
Australia NAB business confidence rose to 9, conditions down to 14
Australia NAB Business Confidence index rose from -1 to 0 in April, while Business Conditions slipped from 16 to 14. A closer look at the details reveals that trading conditions declined from 24 to 20, profitability conditions dropped from 13 to 11, and employment conditions edged up from 10 to 11.
Price and cost growth indicators were mixed, with labor cost growth holding steady at 1.9% in quarterly equivalent terms, and purchase cost growth increasing to 2.3% (up from 1.9% in March). However, overall price growth was 1.1% (down from 1.3%), and inflation in the retail sector declined to 1.4% (down from 1.7%).
NAB Chief Economist Alan Oster pointed out that business conditions, although lower, remained well above their long-run average. Confidence, although still below average, has stabilized around 0 index points in recent months. Furthermore, Oster observed some easing in price measures this month, even as cost pressures remained high. This trend may signal a gradual easing of inflation in Q2's early stages, though inflation remains elevated.
Japan’s PMI services reaches record high in April, record optimism too
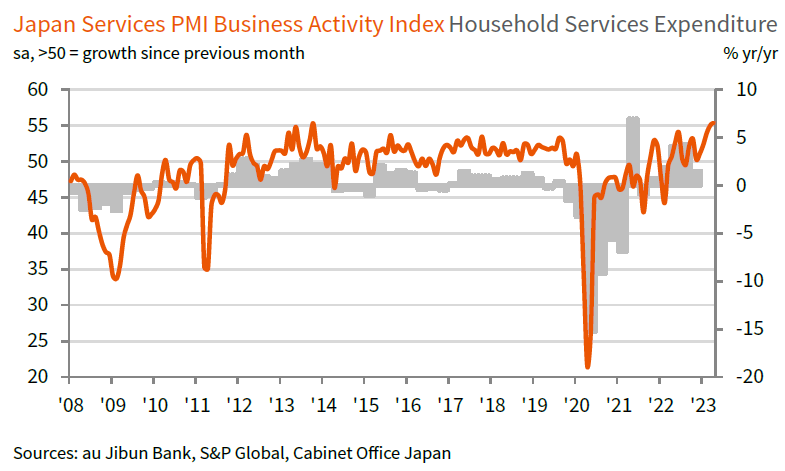
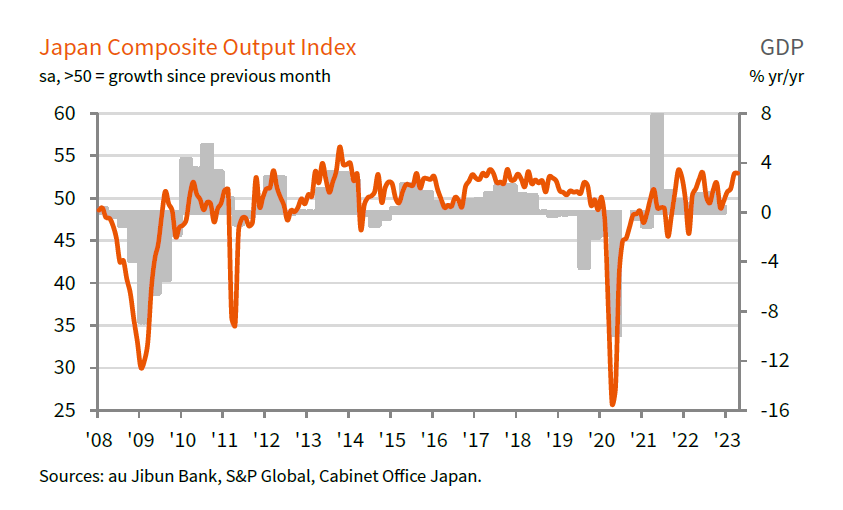
Japan PMI Services rose to 55.4 in April, up from 55.0 in March, marking the eighth consecutive month in growth territory. This represents the highest reading since records began in 2007, surpassing the previous record set in 2013. S&P Global also noted that year-ahead business expectations reached an all-time high, while prices charged increased at the steepest pace in nine years. Meanwhile, the PMI Composite remained unchanged at 52.9, as stronger services growth offset a sharper reduction in manufacturing production.
Tim Moore, Economics Director at S&P Global Market Intelligence attributed the record rise in service sector output to a rebound in demand for face-to-face consumer services, recovery in international tourist arrivals, and improvement in new business from abroad.
Moore also emphasized the high level of business confidence, with around four times as many service providers expecting an increase in activity as those forecasting a decline. This optimism marked the highest level in more than 15 years of data collection.
Furthermore, service providers increasingly passed on higher business expenses to customers to alleviate pressure on margins from rising wages and transportation costs. This resulted in the steepest increase in service sector output charges since the sales tax hike in April 2014.
BoJ minutes: Few members saw positive signs towards price target
Minutes of BoJ's meeting on March 9 and 10 show a continued commitment to monetary easing, with the aim of achieving price stability in a sustainable and stable manner, accompanied by wage increases. Neverthelesse, a few members noted emerging "positive signs" toward reaching the price stability target, indicating a changing price environment.
With respect to yield curve control, some members emphasized the need to examine the effects of various implemented measures aimed at improving market functioning. They acknowledged that JGB yield curve appeared smoother than before. One member explained that if observed CPI inflation declined and market projections of interest rates calmed down, distortions in the yield curve would likely be corrected.
In terms of the 2% price stability target, several members underscored the importance of maintaining its commitment. One member added that the central bank should anchor inflation expectations to 2% by committing to achieve the target.
Meanwhile, another member expressed concern that discussing the target might lead to "unnecessary speculation" on monetary policy conduct, especially given the growing possibility of achieving the price stability target. This member also argued against revising the joint statement of the government and BoJ.
Roller-Coaster Week for Investors Ended with Commodity Currencies on Top
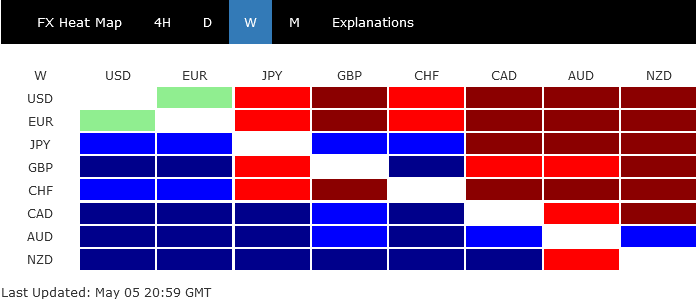
Risk-on, risk-off, and then risk-on. It's a roller-coaster ride for investors last week,with a slew of heavy-weight events. In the end, commodity currencies ended as the best performers, with support from rebound in sentiment. Canadian Dollar held a slight advantage over Australian and New Zealand Dollar. But all have them have reasons to extend last week rally, subject to overall risk sentiment, of course.
Dollar and Euro tied as the worst performers, even though both Fed and ECB extended tightening cycle. But even so, technically, Euro remains in pole position against the greenback for now, as also evidenced in the outlook in Dollar Index. Swiss Franc was somewhat dragged down by Euro too, while Yen and Sterling ended mixed.
Risk sentiment resilient, Dollar pressured in an eventful week
The US markets saw a week full of actions and events, with complex intermarket reactions influenced by economic data, the FOMC rate decision, and ongoing concerns over regional banks. The robust April non-farm payroll data, featuring strong job and wage growth, and a dip in unemployment rate, was overshadowed by significant downward revisions for March numbers. Fed softened its hawkish tone after delivering the expected 25bps rate hike, but Chair Jerome Powell refrained from providing clear guidance on a pause.
Investor sentiment was largely driven by persistent worries over regional banks, causing DOW to plummet mid-week. However, sentiment rebounded on Friday following JPMorgan's upgrade of Western Alliance, Zions Bancorp, and Comerica, citing that they were "substantially mispriced" due to short-selling activity. Apple's strong fiscal Q2 report, which beat top and bottom line expectations, further boosted sentiment.
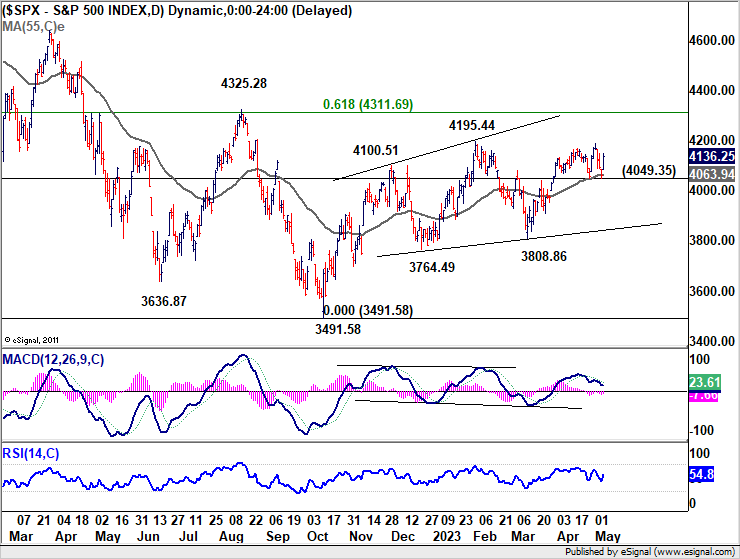
Although DOW briefly broke near-term support at 33362.64, S&P 500 and NASDAQ defended their corresponding levels effectively. As for the SPX, rise from 3491.58 is expected to continue as long as 4049.35 support holds, with key hurdle at 4325.28 cluster resistance (61.8% retracement of 4818.62 to 3491.58 at 4311.69).
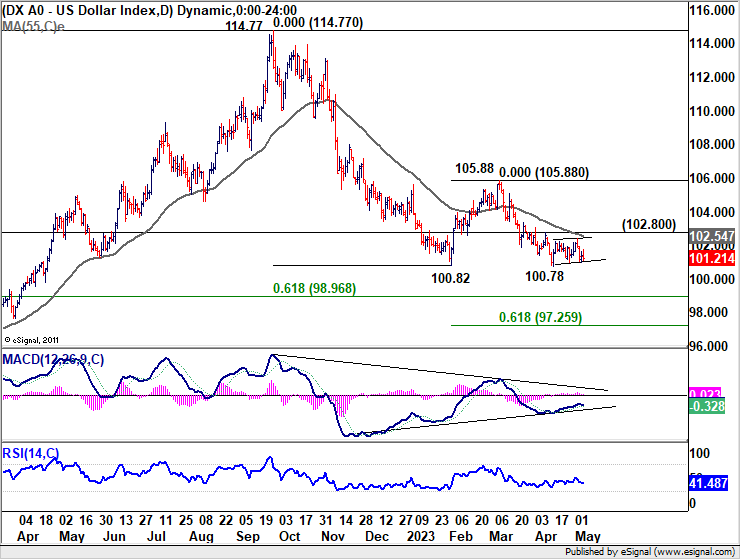
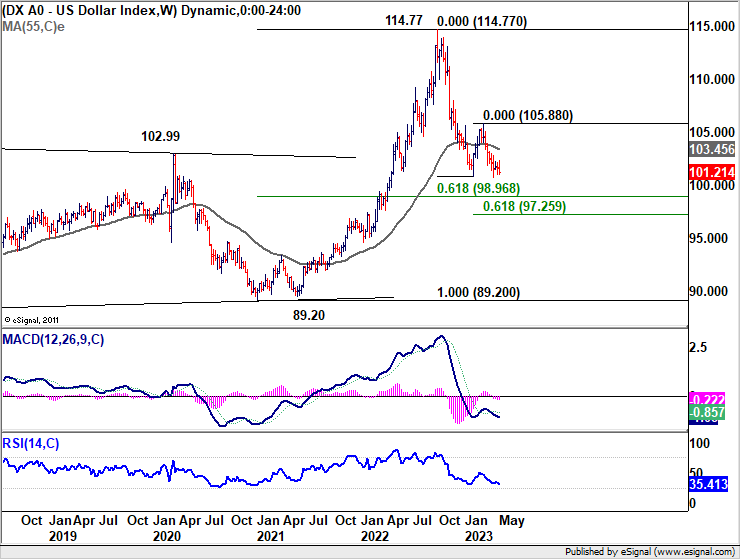
Dollar Index struggled to extend its near-term rebound, suggesting that consolidation from 100.78 might have already completed without even reaching 55 D EMA (now at 102.54). Downside breakout through 100.78 appears imminent. The question is whether it could bottom at around 61.8% retracement of 89.20 to 114.77 at 98.96. Or, there won't be enough buying for a bounce until 61.8% projection of 114.77 to 100.82 from 105.88 at 97.25.
Euro also struggled on uncertain ECB path ahead
Euro didn't fare better than Dollar last week, even as ECB also delivered a 25bps rate hike. President Christine Lagarde made it clear that "we are not pausing." However, the step-down in tightening created some uncertainty for the path ahead. While some analysts still expect two more 25bps hikes in June and July, risks are tilted towards an earlier end due to tightening bank lending conditions and collapsing loan demand in the Eurozone.
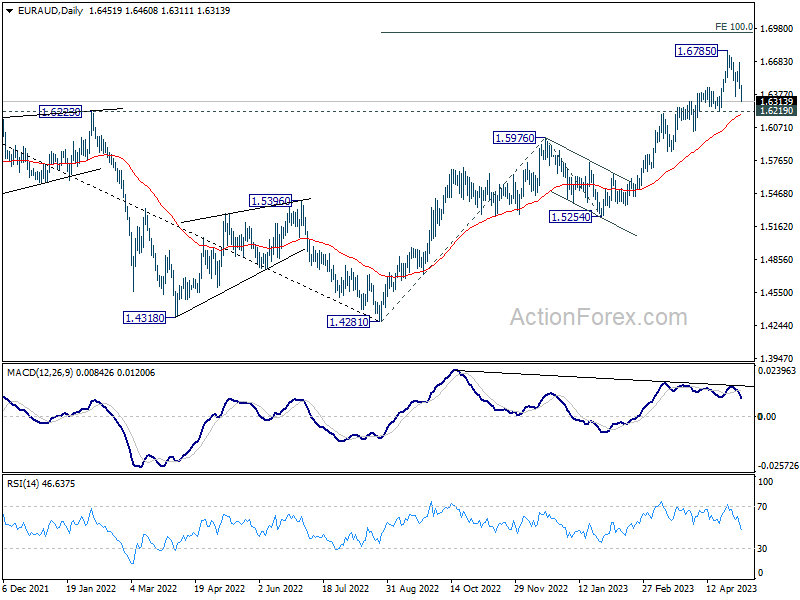
EUR/AUD ended notably lower at 1.6313 last week, and although 1.6219 support still holds, the risks of a top formation ahead of 100% projection of 1.4281 to 1.5976 from 1.5254 at 1.6949 are increasing. Given bearish divergence condition in D MACD, firm break of 1.6219 would suggest that EUR/AUD has entered a correction to the whole uptrend from 1.4281, risking deeper pullback into the 1.5254/5976 support zone.
Commodity currencies triumph as risk sentiment and bullish factors align
Commodity currencies were the biggest winners last week. Resilient risk sentiment played a role, but each of New Zealand, Australian, and Canadian had their own bullish factors. Strong Q1 job data from New Zealand supported another rate hike by RBNZ on May 24. RBA surprised with a 25bps last week, rather than another pause. RBA Statement on Monetary Policy also argue it's not done with tightening.
Canadian Dollar once experienced some jitters with WTI crude oil spiked to lowest level since 2021. But oil price than rebounded quickly, with WTI settling above 71 handle. Strong job data from Canada prompted doubts on whether BoC should rethink about its rate pause. At least, the possible of a rate cut by BoC was pushed further into 2024.
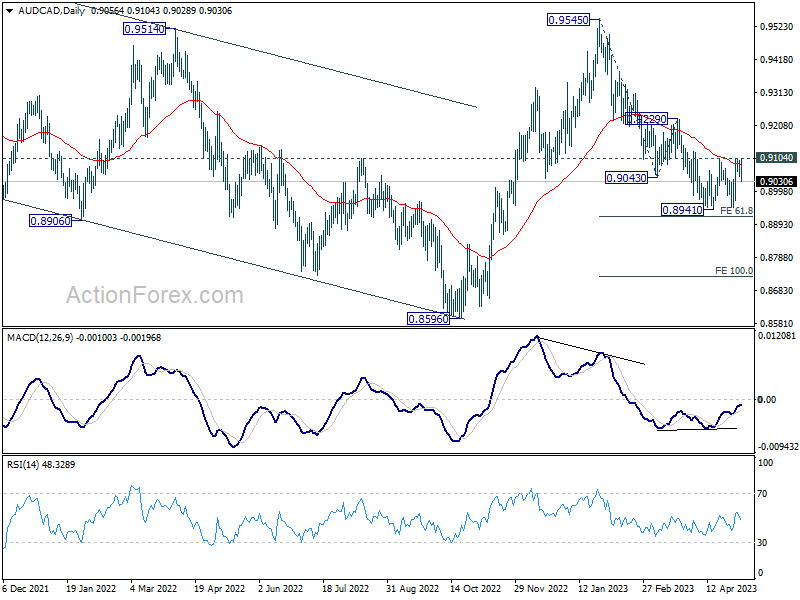
The Loonie was the relatively stronger one among commodity currencies last week. AUD/CAD's late decline raises the chance that corrective pattern from 0.8941 has completed already, after rejection by 0.9104 resistance. Failure to sustain above 55 D EMA (now at 0.9058) is also a bearish signal.
Deeper decline is mildly in favor this week through 0.8941. The main question is whether the sell off could power through 61.8% projection of 0.9545 to 0.9043 from 0.9229 at 0.8919. If that happens, deeper fall could be seen towards 100% projection at 0.8727, with downside acceleration.
USD/CAD Weekly Outlook
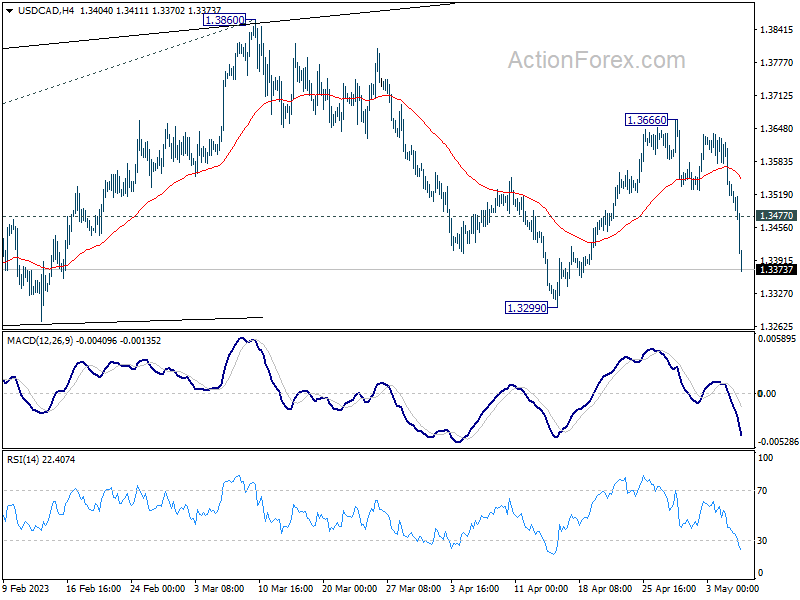
USD/CAD's steep decline last week indicates short term topping at 1.3666. More importantly, the downside acceleration now argues that fall from 1.3860 is the third leg of the pattern from 1.3976. Initial bias is no won the downside this week first 1.3299 support first. Firm break there will target 100% projection of 1.3976 to 1.3224 from 1.3860 at 1.3395 next. On the upside, though, above 1.3477 minor resistance will turn intraday bias neutral first.
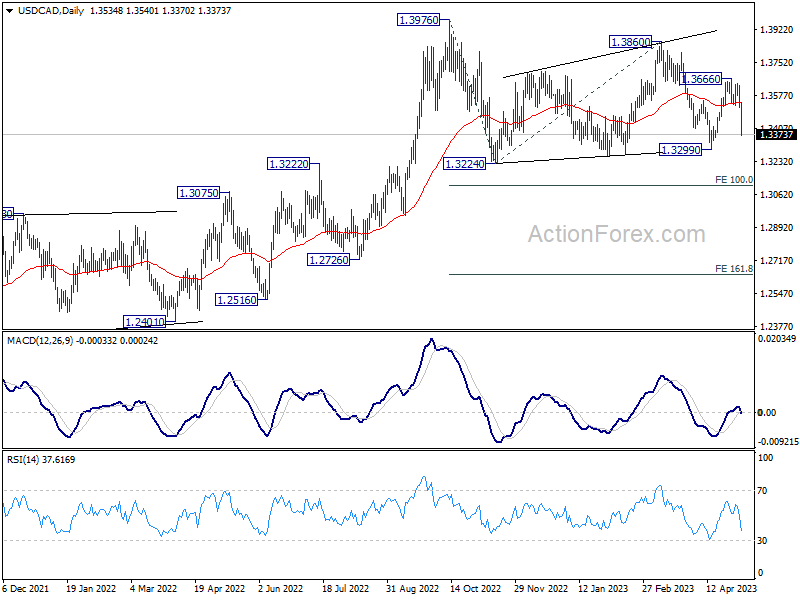
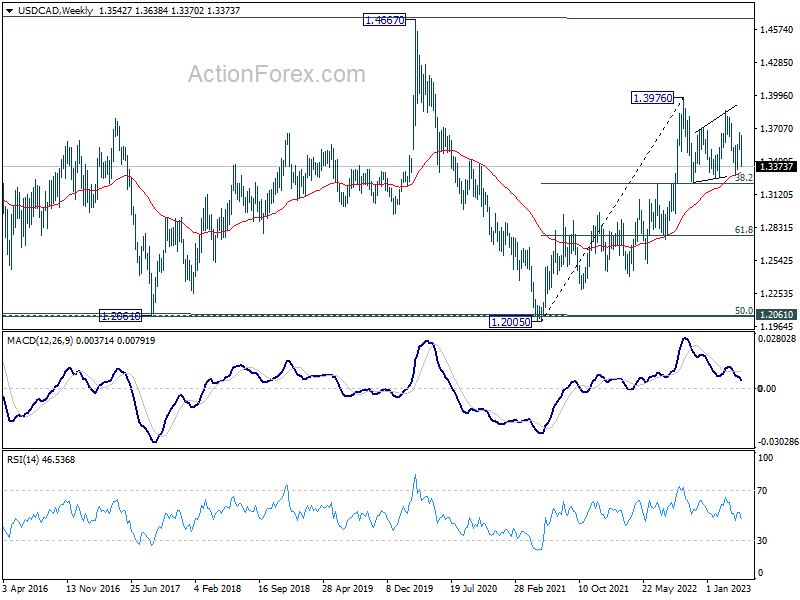
In the bigger picture, as long as 55 W EMA (now at 1.3312) holds, up trend from 1.2005 (2021 low) is still in favor to resume through 1.3976 at a later stage. However, sustained trading below the EMA and 38.2% retracement of 1.2005 to 1.3976 at 1.3233 will raise the chance of bearish reversal. Deeper should then be seen to 61.8% retracement at 1.2758 next.
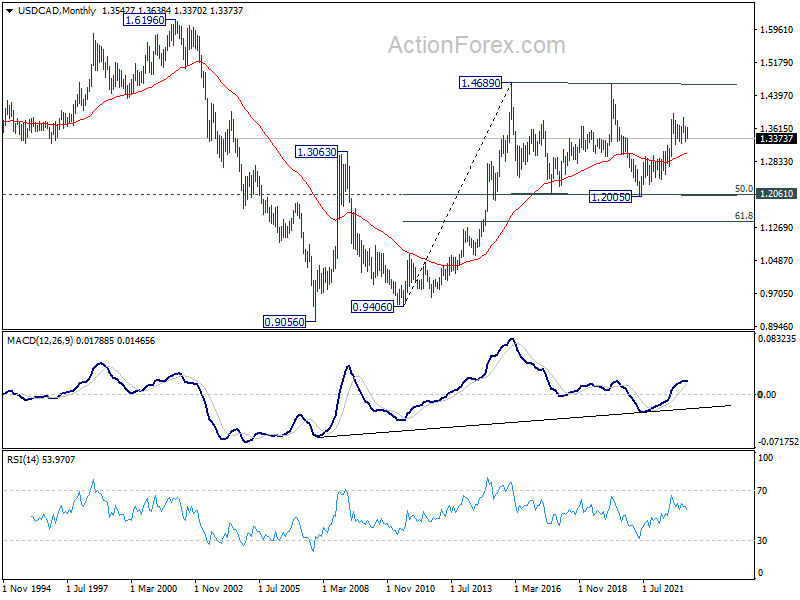
In the longer term picture, price actions from 1.4689 (2016 high) are seen as a consolidation pattern only, which might have completed at 1.2005. That is, up trend from 0.9506 (2007 low) is expected to resume at a later stage. This will remain the favored case as 55 M EMA (now at 1.3025) holds.
EUR/USD Weekly Outlook
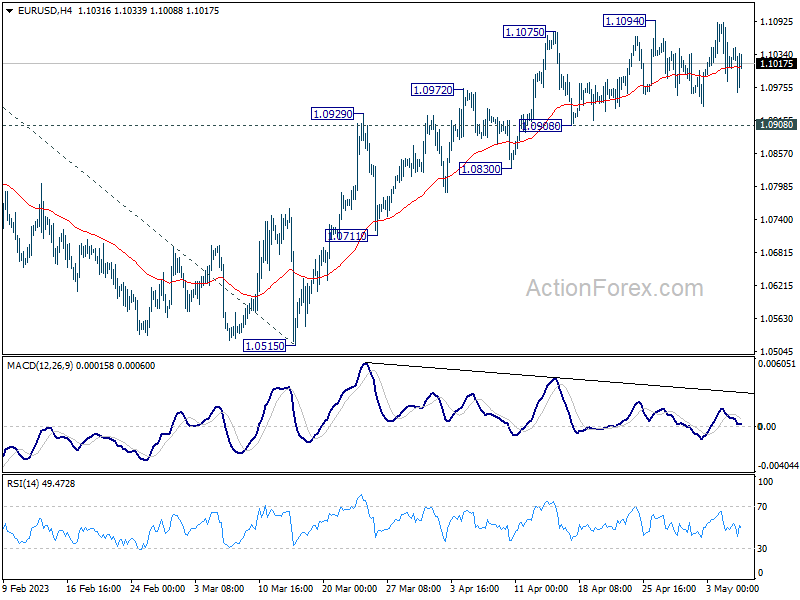
EUR/USD extended the consolidation from 1.1094 last week and outlook is unchanged. Initial bias stays neutral this week first and further rally is in favor. On the upside, firm break of 1.1094 will resume larger up trend to 1.1273 fibonacci level. Break there will target 61.8% projection of 0.9534 to 1.1032 from 1.0515 at 1.1441 However, considering bearish divergence condition in 4H MACD, break of 1.0908 support will indicate short term topping and turn bias back to the downside.
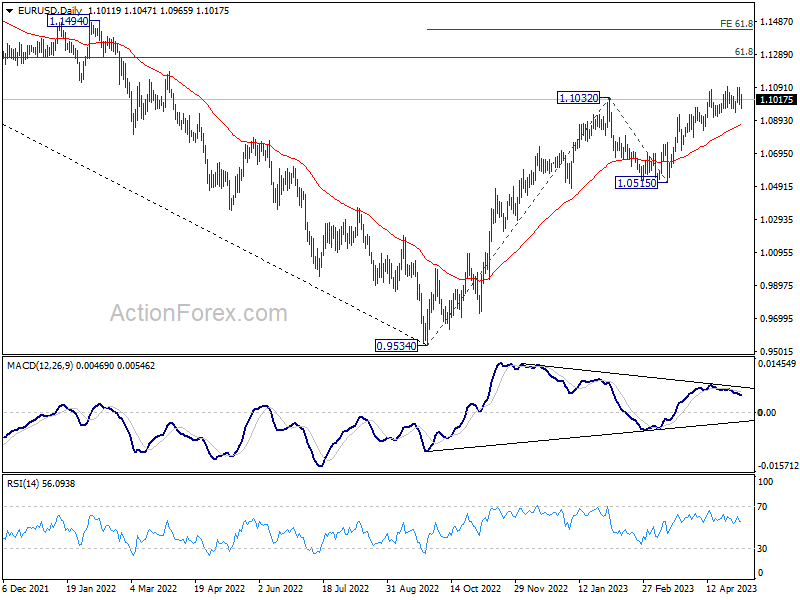
In the bigger picture, rise from 0.9534 (2022 low) is in progress for 61.8% retracement of 1.2348 (2021 high) to 0.9534 at 1.1273. Sustained break there will solidify the case of bullish trend reversal and target 1.2348 resistance next (2021 high). This will now remain the favored case as long as 1.0515 support holds, even in case of deeper pull back.
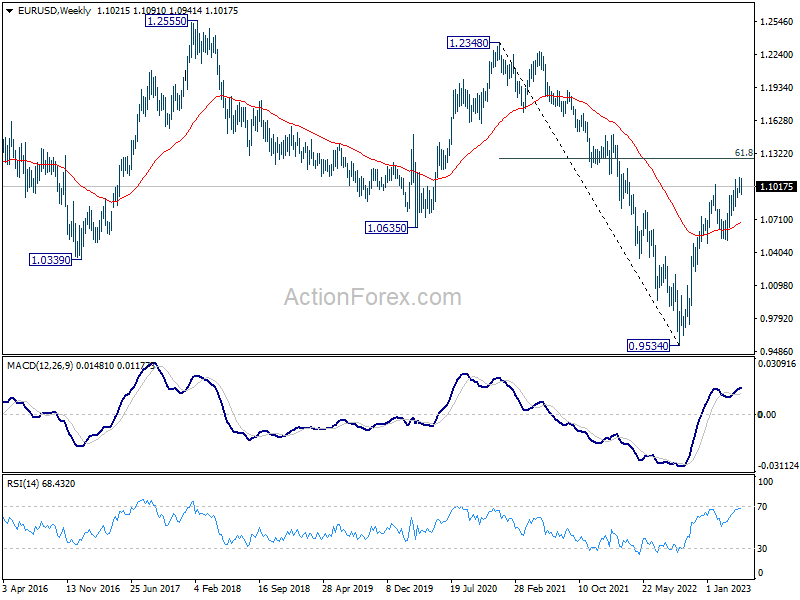
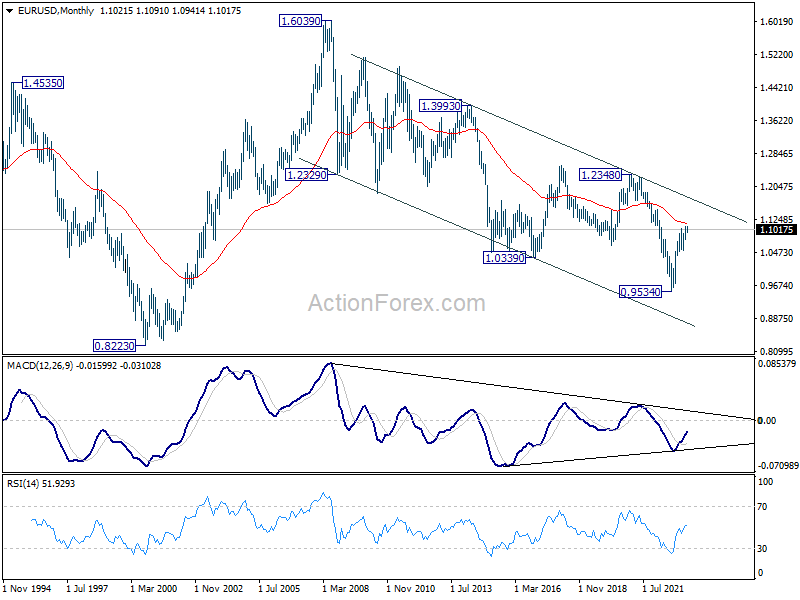
In the long term picture, while it's still early to call for long term trend reversal at this point, the strong break of 1.0635 support turned resistance (2020 low) should at least turn outlook neutral. Focus is now on 55 M EMA (now at 1.1162). Rejection by this EMA will revive long term bearishness. However, sustained break above here will be an indication underlying bullishness and target 1.2348 resistance next.
USD/JPY Weekly Outlook
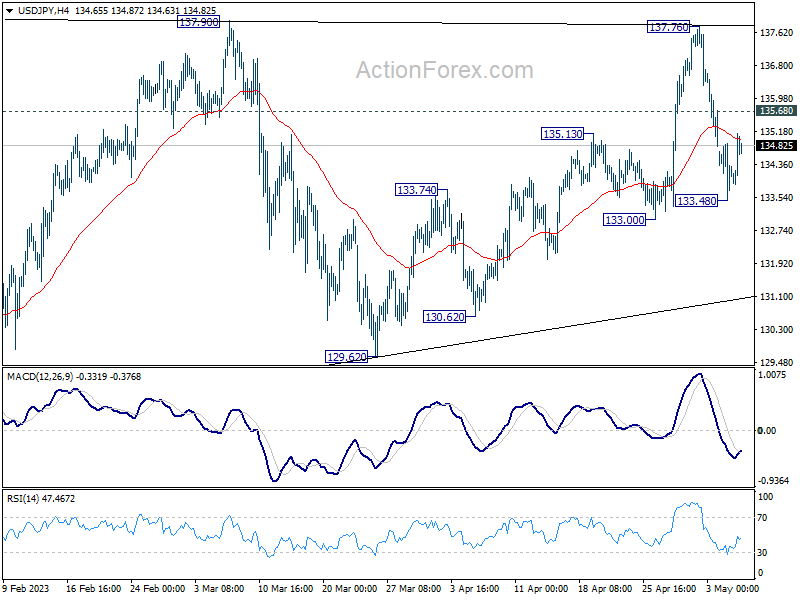
USD/JPY dropped sharply last week after failing to break through 137.90 resistance. But as a temporary low was formed at 133.48, initial bias is neutral this week first. Fall from 137.76 is seen as the third leg of the pattern from 137.90. Below 133.48 will target 133.00 first, break will target 129.62 support. Still, as long as 129.62 holds, larger rebound from 127.20 is still in favor to resume at a later stage. On the upside, above 135.68 minor resistance will turn bias back to the upside for 137.76/90 instead.
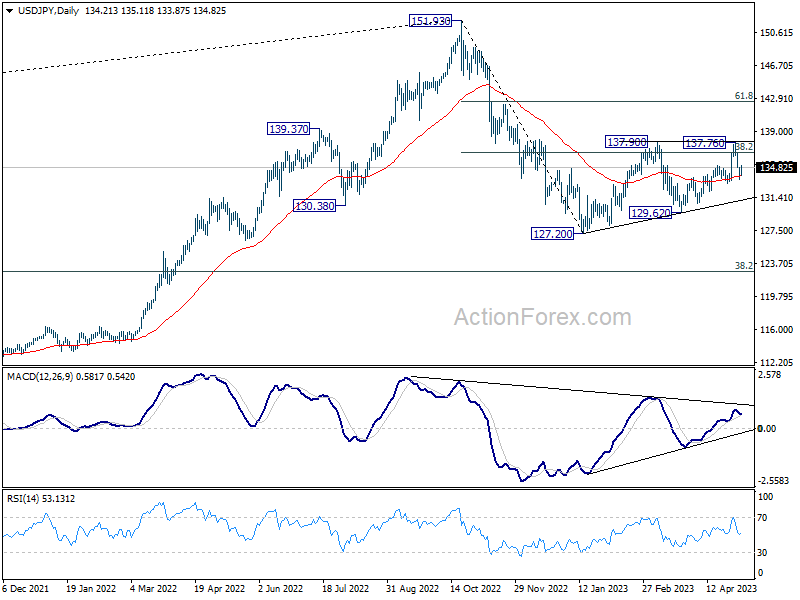
In the bigger picture, price actions from 151.93 high are currently seen as a corrective pattern to the long term up trend. The first leg should have completed at 127.20. Rebound from there is seen as the second leg. Sustained break of 38.2% retracement of 151.93 to 127.20 at 136.34 will bring stronger rebound to 61.8% retracement at 142.48. Meanwhile, break of 129.62 will argue that the third leg is starting through 127.20 low.
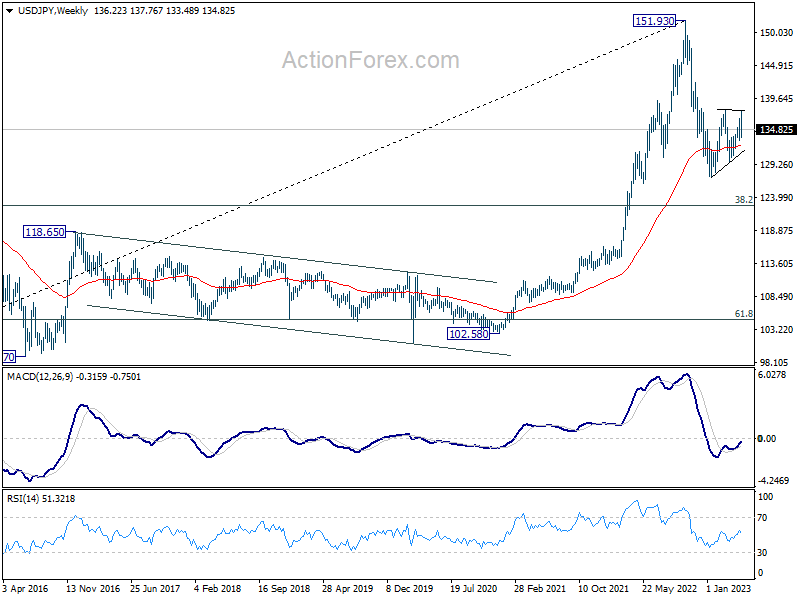
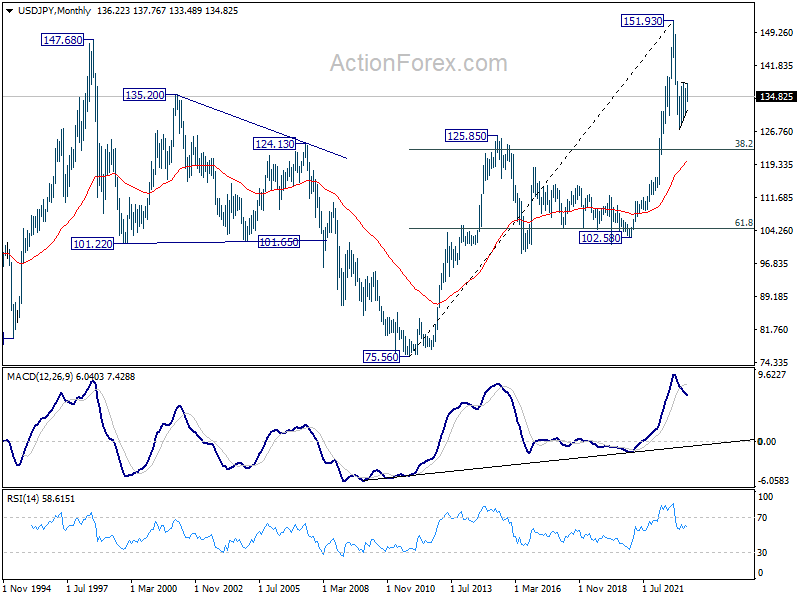
In the long term picture, price action from 151.93 is seen as developing into a corrective pattern to up trend from 75.56 (2011 low). While deeper decline cannot be ruled out, downside should be contained by 38.2% retracement of 75.56 to 151.93 at 122.75.
GBP/USD Weekly Outlook
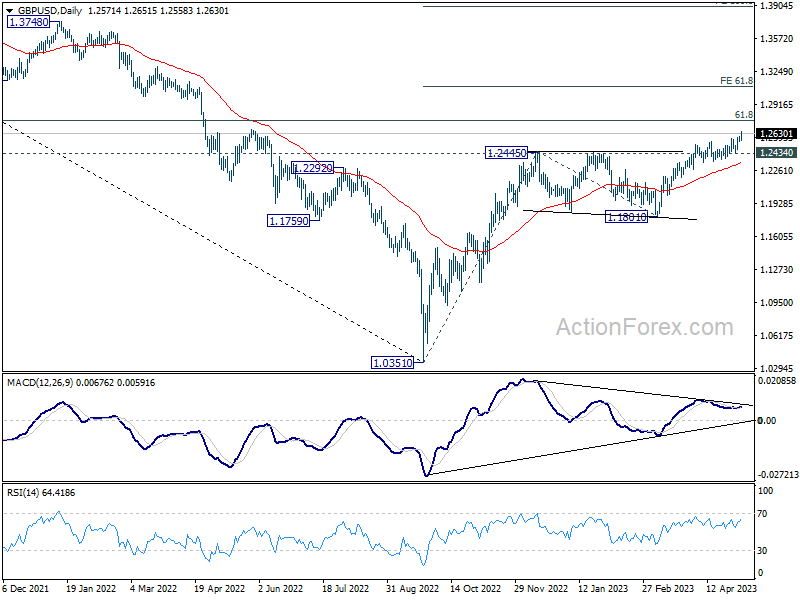
GBP/USD's uptrend continued last week without sign of topping. Initial bias remains on the upside this week. Next target is 1.2759 fibonacci level first. Firm break there will target 61.8% projection of 1.0351 to 1.2445 from 1.1801 at 1.3095.
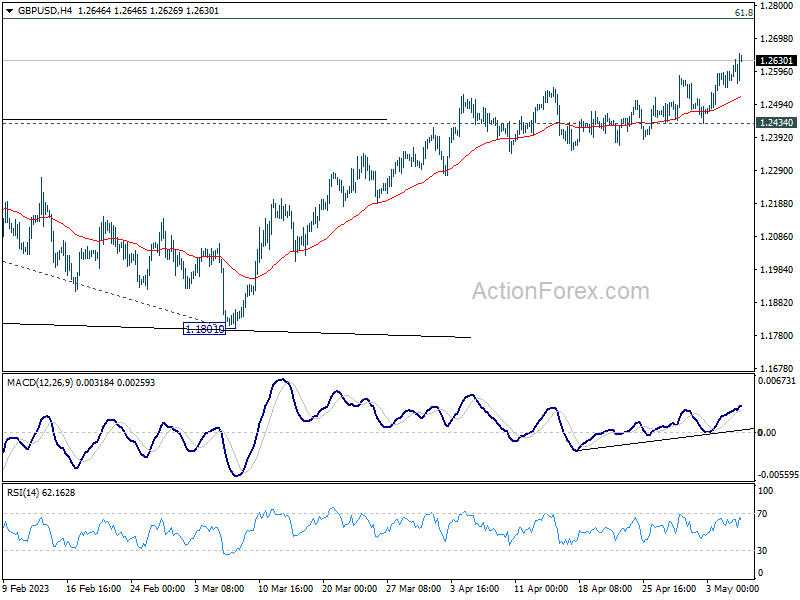
In the bigger picture, the rise from 1.0351 medium term term bottom (2022 low) is in progress for 61.8% retracement of 1.4248 (2021 high) to 1.0351 at 1.2759. Sustained break there will add to the case of long term bullish trend reversal. Further break of 61.8% projection of 1.0351 to 1.2445 from 1.1801 at 1.3095 could prompt upside acceleration to 100% projection at 1.3895. For now, this will remain the favored case as long as 1.1801 support holds, even in case of deep pull back.
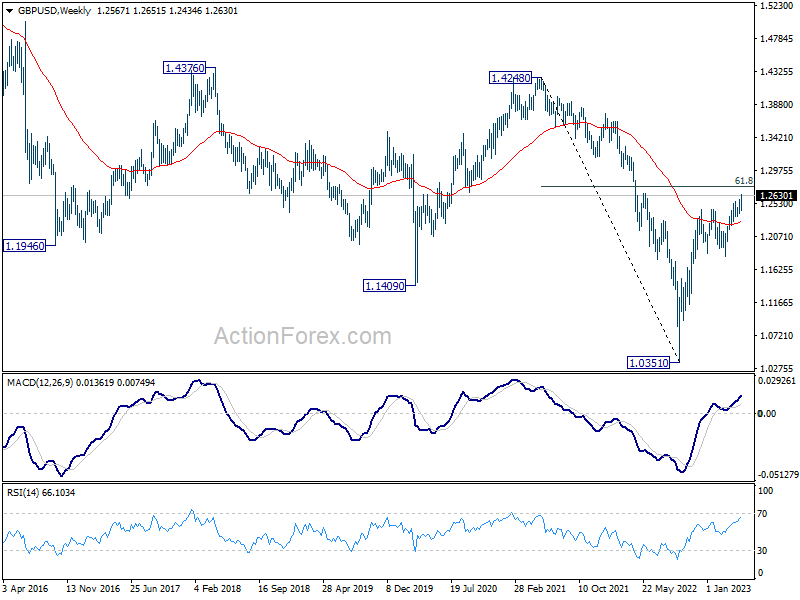
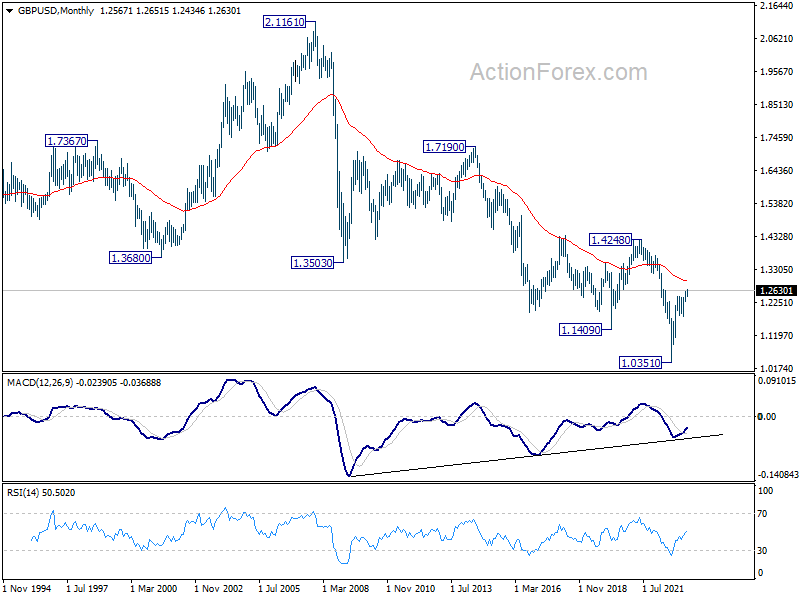
In the long term picture, while the rise from 1.0351 (2022 low) has been strong, there is no clear indicate of long term trend reversal yet. As long as 1.4248 resistance holds (2021 high), long term outlook will remain neutral at best.
USD/CHF Weekly Outlook
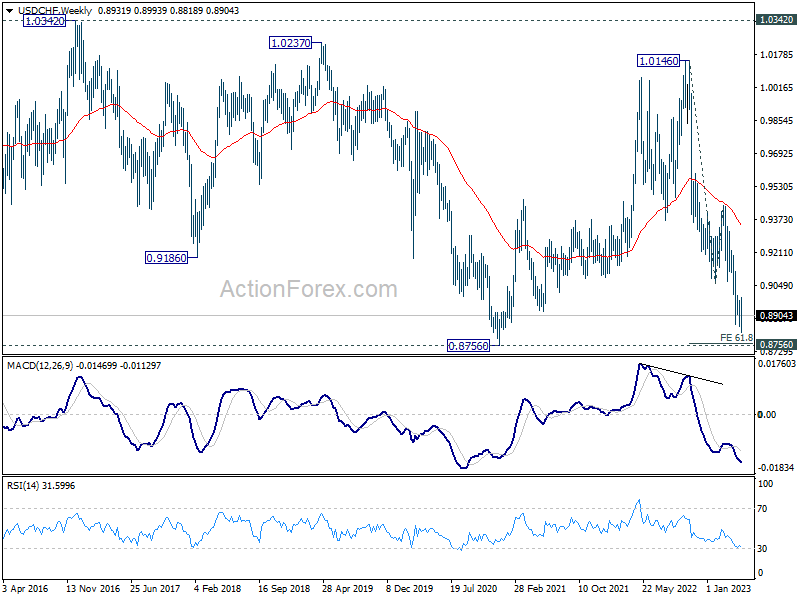
USD/CHF edged lower to 0.8818 and recovered again, but stayed below 0.8993 resistance. Initial bias stays neutral this week first. While down trend from 1.0146 could still extend lower, strong support should be seen from 61.8% projection of 1.0146 to 0.9058 from 0.9439 at 0.8767, which is close to 0.8756 long term support, to bring rebound, at least on first attempt. On the upside, break of 0.8993 resistance will indicate short term bottoming, on bullish convergence condition in 4H MACD, and turn bias back to the upside for stronger rebound.
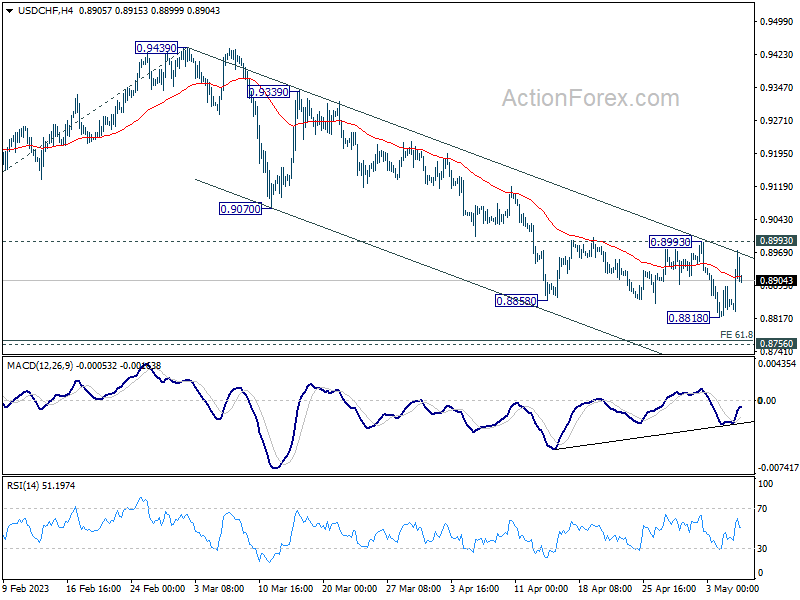
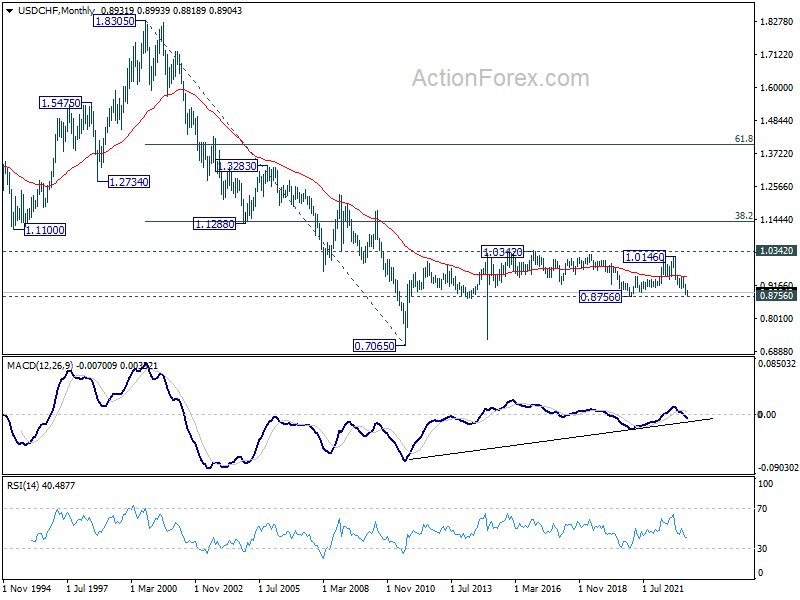
In the bigger picture, fall from 1.1046 (2022 high) is seen as a leg in the long term range pattern from 1.0342 (2016 high). So, downside should be contained by 0.8756 to bring reversal. Sustained break of 0.9058 support turned resistance will be the first sign of medium term bottoming. However, decisive break of 0.8756 will carry larger bearish implications.
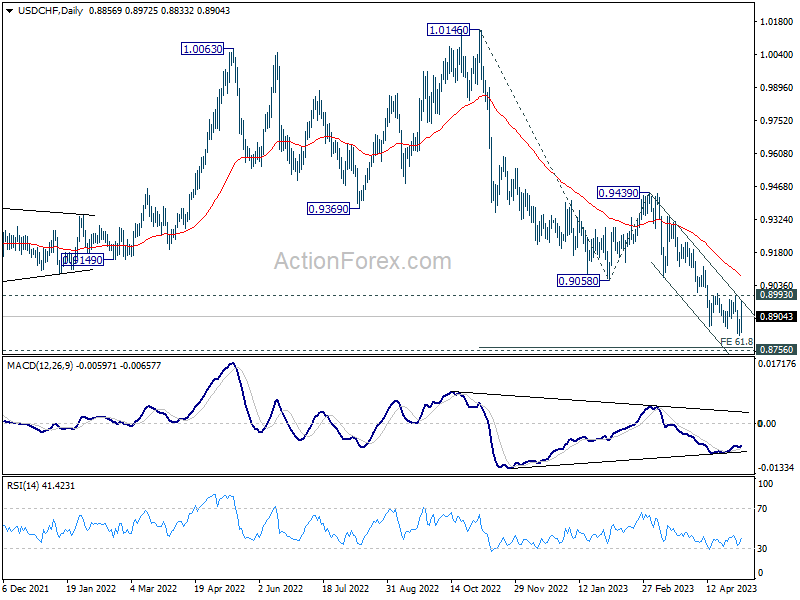
In the long term picture, long term sideway pattern from 1.0342 (2016 high) is expected to continue between 0.8756/1.0342. However, sustained break of 0.8756 will open up deeper fall back towards 0.7065 (2011 low).