Sample Category Title
EUR/JPY Daily Outlook
Daily Pivots: (S1) 146.94; (P) 148.07; (R1) 149.02; More....
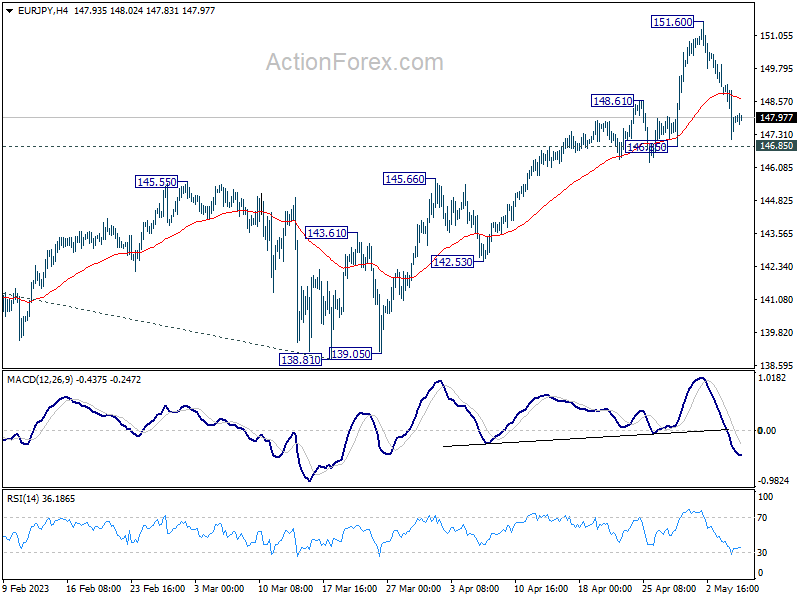
EUR/JPY's retreat from 151.60 extended lower but it's holding above 146.85 support. Intraday bias remains neutral and outlook stays bullish. On the upside, break of 151.60 will resume larger up trend to 153.64 projection level. Nevertheless, firm break of 146.85 will confirm short term topping and turn bias to the downside for deeper pull back.
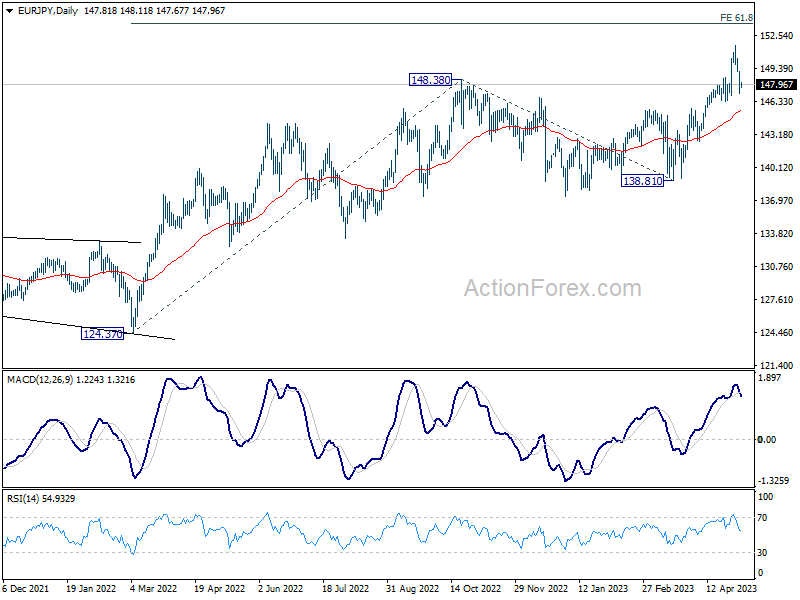
In the bigger picture, current development indicates that rise from 114.42 (2020 low) is in progress. Next target is 61.8% projection of 124.37 to 148.38 from 138.81 at 153.64. Sustained break there will pave the way to 100% projection at 162.82. For now, medium term outlook will remain bullish as long as 138.81 support holds, even in case of deep pull back.
EUR/GBP Daily Outlook
Daily Pivots: (S1) 0.8733; (P) 0.8773; (R1) 0.8801; More...
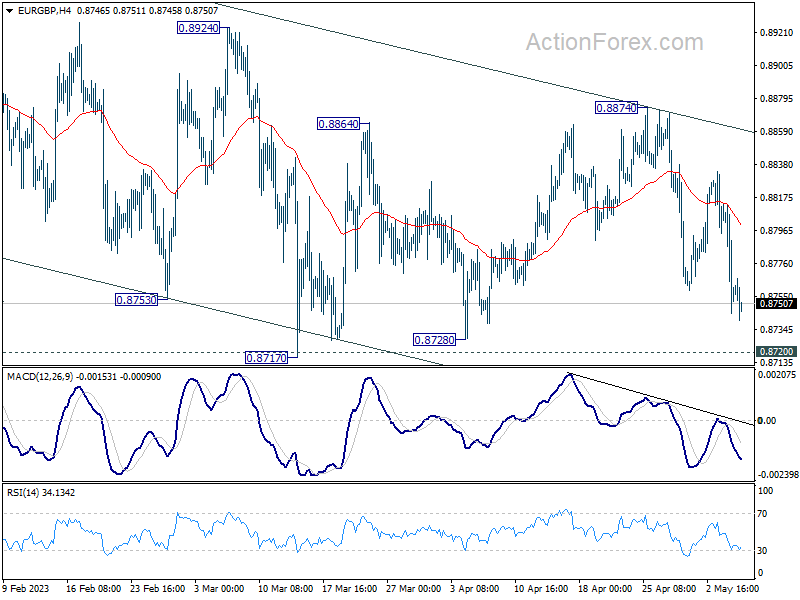
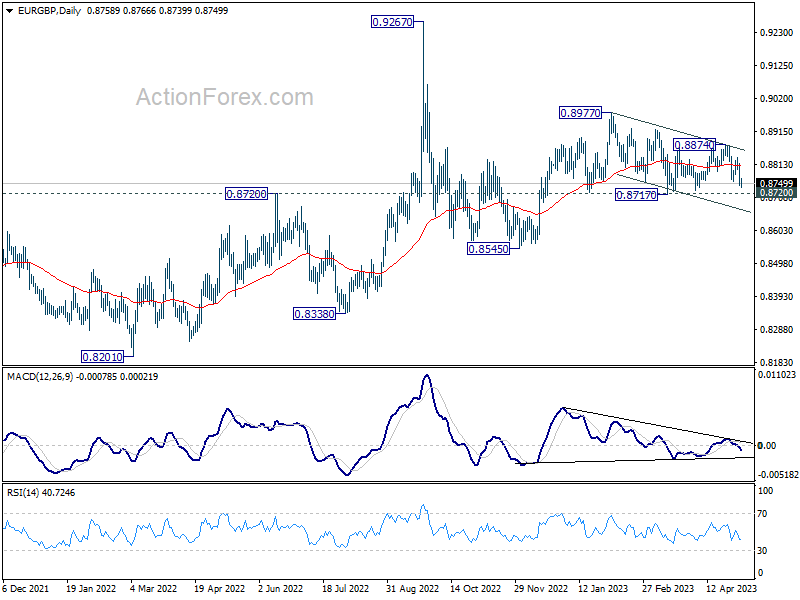
Intraday bias in EUR/GBP remains neutral as range trading continues, and outlook is mixed. On the downside, decisive break of 0.8717 support will resume whole choppy decline from 0.8977. On the upside, break of 0.8874 will resume the rebound from 0.8717 instead.
In the bigger picture, outlook remains rather mixed for now, except that price actions from 0.9267 (2022 high) are part of the long term range pattern from 0.9499 (2020 high). With 0.8720 support intact, rise from 0.8545 is in favor to continue through 0.8977. However, firm break of 0.8720 will argue that such rebound has completed, and open up deeper fall through this support level.
EUR/AUD Daily Outlook
Daily Pivots: (S1) 1.6368; (P) 1.6518; (R1) 1.6603; More...
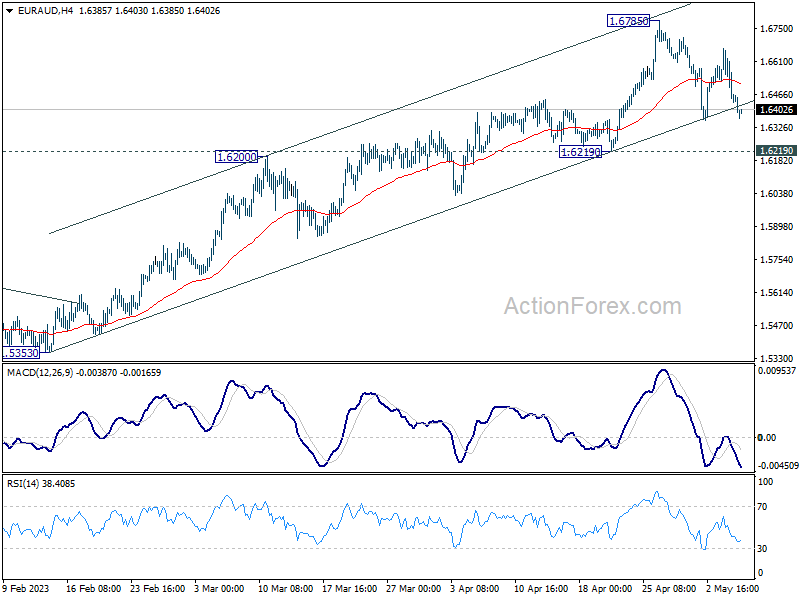
EUR/AUD is staying in consolidation from 1.6785 and intraday bias remains neutral for the moment. As long as 1.6219 support holds, further rally is expected. On the upside, break of 1.6785 will resume larger up trend to 100% projection of 1.4281 to 1.5976 from 1.5254 at 1.6949. However, firm break of 1.6219 will argue that larger correction is on the way.
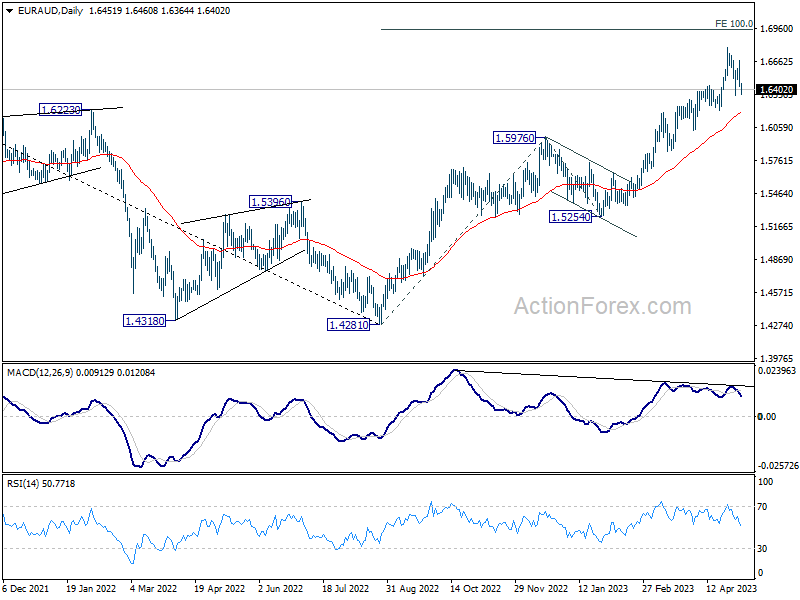
In the bigger picture, the solid break of 1.6434 resistance argues that whole down trend from 1.9799 (2020 high) has completed at 1.4281 (2022 low). Further rise should be seen to 61.8% retracement of 1.9799 to 1.4281 at 1.7691 next. For now, outlook will stay bullish as long as 1.5976 resistance turned support holds, even in case of deep pull back.
EUR/CHF Daily Outlook
Daily Pivots: (S1) 0.9730; (P) 0.9772; (R1) 0.9798; More...
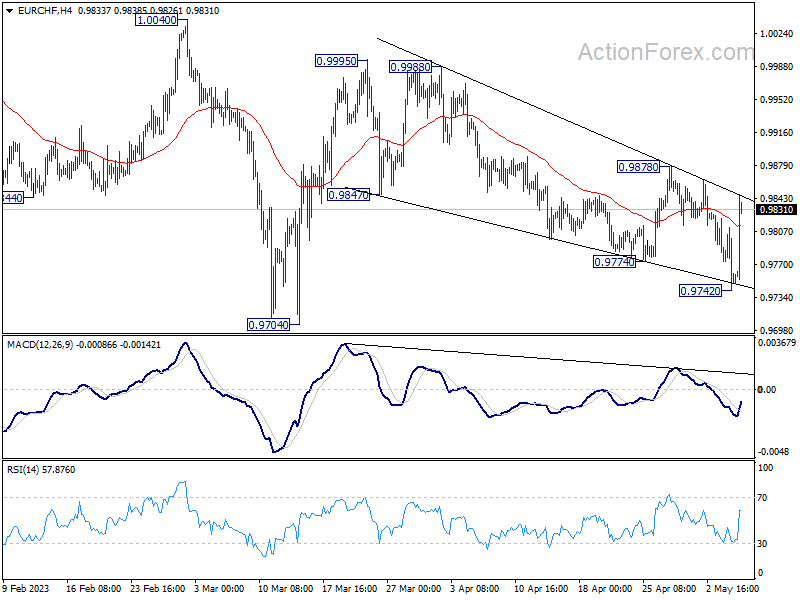
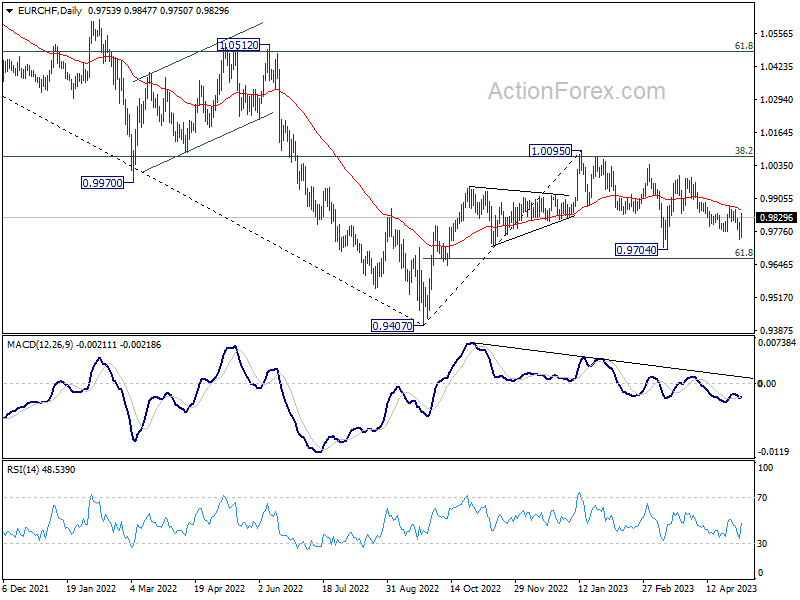
EUR/CHF rebounded strongly after dipping to 0.9742 and intraday bias is turned neutral first. On the upside, break of 0.9878 will indicate short term bottoming, and turn bias back to the upside. Also, outlook is unchanged that whole correction from 1.0095 has completed at 0.9704. Sustained trading 55 D EMA (now at 0.9864) will affirm this bullish case, and target 0.9995 resistance next.
In the bigger picture, prior rejection by 55 W EMA (now at 0.9972) and 38.2% retracement of 1.1149 to 0.9407 at 1.0072 suggests that medium term outlook is staying bearish. That is, down trend from 1.2004 is not completed yet and is in favor to resume through 0.9407 at a later stage. However, decisive break of 1.0095 resistance will raise the chance of bullish trend reversal. Rise from 0.9407 should then target 1.0505 cluster resistance (2020 low at 1.0505, 61.8% retracement of 1.1149 to 0.9407 at 1.1484).
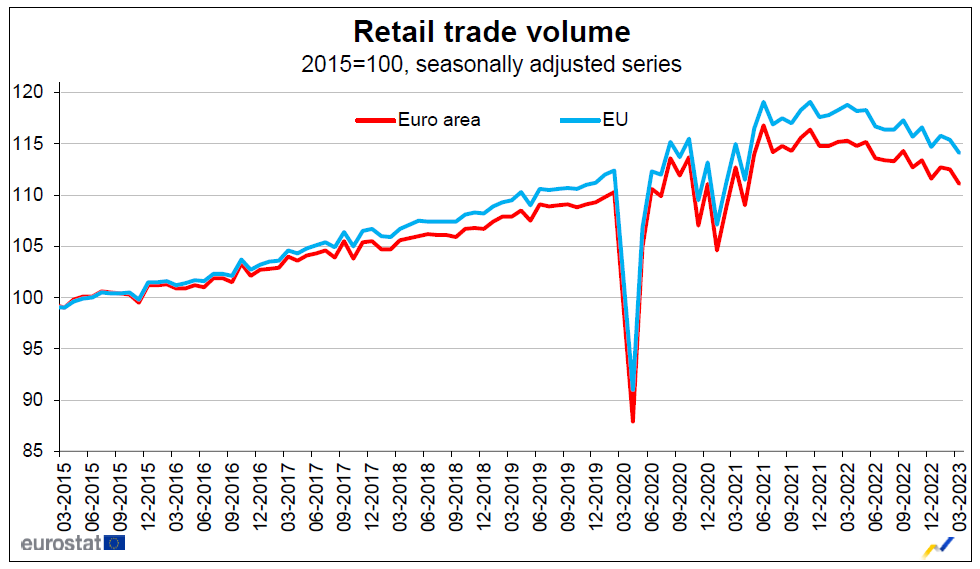
Eurozone retail sales contracted -1.2% mom in Mar, EU down -1.1% mom
Eurozone retail sales volume contracted -1.2% mom in March, much worse than expectation of -0.2% mom. The volume of retail trade decreased by -1.4% mom for food, drinks and tobacco and by -1.1% mom for non-food products, while it increased by 1.6% mom for automotive fuels.
EU retail sales declined by -1.1% mom. Among Member States for which data are available, the largest monthly decreases in the total retail trade volume were registered in Latvia (-2.7%), Germany and Poland (both -2.4%) and Luxembourg (-1.9%). The highest increases were observed in Romania (+2.9%), Portugal (+2.3%) and Ireland (+1.0%).
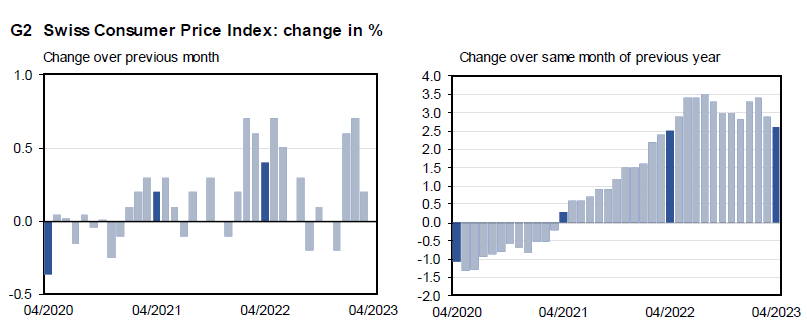
Swiss CPI slowed to 2.6% yoy in Apr, core CPI unchanged at 2.2% yoy
Swiss CPI slowed from 2.9% yoy to 2.6% yoy in April, below expectation of 2.8% yoy. Core CPI (excluding fresh and seasonal products, energy and fuel) was unchanged at 2.2% yoy. Domestic prices edged down from 2.7% yoy to 2.6% yoy. Imported prices plunged from from 3.8% yoy to 2.4% yoy.
For the month, CPI was unchanged at 0.0% mom. Core CPI rose 0.2% mom. Domestic prices rose 0.2% while imported prices rose 0.2% mom.
EURGBP Selling May Continue
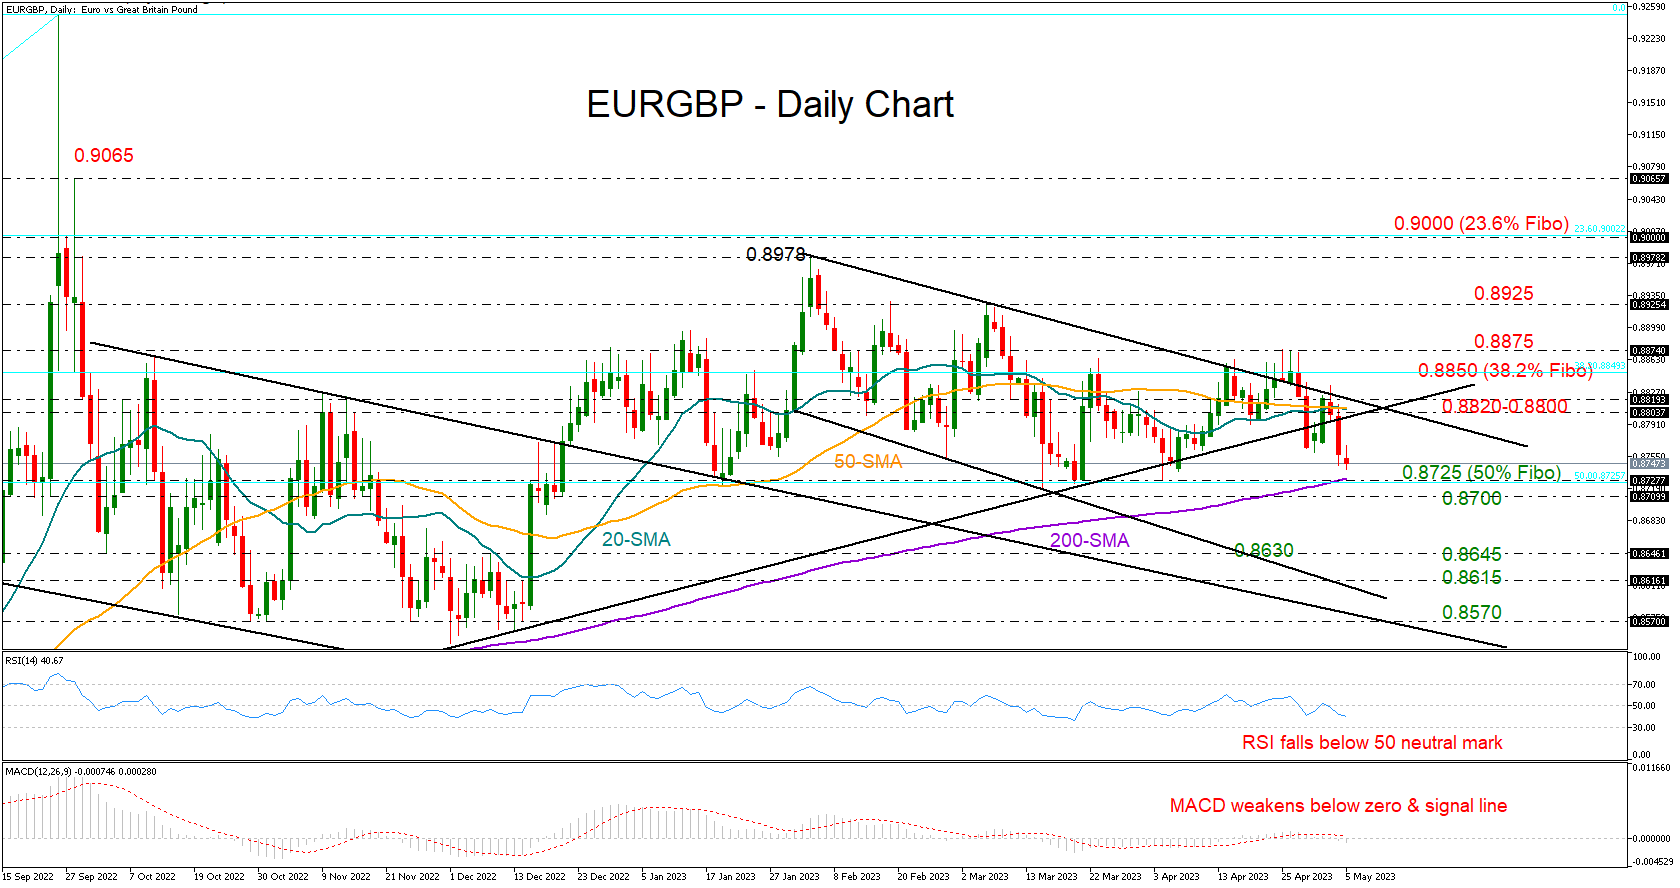
EURGBP erased Tuesday’s fast pickup, extending its two-day decline to a new one-month low of 0.8740 early on Friday.
The bulls ran out of fuel near the 38.2% Fibonacci retracement of the 0.8201-0.9249 uptrend at 0.8850 and the upper boundary of the three-month-old bearish channel, increasing speculation that a new bearish wave might be now in progress. Adding to the negative risks is Thursday’s close below the support trendline drawn from August’s lows seen at 0.8800.
The RSI and the MACD are raising a red flag too as the former is sloping downwards below its 50 neutral mark and the latter is decelerating within the negative region. Still, the bears may not take control unless the 0.8725-0.8700 zone, where the 200-day simple moving average (SMA) meets the 50% Fibonacci level, gives way. A clear step lower could activate an aggressive downfall towards the 0.8645 hurdle, while a steeper decline could reach the channel’s lower band seen near 0.8615.
A bounce higher may initially re-challenge the 0.8800-0.8820 bar ahead of the 0.8850-0.8875 resistance region. If the bulls successfully claim the latter, the recovery may stretch towards the 0.8925 barricade and then up to the key 0.8978-0.9000 territory.
In a nutshell, EURGBP is expected to face additional selling pressure in the short term, with the confirmation likely coming below 0.8725-0.8700.
RBA Lowers Growth and Inflation Forecasts But Seems Nervous – August Board Meeting “is Live”
The RBA highlights the key to the policy debate – the risks to the inflation forecasts from sticky services inflation.
The Reserve Bank’s May Statement on Monetary Policy shows that the Bank has lowered its growth and inflation forecasts for 2023 from the February Statement.
The forecasts in the May Statement assume the cash rate peaks at 3.75%, which is in line with the assumption used in the February SOMP, while the AUD assumption is around 4% lower on a TWI basis.
Forecast growth for 2023 has been lowered from 1.6% to 1.2% reflecting weaker outcomes in both household consumption (1.7% to 1.3%) and business investment (3.7% to 2.3%).
Despite these changes and the boost to population growth the unemployment track is unchanged. (3.6% in June; 4.0% in December)
Inflation forecasts have also been lowered “due to slightly weaker than expected March quarter outcome”.
Headline inflation in 2023 has been lowered from 4.8% to 4.5% and trimmed mean inflation has been lowered from 4.3% to 4.0%.
However, the inflation path does not change through 2024 with headline inflation in 2024 still forecast at 3.2% (trimmed mean 3.1%) and 2.9% (trimmed mean 2.9%) by June 2025.
Wages growth has also been downgraded from 4.2% to 4.0% in 2023.
The Bank notes that “the downgrades to the labour market and labour costs offset a stronger outlook for rent inflation and a small depreciation in the exchange rate.”
The weaker growth outlook is also putting some further downward pressure on inflation through, “retailers have increasingly cited weaker demand as a constraint on their ability to increase prices.”
We were given a “flavour” of the Bank’s concerns for the risks to the inflation outlook in the Governor’s statement following the May Board decision to raise the cash rate by 25 basis points. He emphasised his concerns with the resilience of services inflation – consistent with observations overseas.
In turn those services pressures that are largely linked to wages growth are exacerbated if productivity growth in the services sectors remains weak. This theme figures prominently in the commentary, “services inflation is expected to remain high in 2023… growth in unit labour costs is expected to be solid over the forecast period, adding to cost pressures for labour intensive market services.”
This dynamic is worrying the Bank. “Inflation could also be more persistent if productivity growth does not pick up, which would make the current outlook for labour costs more inflationary than anticipated.”
On the other hand, there is some recognition of the link between the softening of demand that is recognised in the lowering of the growth forecasts and inflation through goods inflation. “If prices for consumer durables reversed one third of the price increases recorded since the onset of the pandemic, year ended inflation would be around half a percentage point lower than the current forecast … inflation would be around the middle of the target range in the second half of 2024, instead of being above it.”
So, the key theme in the SOMP is the risks around the inflation outlook given the evidence both domestically and offshore that services inflation is slow to fall. That can be explained by the ongoing tightness of the labour market holding up wages growth and poor productivity in the market services sector which is boosting unit labour costs.
This dilemma appears to have recently become a source of considerable frustration for the Board. Their policy instrument – interest rates - is doing its job in restraining demand as demonstrated by the significant downward revisions (from the already modest forecast pace) to household spending and investment growth but has had no real success in easing pressures in the labour market or, as is to be expected, boosting productivity.
The Board is also looking abroad at similar messages, “Globally…services price inflation remains strong and could prove to be quite persistent.”
What does this message mean for the policy outlook?
The Bank’s current forecasts are based on no further increase in the cash rate. That differs from the February forecasts where the same 3.75% peak in rates was embedded in the forecasts. (At the time of the February Board meeting the cash rate was 3.10%). The forecasts still indicate that the 2.9% “target” of inflation will be reached by mid 2025.
Consequently, despite the guidance that “Some further tightening of monetary policy may be required.” the forecasts indicate that is not expected to be necessary to achieve the long-term target of 2.9%.
But forecasts are not definitive – particularly two years out.
We expect that if there is to be another hike (which is not our current base case) it will come at the August Board meeting when a complete picture of developments in overall inflation and services inflation will be available from the June quarter Inflation Report.
The Bank’s forecasts indicate that the Board will, by August, still be observing a record tight unemployment rate (3.6%); a fall in trimmed mean inflation over the quarter from 6.6% to 6.0%; a fall in headline inflation from 7% to 6.3%. Those results would be necessary to support the Board’s view that it is still on target to achieve the 2.9% by June 2025. Our current inflation forecasts suggest that the results would give the Board encouragement that inflation is slowing more quickly than they had expected.
Spending growth is expected to be slowing sharply with GDP growth and consumer spending growth down to 1% (annualised) in the first half of 2023 – in line with our own forecast.
Globally, while labour markets and services inflation may be holding up, spending growth is expected to under extreme pressure – with a real prospect of a US recession and the FOMC firmly on hold.
In some ways this scenario is similar to the data observed in May – tight labour market; inflation still way too high (but lower than expected).
But the evidence of the impact of the monetary policy tightening on real activity is expected to be much more sobering by August than we saw in May.
Our central case remains that a positive surprise on lower than expected inflation; evidence of the impact on demand of the accumulated rate hikes; and offshore pessimism will be enough to keep the Board on hold in August. But the eery comparison of the likely tight labour market and robust services inflation with May certainly indicates upside risks to our scenario.
GBPJPY Pulls Back from Fresh 7-Year High
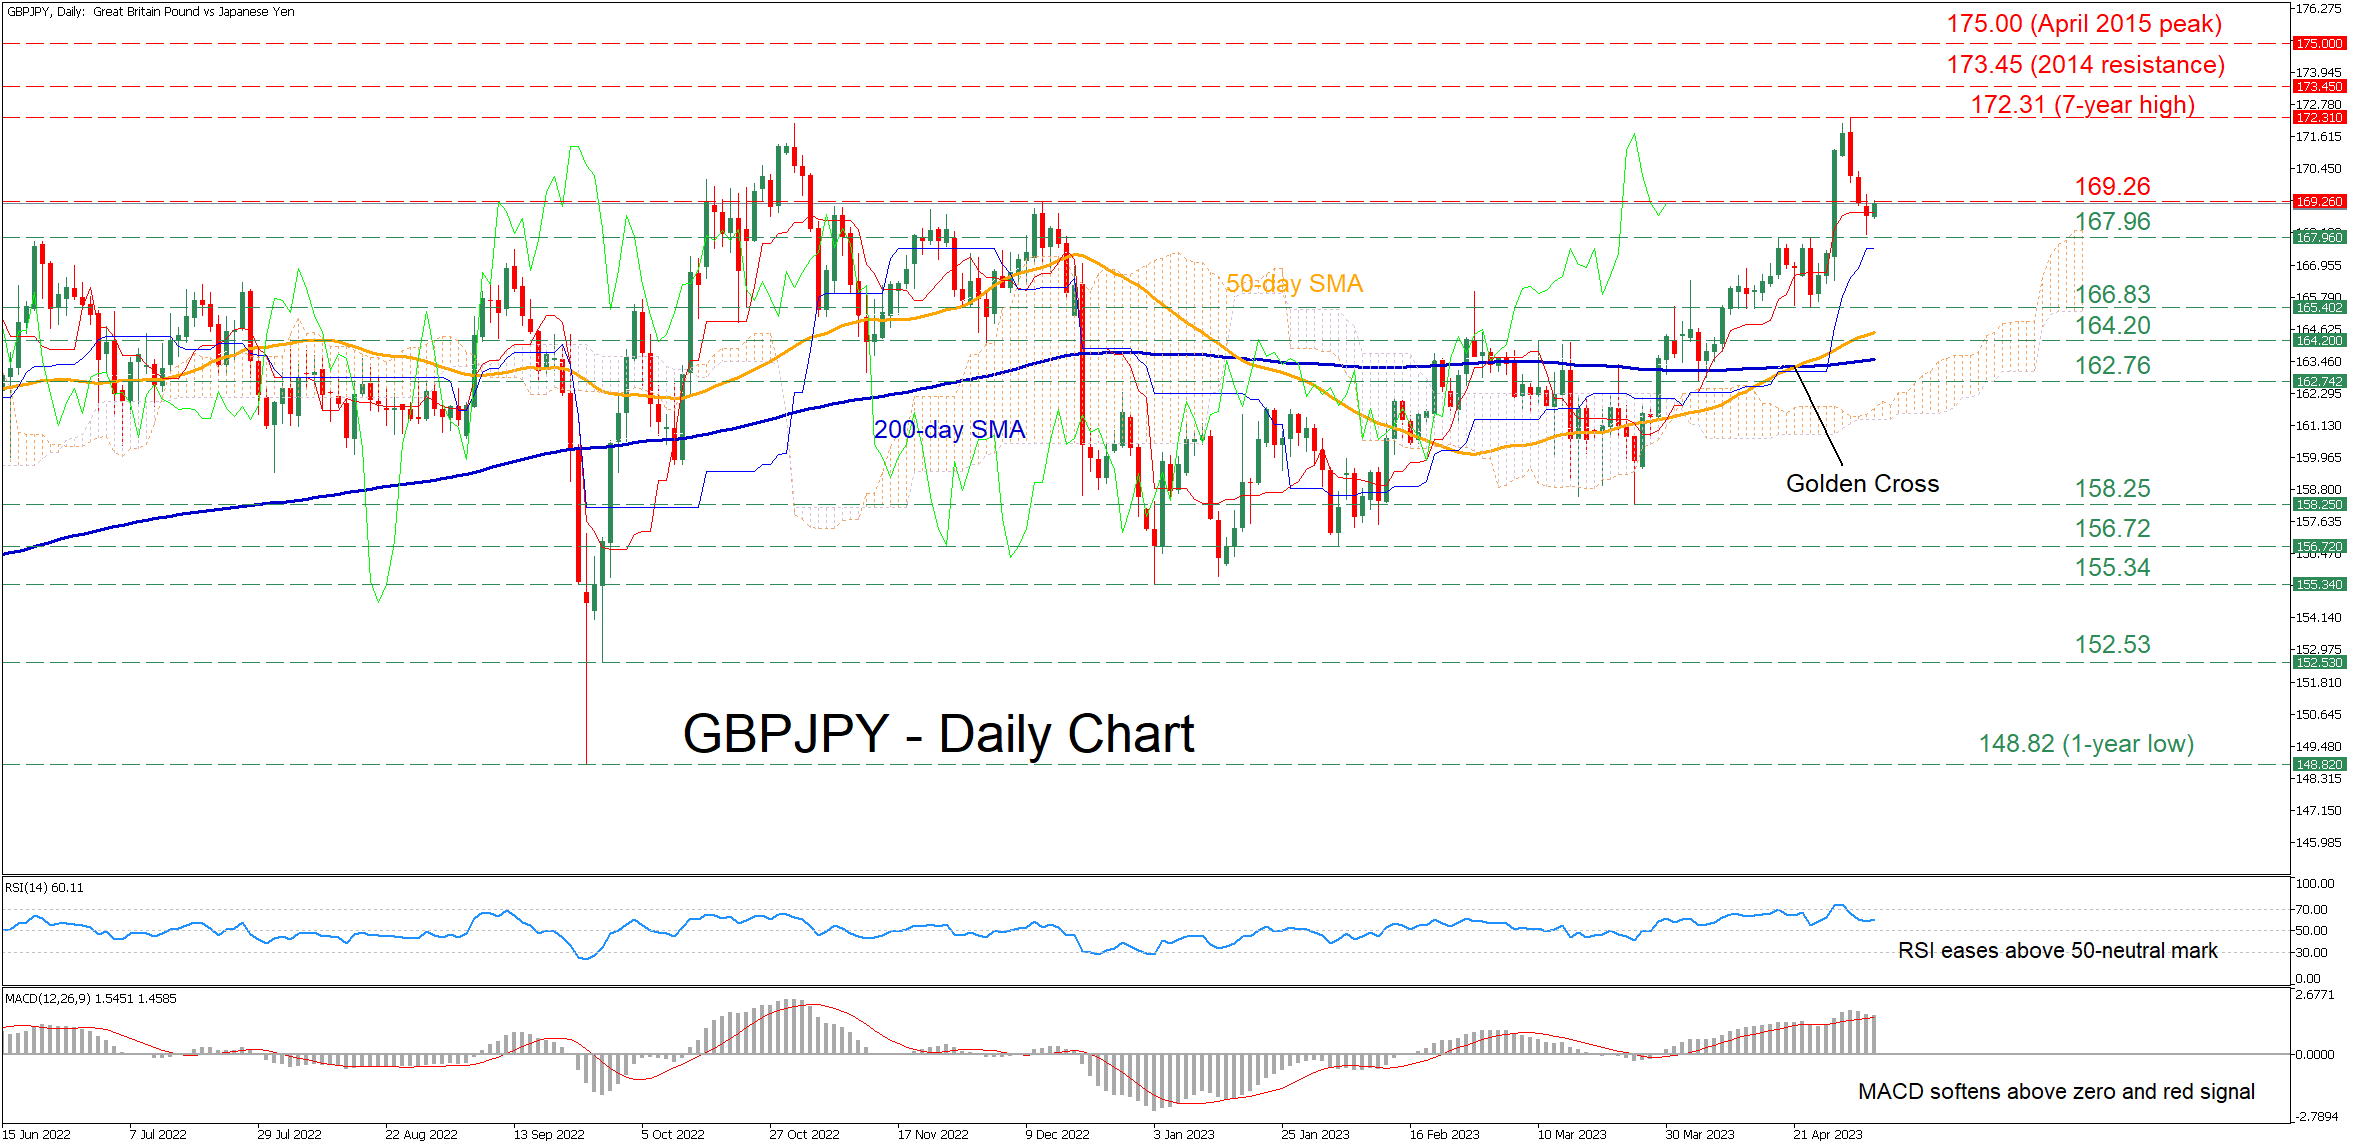
GBPJPY was stuck in an uptrend since the beginning of the year and generated a new seven-year high of 172.31 last Tuesday. Although the recent completion of a golden cross between the 50-day simple moving average (SMA) and the 200-day SMA induced bullish pressures, the pair experienced a downside correction.
The short-term oscillators currently suggest that bullish forces are waning but remain in control. Specifically, the RSI has flatlined above its 50-neutral mark despite its recent drop, while the MACD histogram is softening above both zero and its red signal line.
Should selling interest persist, the previous resistance of 167.96 could now act as immediate support. Dipping beneath this region, the pair could decline towards 166.83 before the 164.20 hurdle gets tested. Further retreats might then cease at the April support of 162.76.
On the flipside, if the price reverses higher again, the December 2022 peak of 169.26 could be the first barrier for the bulls to conquer. An upside violation of that zone could pave the way for the seven-year high of 172.31. Slicing through that barricade, the pair could ascend towards levels not seen in years, where the March-May 2014 resistance of 173.45 could curb any upside attempts.
In brief, GBPJPY experienced a pullback after its 2023 advance peaked at a fresh seven-year high of 172.31. However, the price retains its bullish structure and only a break below the 200-day SMA could shift the outlook to bearish.
USDCAD Hovers Near 1.3500 after the Pullback from 1.3640
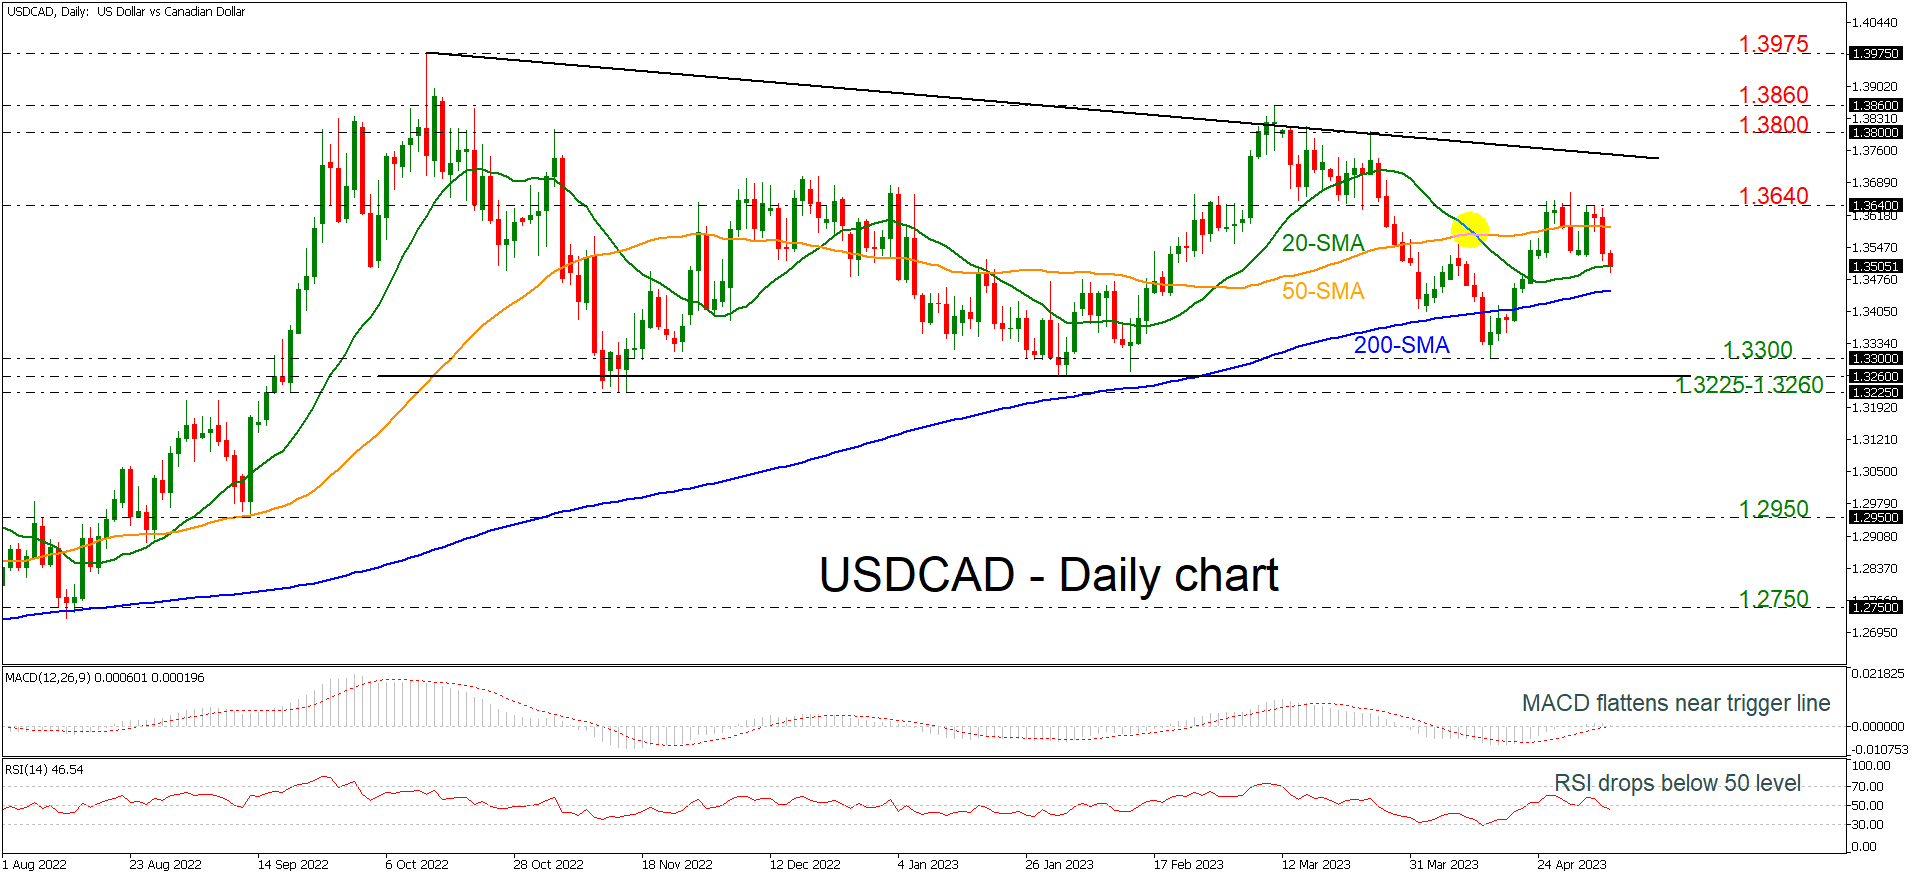
USDCAD is diving beneath the 1.3500 psychological mark and the 20-day simple moving average (SMA) after failing to jump above the 1.3640 resistance. The MACD is moving sideways near its trigger and zero lines, while the RSI is falling beneath the neutral threshold of 50. In the long-term view, the market has been still holding within a descending triangle since October 2022.
Any more losses could meet an immediate key level near the 200-day SMA at 1.3450, ahead of the 1.3300 pscyhological mark. Beneath this, the price may hit the lower boundary of the triangle at 1.3260 and the 1.3225 support. Steeper downside pressures may shift the outlook to bearish.
On the flip side, a successful rise above 1.3640 could surge towards the downtrend line at 1.3750 before the bulls take the pair until the 1.3800 handle and the 1.3860 barrier, changing the current bearish situation to neutral.
To sum up, USDCAD is easing in the short-term and the broader outlook remains bearish as the price is trading within the bearish pattern.