Sample Category Title
EUR/CHF Daily Outlook
Daily Pivots: (S1) 0.9823; (P) 0.9835; (R1) 0.9846; More...
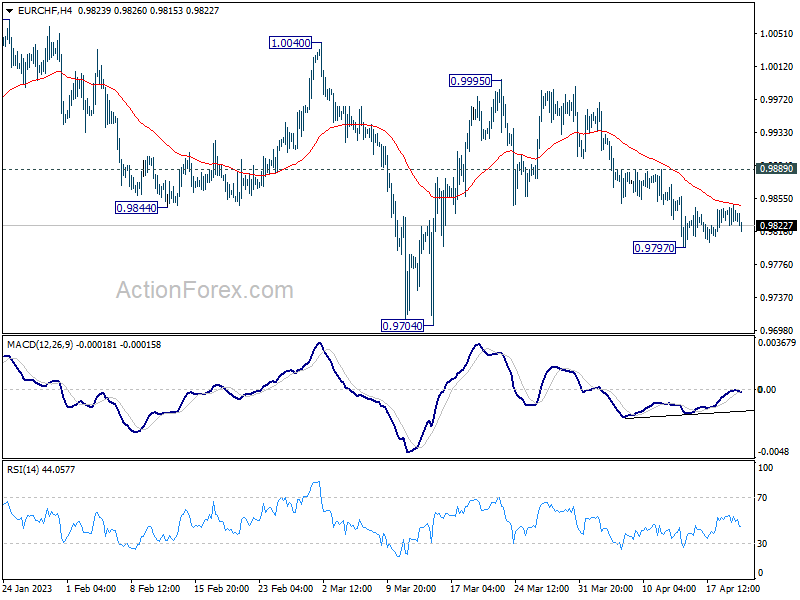
Intraday bias in EUR/CHF remains neutral as consolidation from 0.9797 is still extending. Deeper decline is in favor with 0.9889 minor resistance intact. Break of 0.9797 will target 0.9704 support and possibly below, as whole corrective pattern from 1.0095 extends. On the upside, though, break of 0.9889 minor resistance will turn intraday bias back to the upside for stronger rebound.
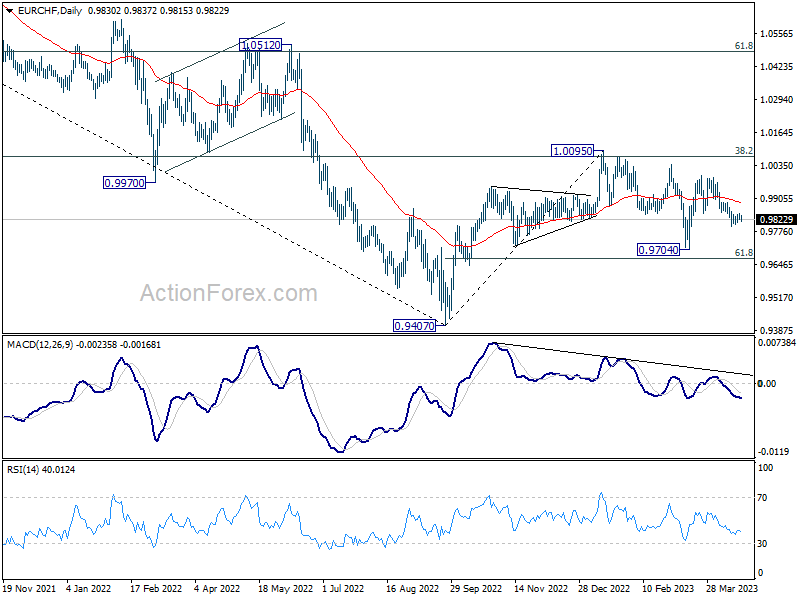
In the bigger picture, prior rejection by 55 W EMA (now at 0.9989) and 38.2% retracement of 1.1149 to 0.9407 at 1.0072 suggests that medium term outlook is staying bearish. That is, down trend from 1.2004 is not completed yet and is in favor to resume through 0.9407 at a later stage. However, decisive break of 1.0095 resistance will raise the chance of bullish trend reversal. Rise from 0.9407 should then target 1.0505 cluster resistance (2020 low at 1.0505, 61.8% retracement of 1.1149 to 0.9407 at 1.1484).
GBPJPY Meets Upper Border of Ascending Channel
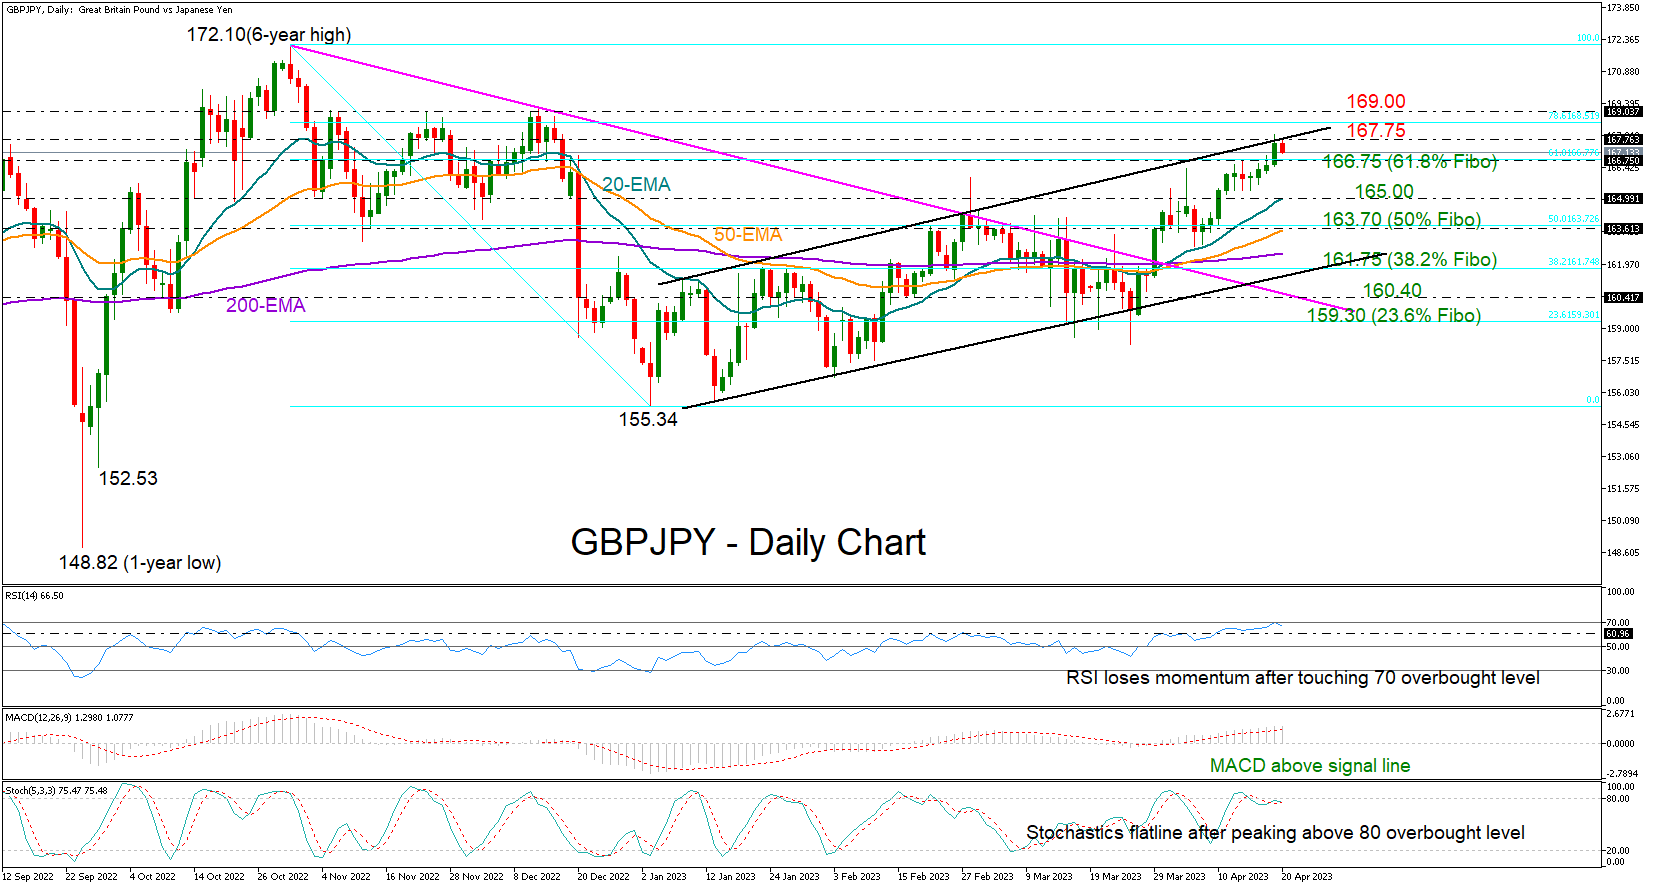
GBPJPY gained extra positive momentum on Wednesday to peak at a five-month high of 167.96 and near the upper boundary of a bullish channel.
The price was trading slightly weaker during Thursday’s European trading hours, increasing speculation that a new bearish wave may soon start within the channel as the RSI and the Stochastic oscillator seem to be losing impetus near their overbought levels.
Sellers, however, may not dominate unless the price eases back below the former nearby resistance of 166.75, which coincides with the 61.8% Fibonacci retracement of the 172.10-155.34 downleg. A decisive close lower could find immediate support around the 20-day exponential moving average (EMA) at 165.00, while slightly lower, the 50-day EMA at 163.72 could be on guard to prevent further declines towards the 200-day EMA and the channel’s lower boundary seen at 161.75. If the latter gives way too, the next stop could be somewhere between the broken resistance trendline from October’s 2022 peak at 160.40 and the 23.6% Fibonacci level of 159.30.
In the positive scenario, where the pair pushes above the channel and beyond 169.00, the spotlight will turn to October’s 2022 high of 172.10. A continuation higher may last till the 2016 top of 175.00.
Summing up, GBPJPY is looking cautiously bullish in the short-term picture. While overbought signals hint at a downside reversal, the price could still power higher if the 166.75 area provides a strong footing under the price.
EUR/USD Daily Outlook
Daily Pivots: (S1) 1.0921; (P) 1.0952; (R1) 1.0988; More...
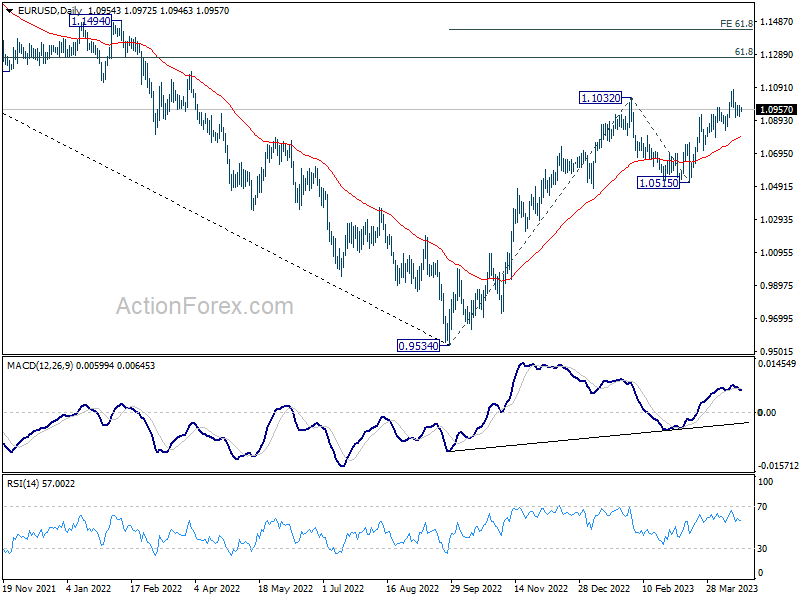
Intraday bias in EUR/USD remains neutral as consolidation from 1.1075 is extending. Outlook remains bullish with 1.0830 support intact. On the upside, break of 1.1075 will will resume larger up trend to 1.1273 fibonacci level. Break there will target 61.8% projection of 0.9534 to 1.1032 from 1.0515 at 1.1441. However, firm break of 1.0830 will confirm short term topping and bring deeper decline to 1.0711 support instead.
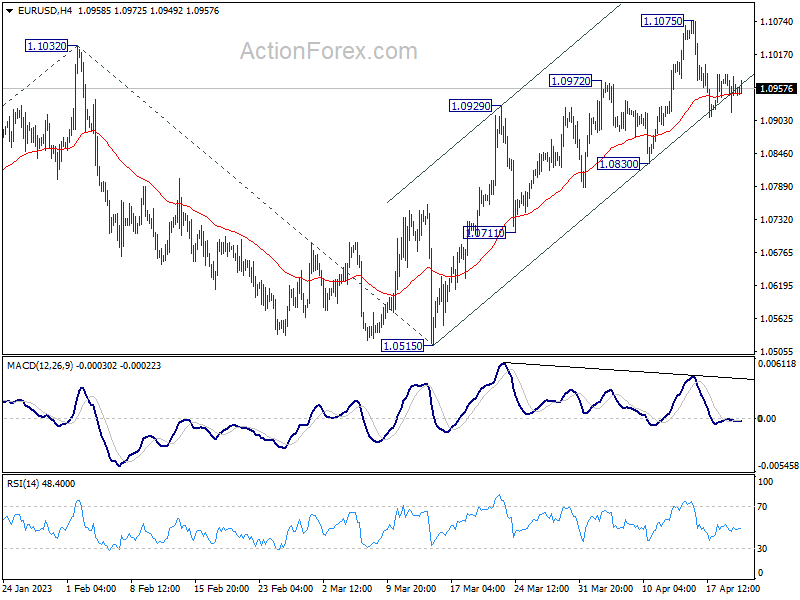
In the bigger picture, rise from 0.9534 (2022 low) is in progress for 61.8% retracement of 1.2348 (2021 high) to 0.9534 at 1.1273. Sustained break there will solidify the case of bullish trend reversal and target 1.2348 resistance next (2021 high). This will now remain the favored case as long as 1.0515 support holds, even in case of deeper pull back.
GBP/USD Daily Outlook
Daily Pivots: (S1) 1.2397; (P) 1.2436; (R1) 1.2478; More...
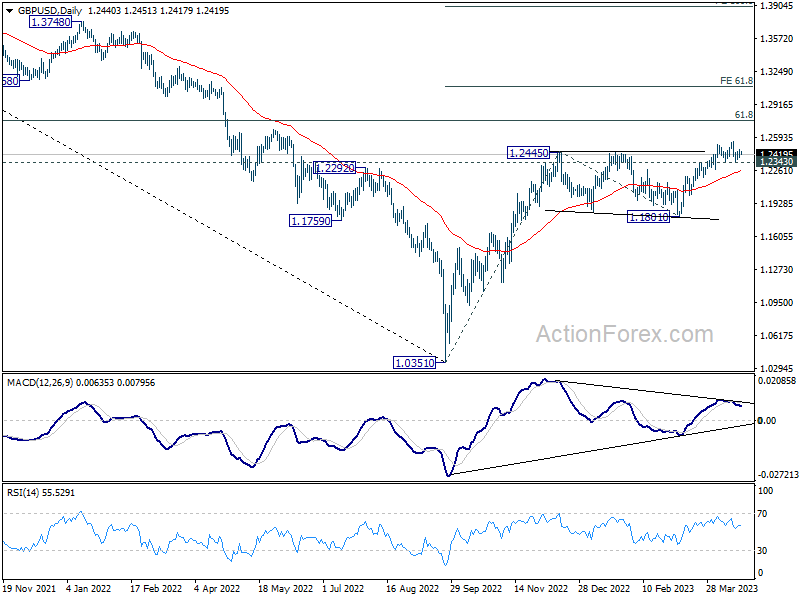
Range trading continues in GBP/USD and intraday bias stays neutral for the moment. Another rise is in favor with 1.2343 support intact. On the upside, above 1.2545 will target 1.2759 fibonacci level first. Firm break there will target 61.8% projection of 1.0351 to 1.2445 from 1.1801 at 1.3095. However, considering bearish divergence condition in 4H MACD, firm break of 1.2343 will confirm short term topping, and turn bias back to the downside for deeper pullback.
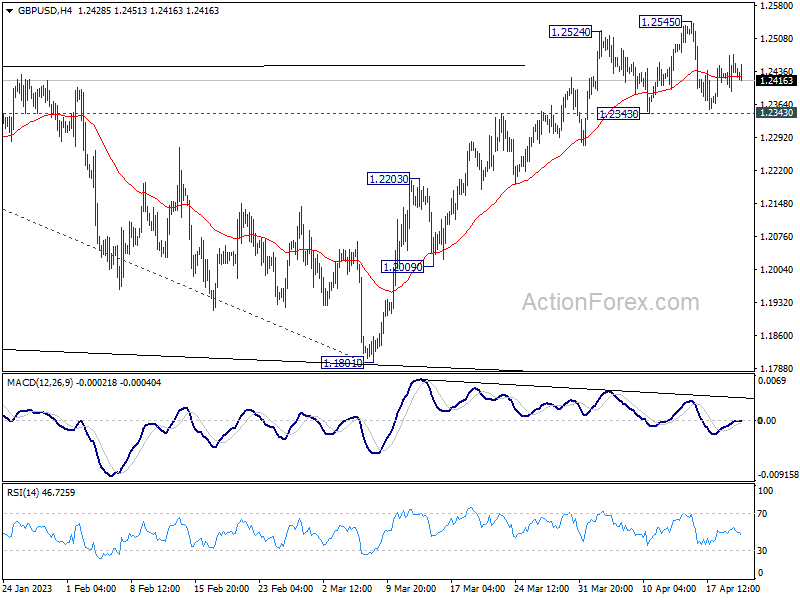
In the bigger picture, the rise from 1.0351 medium term term bottom (2022 low) is in progress for 61.8% retracement of 1.4248 (2021 high) to 1.0351 at 1.2759. Sustained break there will add to the case of long term bullish trend reversal. Further break of 61.8% projection of 1.0351 to 1.2445 from 1.1801 at 1.3095 could prompt upside acceleration to 100% projection at 1.3895. For now, this will remain the favored case as long as 1.1801 support holds, even in case of deep pull back.
USD/CHF Daily Outlook
Daily Pivots: (S1) 0.8955; (P) 0.8979; (R1) 0.9000; More...
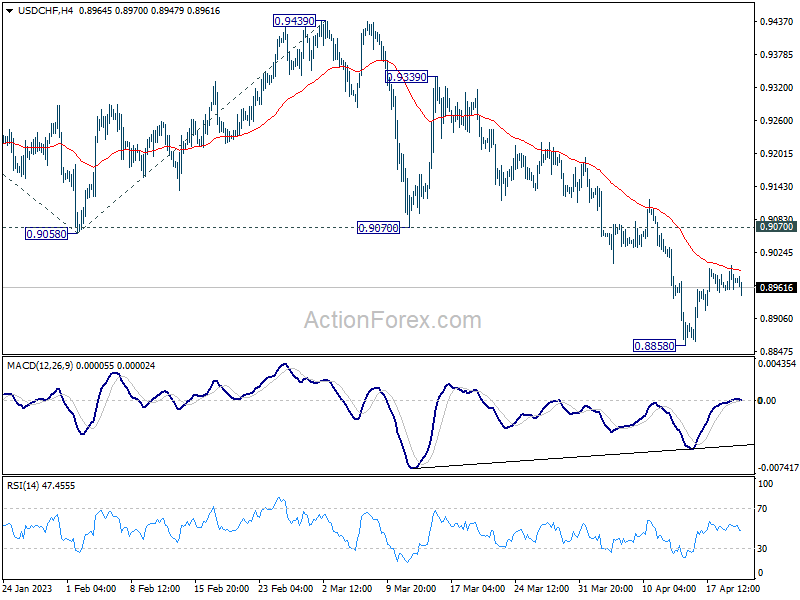
Intraday bias in USD/CHF stays neutral as consolidation from 0.8858 is extending. Another decline cannot be ruled out with 0.9070 support turned resistance intact. On the downside, below 0.8858 will resume the down trend to 61.8% projection of 1.0146 to 0.9058 from 0.9439 at 0.8767, which is close to 0.8756 long term support. Strong support is expected there to bring rebound, at least on first attempt. On the upside, break of 0.9070 support turned resistance will confirm short term bottoming and turn bias back to the upside.
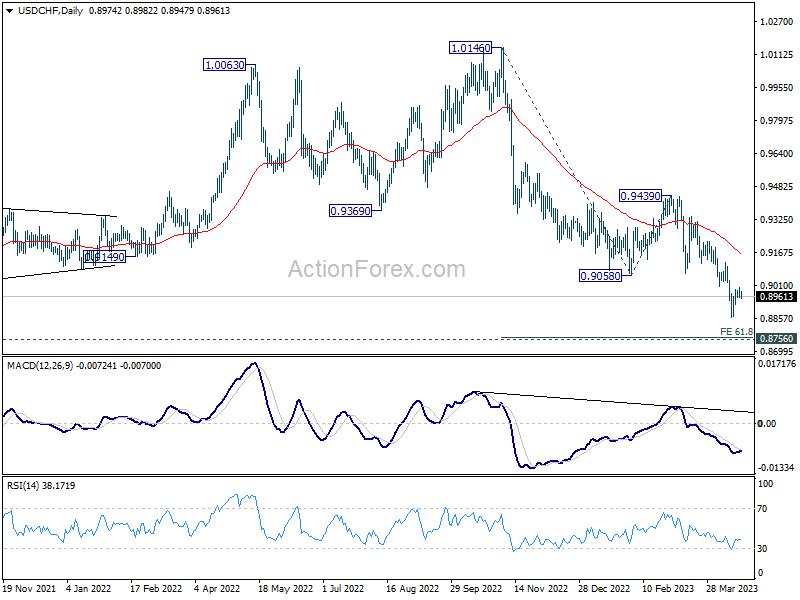
In the bigger picture, fall from 1.1046 (2022 high) is in progress for 0.8756 support (2021 low). But overall, this fall is still seen as a leg in the long term range pattern from 1.0342 (2016 high). So, downside should be contained by 0.8756 to bring reversal. Sustained break of 0.9058 support turned resistance will be the first sign of medium term bottoming. However, decisive break of 0.8756 will carry larger bearish implications.
USD/JPY Daily Outlook
Daily Pivots: (S1) 134.07; (P) 134.60; (R1) 135.24; More...
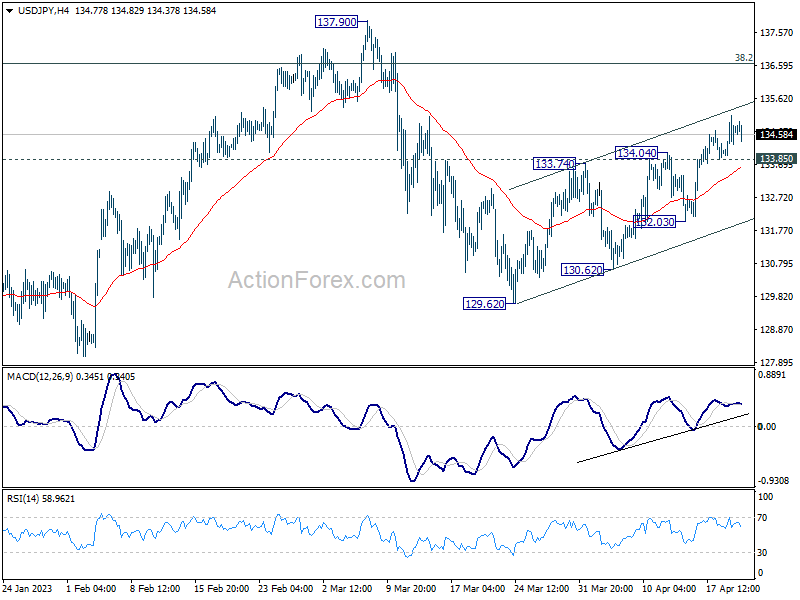
Intraday bias in USD/JPY remains on the upside for the moment. Rally from 129.62 is still in progress and further rise should be seen towards 137.90 resistance. On the downside, below 133.85 minor support will turn intraday bias neutral again. But further rally will remain in favor as long as 132.03 support holds.
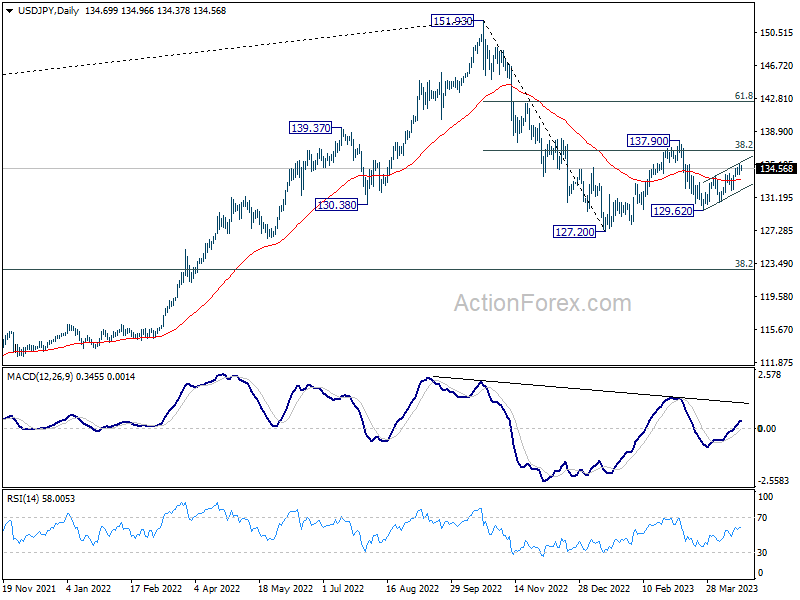
In the bigger picture, corrective pattern from 127.20 might be extending. But after all, down trend from 151.93 is expected to resume at a later stage. Break of 127.20 will resume this down trend and target 61.8% projection of 151.93 to 127.20 from 137.90 at 122.61. This will now be the favored case as long as 137.90 resistance holds.
USD/CAD Daily Outlook
Daily Pivots: (S1) 1.3407; (P) 1.3437; (R1) 1.3489; More....
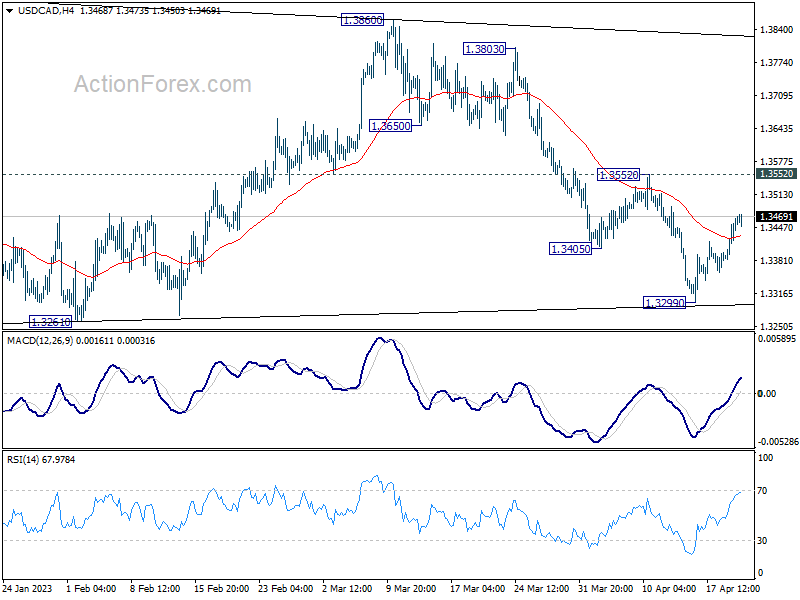
Intraday bias in USD/CAD remains neutral and outlook is unchanged. Another decline cannot be ruled out with 1.3552 resistance intact. But still, fall from 1.3860 is seen as the third leg of the corrective pattern from 1.3976. In case of another decline, down side should be contained by 1.3224/61 support zone to bring rebound. Break of 1.3552 should turn bias back to the upside for stronger rally.
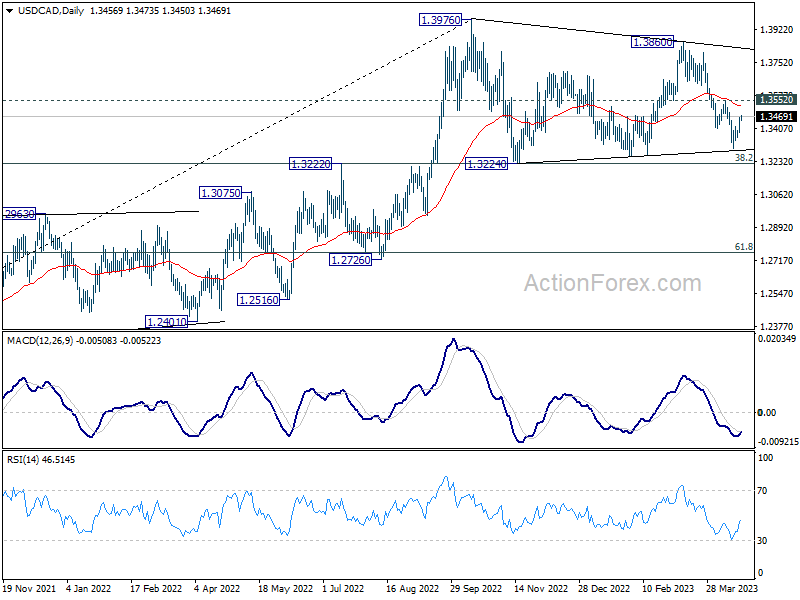
In the bigger picture, the up trend from 1.2005 (2021 low) is still in progress. Break of 1.3976 will confirm resumption and target 61.8% projection of 1.2401 to 1.3976 from 1.3261 at 1.4234. Firm break there will pave the way to long term resistance zone at 1.4667/89 (2016, 2020 highs). On the downside, sustained break of 55 W EMA (now at 1.3282) is needed to confirm medium term topping. Otherwise, outlook will remain bullish even in case of deep pull back.
Gold Flirts With 2,000 and Remains Bullish
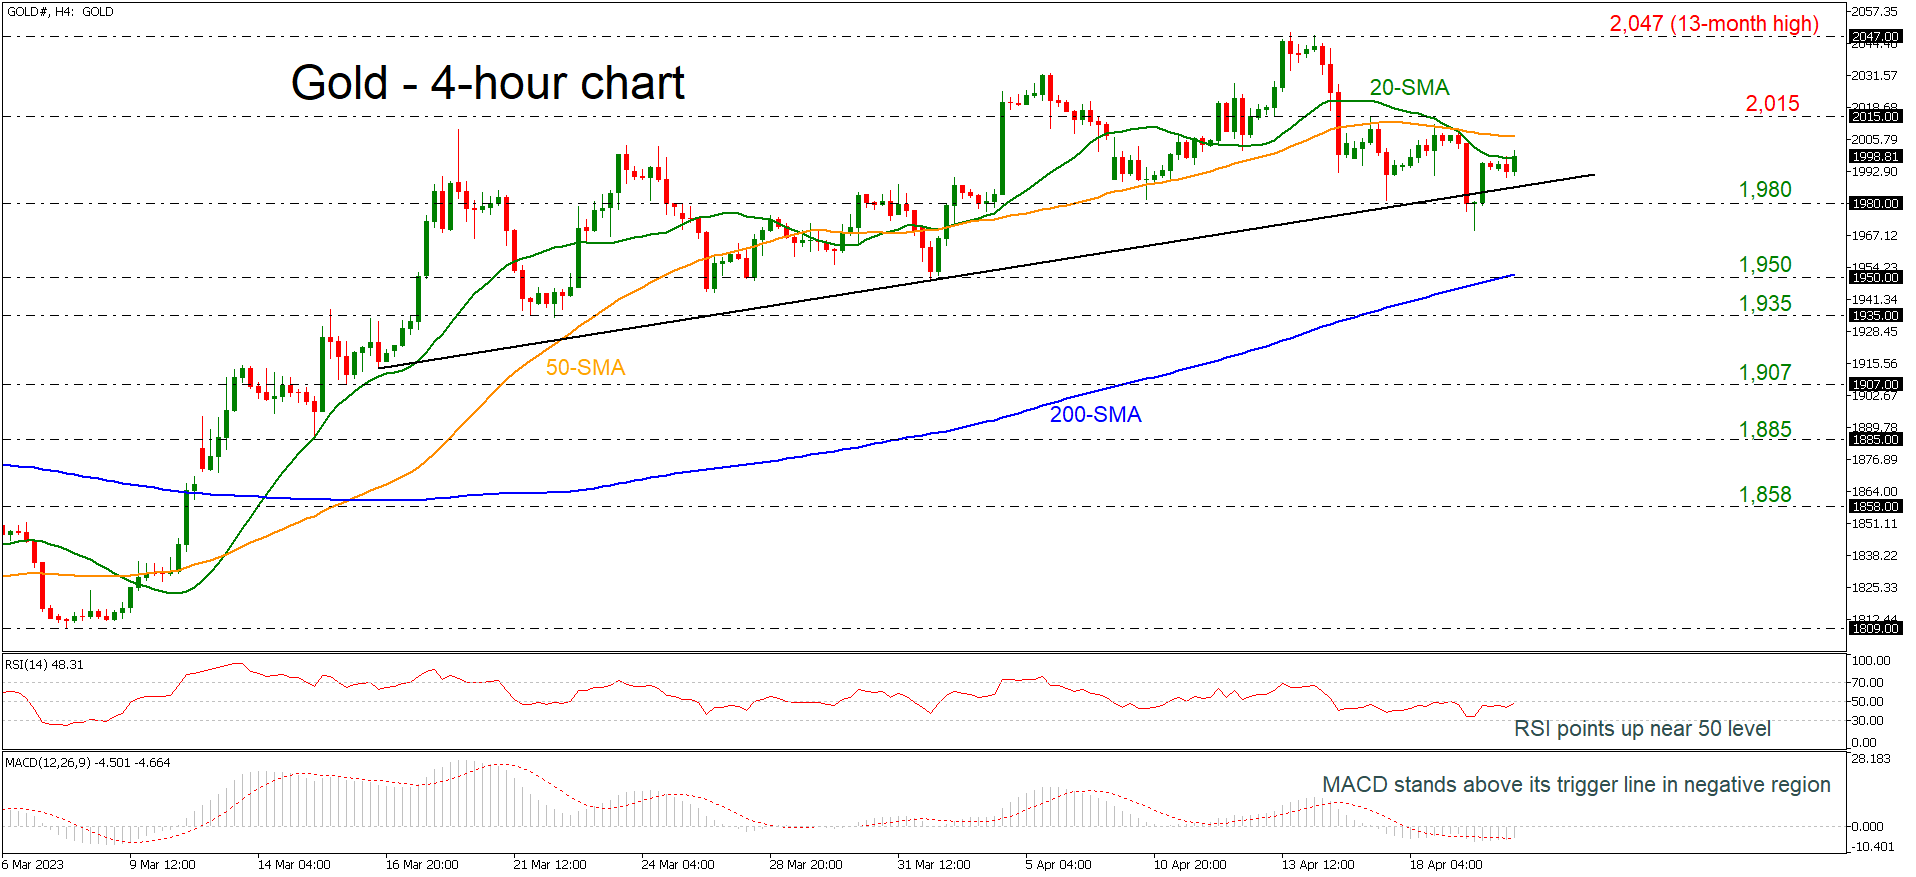
Gold recently rebounded off the short-term uptrend line and near the 1,980 significant support. The price is currently testing the 20-period simple moving average (SMA) near the 2,000 round number with the technical oscillators confirming an advance. The RSI is pointing upwards around the neutral threshold of 50, while the MACD is holding above its trigger line below the zero level.
A move to the upside could see immediate resistance at the 50-period SMA at 2,007 but should the market increase positive momentum above the 2,015 barrier, it would open the way for the 13-month peak of 2,047.
In the wake of negative pressures, the market could meet support at the near-term ascending trend line and the 1,980 barrier. A successful close below this level could see a retest of the previous low of 1,950, which overlaps with the 200-period SMA.
Turning to the medium-term picture, the market seems to be in a bullish mode given that the commodity is trading above the 200-period SMA.
Plenty of Fed and ECB Governors Scheduled to Give Their View
Markets
Yesterday’s higher than expected UK CPI data provided a wake-up call for global markets. Despite rising uncertainty on growth, monetary policy probably needs to be tighter for longer compared to what was hoped for after the financial turmoil last month. Gilts understandably underperformed Bunds and Treasuries with UK yields adding between 13.9 bps (2-y) and 8.5 bps (30-y). US and European yields followed the UK move at a distance. US yields gained up to 4.7 bps (2-y) implying some modest further curve inversion. German yields rose between 6.2 bps (2-y) and 1.9 bp (30-y). The Fed Beige Book preparing the May 02-03 policy meeting suggests that economic activity recently was little changed. Credit conditions have tightened. The rate of price increases appears to be slowing. Labour market/wage indications also showed somewhat of a more balanced picture. In a speech after the close of markets, New York Fed President John Williams basically joined the (anecdotical) evidence from the Beige Book. He admitted that inflation stays too high, but recent data indicate it might continue to slow. He also sees signs of a gradual cooling in demand for labour. Tightening of credit conditions might further weigh on activity/demand. Both the Beige Book and the Williams comments support the case for the Fed to raise the policy rate by 25 bps in May and then taking a wait-and-see approach. The impact of the repositioning in yields on other markets was modest. Equities, both in the US and Europe, finished the day little changed. The dollar rebounded, but gains remained modest and moves easily stayed within recent barriers. DXY closed at 101.97 (from 101.70). EUR/USD finished at 1.0955 (from 1.0972). USD/JPY extended its recent gradual uptrend (134.72 from 134.12). Sterling outperformed the dollar and the euro. Even so, EUR/GBP still closed north of 0.88(07).
Asian equities show modest losses this morning. US yields and the dollar are little changed. Later today, the eco calendar contains EC consumer confidence, US initial jobless claims and the Philly Fed business outlook. There are again plenty of Fed and ECB governors scheduled to give their view ahead of upcoming black-out period. We keep a close eye at the ECB comments to get some insight on the chances of an additional 50 bps step at the May meeting. We dissect Minutes of the ECB meeting in the same way. Markets probably underestimate the odds for such a move. This debate keeps EMU yields, especially at the short end of the curve, well supported. The German 2-y yield nears 3% resistance. The downside in EUR/USD at 1.0831 is currently well protected.
News and views
New Zealand inflation decelerated from 1.4% q/q in 2022Q4 to 1.2% in the first quarter of this year, going against expectations for a quickening to 1.5%. The yearly figure as a result eased more than anticipated, from 7.2% to 6.7%. The Reserve Bank of New Zealand in its February statement projected 7.3%. Food (3.7% q/q) and tobacco (4.1% q/q) were key drivers while housing & household utilities eased to a still above-average 1% q/q. Transportation costs weighed heavily (-1.3% q/q) as energy/oil prices dropped considerably. CPI excluding food, household energy and vehicle fuels increased 6.5% y/y, only marginally lower than the 6.7% 2022Q4 while non-tradeable inflation (a proxy for services inflation) quickened to 1.7% q/q. The RBNZ earlier this month hiked by 50 bps to 5.25% and said the direction of future monetary policy will be determined by the course of core inflation. New Zealand swap rates tumble between 8.9 and 12 bps with the front end of the curve outperforming. Market expectations for the terminal rate have lowered about 10 bps to 5.50%, implying one more 25 bps rate hike at either the May or July meeting. The kiwi dollar underperforms peers this morning. USD/NZD eases from 0.62 to 0.6157 currently.
The EU is preparing an emergency ban on Ukrainian grain imports to the four member states bordering Ukraine plus Bulgaria, the Financial Times reported. The move seeks to regularize unilateral moves by the likes of Poland and Hungary. They barred imports that were meant to but couldn’t be re-exported because of truck and train shortages, pressuring local prices and farmers. Problems arose when the EU following the Russian invasion introduced a wartime free-trade regime for agricultural products. Originally planned to end in June this year, the EU wants to extend it. The renewed version is likely to include stronger provisions that allow the bloc to take measures to protects its own market more rapidly.
Gold Consolidates Gains
GBP/USD attempts to rebound
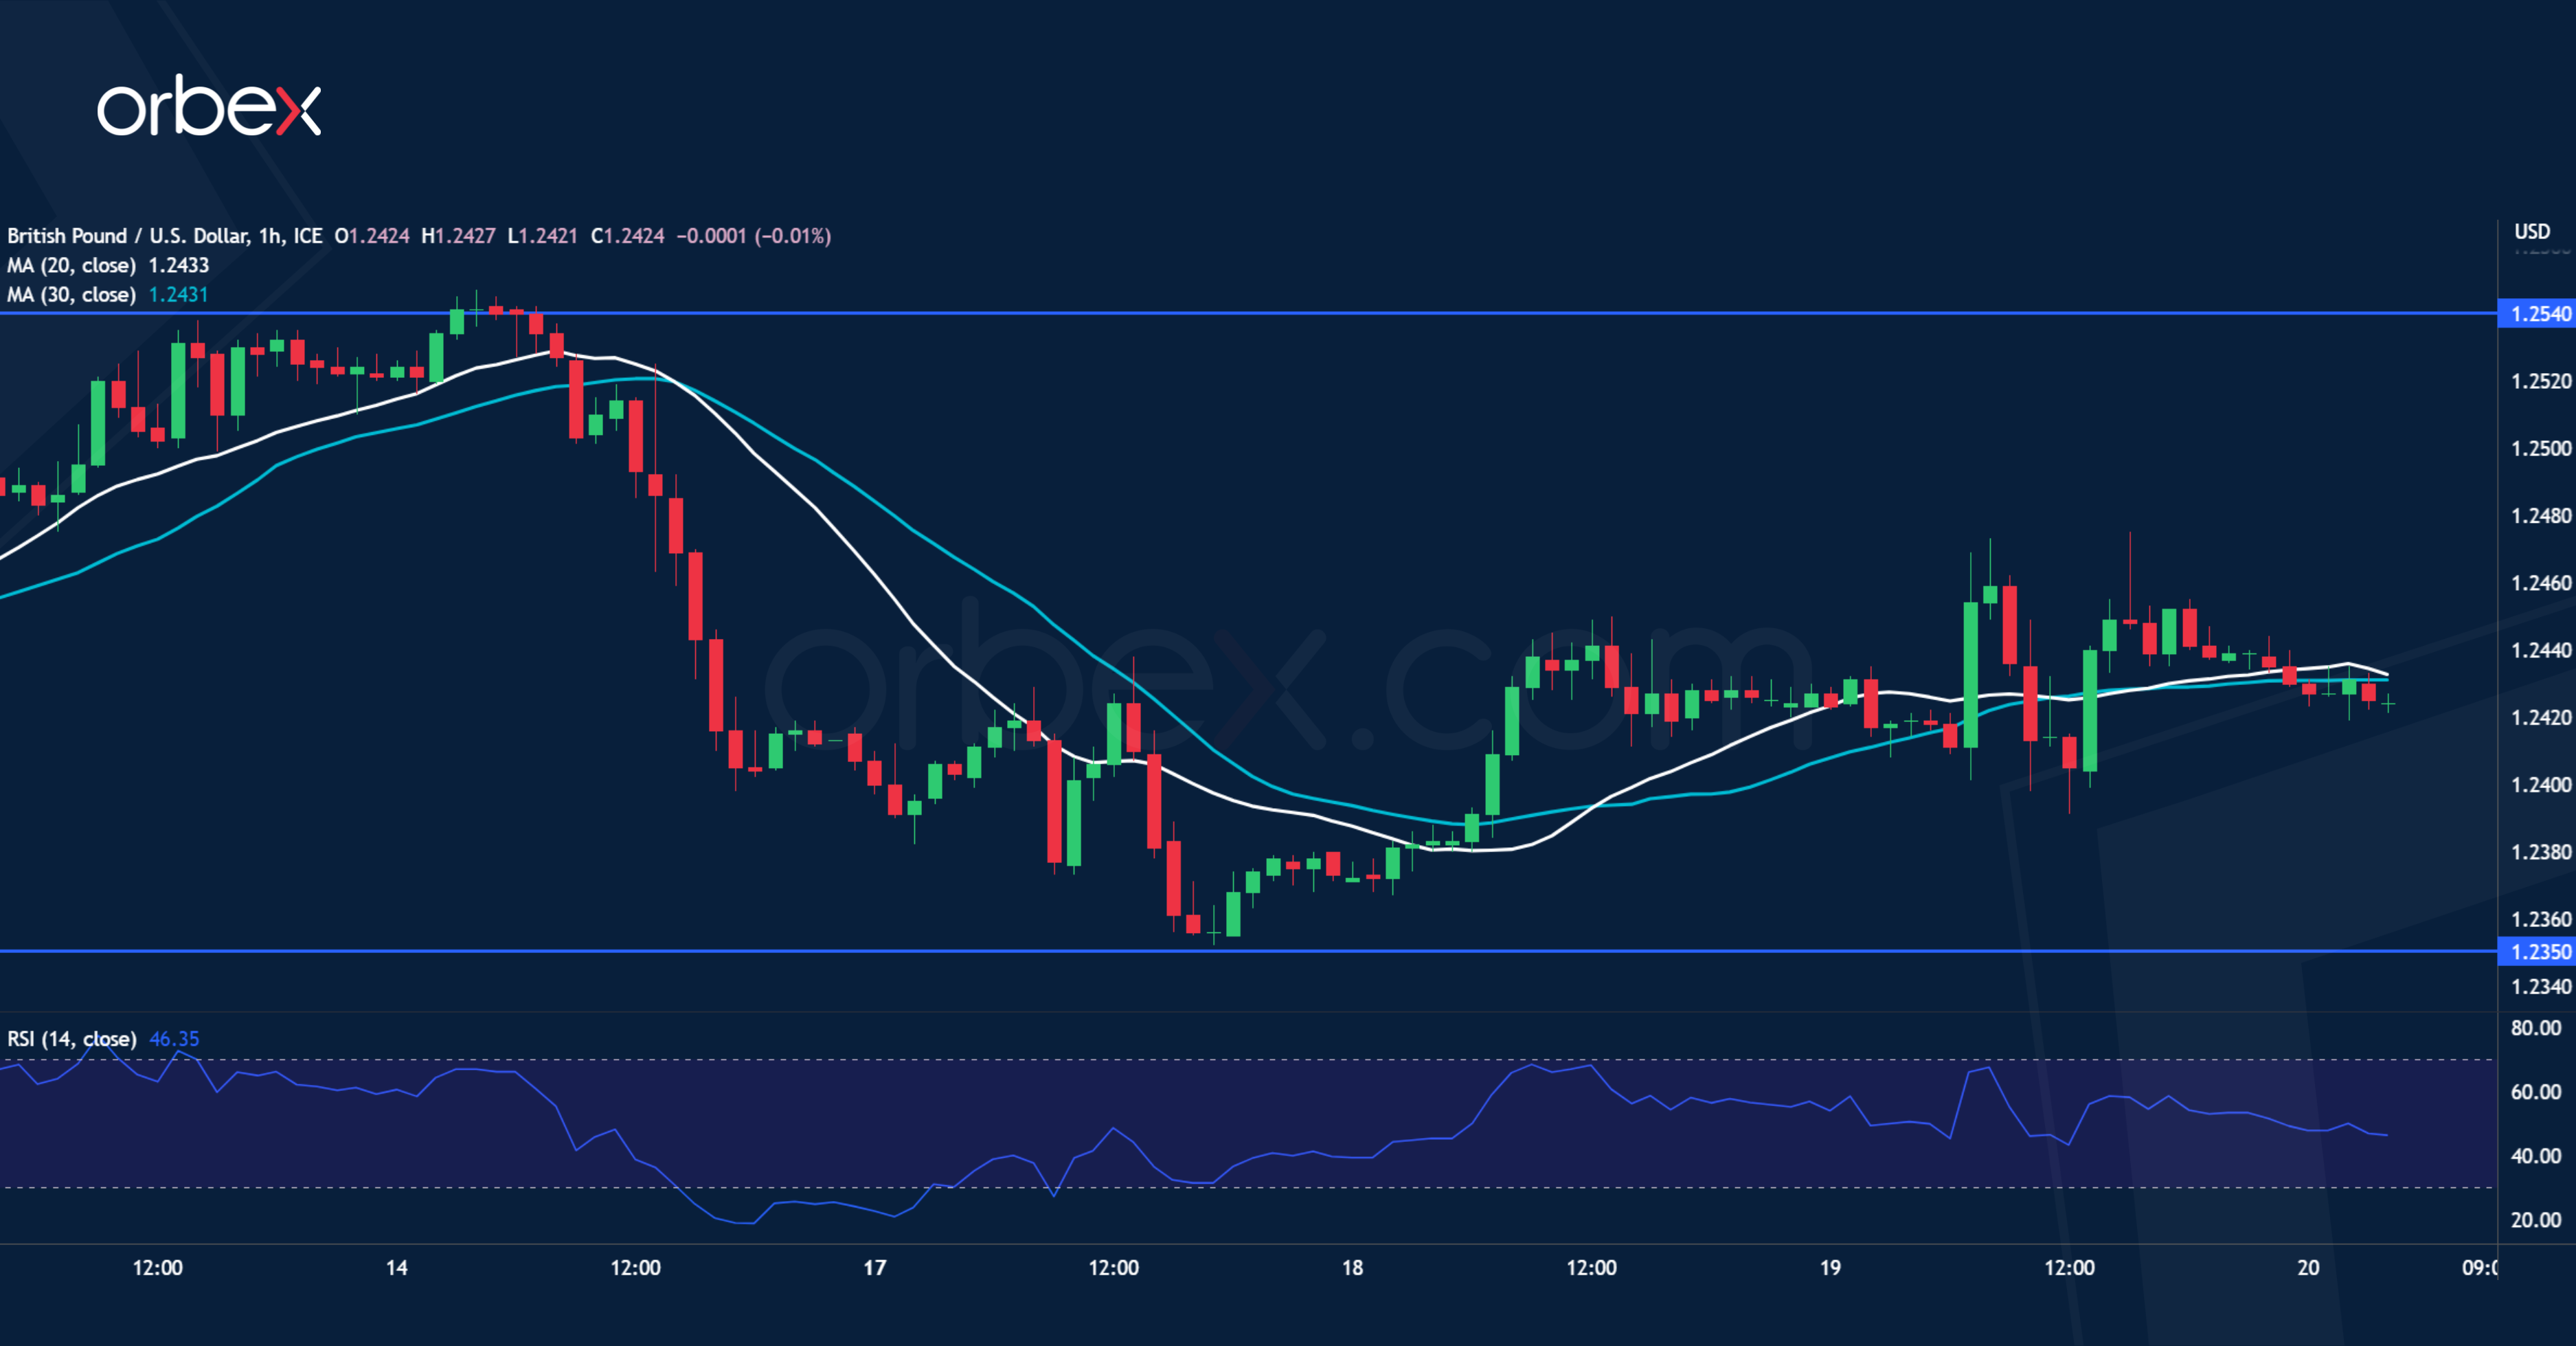
Cable inched higher as Britain’s inflation remained double digit. The latest retracement has found support on the 20-day SMA (1.2350) and a bounce above the immediate resistance of 1.2340 eased some pressure. Sentiment remains positive from the daily chart’s perspective and the bulls may see the short-term consolidation as an opportunity to join the uptrend. A break above the recent high of 1.2540 may convince more conservative traders to jump in. On the downside, 1.2270 would be a second support level.
XAU/USD seeks support
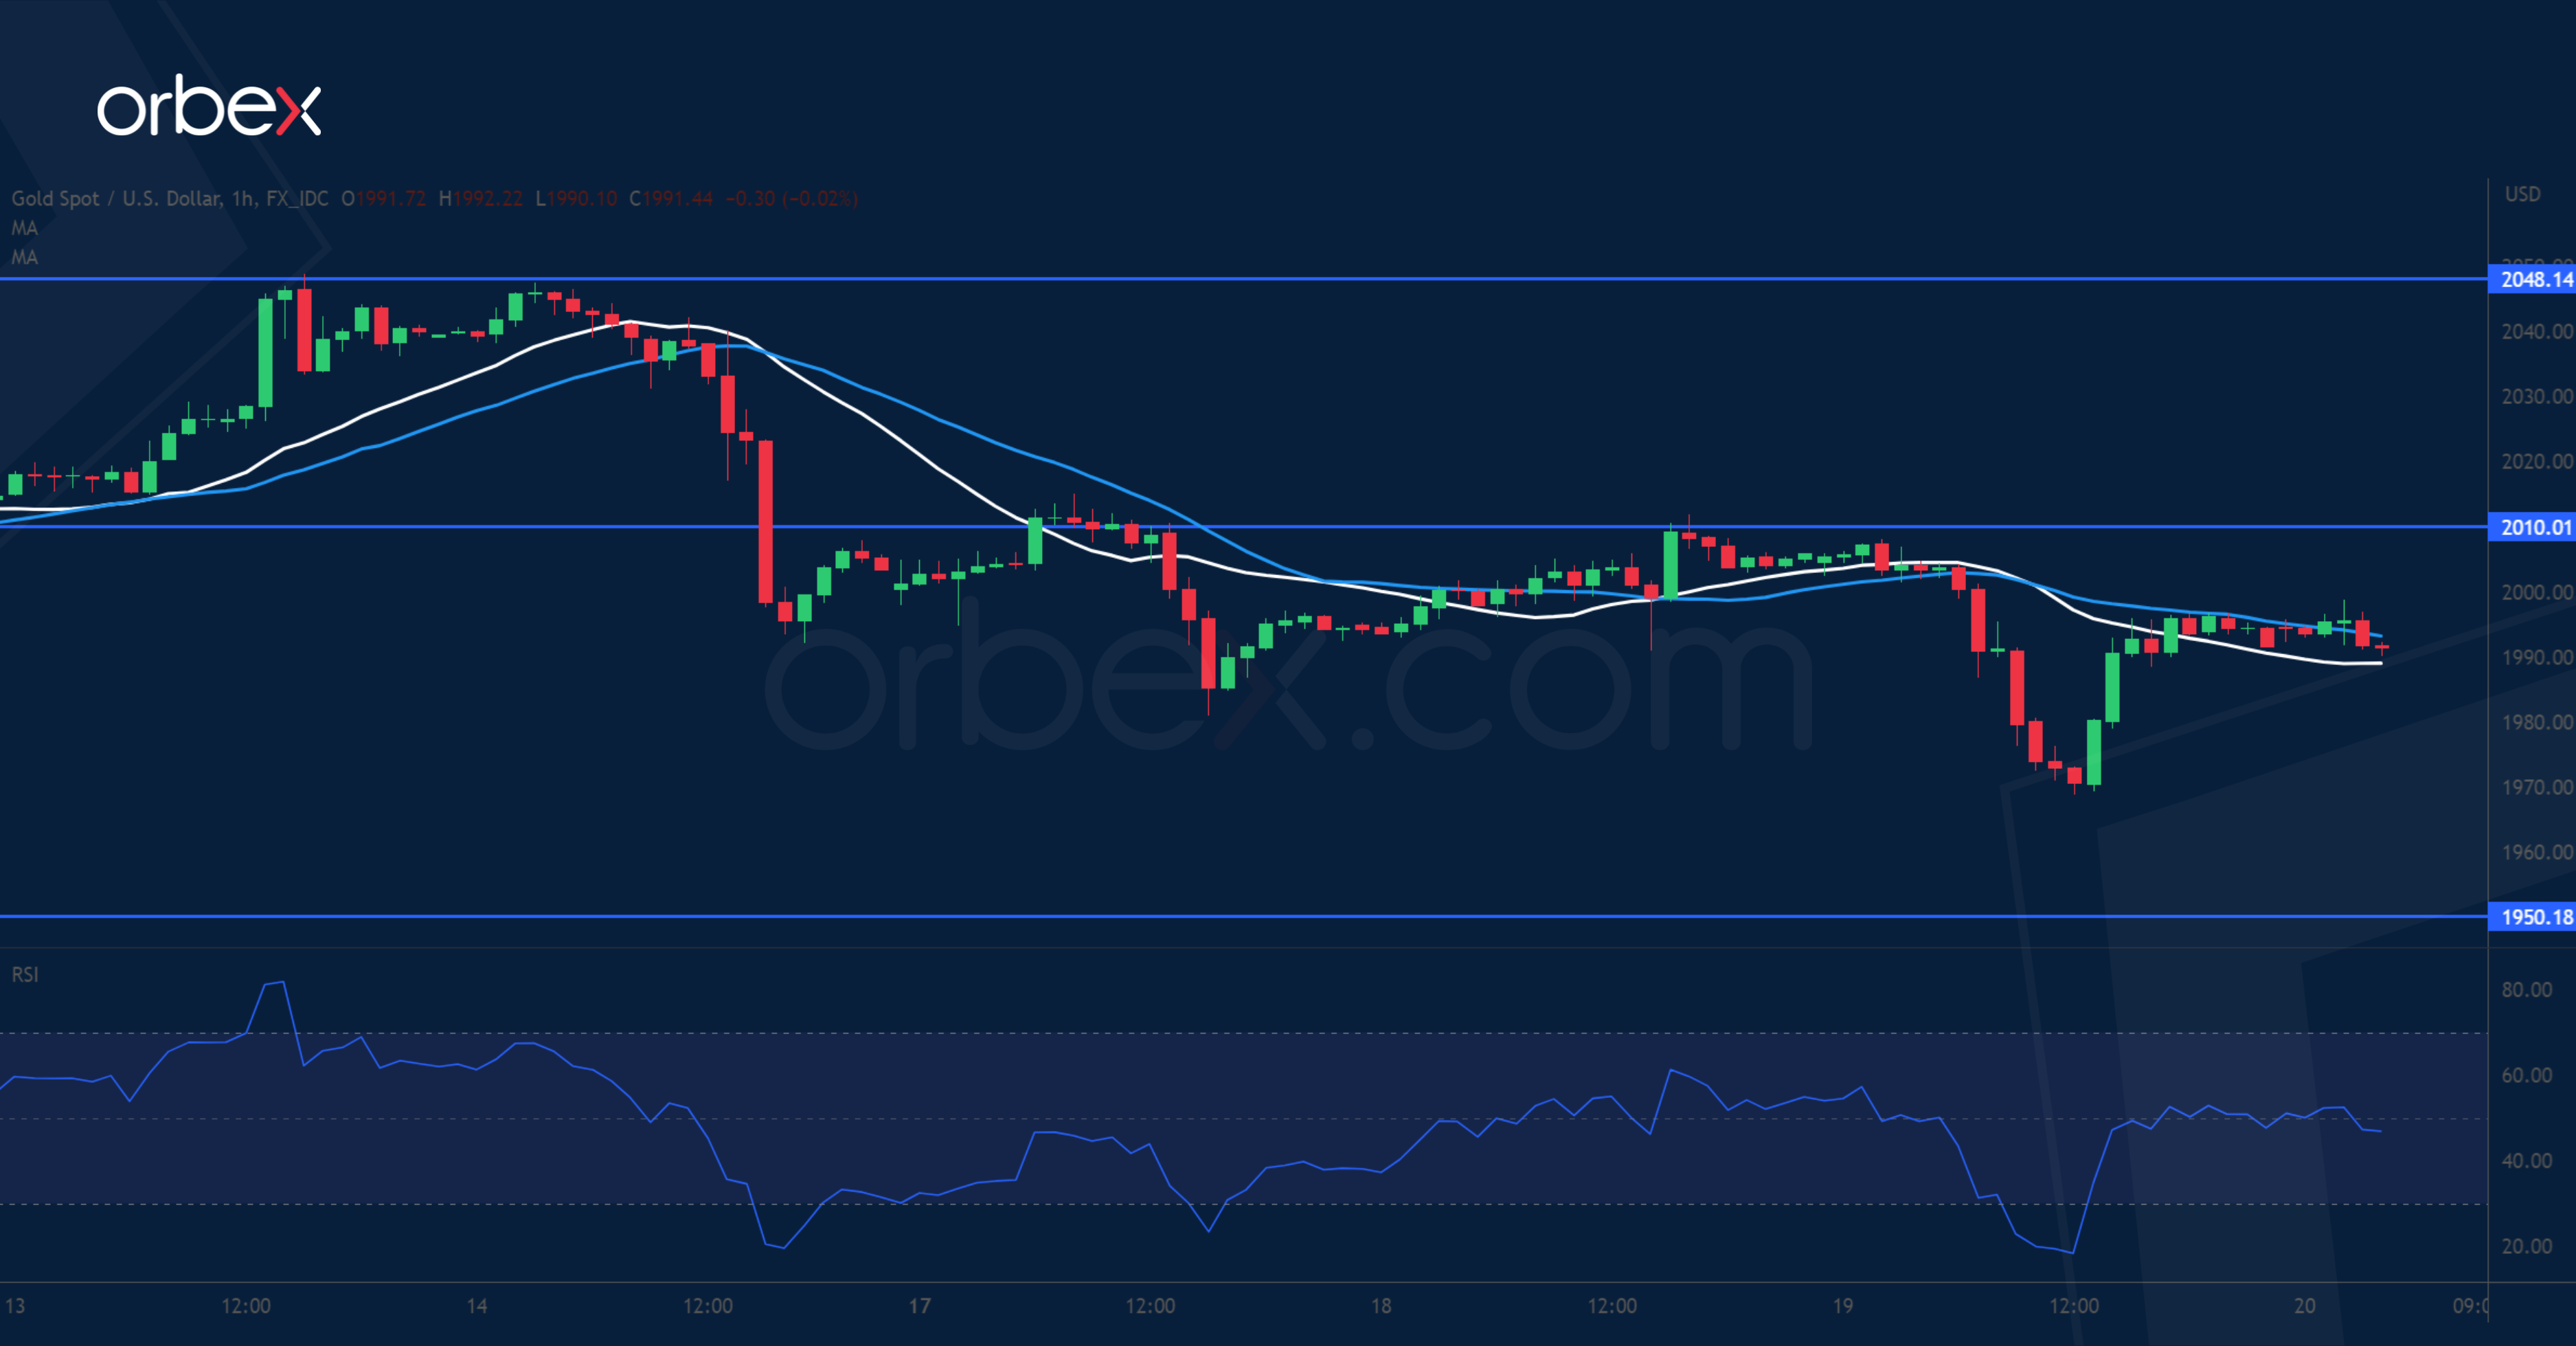
Gold tumbles as the dollar index and Treasury yields recover. Following the RSI’s overbought double top on the daily chart, the price turned south at 2048, falling short of the all-time high at 2070. The pullback would give the metal some breathing room after a month-long rally. Successive breaks below the psychological level of 2000 then 1980 led to the liquidation of leveraged short-term positions. The demand zone around 1950 is critical to see buyers’ commitment. 2010 is the first hurdle should the price bounces back.
US Oil drifts lower
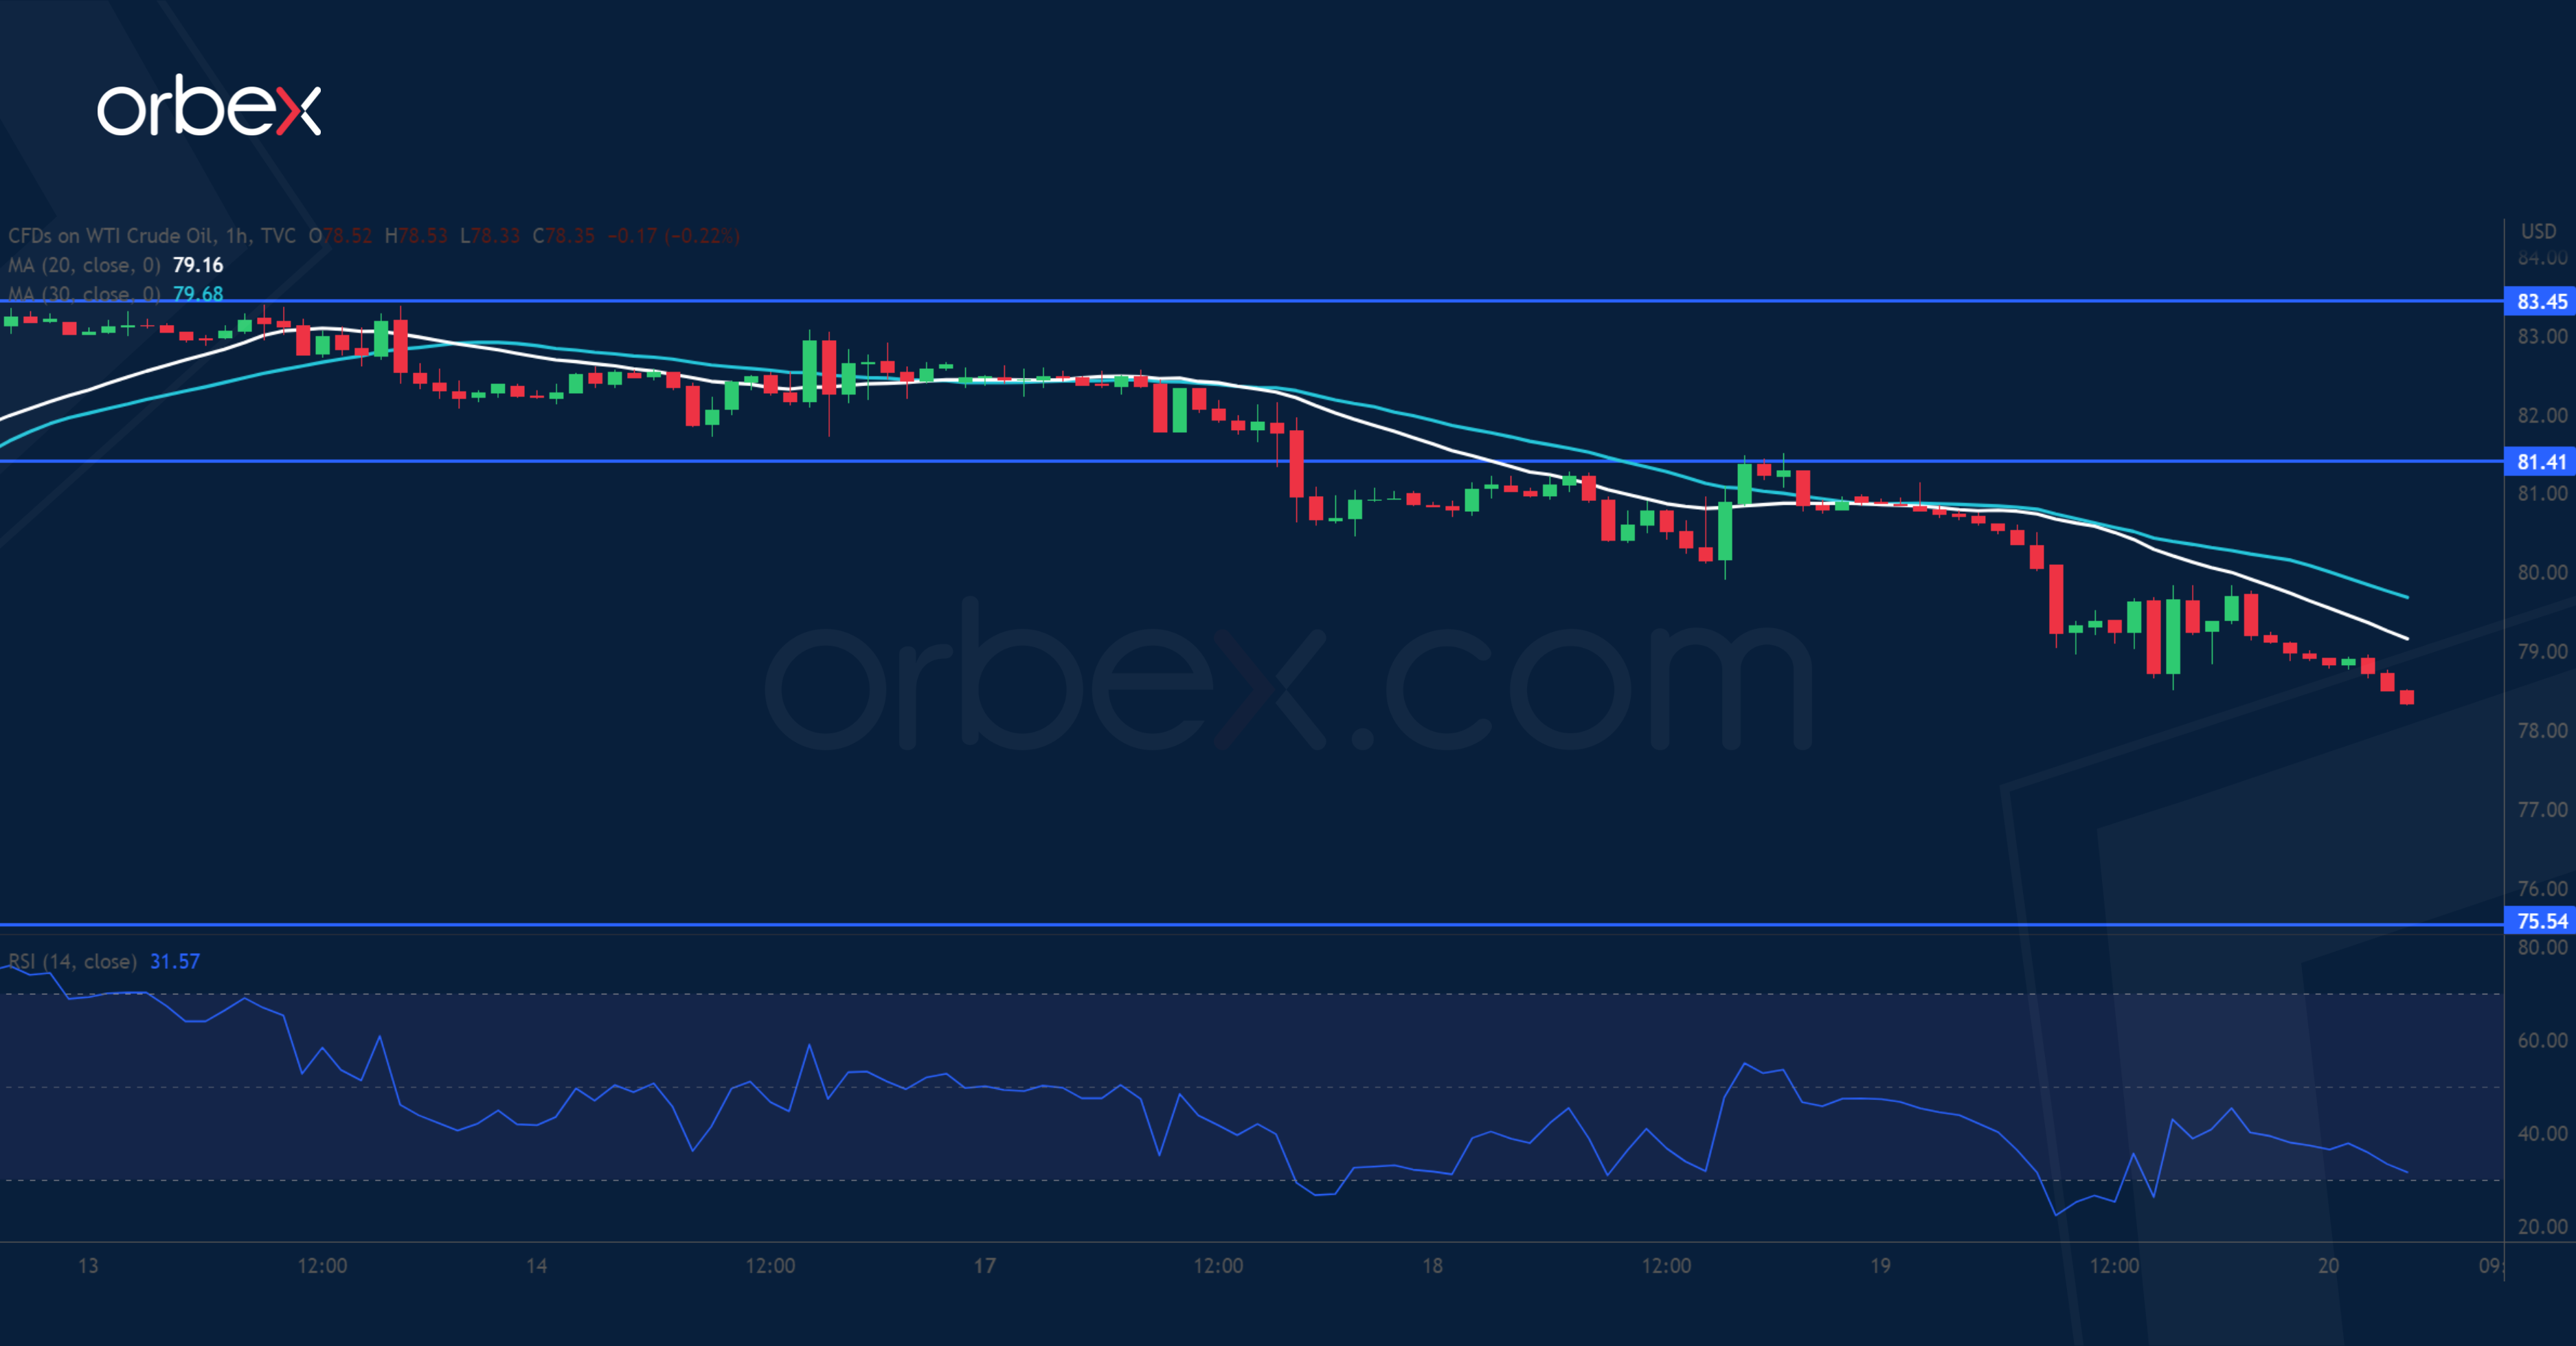
WTI softens on subdued risk appetite across markets. The bulls have struggled to hold the psychological level of 80.00 near the base of a follow-through rally from last week. As the upward momentum dies down, bids come lower as short-term traders take their chips off the table. The price might be vulnerable to a broader sell-off after it broke below the swing low of 79.30, which would fill the gap from early April. 75.50 next to the daily SMAs’ bullish cross would be a key support. 81.40 is the closest resistance ahead.