Sample Category Title
Yen Awaits Japan’s Inflation as BoJ Meeting Approaches
Investors will be exploring Japan’s CPI inflation report during Friday’s Asian session in order to get clarity on whether inflation is persisting enough to provoke a tweak in the super accommodative monetary policy. Forecasts are for steady growth after February’s downturn from multi-decade highs, though investors will be on alert for any surprises, which could signal changes in monetary guidance, generating fresh volatility in the yen.
BoJ to stay on course but not for long
Headline inflation rose at its fastest pace since the end of 1990 in January, while the core measure, which excludes food and energy prices, hit the highest since the 1980s, fueling speculation that the Bank of Japan (BoJ) could soon end its ultra-easy monetary strategy. Despite investors debating over a potential hawkish policy tweak, the BoJ has been bravely dialling down expectations for a hawkish rotation even if its major counterparts are well ahead in the tightening cycle.
The departure of former BoJ governor Haruhiko Kuroda, who was the first to kick off the aggressive monetary easing strategy a decade ago, did not alter the central bank’s language. Instead, his successor Kazuo Ueda affirmed that current ultra-easy settings are appropriate in the meantime as a sustained achievement of the 2.0% inflation target has yet to be achieved. Neither has nominal wage growth climbed sustainably above 3.0% as the central bank desires, although spring wage talks with unions and businesses promised increases of around 5.0% from April onwards, with real wage growth remaining negative at -2.2% y/y at the moment.
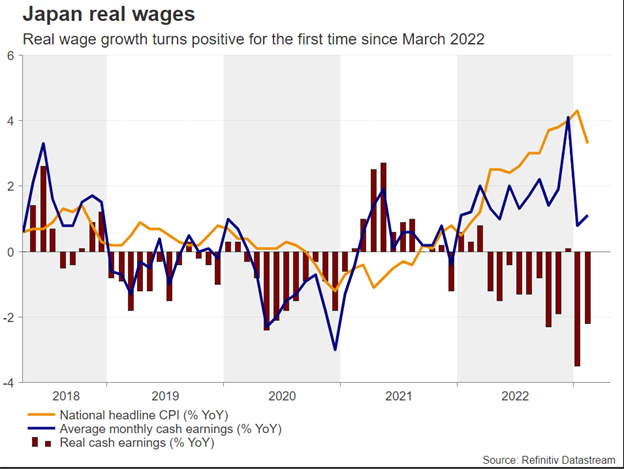
As a result, market pricing for a rate hike at next week’s policy meeting and till September remains zero. On the other hand, commentary on the controversial yield curve control, which aims to keep the 10-year bond yield around 0.5%, has been more ambiguous, with polls showing that scrapping yield curve control is the second most popular choice among investors after a tweak in policy guidance.
That probably comes as evidence from previous months showed that even under massive policy easing domestically in Japan, yields can still go higher if foreign central banks are raising rates. Perhaps it’s a tool worth keeping for now as GDP growth figures are not that great in Japan and global recession risks loom. However, with major peers such as the Fed unwilling to reverse monetary policy in the face of inflation, the BoJ may have a tough time in sustaining the cap through massive bond buying, with the domestic currency also suffering from negative side effects.
CPI inflation
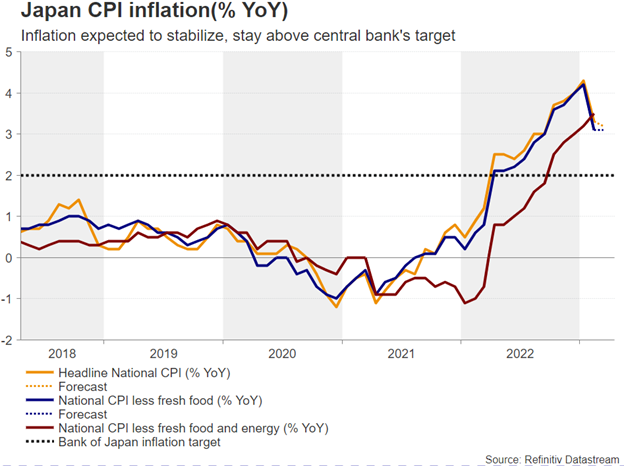
On Friday it would be interesting to see if Japan’s headline CPI inflation inched lower to 3.2% y/y from 3.3% previously and 4.3% y/y in February without the central bank’s aid as forecasts suggest. The core measure, which excludes volatile food and energy prices, is expected to stabilize at 3.1% y/y. If that proves to be the case or the figures head lower, pressure for a policy change may soften. Alternatively, a new inflation upturn before businesses raise wages as pledged could increase criticism on the current accommodative settings during the April 28 gathering.
USD/JPY
As regards the market reaction, a notable upside deviation from forecasts could help the yen regain some lost ground. Looking at USD/JPY, the 200-day simple moving average (SMA) could immediately come under the spotlight at 133.75. Breaking that base, the price may pause near 132.80 before heading for the key support trendline seen at 131.80.
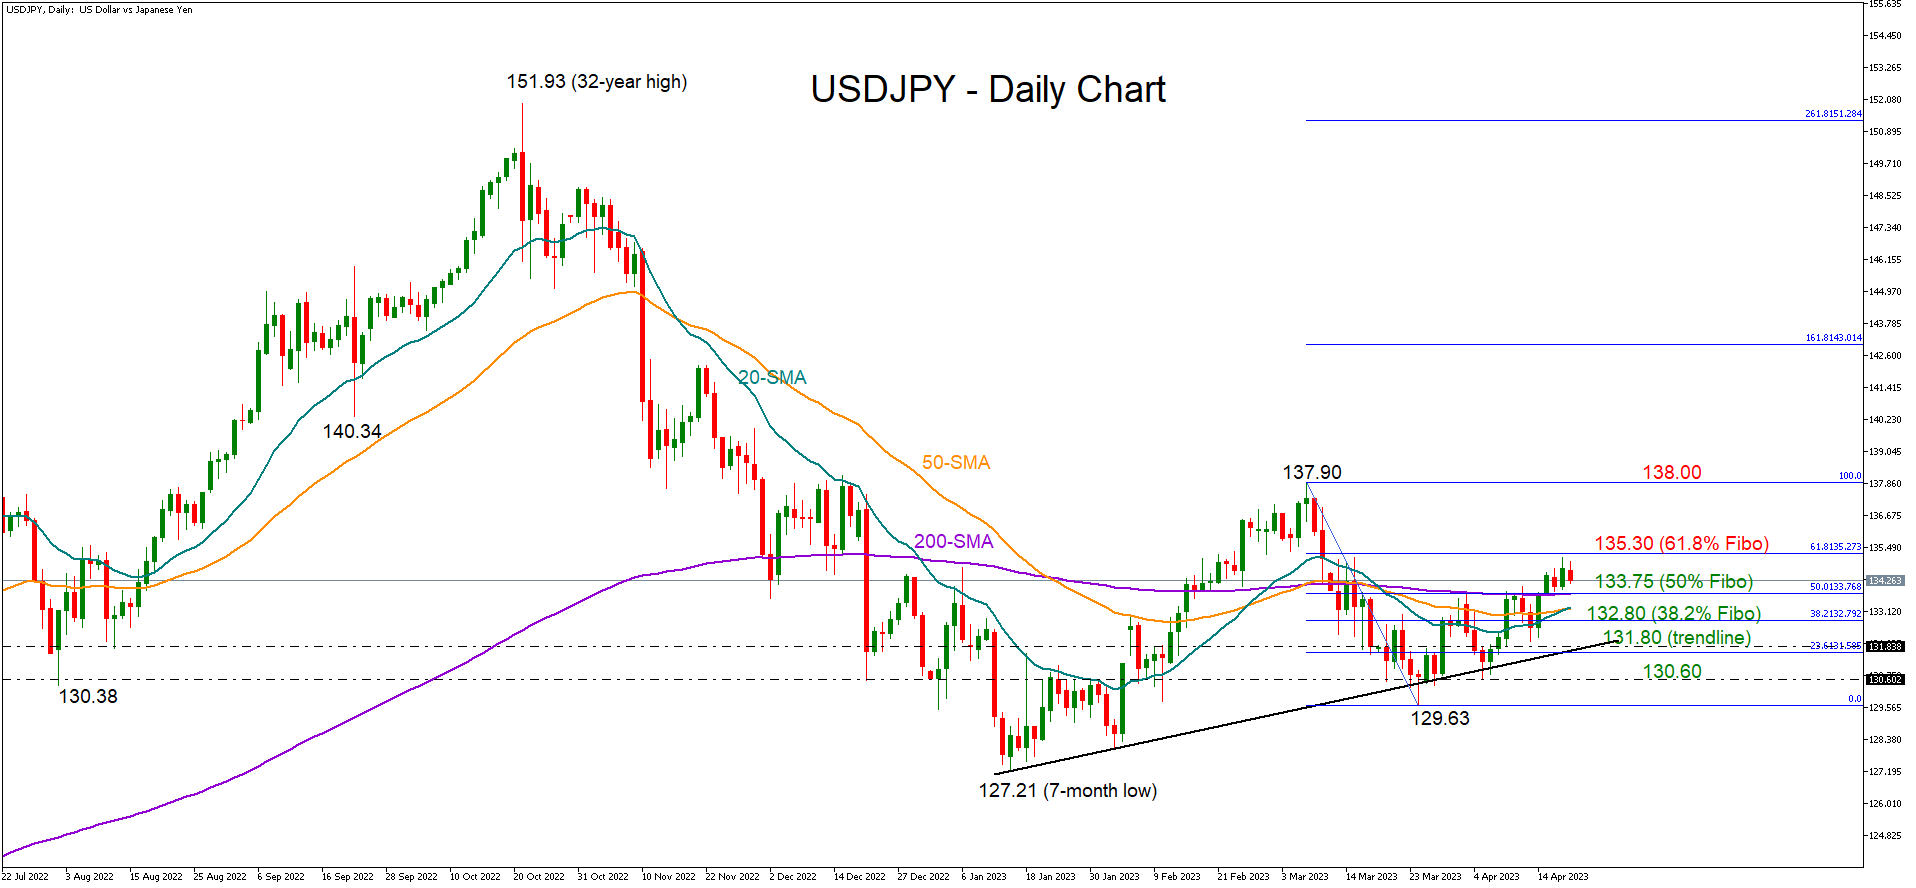
Alternatively, weaker-than-expected readings may back “Abenomics” policies, which many members of the ruling LDP party are still endorsing. The spread between the 10-year US and Japan government bond yields could maintain its latest upturn, helping the dollar to breach the 135.30 resistance and rally towards the March high of 137.90.
USD/JPY: Weaker Near Term Tone on Downbeat US Data
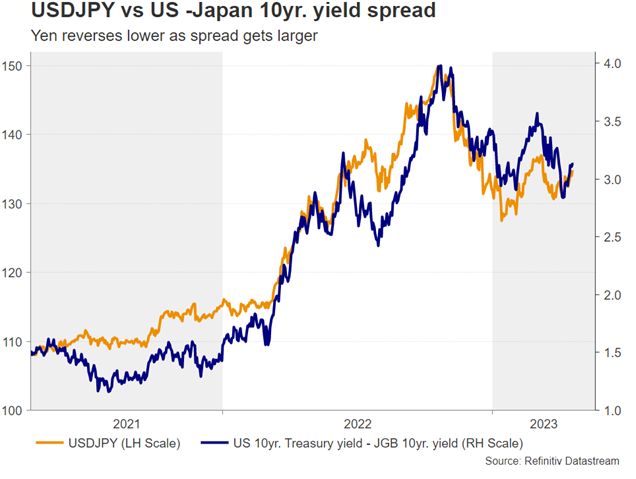
The USDJPY started to lose traction after repeated failure to clearly break through pivotal Fibo resistance at 134.75 (61.8% of 137.90/129.64 descend).
Fresh weakness was sparked by stronger than expected rise in US weekly jobless claims and significantly weaker Philly Fed reports in April, which add to already gloomy outlook. The price returned into thick daily Ichimoku cloud (cloud top lays at 134.45) but remains within a congestion which extends into fourth straight day, keeping intact larger bulls off 129.64 (Mar 24 low).
Daily studies show stochastic emerging from overbought territory and fading bullish momentum, generating initial signals of pullback, which sees a minimum requirement for confirmation on break of 133.70 zone (congestion base, reinforced by rising 10DMA).
Loss of 133.70 supports is also needed to signal a bull-trap above 134.75 Fibo level and open way for deeper pullback which will be seen as a healthy correction while extended dips hold above daily cloud base (132.56). Otherwise, near-term action would be paused for extended consolidation before bulls resume, with sustained break of 134.75/135.13 pivots (Fibo / Apr 19 high to spark fresh acceleration higher.
Res: 134.45; 134.75; 135.13; 135.95.
Sup: 133.70; 132.99; 132.56; 132.58.
Sunset Market Commentary
Markets
Today’s ECB March meeting minutes gave a glimpse into the central bank’s analysis of the financial turbulence in the wake of the Silicon Valley Bank collapse. Delivering on the pre-announced 50 bps hike was important to instill confidence and avoid creating further uncertainty in financial markets, MPC members agreed. The ECB acknowledged the risk of a potential banking crisis. But given that the next policy meeting wasn’t scheduled before May, the governing council would have time to asses the effect of any potential tightening in financing conditions on inflation dynamics in between. In general though, it was agreed that while keeping a close eye on financial stability was important, price stability (i.e. bringing inflation back to target) should be reiterated as being the primary objective and more tightening would follow if the March projections materialize. Members also said that the message should be conveyed that if the market turmoil hadn’t occurred, the council would have put forward more (unconditional) rate hikes. With the benefit of hindsight, it looks that the ECB was right not to get carried away by the banking turmoil. As the dust settled, several governors in the meantime stressed the need for further tightening with most of them explicitly keeping the option of either a 25 of 50 bps rate hike firmly on the table. Dutch governor Klaas Knot was the latest today to do so. He said that the ECB may need to raise interest rates in June and July following a May rate hike. In a (in our view too) conservative scenario of a 25 bps May hike, that would bring the deposit rate to 3.75%. “It’s too early to talk about a pause”, he said. That’s an option only when underlying inflation has shown a convincing reversal. Talking about the size, he said April inflation data is going to be key. This is scheduled for release two days before the May 4 policy meeting, together with other crucial input coming from the Bank Lending Survey. ECB president Lagarde in a speech today added to the debate, saying that “there’s still a little way to go on the path”, citing too high inflation compared to the 2% target.
In other news, US data today undershot expectations. US weekly jobless claims came in at 245k, slightly more than the 240k expected. The Philly Fed business outlook however missed a -19.3 consensus considerably. The indicator fell from -23.2 to -31.3, mainly driven by a drop in prices paid (from 23.5 to 8.2). The other components and the six month ahead gauge improved, though remained in contraction territory. Core bond yields nevertheless extended an earlier decline after the release. US yields ease between 4.2-7.4 bps with the front outperforming. German yields in a similar curve shift decline 3.2-5.6 bps. The dollar is trading with a minor disadvantage against most peers, including the euro. EUR/USD ekes out a tiny gain but remains sub 1.10. The trade-weighted index eases marginally to 101.82. Sterling is going nowhere. EUR/GBP keeps steady above 0.88 with a triangle slowly but steadily closing as it awaits the next UK data (retail sales tomorrow). Stocks in Europe and the US loses about half a percent or more.
News & Views
Belgian consumer confidence rose from -9 to -6 in April, the highest level since February 2022 and slightly above its long-term average. Consumers expressed slightly more optimism about expected macroeconomic developments in Belgium (-15 from -16) and, to a greater extent, have revised downwards their fears of a rise in unemployment over the next twelve months (14 from 19). On a personal level, households are more confident about their future financial situation (6 from 4) and have increased their saving intentions (-6 from -9). April Belgian business confidence will be released next week Monday April 24.
The Belgian National Accounts Institute (NAI) released data of government deficit and public debt in the context of the excessive deficit procedure. For 2022, the general government budget balance was -3.9% of GDP, compared with -5.5% in 2021. The improvement in the budget balance was attributable to the strong economic recovery in the wake of the pandemic. Pandemic-related expenditure meanwhile dropped sharply after 2020 (€19.4bn in 2020 vs €2.7bn in 2022). Part of this support has nevertheless been replaced by measures to counter rising energy prices (€5.9bn). Public debt (as per the Maastricht definition) amounted to 105.1% of GDP at the end of 2022. This represents a contraction of 4.0 percentage points of GDP compared to 2021. The favorable development of the debt ratio in 2022 was entirely attributable to strong nominal GDP growth.
Can USD Reverse in April?
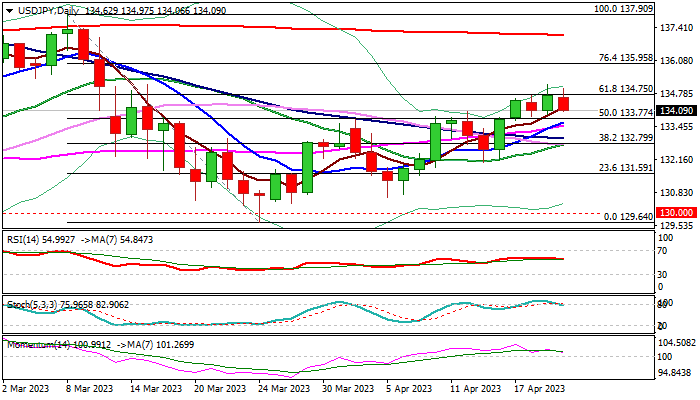
As we move away from the bank crisis and de-dollarization concerns, a significant question on the minds of many traders is whether the US Dollar will experience a corrective rebound from its current position. This is a crucial question because it will set a precedent for predicting the price action of various commodities, particularly gold. To answer this question, let's examine the current price action on the charts and determine whether the US Dollar will strengthen in April after several weeks of bearish momentum.
US DOLLAR - Weekly Timeframe
The US Dollar chart on the weekly timeframe shows the price currently around a key rally-base-rally demand zone with a confluence of trendline support, the 100-Period Moving Average, and a bullish array from the moving average positions. This confirms, to a large extent, the bullish sentiment and the expectation of a reversal from the Dollar in April.
Analysts’ Expectations:
- Direction: Bullish
- Target: 103.933
- Invalidation: 99.629
EURUSD - Weekly Timeframe
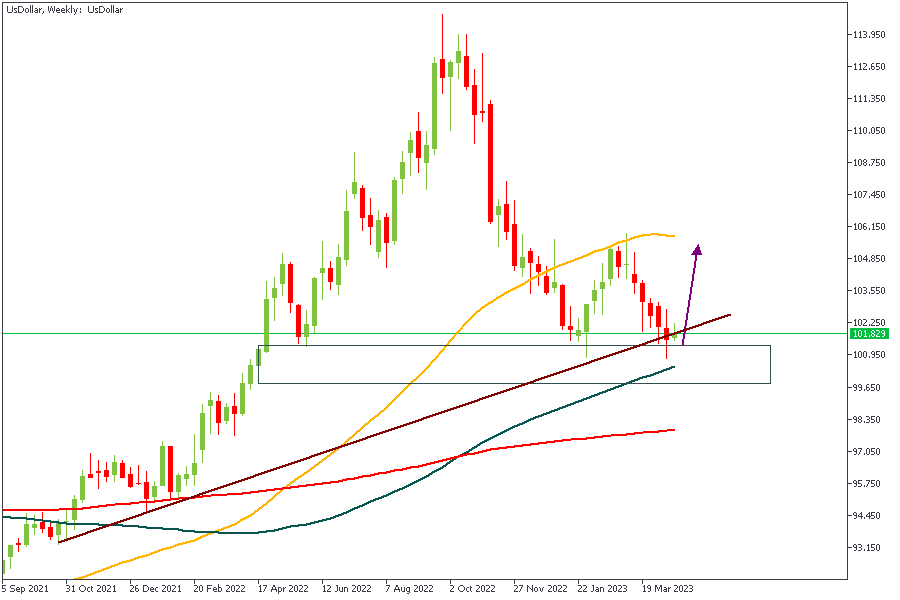
EURUSD has reached an important drop-base-drop supply zone on the weekly timeframe. A resistance trendline intersects this supply zone and the 100-Period Moving Average. Considering the manner of arrangement of the Moving Averages and the 88% of the Fibonacci retracement, we will likely see a big bearish movement away from the supply zone.
Analysts’ Expectations:
- Direction: Bearish
- Target: 1.07088
- Invalidation: 1.11839
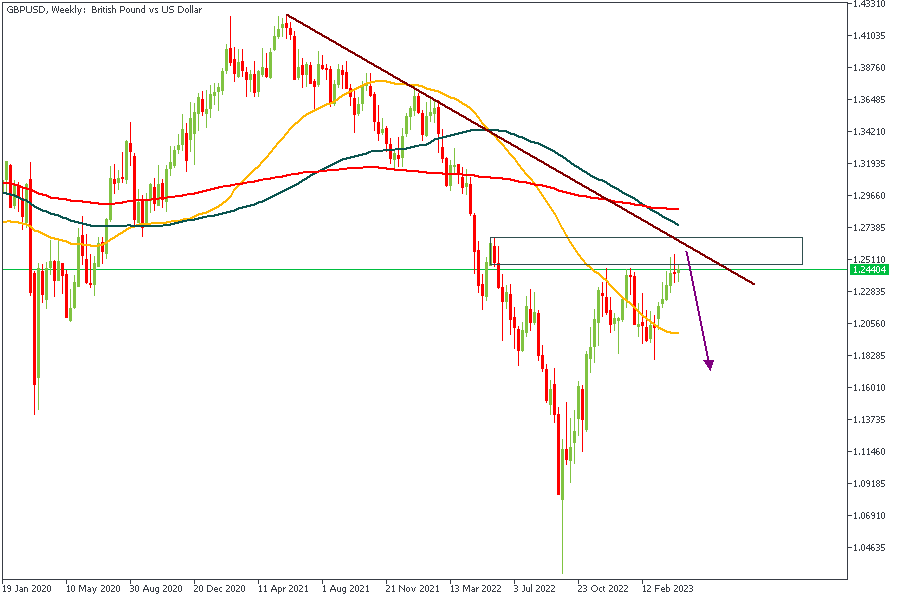
GBPUSD - Weekly Timeframe
Similar to the EURUSD scenario, we find GBPUSD playing out within a rally-base-drop supply zone with the trendline intersection. The 100-Period Moving Average is also within close reach of the current price spot, which could contribute to the bearish movement as a resistance level.
Analysts’ Expectations:
- Direction: Bearish
- Target: 1.21033
- Invalidation: 1.26882
USDCAD - Weekly Timeframe
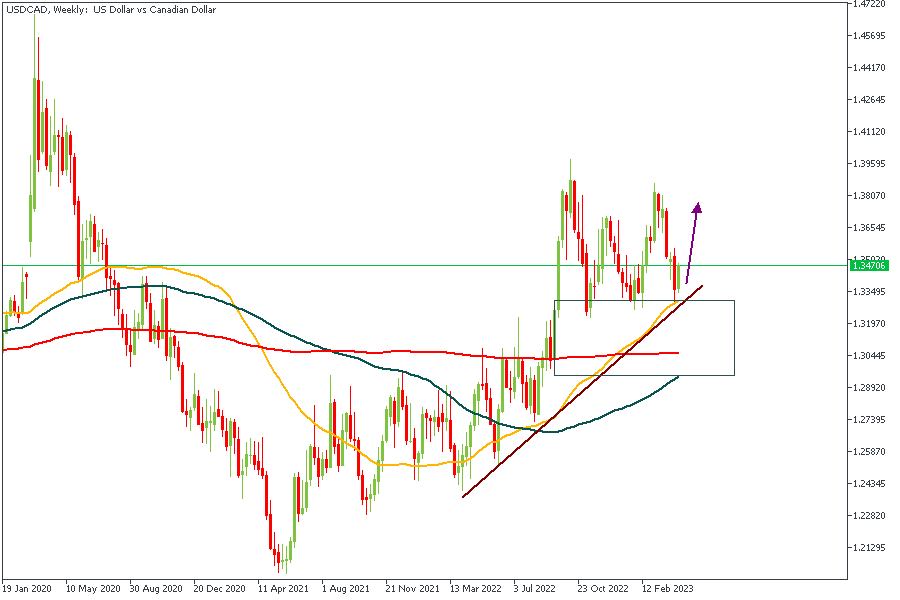
If the US Dollar truly plays out stronger, it would lead to a bullish price action here on the weekly timeframe of USDCAD. As a result, we need to check for factors that may contribute to the bullish outcome. First, the rally-base-rally demand zone and the 50-Period Moving Average serve as the initial confirmation. At the same time, the trendline support and the 76% of the Fibonacci retracement tool can be considered secondary confirmation factors. Overall, the bullish sentiment seems valid beyond any doubt.
Analysts’ Expectations:
- Direction: Bullish
- Target: 1.38227
- Invalidation: 1.29965
CONCLUSION
The trading of CFDs comes at a risk. Thus, to succeed, you have to manage risks properly. To avoid costly mistakes while you look to trade these opportunities, be sure to do your due diligence and manage your risk appropriately.
LTCUSD Technical Analysis: Bearish Engulfing Pattern Is Below $103.38
Bulls couldn't keep control of the market last week, and after touching a high of $103.38 on 18 April, the price declined against the US Dollar, touching a low of $89.06 today in the early Asian trading session.
There is a bearish engulfing pattern below the $103.38 handle on the H1 timeframe. It signifies the end of a bullish phase and the start of a bearish phase in the market.
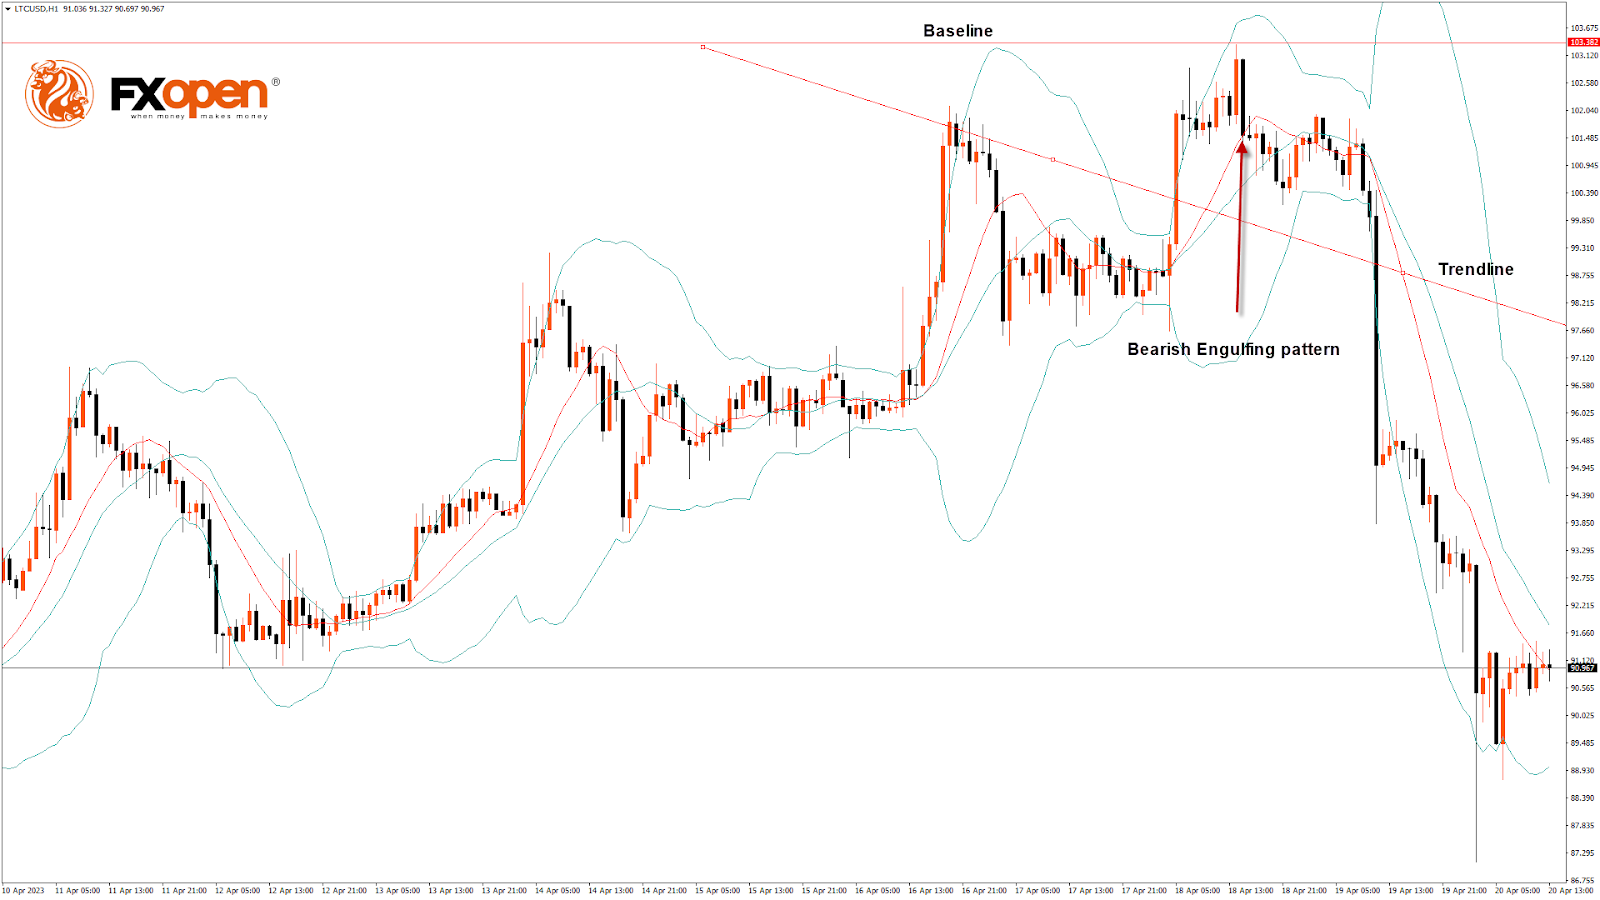
The MACD has crossed down its moving average in the daily timeframe. Also, Litecoin is trading below its 100-hour simple moving average, 200-hour exponential moving average, and pivot level of $91.04.
The relative strength index is at 30.14, indicating very weak demand for Litecoin and the continuation of the selling pressure in the markets.
Litecoin remains below all of the moving averages, which are giving a bearish signal at current market levels of $90.37.
The STOCHRSI is signaling overbought market conditions, which means that the price is expected to decline in the short term.
The short-term outlook for Litecoin has turned strongly bearish.
- All technical indicators a bearish
- Litecoin bearish reversal is seen below the $103.38 level.
- The RSI is bearish.
- The average true range indicates low market volatility.
Litecoin Bearish Reversal Is Seen Below $103.38
Litecoin continues to move down after falling below the $95 handle, with further support levels located at $88 and $85.
20- and 50-day adaptive moving averages formed a bearish reversal pattern.
LTCUSD is about to break its classic support level of 90.10 and Fibonacci support level of 90.80, after which the path towards $85 will get cleared.
Litecoin faces resistance at $93.58, which is a 3-10 daily MACD, and at $95.36, at which the price crosses the 9-day moving average.
The Week Ahead
Litecoin has entered a consolidation zone, and a further break below the $90 barrier is expected.
Most technical indicators are signaling a bearish sentiment in the market.
Litecoin should stay above the important support level of $87.03, which is a 38.2% retracement from a 4-week low, and at $85.44, which is a 50% retracement from 13-week High/Low.
The short-term outlook for Litecoin has turned strongly bearish, the medium-term outlook is bearish, and the long-term outlook is neutral at present market conditions.
The weekly projection is $85, with a consolidation zone of $88.
ETHUSD Technical Analysis: Three Inside Down Pattern Is Below $2,140
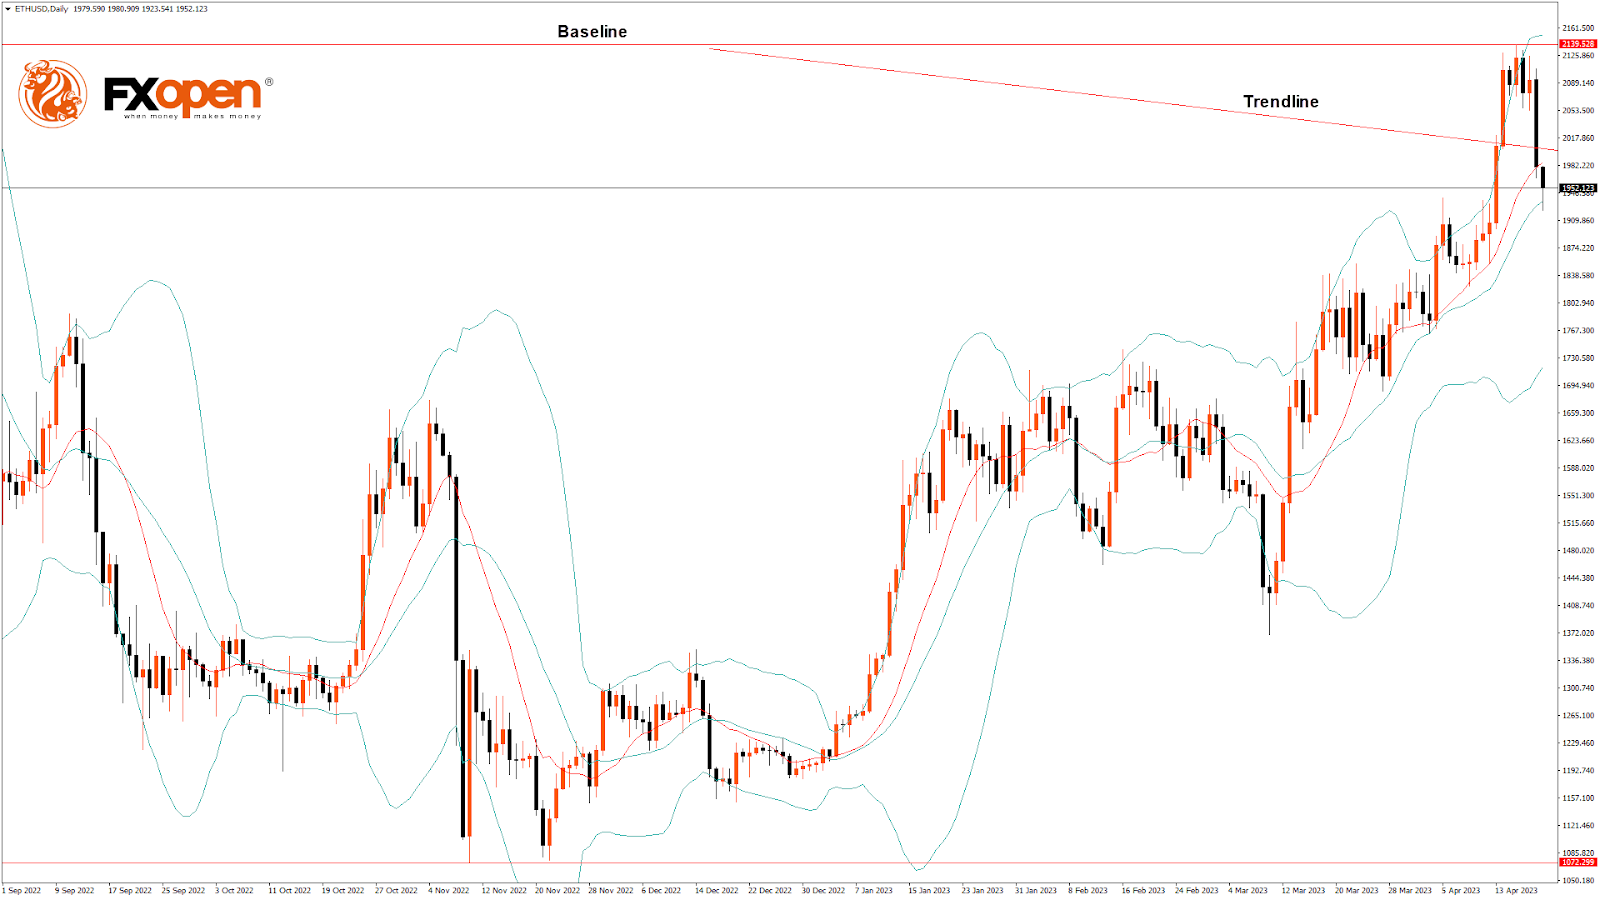
Bulls couldn't keep control of the market, and after touching a high of $2,140 on 16 April, the ETH/USD pair declined, touching a low of $1,923 today in the early Asian trading session.
ETHUSD is under bearish pressure after falling below the $2,000 psychological support level as the global investor sentiment appears weak after the Shanghai upgrade.
The three inside down pattern is below the $2,140 handle on the H1 timeframe. It's a bearish pattern, which signifies the end of a bullish phase. Also, there is a bearish harami pattern in the H2 timeframe.
ETH is back under the pivot point, indicating the bearish pressure in the market.
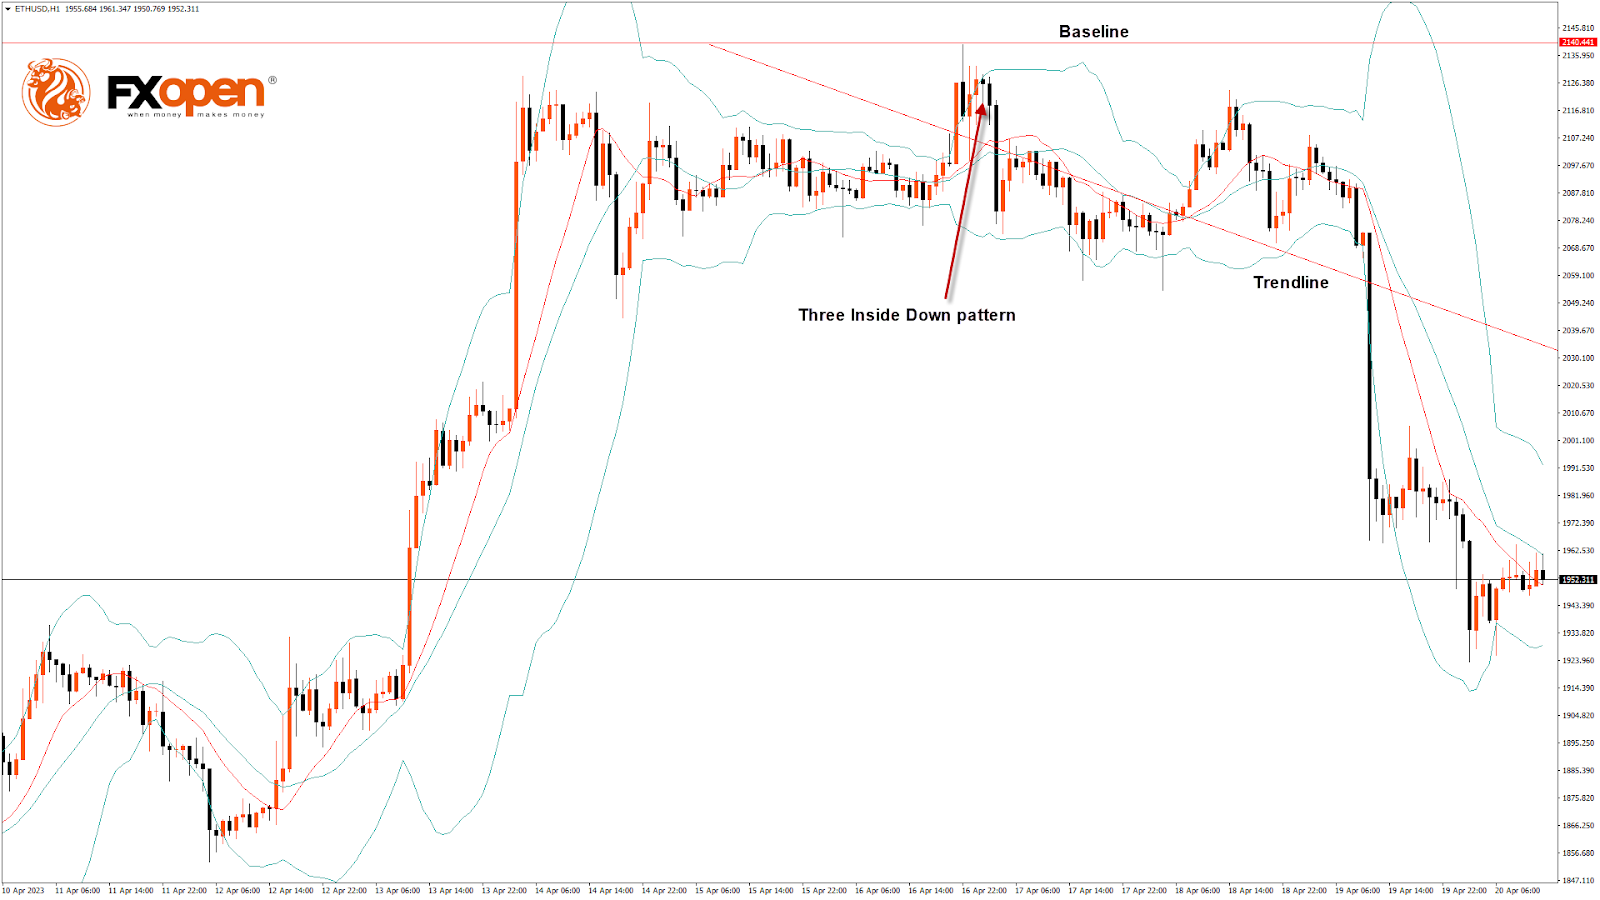
The relative strength index is at 37.74, indicating very weak demand for Ether and a continuation of the selling pressure in the market.
The STOCHRSI is giving an overbought signal, meaning that the price is expected to decline in the short-term range.
We also detected the formation of the bearish harami pattern in both the 30-minute and 1-hour timeframe.
Most of the technical indicators are bearish. Most moving averages are bearish at the current market level of $1,944.
ETH is now trading below the 100-hour simple and 200-hour exponential moving averages.
- ETH bearish reversal is seen below the $2,140 mark.
- The short-term range is expected to be strongly bearish.
- The average true range indicates low market volatility.
ETH Bearish Reversal Is Below $2,140
On the daily chart, ETH is trading just below its pivot level of $1,955 and is moving into a very strong bearish channel. The price is about to break its classic support level of $1,939 and has already broken its Fibonacci resistance level of $1,951; further supports are $1,910 and $1,850.
An Ichimoku bearish crossover between Tenkan and Kijun is formed in the 15-minute timeframe.
The price ranges near the channel's resistance in the 15-minute timeframe, indicating the bearish trend.
The key support levels to watch are $1,845, which is a 38.2% retracement from the 13-week high, and $1,861, which is a 14-day RSI at 50.
The Week Ahead
ETH is correcting lower below $2,000, indicative of the bearish momentum, and is expected to move towards the $1,900 level in the medium-term range in the H1 timeframe.
We see a short-term bearish trend line forming from $2,140 towards the $1,937 level.
There is a minor bearish trend line with the resistance at $1,994, at which the price crosses the 9-day moving average.
The immediate short-term outlook for ETH has turned mildly bearish, the medium-term outlook has turned bearish, and the long-term outlook is neutral in present market conditions.
The resistance zone is at $2,018, which is a pivot point, and at $2,063, which is 14-3 daily raw stochastic at 80.
The weekly outlook is $1,850 with a consolidation zone of $1,900.
The Crypto Correction
Market picture
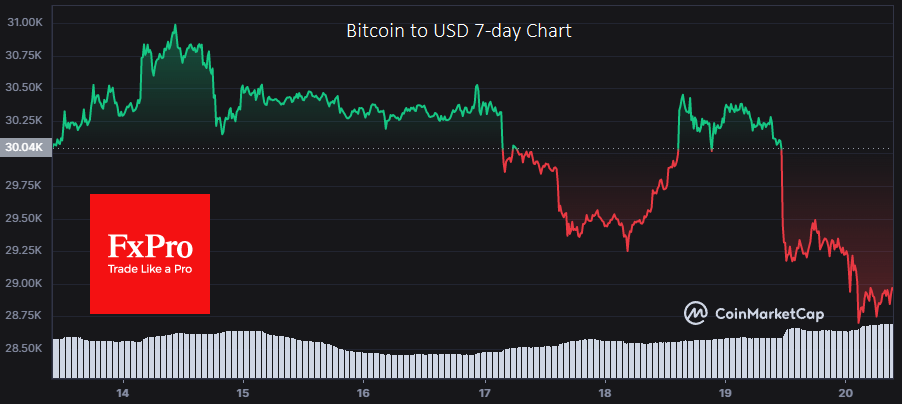
Bitcoin rolled back to $29K on Wednesday and fell to $28.6K at specific points on Thursday morning. The decline comes in strong impulses as high volumes are released into the market, triggering waves of stop orders.
These impulses are followed by stabilisation periods when trading volume increases as if the big players gradually absorb the market as it declines. This could be long-term buying or liquidity consolidation before a new wave of selling.
Trader Skew reported on Twitter that the dump was triggered by a market sell of 15k BTC on Binance.
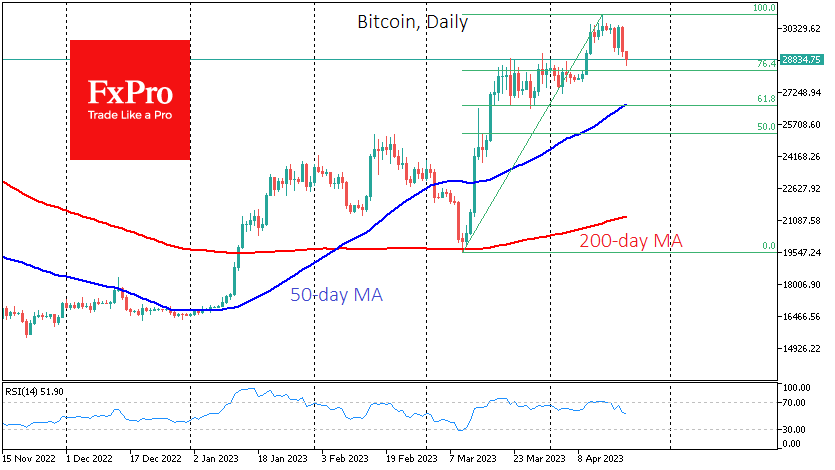
Bitcoin is correcting a 58% rally from the March lows to the April highs. If it manages to hold above $28K, it would be a very bullish market sentiment statement. A full correction to 61.8% of that rally would return the price to the 50-day moving average at $26.7K. And the market dynamics in this area are worth watching, as further declines will doubt the resumption of a sustained bull market in cryptocurrencies.
News Background
Former US President Donald Trump has launched a second collection of non-transferable tokens (NFTs) – Trump Digital Trading Cards. Trump’s trading cards are priced at $99. The tokens themselves are created on the Polygon blockchain. Trump said all the tokens were sold in hours, totalling $4.6 million.
Microsoft founder Bill Gates tried to explain the popularity of cryptocurrencies and NFT tokens. He says it is driven by the so-called “greater fool theory”. According to this theory, one person will always buy a commodity from another at a high price to resell the asset at an even higher price.
According to the Wall Street Journal, NFT sales are down 92% from their peak. Tokens now sell for an average of $19K. In September 2021, this figure was higher at $225K.
EUR/USD Mid-Day Outlook
Daily Pivots: (S1) 1.0921; (P) 1.0952; (R1) 1.0988; More...
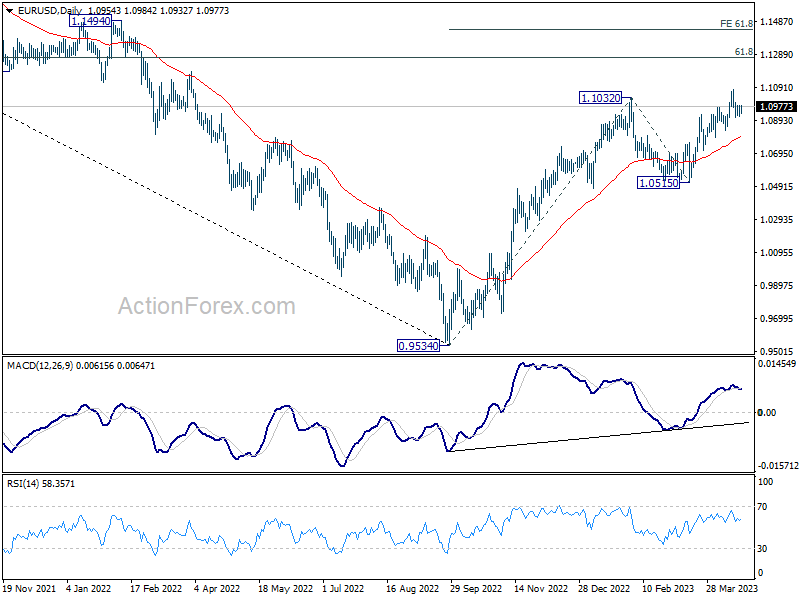
EUR/USD is still bounded in range trading and intraday bias stays neutral. Outlook remains bullish with 1.0830 support intact. On the upside, break of 1.1075 will will resume larger up trend to 1.1273 fibonacci level. Break there will target 61.8% projection of 0.9534 to 1.1032 from 1.0515 at 1.1441. However, firm break of 1.0830 will confirm short term topping and bring deeper decline to 1.0711 support instead.
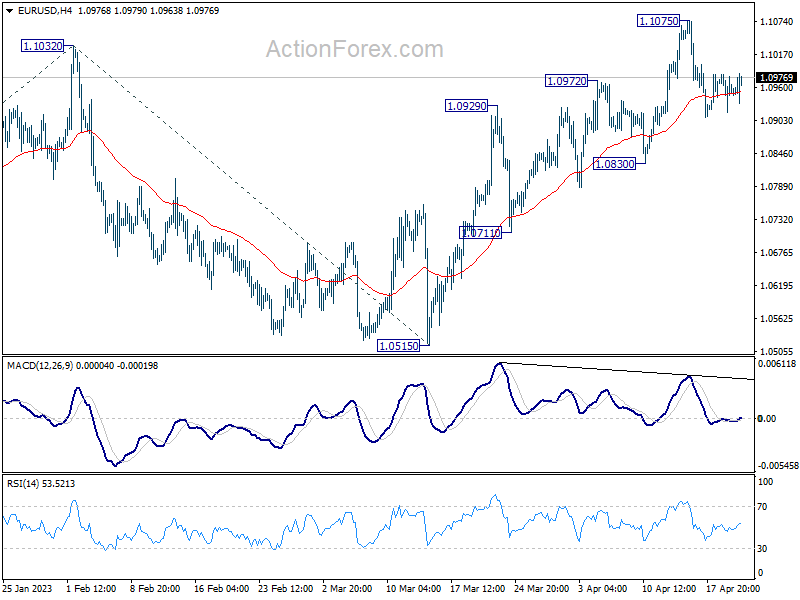
In the bigger picture, rise from 0.9534 (2022 low) is in progress for 61.8% retracement of 1.2348 (2021 high) to 0.9534 at 1.1273. Sustained break there will solidify the case of bullish trend reversal and target 1.2348 resistance next (2021 high). This will now remain the favored case as long as 1.0515 support holds, even in case of deeper pull back.
GBP/USD Mid-Day Outlook
Daily Pivots: (S1) 1.2397; (P) 1.2436; (R1) 1.2478; More...
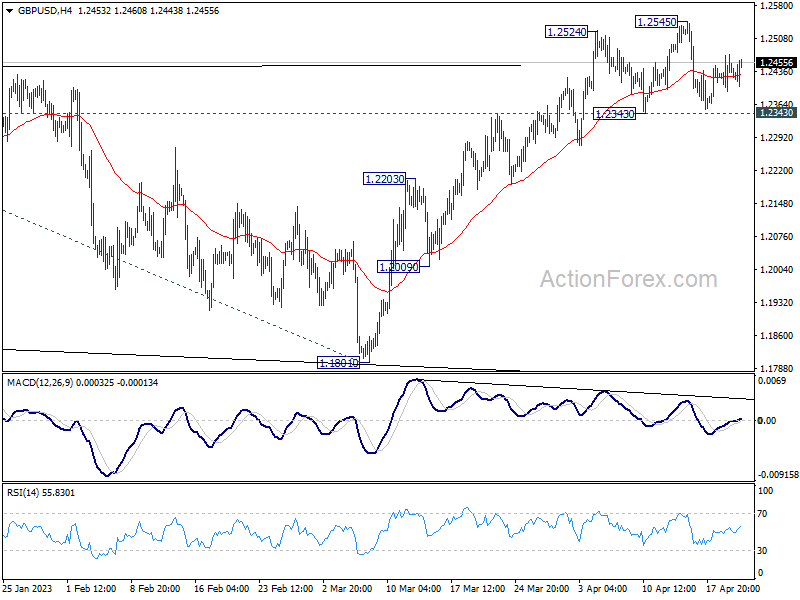
No change in GBP/USD's outlook as range trading continues. Intraday bias stays neutral at this point. Another rise is in favor with 1.2343 support intact. On the upside, above 1.2545 will target 1.2759 fibonacci level first. Firm break there will target 61.8% projection of 1.0351 to 1.2445 from 1.1801 at 1.3095. However, considering bearish divergence condition in 4H MACD, firm break of 1.2343 will confirm short term topping, and turn bias back to the downside for deeper pullback.
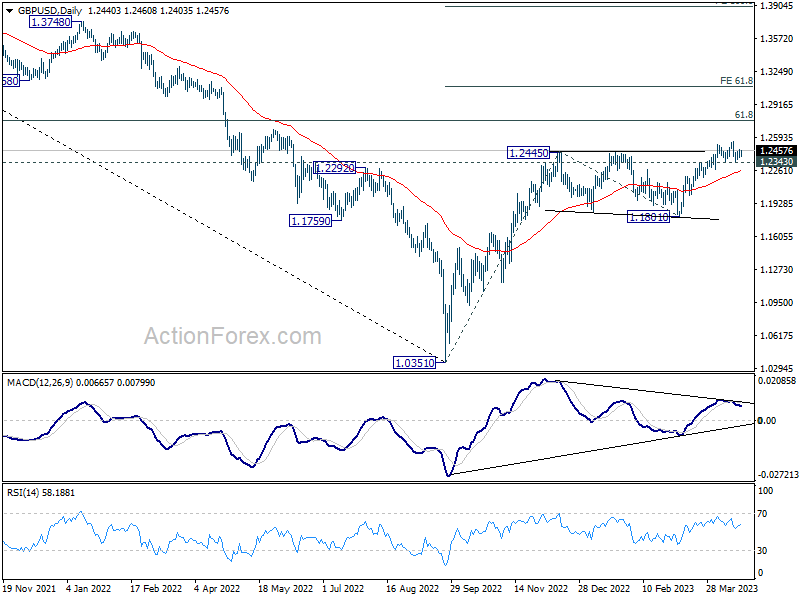
In the bigger picture, the rise from 1.0351 medium term term bottom (2022 low) is in progress for 61.8% retracement of 1.4248 (2021 high) to 1.0351 at 1.2759. Sustained break there will add to the case of long term bullish trend reversal. Further break of 61.8% projection of 1.0351 to 1.2445 from 1.1801 at 1.3095 could prompt upside acceleration to 100% projection at 1.3895. For now, this will remain the favored case as long as 1.1801 support holds, even in case of deep pull back.
USD/JPY Mid-Day Outlook
Daily Pivots: (S1) 134.07; (P) 134.60; (R1) 135.24; More...
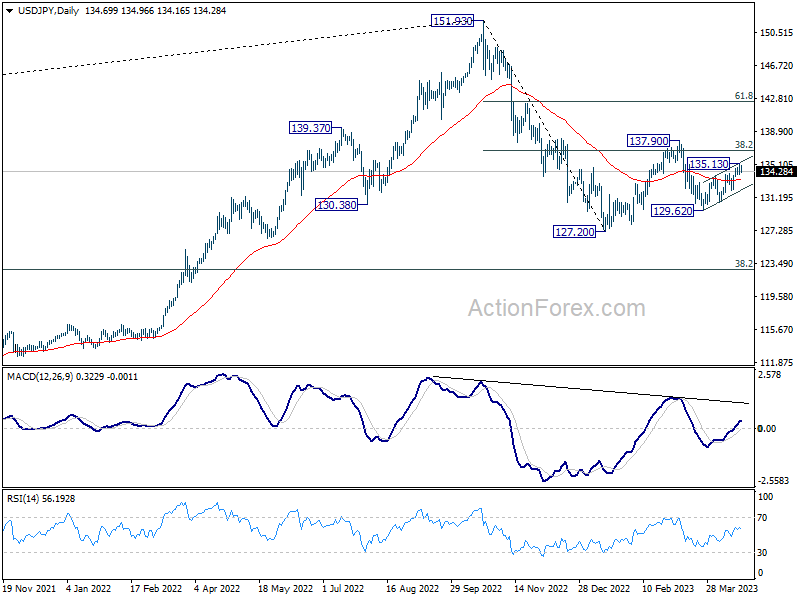
Intraday bias in USD/JPY is turned neutral with current retreat and some consolidations could be seen. But another rally will remain in favor as long as 132.03 support holds. On the upside, break of 135.13 will resume the choppy rebound from 129.62 towards 137.90 resistance next.
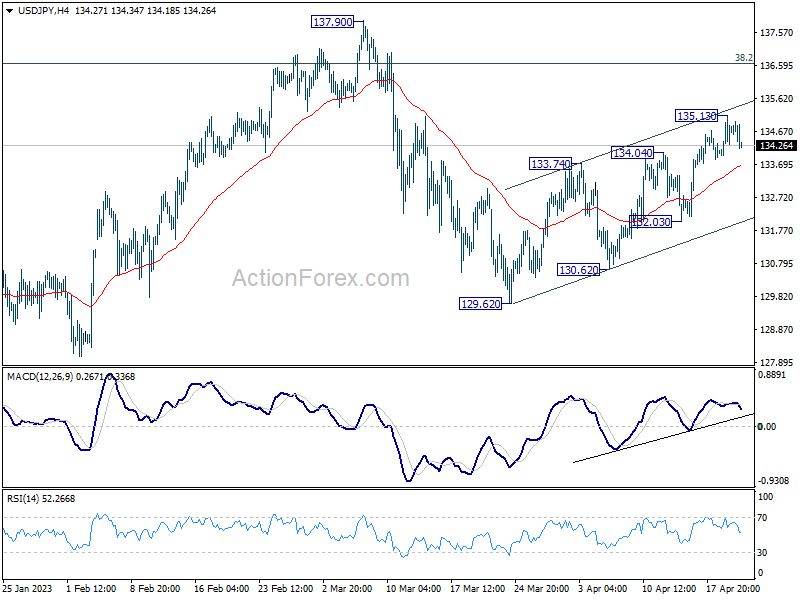
In the bigger picture, corrective pattern from 127.20 might be extending. But after all, down trend from 151.93 is expected to resume at a later stage. Break of 127.20 will resume this down trend and target 61.8% projection of 151.93 to 127.20 from 137.90 at 122.61. This will now be the favored case as long as 137.90 resistance holds.