

Sample Category Title
AUD/USD Daily Report
Daily Pivots: (S1) 0.6702; (P) 0.6737; (R1) 0.6777; More...
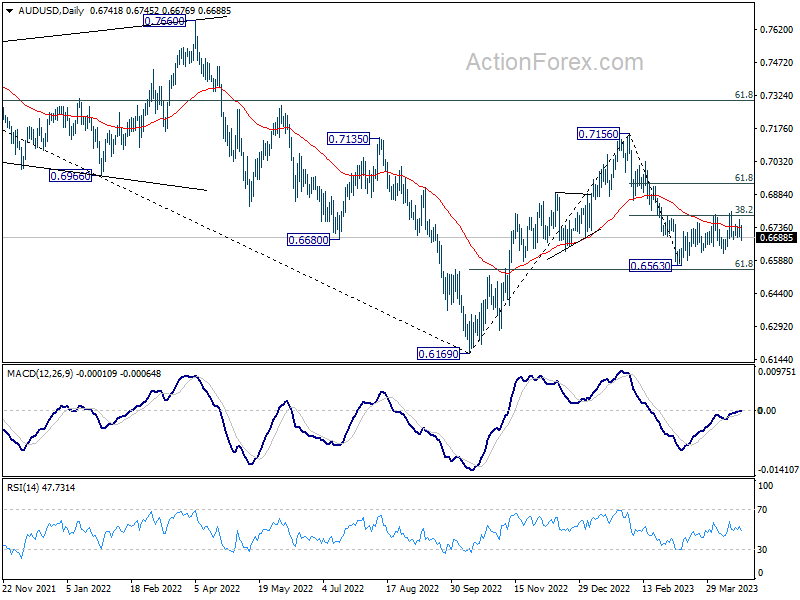
Intraday bias in AUD/USD remains neutral as range trading continues. On the downside, break of 0.6619 will indicate that decline from 0.7156 is resuming through 0.6563 low. Nevertheless, sustained break of 0.6804 will bring stronger rally back to 61.8% retracement of 0.7156 to 0.6563 at 0.6929.
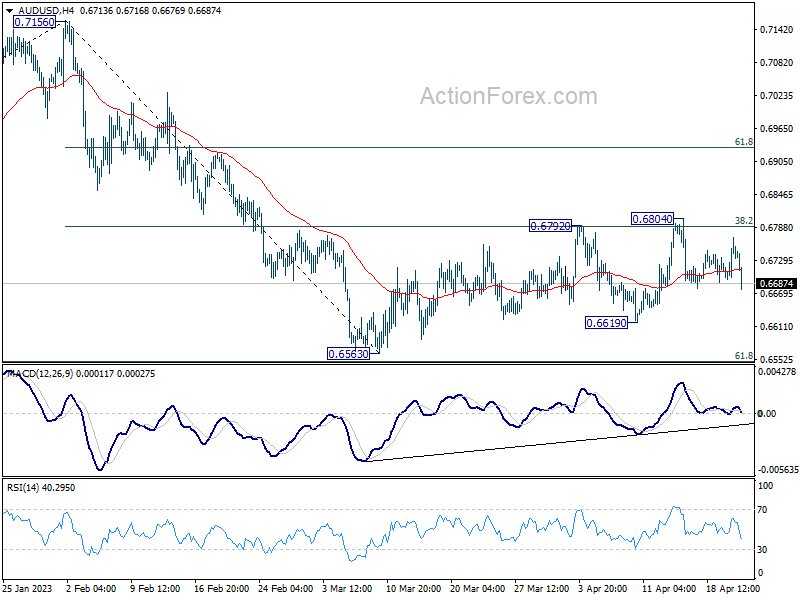
In the bigger picture, as long as 61.8% retracement of 0.6169 to 0.7156 at 0.6546 holds, the decline from 0.7156 is seen as a correction to rally from 0.6169 (2022 low) only. Another rise should still be seen through 0.7156 at a later stage. However, sustained break of 0.6546 will raise the chance of long term down trend resumption through 0.6169 low.
USD/CAD Daily Outlook
Daily Pivots: (S1) 1.3455; (P) 1.3472; (R1) 1.3496; More....
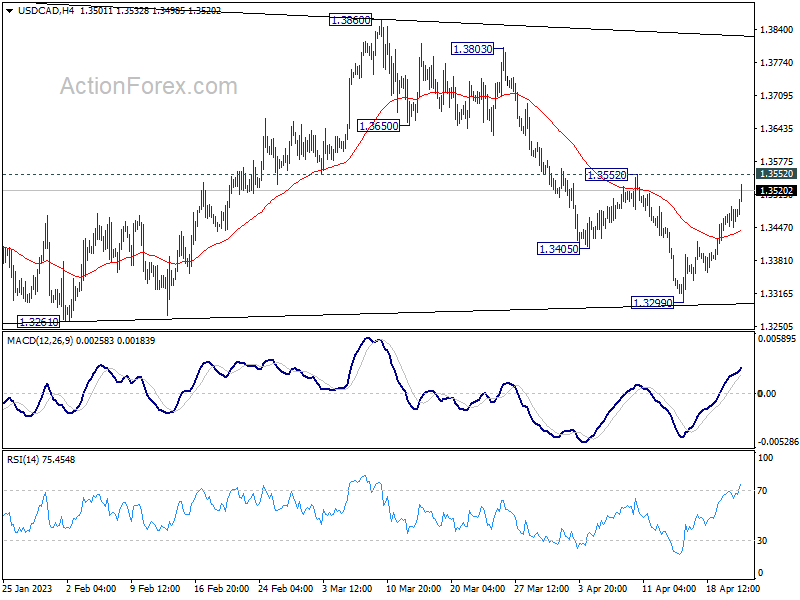
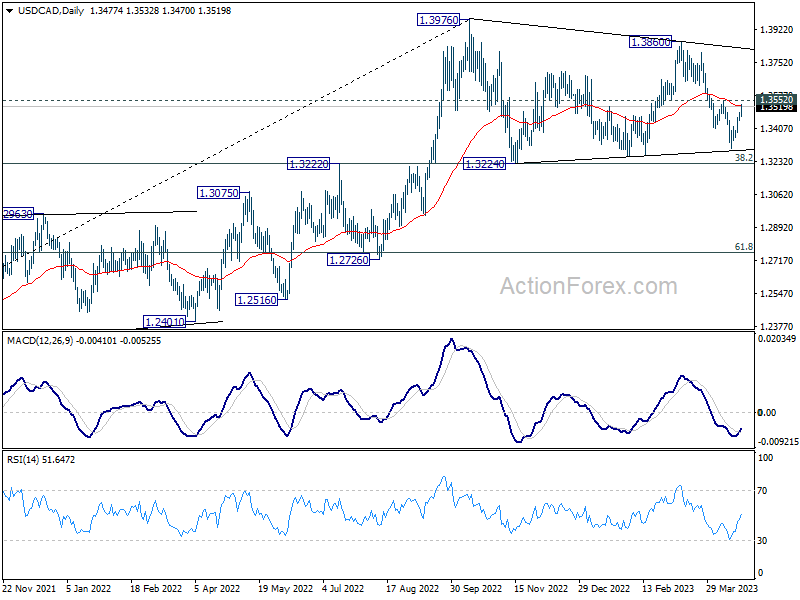
USD/CAD's rebound from 1.3299 extends higher today and focus is now on 1.3552 resistance. Firm break there will argue that fall form 1.3860 has completed. More important, that would also indicate completion of the three-wave corrective pattern from 1.3976 too. Intraday bias will be back on the upside for 1.3860/3976 resistance zone.
In the bigger picture, the up trend from 1.2005 (2021 low) is still in progress. Break of 1.3976 will confirm resumption and target 61.8% projection of 1.2401 to 1.3976 from 1.3261 at 1.4234. Firm break there will pave the way to long term resistance zone at 1.4667/89 (2016, 2020 highs). On the downside, sustained break of 55 W EMA (now at 1.3282) is needed to confirm medium term topping. Otherwise, outlook will remain bullish even in case of deep pull back.
Eurozone PMIs: Unevenly distributed growth but same optimism
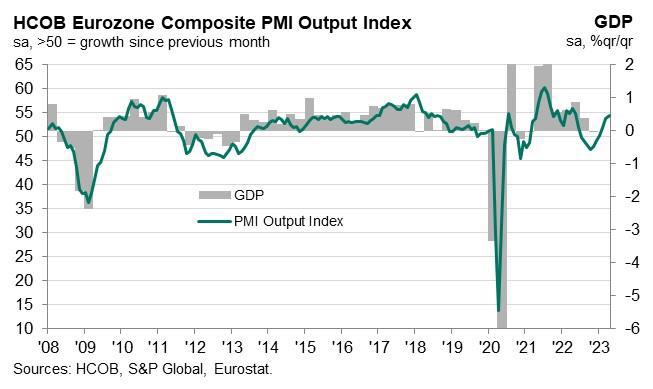
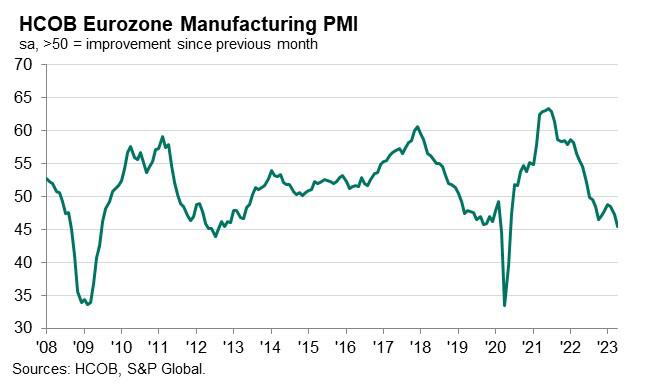
Eurozone PMI Manufacturing declined from 47.3 to 45.5 in April, hitting a 35-month low. On the other hand, PMI Services rose from 55.0 to 56.6, a 12-month high. PMI Composite rose from 53.7 to 54.4, an 11-month high.
Cyrus de la Rubia, Chief Economist at Hamburg Commercial Bank, said: "The HCOB Purchasing Managers' Indices for the euro zone show a very friendly overall picture of an economy that continues to recover. However, a closer look reveals that growth is very unevenly distributed..."
"For the further, companies are rather positive not only in the services sector but also for the manufacturing sector. According to the companies surveyed, the reasons for this optimism include a diminishing fear of a resurgence of the energy crisis, supply chains that are functioning better again, and the expectation that inflation has passed its zenith. The latter is coupled with the hope that the ECB will pause its interest rate hikes soon."
Full Eurozone PMI release here.
Also released, Germany PMI Manufacturing fell from 44.7 to 44.0, a 35-month low. PMI Services rose from 53.7 to 55.7, a 12-month high. PMI Composite rose from 52.6 to 53.9, a 12-month high.
France PMI Manufacturing dropped from 47.3 to 45.5, a 35-month low. PMI Services rose from 53.9 to 56.3, an 11-month high. PMI Composite rose from 52.7 to 53.8, also an 11-month high.
EUR/GBP Daily Outlook
Daily Pivots: (S1) 0.8804; (P) 0.8815; (R1) 0.8827; More...
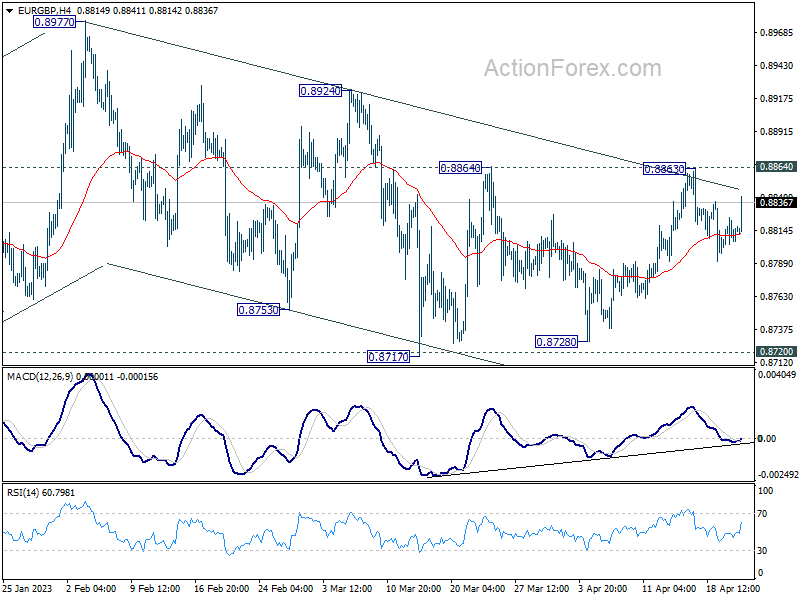
Intraday bias in EUR/GBP remains neutral and outlook is unchanged. On the upside, firm break of 0.8864 will extend the rebound from 0.8717 to 0.8924 resistance. Further break there should confirm completion of the choppy decline from 0.8977, and should resume larger rise from 0.8545 through 0.8977 high. However, decisive break of 0.8717 support will resume the decline from 0.8977 instead.
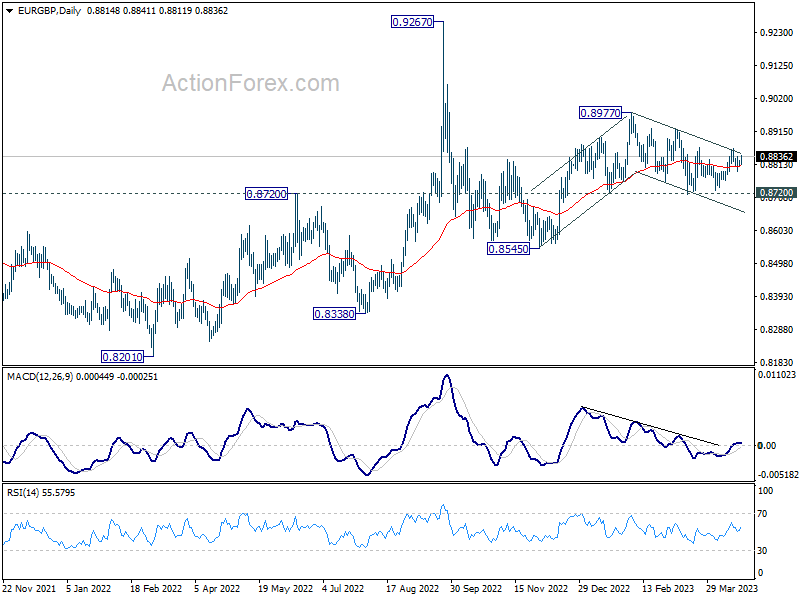
In the bigger picture, outlook remains rather mixed for now, except that price actions from 0.9267 (2022 high) are part of the long term range pattern from 0.9499 (2020 high). With 0.8720 support intact, rise from 0.8545 is in favor to continue through 0.8977. However, firm break of 0.8720 will argue that such rebound has completed, and open up deeper fall through this support level.
EUR/AUD Daily Outlook
Daily Pivots: (S1) 1.6208; (P) 1.6285; (R1) 1.6348; More...
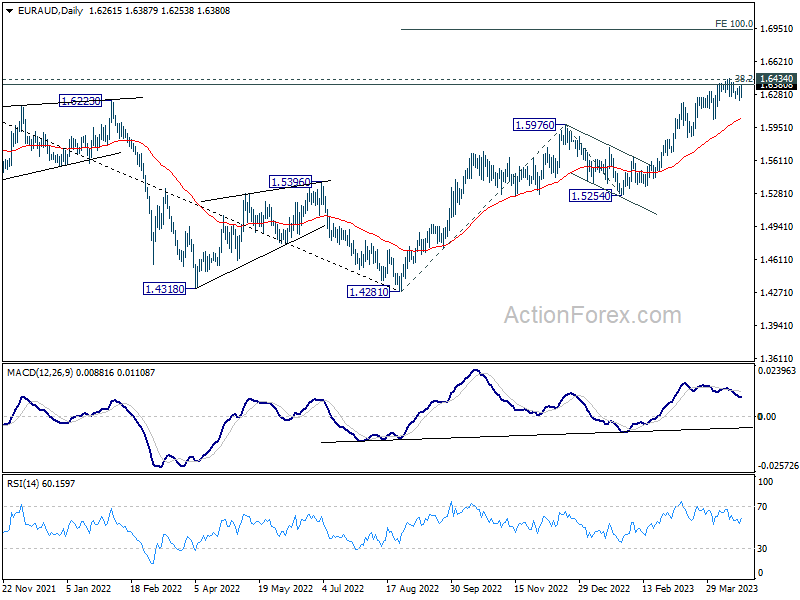
EUR/AUD rebounded ahead of 1.6216 support but stays below 1.6444. Intraday bias remains neutral first. On the upside, decisive break of 1.6434 resistance will carry larger bullish implications. Rally from 1.4281 should target 100% projection of 1.4281 to 1.5976 from 1.5254 at 1.6949. However, considering bearish divergence condition in 4H MACD, firm break of 1.6216 should confirm short term topping, after rejection by 1.6389/6434 cluster resistance zone. Intraday bias will be back on the downside in this case, to 1.6033 support and possibly below.
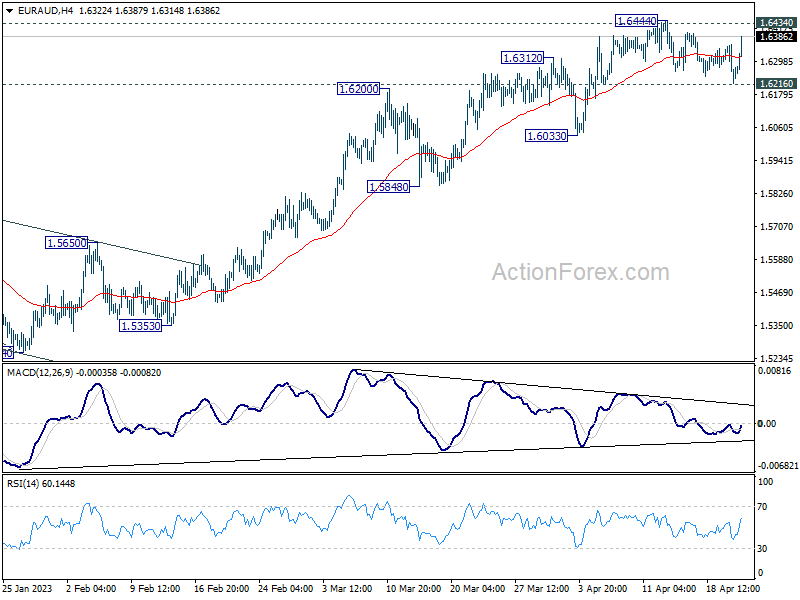
In the bigger picture, focus stays on 1.6389/6434 cluster resistance (38.2% retracement of 1.9799 to 1.4281 at 1.6389). Sustained break there should confirm that whole down trend from 1.9799 (2020 high) has completed. Further rally should then be seen to 61.8% retracement at 1.7691. However, rejection by this cluster resistance will make medium term outlook neutral at best.
EUR/CHF Daily Outlook
Daily Pivots: (S1) 0.9773; (P) 0.9806; (R1) 0.9824; More...
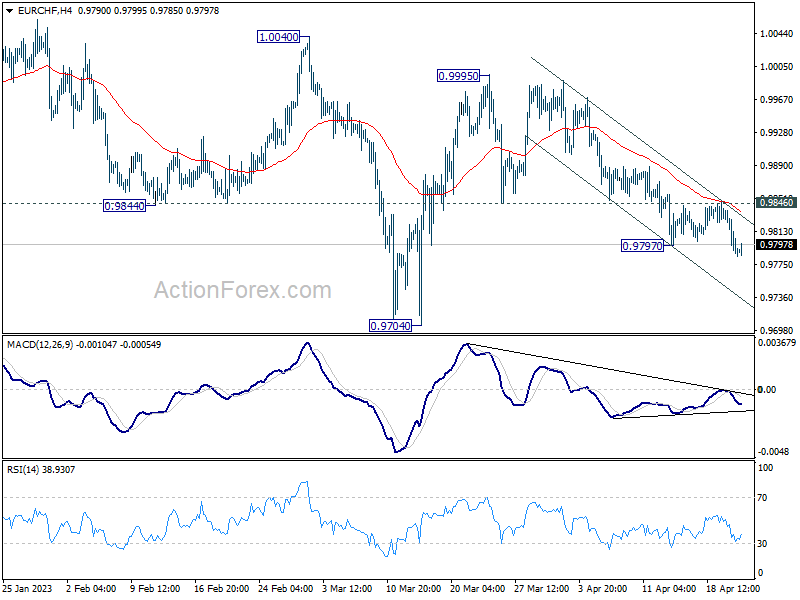
Break of 0.9797 indicates that fall form 0.9995 is resuming. Intraday bias is back on the downside. Current decline is seen as part of the whole corrective pattern from 1.0095. Deeper fall would be seen to 0.9704 support and below. For now, further decline will remain in favor as long as 0.9846 resistance holds, in case of recovery.
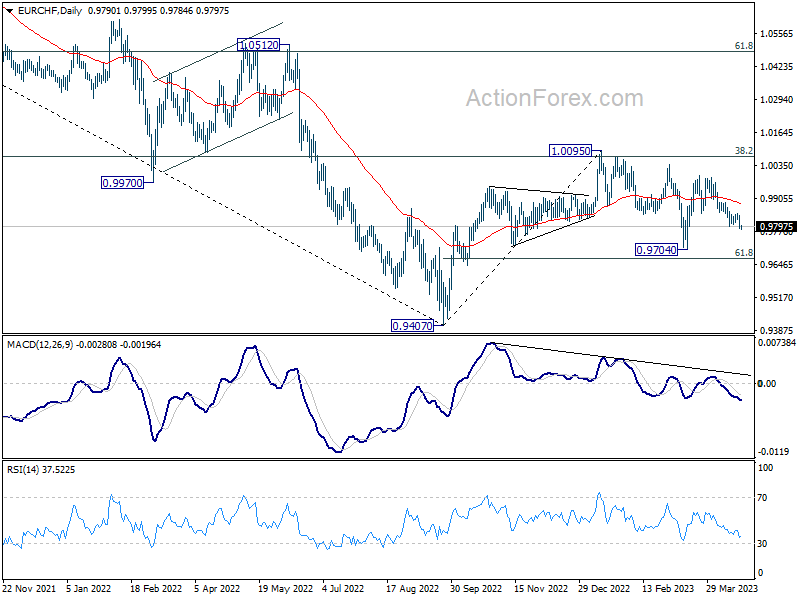
In the bigger picture, prior rejection by 55 W EMA (now at 0.9989) and 38.2% retracement of 1.1149 to 0.9407 at 1.0072 suggests that medium term outlook is staying bearish. That is, down trend from 1.2004 is not completed yet and is in favor to resume through 0.9407 at a later stage. However, decisive break of 1.0095 resistance will raise the chance of bullish trend reversal. Rise from 0.9407 should then target 1.0505 cluster resistance (2020 low at 1.0505, 61.8% retracement of 1.1149 to 0.9407 at 1.1484).
GBP/JPY Daily Outlook
Daily Pivots: (S1) 166.73; (P) 167.35; (R1) 168.21; More...
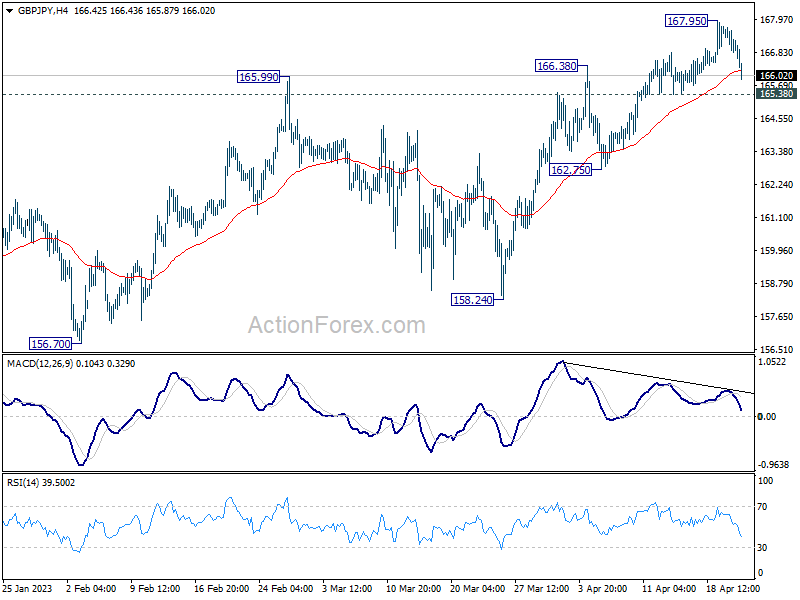
Intraday bias in GBP/JPY is turned neutral with current retreat. Another rise will remain in favor as long as 165.38 minor support holds. On the upside, break of 167.95 will resume the rebound from 155.33 to 169.26 resistance. However, firm break of 165.38 will argue that the corrective pattern from 172.11 is starting another falling leg. Intraday bias will be back on the downside for 162.75 support and below.
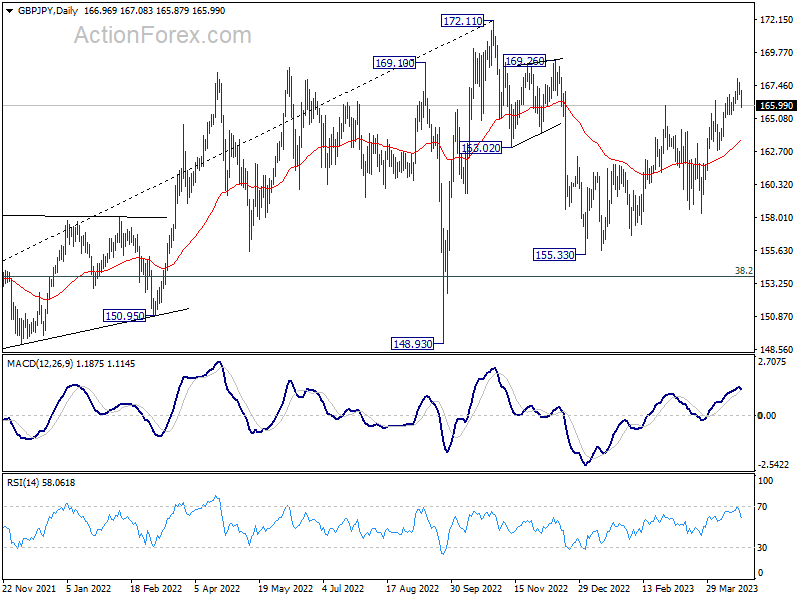
In the bigger picture, as long as 38.2% retracement of 123.94 (2020 low) to 172.11 (2022 high) at 153.70 holds, medium term bullishness is retained. That is, larger up trend from 123.94 (2020 low) is still in progress. Break of 172.11 high to resume such up trend is expected at a later stage.
EUR/USD Technical Analysis
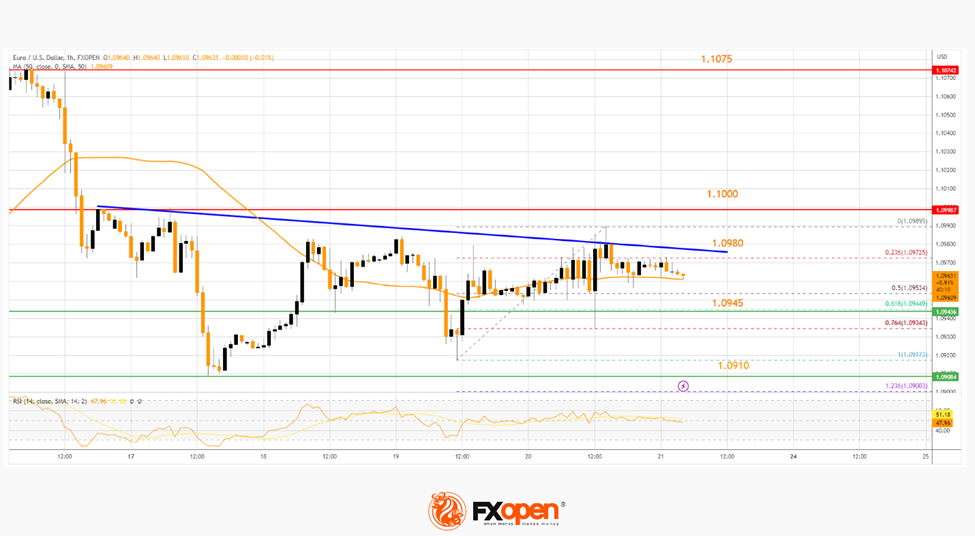
On the hourly chart of EUR/USD at FXOpen, the pair attempted a recovery wave from the 1.0910 zone. The Euro climbed above 1.0945 but it is facing strong resistance near 1.0980 against the US Dollar.
The pair is now consolidating above the 50-hour simple moving average at 1.1000. On the upside, immediate resistance is near a connecting bearish trend line at 1.0980.
The next major resistance is near the 1.1000 level. A break above the 1.1000 resistance zone could spark another strong increase. In the stated case, it could rise toward the 1.1075 resistance.
Conversely, the pair might start another bearish wave from the 1.0980 level. Initial support is near the 50-hour simple moving average. The next major support is near 1.0945. Any more losses might resend the pair toward the 1.0910 support in the near term.
AUD/USD and NZD/USD At Risk of More Losses
AUD/USD started a fresh decline from the 0.6770 resistance zone. NZD/USD is also moving lower and might decline below the 0.6150 support.
Important Takeaways for AUD/USD and NZD/USD
- The Aussie Dollar started a fresh decline below the 0.6740 support against the US Dollar.
- There is a key bullish trend line forming with support at 0.6715 on the hourly chart of AUD/USD at FXOpen.
- NZD/USD failed to clear the 0.6220 resistance zone and reacted to the downside.
- There is a major bearish trend line forming with resistance near 0.6180 on the hourly chart of NZD/USD at FXOpen.
AUD/USD Technical Analysis
On the hourly chart of AUD/USD at FXOpen, the pair faced rejection near 0.6770. The Aussie dollar started a fresh decline and traded below the 0.6740 support against the US Dollar.
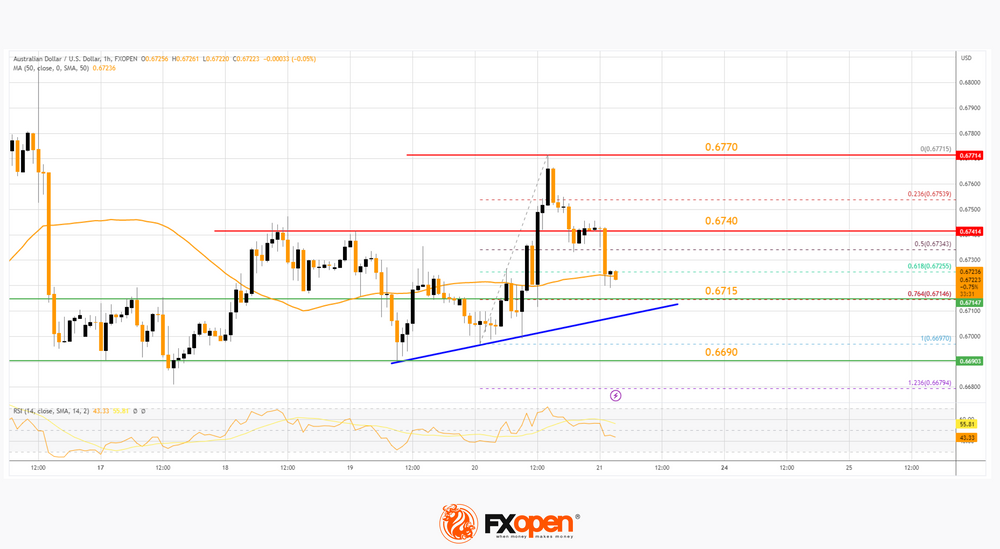
There was a move below the 61.8% Fib retracement level of the upward move from the 0.6697 swing low to the 0.6771 high. It is now trading below the 50-hour simple moving average. It seems like there is a major support waiting near a key bullish trend line with support at 0.6715.
The trend line coincides with the 76.4% Fib retracement level of the upward move from the 0.6697 swing low to the 0.6771 high. If there is a downside break below the trend line, the pair could decline toward 0.6690.
The next support could be the 0.6660 level, below which the bears could aim for a test of the 0.6600 zone in the coming days.
On the upside, the AUD/USD pair is facing resistance near the 0.6740 level. The next major resistance is near the 0.6770 level. A close above the 0.6770 level could start another steady increase in the near term. The next major resistance could be 0.6850.
NZD/USD Technical Analysis
On the hourly chart of NZD/USD at FXOpen, the pair also started a fresh decline after it failed to clear the 0.6220 resistance. The New Zealand dollar dipped below 0.6180 to move into a bearish zone against the US Dollar.
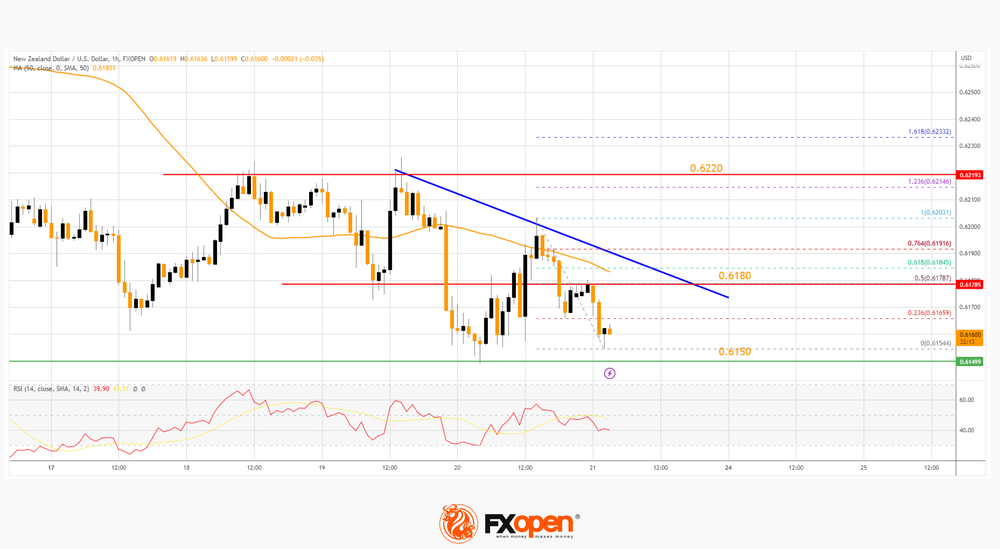
The pair tested the 0.6150 support zone and is currently consolidating losses. On the upside, an initial resistance is near the 50-hour simple moving average at 0.6150.
There is also a major bearish trend line forming with resistance near 0.6180. The trend line coincides with the 50% Fib retracement level of the downward move from the 0.6203 swing high to the 0.6154 low.
The next major resistance is near the 0.6220 level. A clear move above the 0.6220 level might even push the pair toward the 0.6265 level. Any more gains might open the doors for a move toward the 0.6300 resistance zone in the coming days.
If not, the pair could resume its decline. Immediate support is near the 0.6150 level. The next support could be the 0.6120 zone. If there is a downside break below the 0.6120 support, the pair could gain bearish momentum.
In the stated case, the pair may perhaps decline toward the 0.6080 support level. Any more losses could set the pace for a test of the 0.6050 level.
BoJ May Start to Give More Hints on Policy Normalization
- Japan sticky inflation (excluding fresh food & energy) continued to increase for 10 consecutive months.
- Flash manufacturing PMI for April has shown signs of bottoming out from contraction.
- AUD/JPY reversed from key medium-term resistance at 90.70.
Market participants in the financial markets will turn their focus to the Bank of Japan’s monetary policy decision outcome next week on Friday, 28 April under the helm of a new Governor, Kazuo Ueda.
Why is it important?
During a decade-long tenure of the prior Governor Haruhiko Kuroda, BoJ has changed the course of the financial markets by the unleash of close to US$3.4 trillion worth of liquidity into the global financial system under the ambitious expansionary “Abenomics” program to combat the risk of global deflation triggered by the aftermath of the Great Financial Crisis of 2008.
Right now, the world is facing a sticky heightened inflationary situation where developed nations’ central bankers have started to ramp up interest rates hike and reverse their respective Quantitative Easing programs since early 2022. The remaining laggard among them is BoJ which still maintained a negative policy interest rate at -0.10%.
Hence, a slight change in monetary policy from ultra-easy to normalization under new BoJ Governor Ueda is likely to see significant funds flow reversal back into Japan as Japanese investors have accumulated a mountain of offshore investments that amounted to more than two-thirds of Japan’s GDP due to the” Yield Curve Control” (YCC) program enacted in 2016 to put a cap on the yield of the 10-year Japanese Government Bond (JGB).
If such a scenario happens, it can send shockwaves and a dominoes effect in the global financial markets where fixed income yields in the US and Europe may spike up and an increased risk of capital flight out of emerging markets.
Maintaining dovish monetary guidance over local economic realities
Since the last “monetary policy shock teaser” from BoJ in December 2022 where it widened the band of its YCC program to allow the yield of the 10-year JGB to move by 50 basis points from 25 basis points on either side of the 0% target, and market participants took such a move as a precursor to an end of ultra-easy monetary policy in Japan and started to increase bullish and bearish bets on JPY and JGB respectively.
Since taking over the helm at BoJ in early April, Ueda has started to tone down the speed of BoJ’s monetary policy normalization and gave clear guidance during the Spring IMF meeting that BoJ is likely to maintain its ultra-low interest rate at this juncture; indicating no rush to implement a policy change.
However, the latest local economic data do not seem to support the continuation of ultra-easy monetary policy for Japan. Even though the headline inflation rate for March dipped to 3.2% year-on-year from February’s print of 3.3%, 2 consecutive months of growth declined from January’s 4.3% but implied sticky inflation as measured by excluding fresh food and energy (core core inflation rate) continued to climb to 3.8% year-on-year in March from 3.5% in February, ten consecutive months of expansion to hover close to a four-decade high.
In addition, manufacturing activities have started to show signs of bottoming out from contraction; the April flash Jibun Bank Manufacturing PMI increased to 49.5 from a final reading of 49.2 in March, indicating its highest reading since October 2022.
Hence, with inflation staying above BoJ’s target of 2% for a year and manufacturing activities have started to improve, BoJ may start to give an implicit heads-up on laying the groundwork for the normalization of its ultra-easing policy in the coming meeting next Friday with hints coming from the latest inflationary and growth data projections in its economic quarterly outlook report to be released on the same day as well as Ueda’s press conference.
AUD/JPY Technical Analysis – Retreated from key medium-term resistance ahead of BoJ
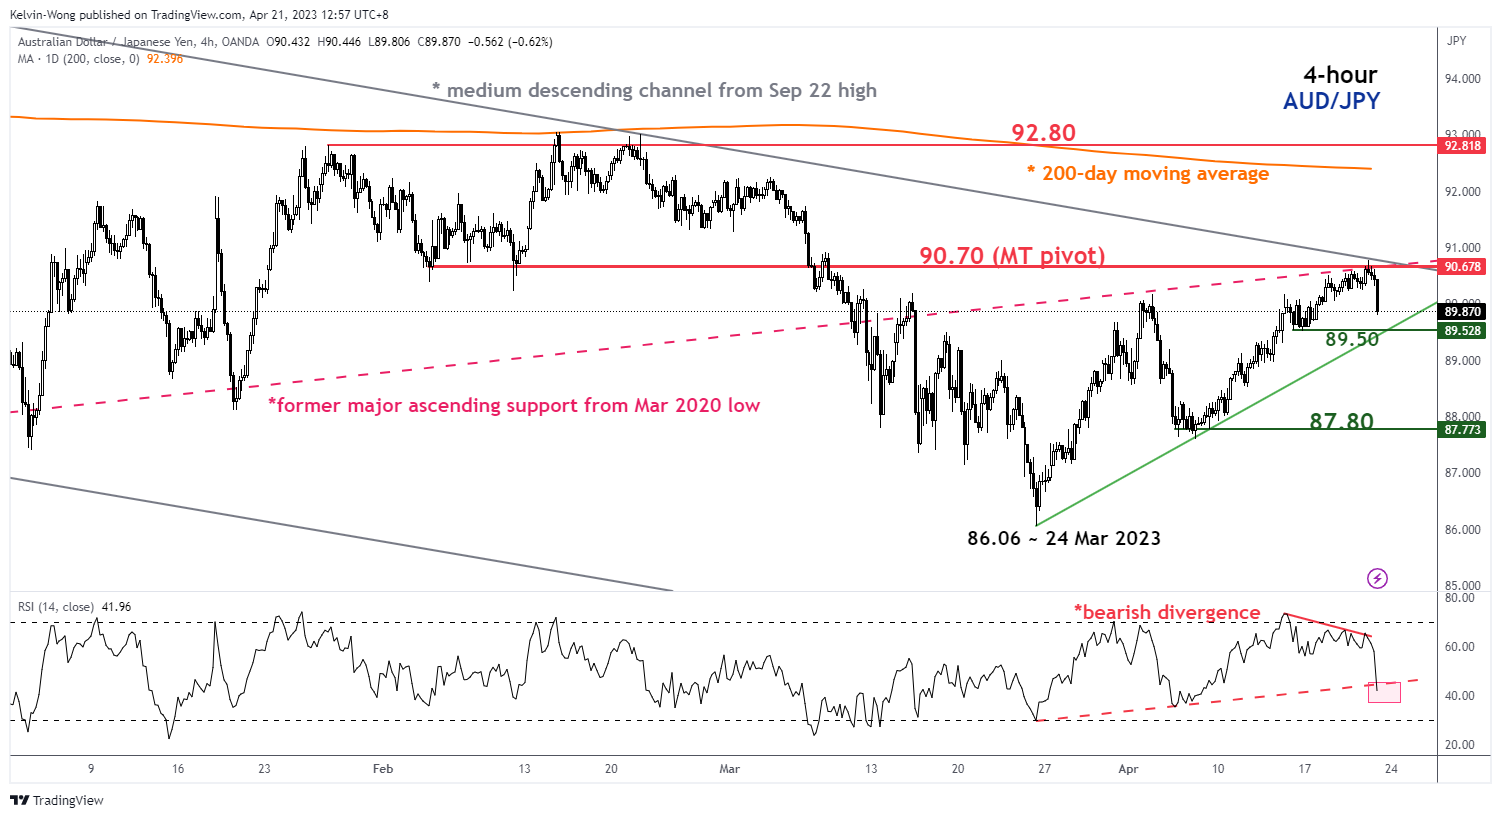
Source: TradingView as of 20 Apr 2023 (click to enlarge chart)
The AUD/JPY cross rate has staged a negative reversal from its 90.70 key medium-term pivotal resistance today with several bearish elements. Hence, the latest price actions suggest there is an increased risk that the recent 470 pips rally from its 24 March 2023 low of 86.06 is likely to be considered as a minor corrective rebound (dead cat bounce) within a medium-term downtrend phase in place since September 2022 high of 98.69.
In addition, short-term downside momentum has resurfaced as indicated by the 4-hour RSI oscillator where it is now breaking below key corresponding support at the 44% level after a prior bearish divergence seen at its overbought region.
A break below 89.50 immediate support may expose the next support at 87.80. However, a clearance with a 4-hour close above 90.70 negates the bearish tone for a squeeze up towards the next resistance at 92.80 (swing high areas of 26 January/15/22 February 2022 & close to the key 200-day moving average).