Sample Category Title
USDCAD Rebounds Strongly from April Lows
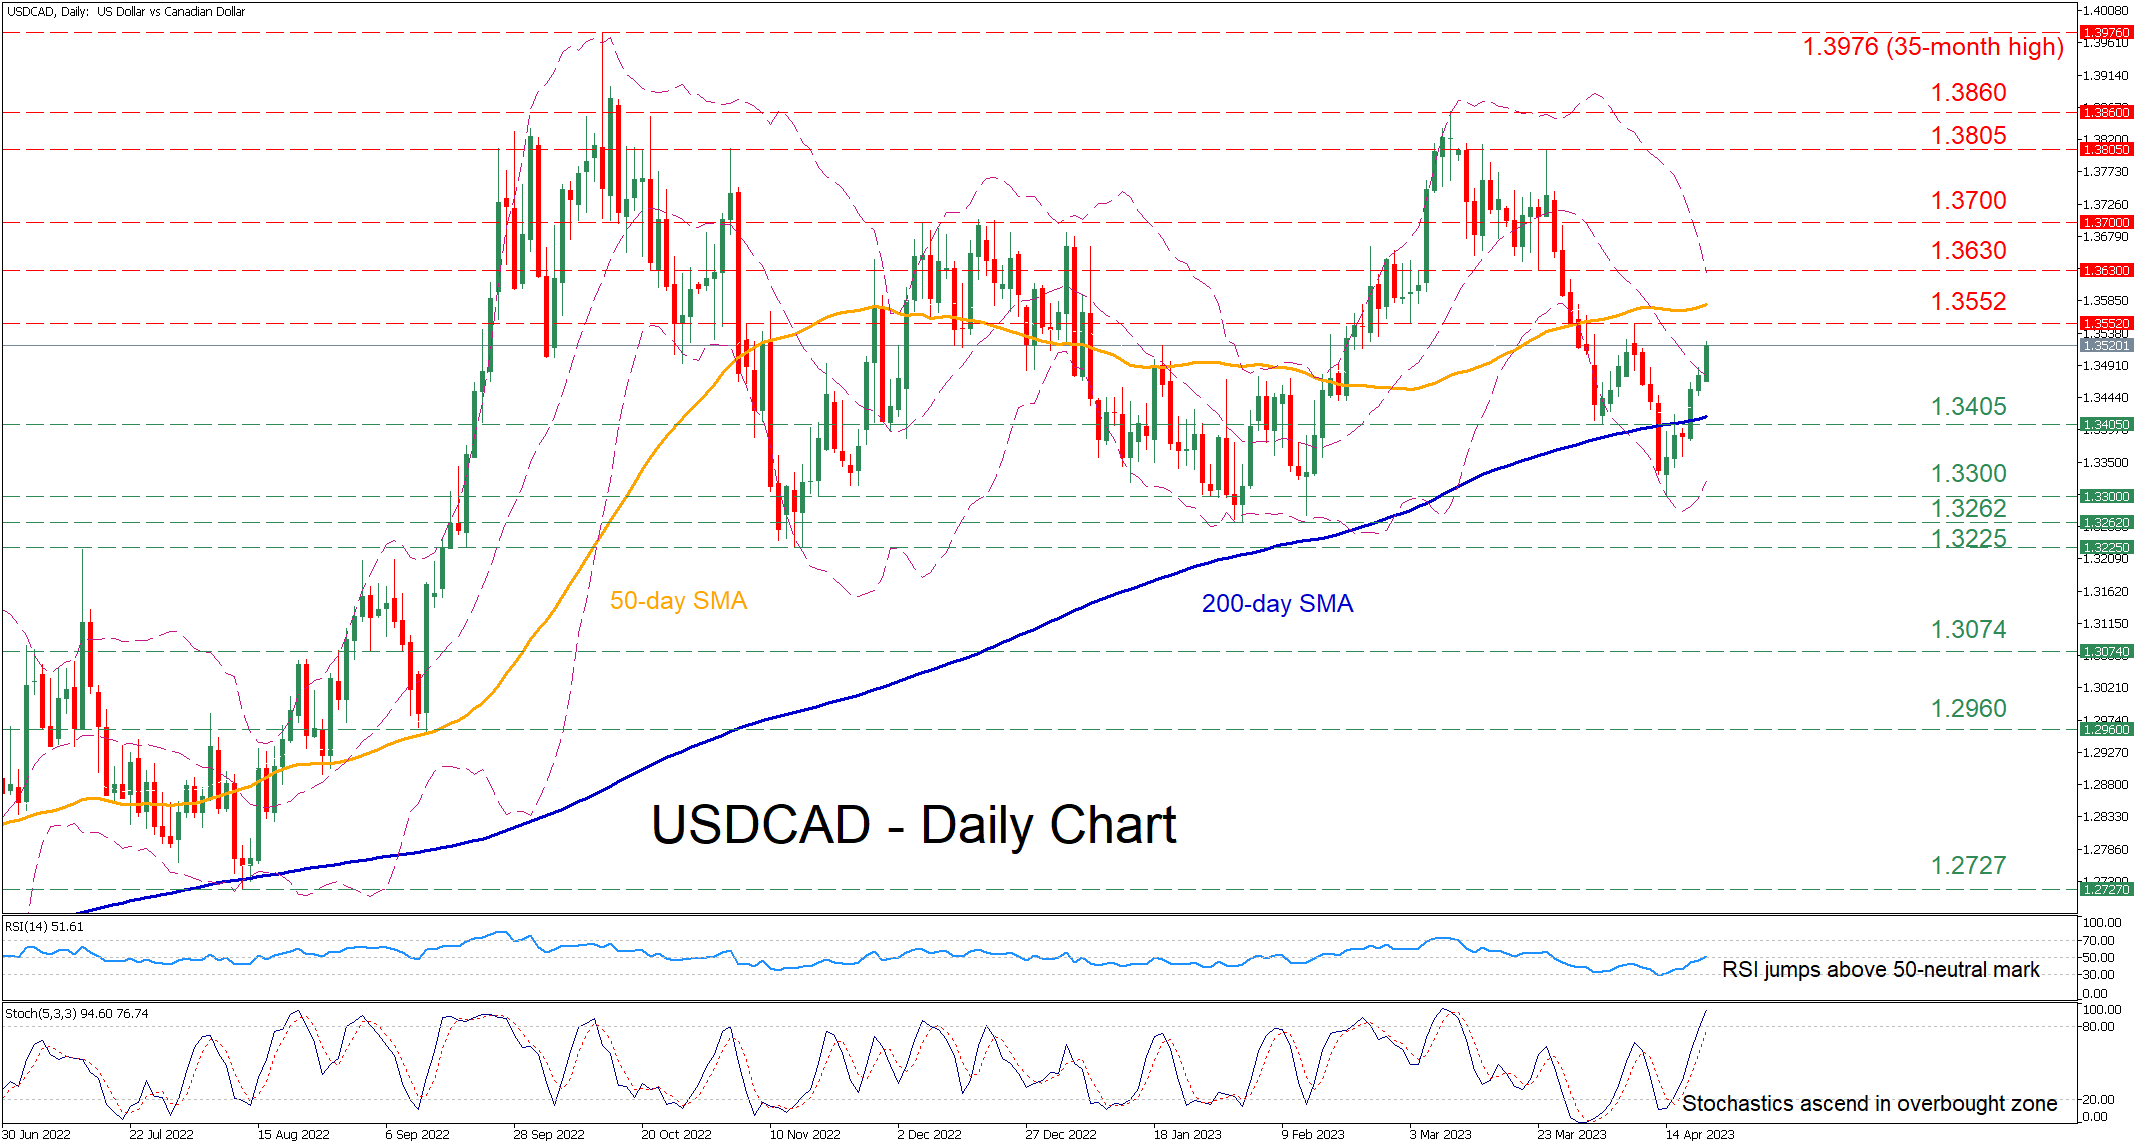
USDCAD had been trending lower after peaking at the 2023 high of 1.3860 in mid-March. However, the pair managed to halt its decline and has been gaining significant ground in the past few daily sessions, jumping above the 200-day simple moving average (SMA).
The momentum indicators currently suggest that bullish forces are intensifying. Specifically, the RSI crossed above its 50-neutral mark, while the stochastic oscillator is ascending in the overbought zone.
Should the rebound resume, initial resistance could be met at the 1.3552 barrier. Violating that region, the price could challenge the March support of 1.3630, which could serve as resistance in the future. Further advances could then cease at the 1.3700 psychological mark that held strong in December 2022.
To the downside, bearish actions could send the price to test the April support of 1.3405, which lies close to the 200-day SMA. If that floor collapses, the April low of 1.3300 might curb the pair’s retreat. Even lower, the 2023 bottom of 1.3262 could provide downside protection.
In brief, USDCAD seems to have temporarily paused its selloff as technical indicators have tilted to the bullish side. Hence, for the rebound to strengthen the pair needs to initially conquer the 50-day SMA, currently around the 1.3580 handle.
WTI Oil Futures on a Slippery Slope Again
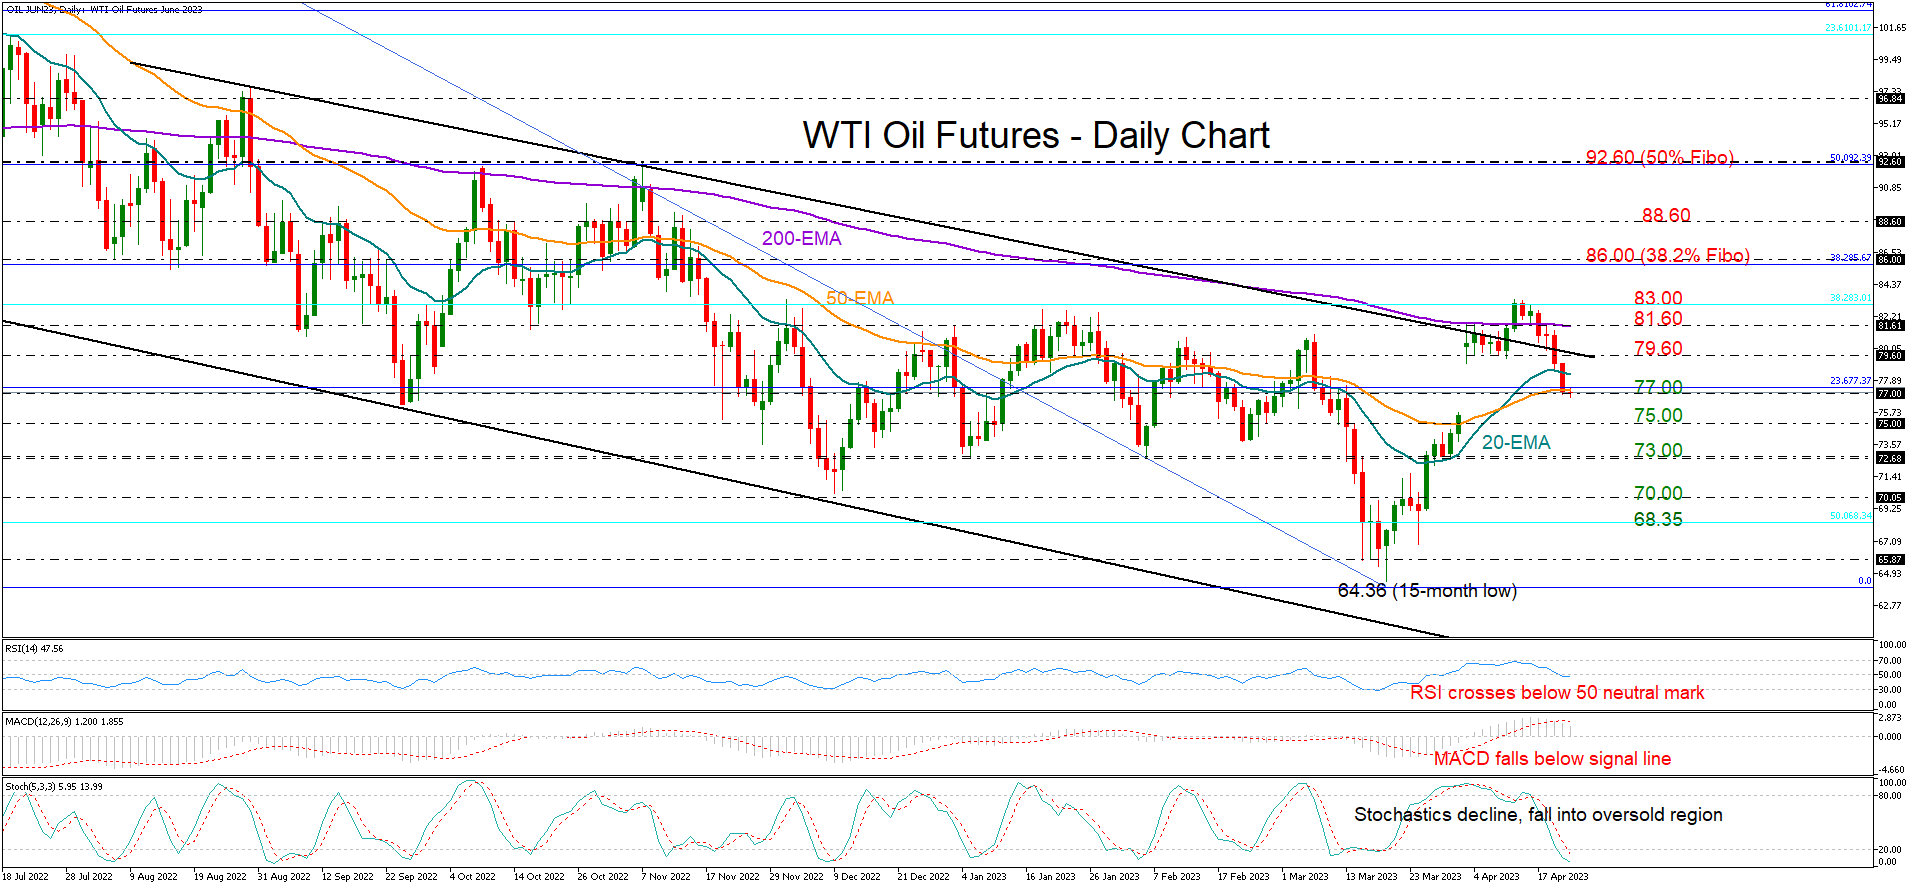
WTI oil futures returned to losses after a whopping continuous 24% rally during the previous four weeks, which lifted the price up to an almost five-month high of 83.37.
Disappointingly, the price has reversed its bullish channel breakout and is currently at risk of another bearish correction beneath the 77.00 number and its 20- and 50-day exponential moving averages (EMAs).
The technical indicators are showing warning signs. Specifically, the RSI has stepped into the bearish area below 50 and the MACD is decelerating below its red signal line, flagging more price weakness ahead. Meanwhile, the negative trajectory in the Stochastic oscillator is favoring the bears as well, though the indicator has already entered the oversold region below 20, suggesting the sell-off may soon find support.
If the bearish scenario materializes, with the price closing below the 77.00 mark, the 75.00 psychological mark may immediately come to the rescue. Otherwise, the decline may intensify towards the key 73.00 region, which is the base of the broad range. Additional losses from here could take a breather somewhere between 70.00 and 68.35, with the latter representing the 50% Fibonacci retracement number of the 2020-2022 uptrend.
On the upside, a step above the 50-day EMA and the 23.6% Fibonacci retracement of the 120.87-64.36 downtrend at 77.35 would shift the focus back to the 79.60-81.60 region formed by the channel’s upper boundary and the 200-day EMA. Yet, only a decisive extension above the crucial 83.00 resistance area, which has been keeping the market in a flat trajectory since the end of December, would bring the bullish outlook back into play. If that happens, the price may advance towards the 86.00 barrier, while higher, the 88.60 zone could be the next hurdle.
To sum up, WTI oil futures may experience more selling in the coming sessions if the price closes below 77.00, with support likely emerging around 75.00. For the bulls to take charge, the market needs a sustainable recovery above the 83.00 ceiling.
XAG/USD: Bulls May Send the Market to 27.927
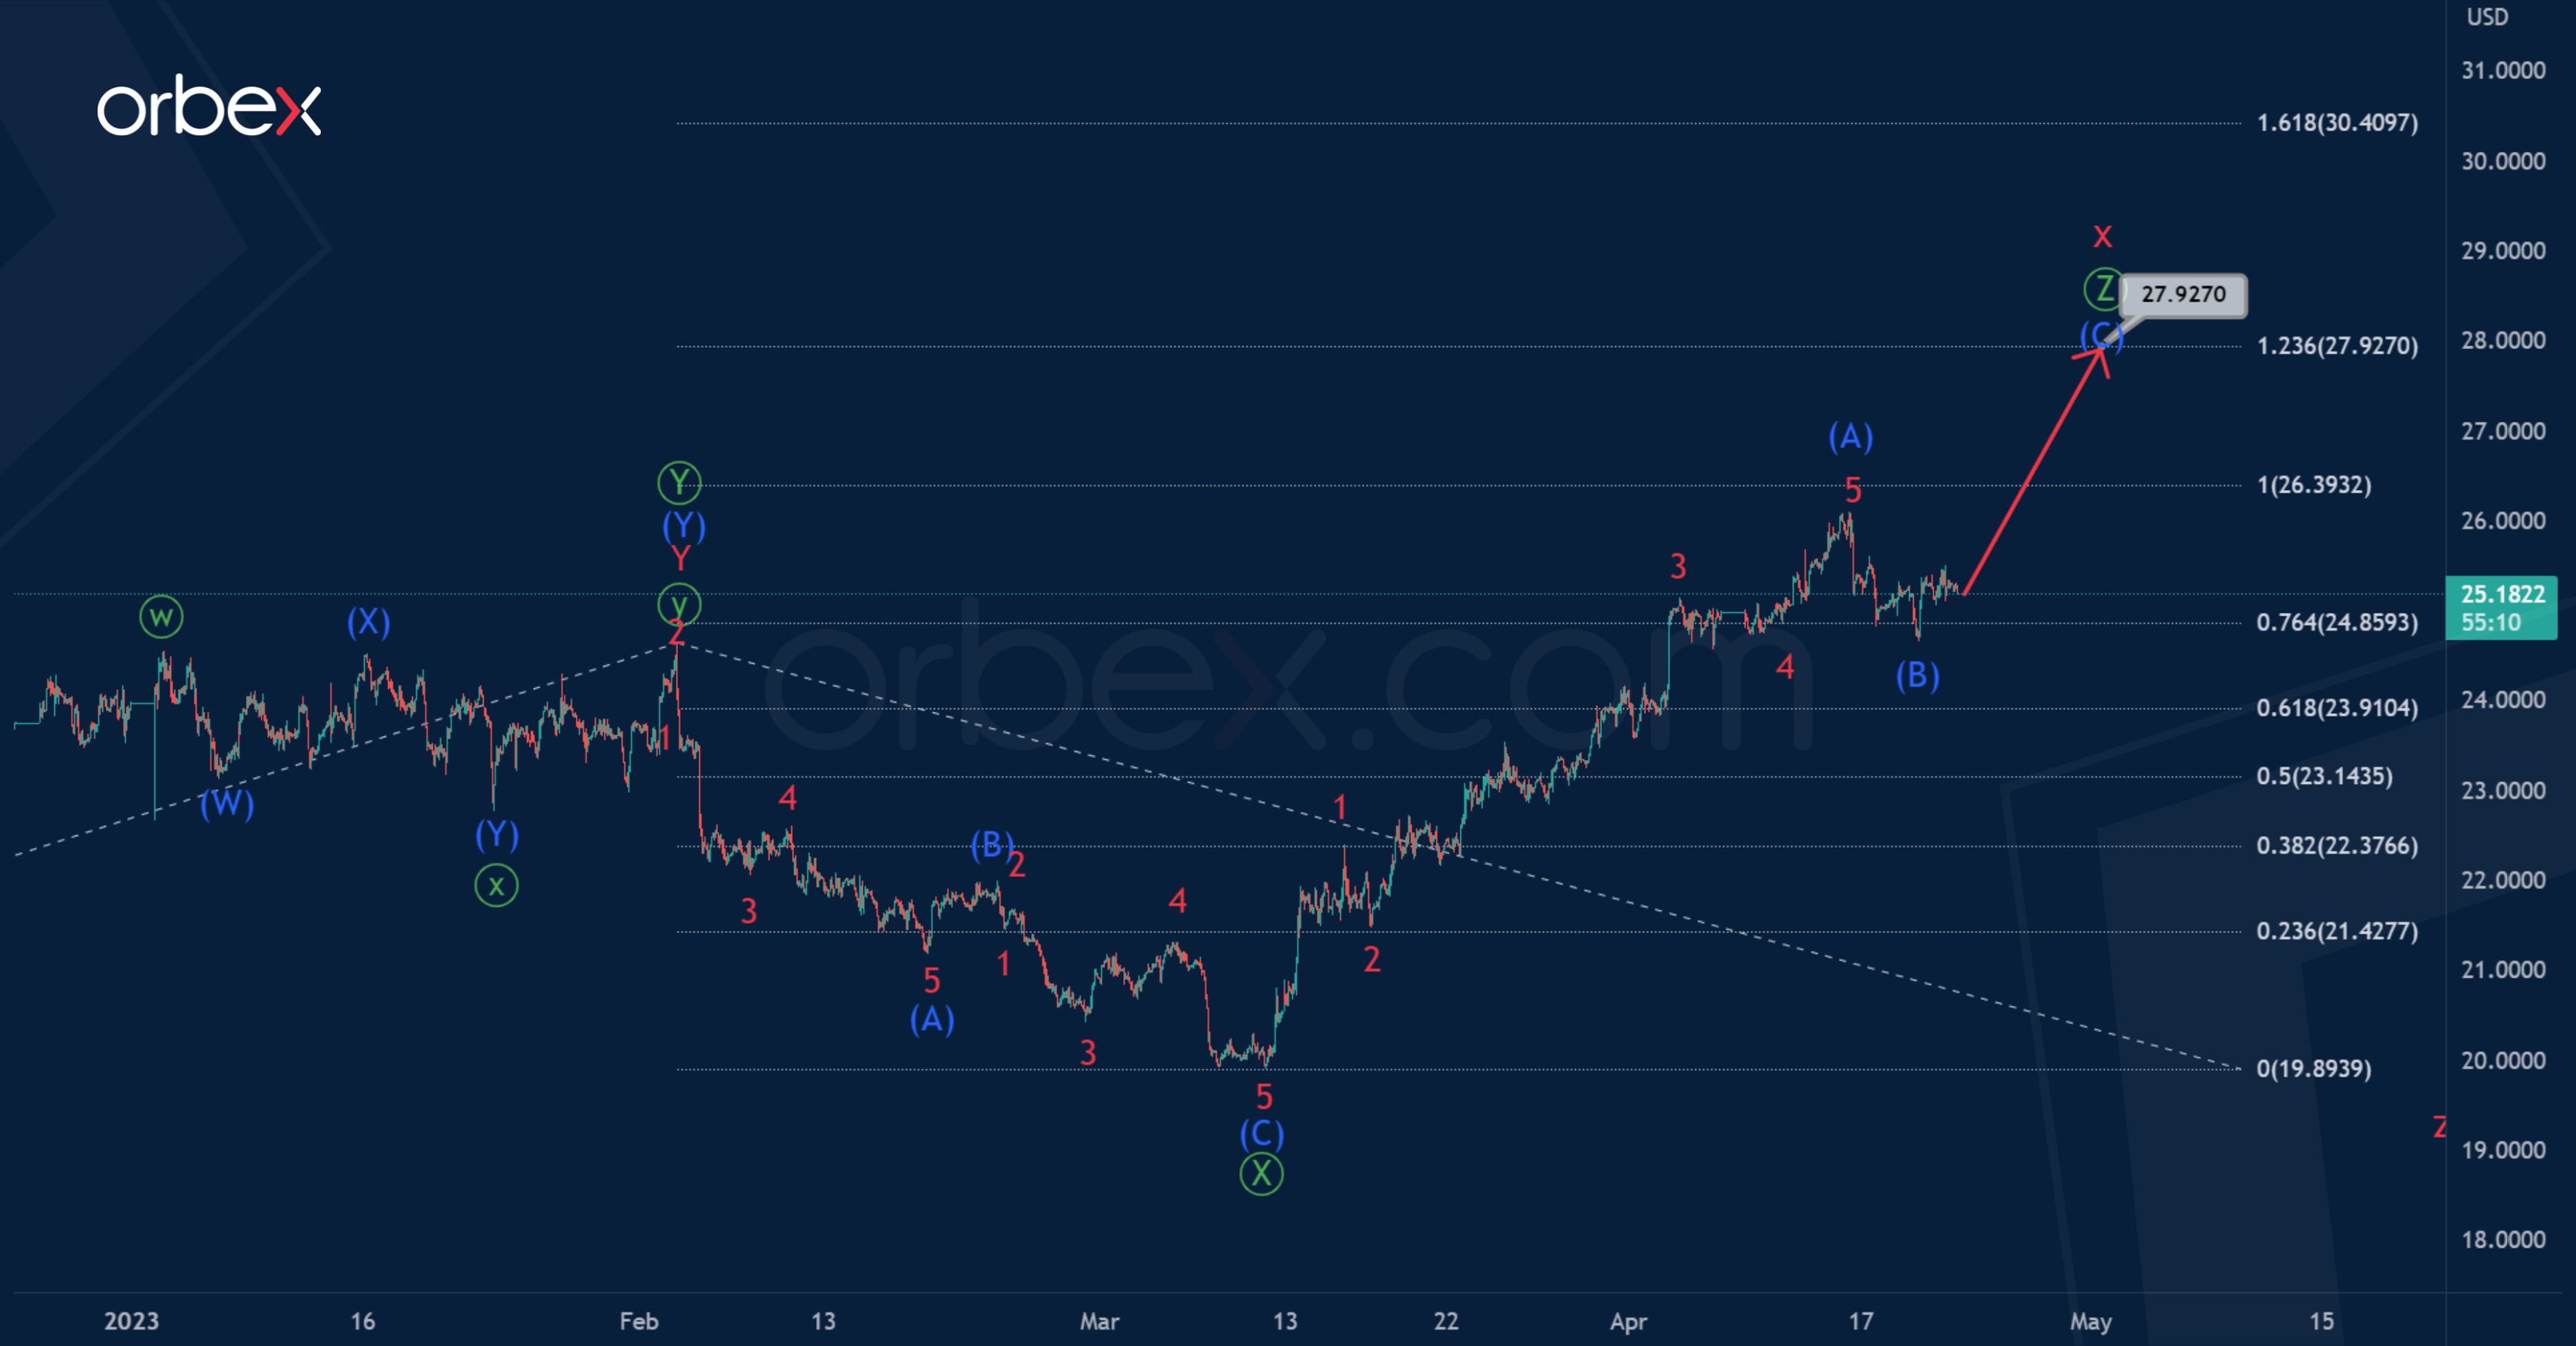
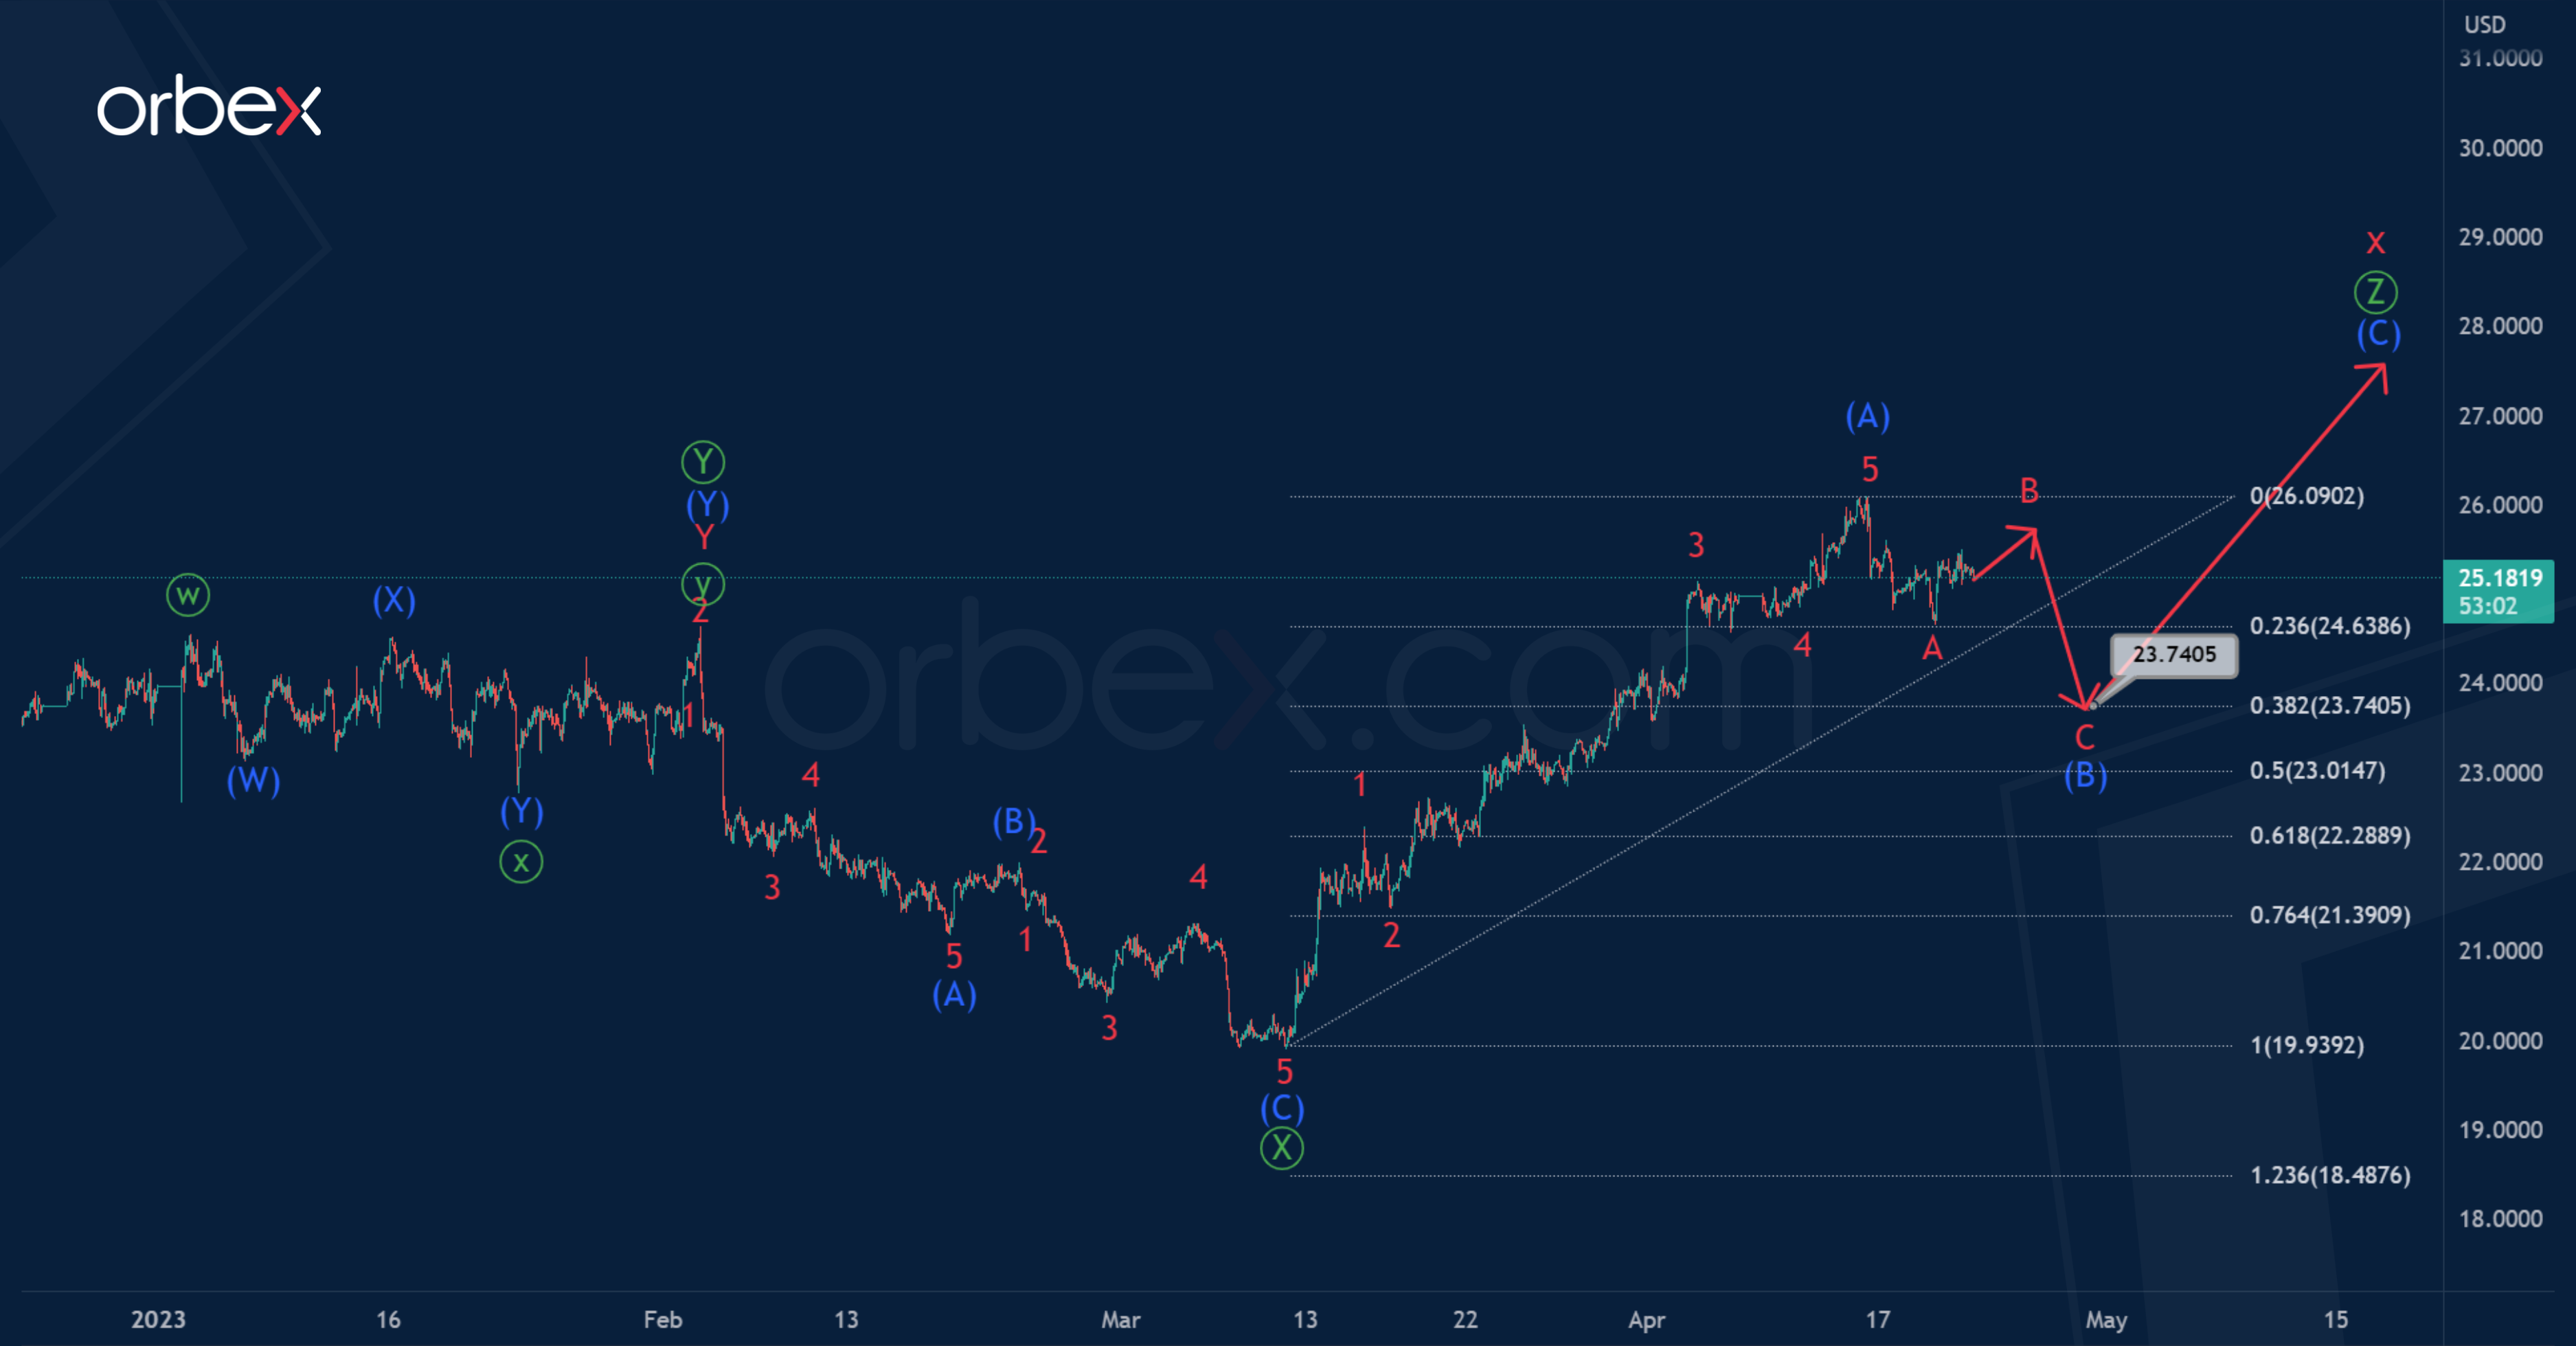
In the long term, Silver is most likely moving inside a corrective trend consisting of cycle waves w-x-y-x-z.
On the 1H timeframe, we see the structure of the second intervening wave x, which may soon be completed, taking the form of a triple zigzag of the primary degree Ⓦ-Ⓧ-Ⓨ-Ⓧ-Ⓩ
By the middle of last month, the bears have finished primary intervening wave Ⓧ, it has the shape of zigzag (A)-(B)-(C).
At the moment, the price may be in the primary wave Ⓩ. Perhaps this wave will be a standard zigzag, where the impulse and correction have already been completed. In the near future, growth is expected in (C) to 27.927.
Alternatively, it is assumed that the intermediate correction (B) has not yet been completed. There is a possibility that it will take the form of a minor zigzag A-B-C.
Only the first impulse wave A looks completed, a slight rise in the second part of correction B is possible in the near future, after which a decrease is expected in the final impulse C.
It is assumed that the intermediate correction (B) will be at 38.2% of impulse (A), and will end near 23.740.
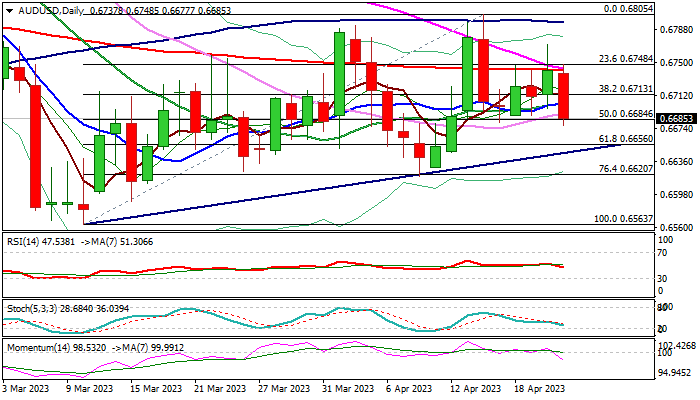
AUD/USD: Aussie Dollar Accelerates Lower on Soured Risk Mode
Australian dollar fell around 0.9% in Asia / early Europe on Friday, deflated by fading risk appetite as US recession fears grow.
The US dollar also regained traction on rising bets for another Fed rate hike in May, despite softer economic data, adding pressure on Aussie dollar.
Fresh weakness emerges after a multiple failure to clearly break above 200DMA (0.6741), with formation of bull-trap and 55/200DMA bear-cross, contributing to negative signals.
In addition, repeated rejections at the base of thick falling daily Ichimoku cloud warn that recovery leg from 0.6563 (2023 low posted on Mar 10) lacks strength to resume.
Daily technical studies are turning to bearish mode as 14-d momentum broke into negative territory, south-heading RSI moved below neutrality zone and thickening descending daily cloud adds pressure.
Fresh bears so far retraced over 50% of 0.6563/0.6805 recovery and eye pivotal supports at 0.6656/44 (Fibo 61.8% / bull-trendline connecting 0.6563 and 0.6619 lows), guarding key 0.6620 level (Apr 10 trough / Fibo 76.4%) loss of which will confirm a double-top (0.6793/0.6805) and risk retest of 0.6563 low.
US Apr PMI data, due later today, will be in focus for fresh signals.
Res: 0.6702; 0.6731; 0.6741; 0.6771.
Sup: 0.6644; 0.6620; 0.6600; 0.6563.
Crude Coming Down to Fill the Gap, Supporting USD/CAD Rally Towards 1.3555
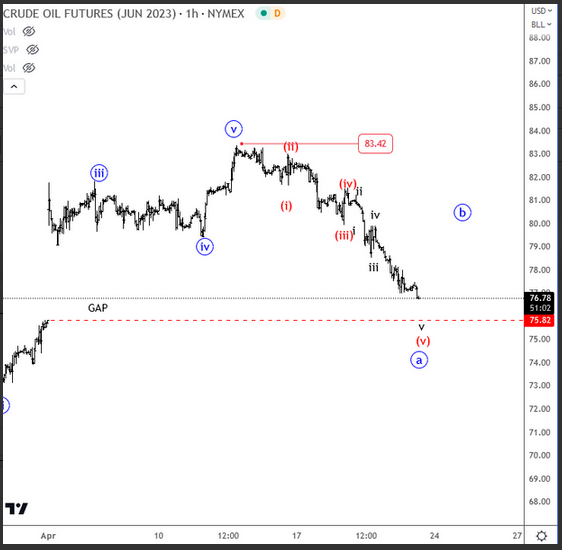
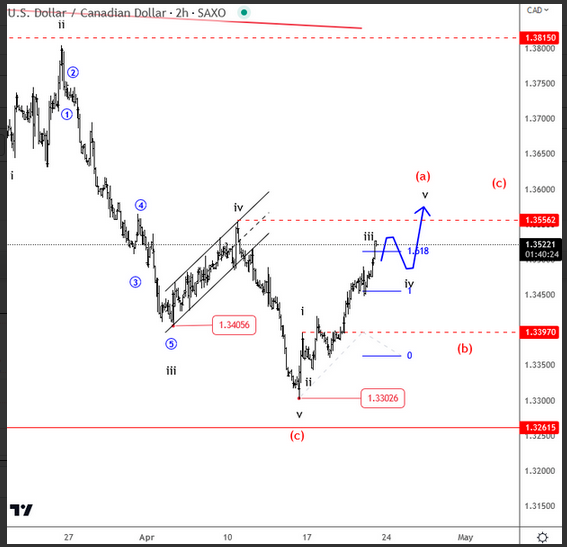
Crude oil is coming down, trying to fill that gap now from early April when Opec decide to cut production to stabilize prices. However, these gaps were expected to be filled at some point so it's not a surprise that price is coming down. But what's important is that once they are filled price can reverse. In our case that can cause a rally up into wave b, for a three-wave recovery minimum, before another leg down "c" shows up. At the same time, it's not a surprise to see USDCAD coming higher, since we know that CRUDE and CAD are positively correlated. USDCAD is seen in impulsive recovery, targeting 1.3555.
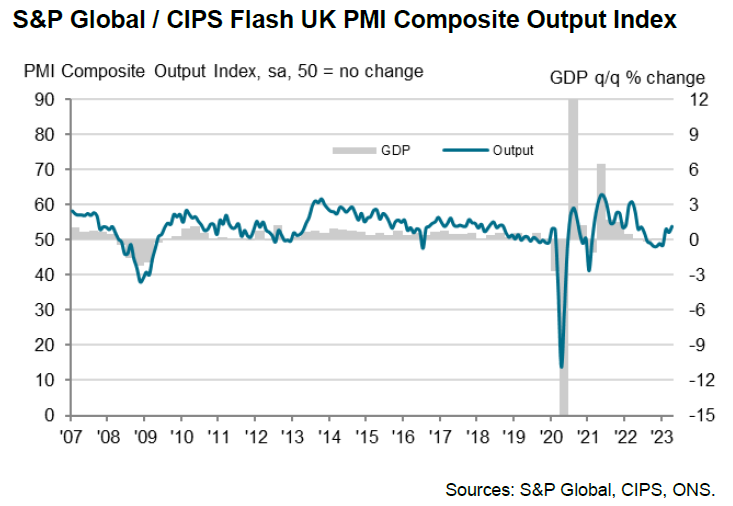
UK PMI composite rose to 53.9, lopsided growth but gained momentum
UK PMI Manufacturing fell from 47.9 to 46.6 in April, a 4-month low. PMI Services jumped from 52.9 to 54.9, a 12-month high. PMI Composite rose from 52.2 to 53.9, also a 12-month high.
Chris Williamson, Chief Business Economist at S&P Global Market Intelligence said:
"Flash PMI surveys signalled an acceleration of economic growth to the fastest for a year in April, building on a modest return to growth in the first quarter of the year.
"Growth is lopsided, however, with surging demand for services contrasting with an ongoing downturn in demand for goods. Even within the service sector, growth is dependent on consumers switching spending from goods to services and a revival of financial services activity, both of which are areas susceptible to the impact of higher interest rates and the ongoing cost of living squeeze. Business services and manufacturing are clearly struggling.
"However, for now the key takeaway is that the economy as a whole is not only showing encouraging resilience but has gained growth momentum heading into the second quarter, the latest PMI reading broadly indicative of GDP rising at a robust quarterly rate of 0.4%.
"Inflationary pressures have meanwhile continued to cool in manufacturing, but price pressures have picked up in services following the resurgence of demand.
"This combination of faster growth and elevated price pressures put a twelfth rate hike by the Bank of England an increasingly done deal when it next meets on 11th May, and will add to speculation that further hikes may be needed."
EUR/USD Daily Outlook
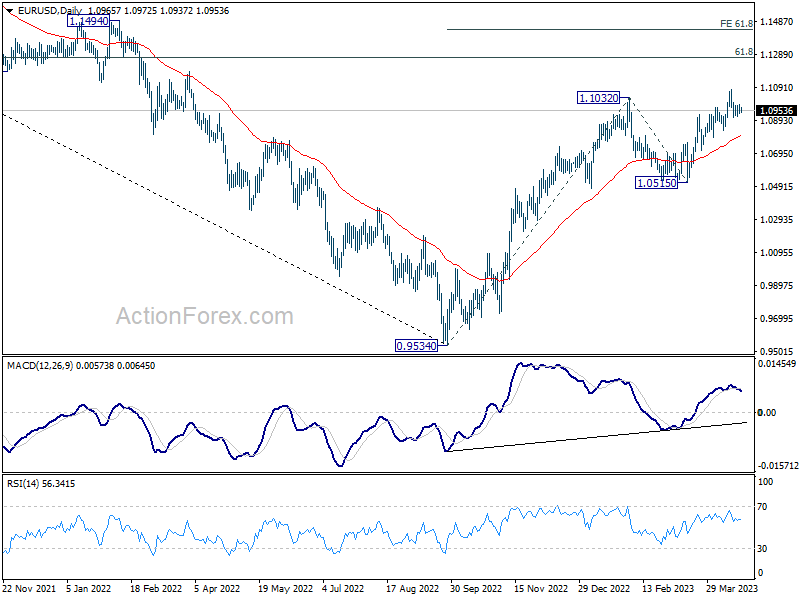
Daily Pivots: (S1) 1.0940; (P) 1.0965; (R1) 1.0996; More...
Intraday bias in EUR/USD remains neutral as consolidation from 1.1075 is extending. Outlook remains bullish with 1.0830 support intact. On the upside, break of 1.1075 will will resume larger up trend to 1.1273 fibonacci level. Break there will target 61.8% projection of 0.9534 to 1.1032 from 1.0515 at 1.1441. However, firm break of 1.0830 will confirm short term topping and bring deeper decline to 1.0711 support instead.
In the bigger picture, rise from 0.9534 (2022 low) is in progress for 61.8% retracement of 1.2348 (2021 high) to 0.9534 at 1.1273. Sustained break there will solidify the case of bullish trend reversal and target 1.2348 resistance next (2021 high). This will now remain the favored case as long as 1.0515 support holds, even in case of deeper pull back.
GBP/USD Daily Outlook
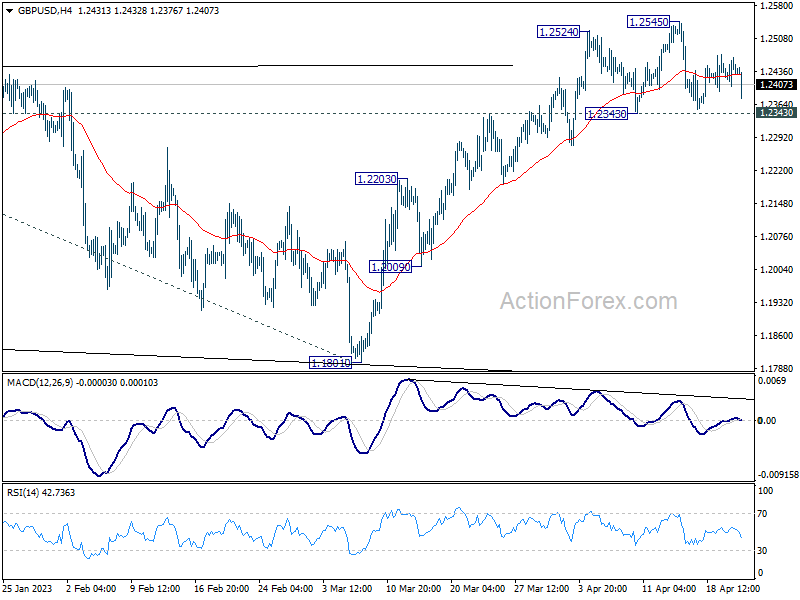
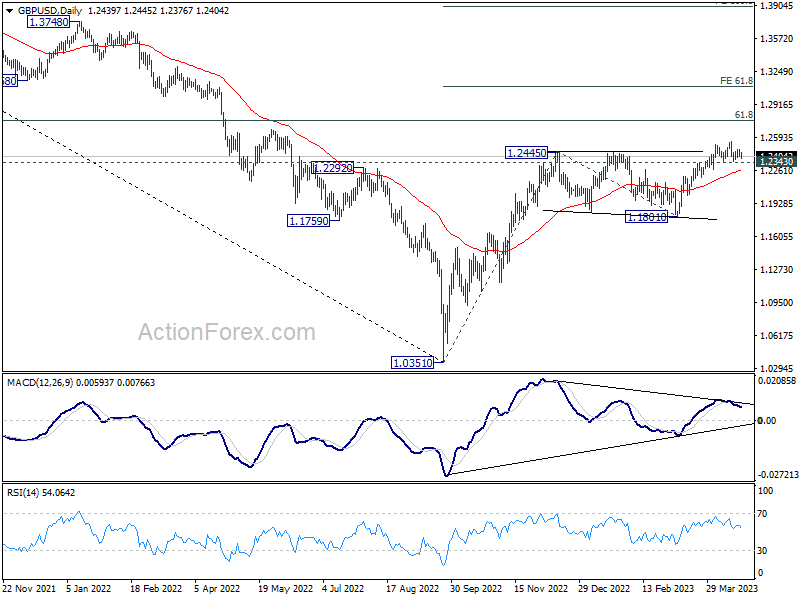
Daily Pivots: (S1) 1.2409; (P) 1.2439; (R1) 1.2472; More...
GBP/USD is still bounded in range below 1.545 and intraday bias stays neutral for the moment. Another rise is in favor with 1.2343 support intact. On the upside, above 1.2545 will target 1.2759 fibonacci level first. Firm break there will target 61.8% projection of 1.0351 to 1.2445 from 1.1801 at 1.3095. However, considering bearish divergence condition in 4H MACD, firm break of 1.2343 will confirm short term topping, and turn bias back to the downside for deeper pullback.
In the bigger picture, the rise from 1.0351 medium term term bottom (2022 low) is in progress for 61.8% retracement of 1.4248 (2021 high) to 1.0351 at 1.2759. Sustained break there will add to the case of long term bullish trend reversal. Further break of 61.8% projection of 1.0351 to 1.2445 from 1.1801 at 1.3095 could prompt upside acceleration to 100% projection at 1.3895. For now, this will remain the favored case as long as 1.1801 support holds, even in case of deep pull back.
USD/CHF Daily Outlook
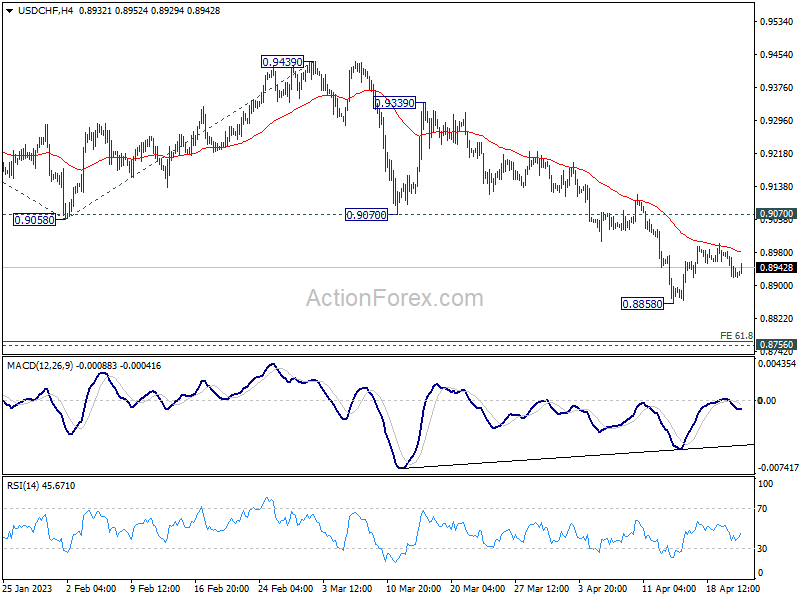
Daily Pivots: (S1) 0.8900; (P) 0.8944; (R1) 0.8967; More...
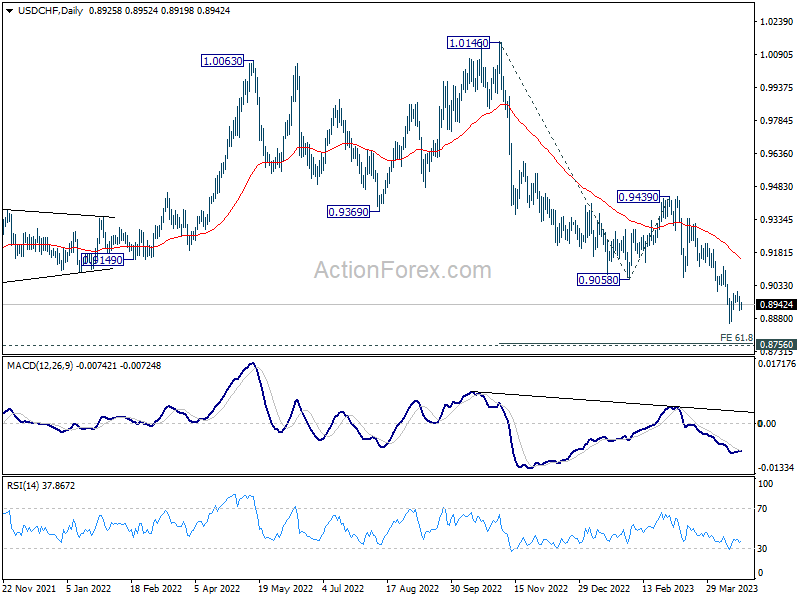
Intraday bias in USD/CHF remains neutral at this point. Another decline cannot be ruled out with 0.9070 support turned resistance intact. On the downside, below 0.8858 will resume the down trend from 1.0146 to 61.8% projection of 1.0146 to 0.9058 from 0.9439 at 0.8767, which is close to 0.8756 long term support. Strong support is expected there to bring rebound, at least on first attempt. On the upside, break of 0.9070 support turned resistance will confirm short term bottoming and turn bias back to the upside.
In the bigger picture, fall from 1.1046 (2022 high) is in progress for 0.8756 support (2021 low). But overall, this fall is still seen as a leg in the long term range pattern from 1.0342 (2016 high). So, downside should be contained by 0.8756 to bring reversal. Sustained break of 0.9058 support turned resistance will be the first sign of medium term bottoming. However, decisive break of 0.8756 will carry larger bearish implications.
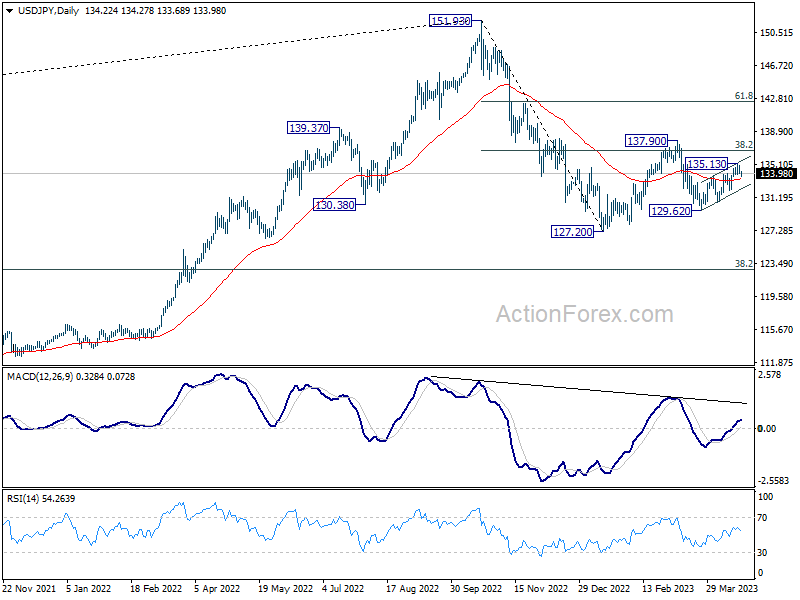
USD/JPY Daily Outlook
Daily Pivots: (S1) 133.85; (P) 134.41; (R1) 134.82; More...
Intraday bias in USD/JPY stays neutral at this point. Some more consolidations could be seen below 135.13. But another rally will remain in favor as long as 132.03 support holds. On the upside, break of 135.13 will resume the choppy rebound from 129.62 towards 137.90 resistance next.
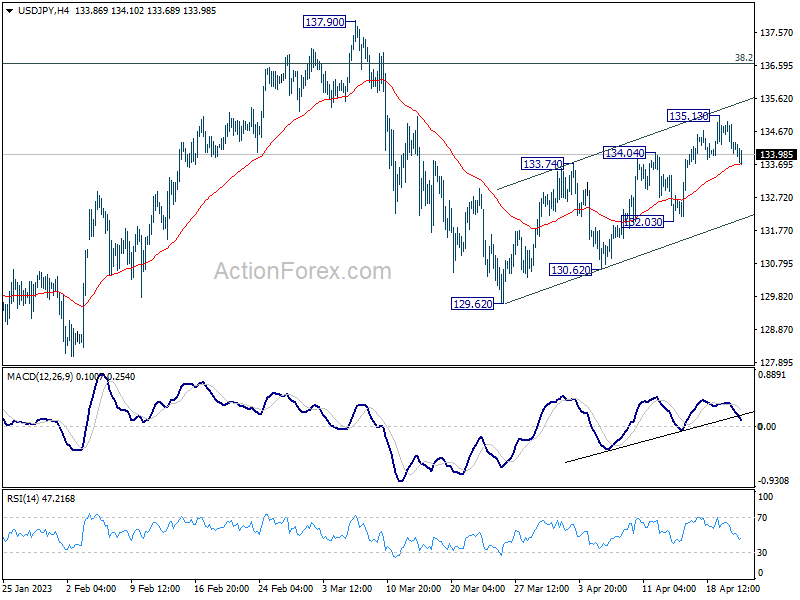
In the bigger picture, corrective pattern from 127.20 might be extending. But after all, down trend from 151.93 is expected to resume at a later stage. Break of 127.20 will resume this down trend and target 61.8% projection of 151.93 to 127.20 from 137.90 at 122.61. This will now be the favored case as long as 137.90 resistance holds.