Sample Category Title
Weekly Focus – PMIs Continue to Show a Two-Speed Economy
Financial markets lacked clear direction this week, although negative sentiment strengthened towards Friday. The recovery in equity markets stalled, while bond yields turned lower. EUR/USD continues to hover near 1.10, but in our latest FX Forecast Update, 19 April, we still see the cross turning lower in H2. April Flash PMIs continued to show a picture of a two-speed economy, with euro area manufacturing index remaining on contractionary territory, but with services sector driving the composite index to a 11-month high (54.4). We think the ECB is more concerned about the latter due to the close link to wage dynamics, and continue to look for a 50bp hike in the May meeting.
Chinese GDP growth surprised to the upside in Q1 at 2.2% q/q. Positively, the recovery was driven by stronger consumer sentiment, illustrated by retail sales rising 10.6% y/y in March. Getting the private consumption engine started is essential for making the recovery more sustained, rather than just stimulus-driven. The release creates some upside risks for our Chinse GDP growth forecast of 5.5% this year.
The political situation around the US debt ceiling remains tense, and the lower-than-expected tax revenues around the April 'Tax Day' this week could suggest that the time for coming up with a resolution is running short. The 'X-date', when the US Treasury will not be able to cover its expenses anymore due to the debt ceiling, could come as early as June. Meanwhile, House Speaker McCarthy presented a proposal for the spending cuts republicans demand in return for supporting a USD 1.5 trillion raise to debt ceiling this week. The proposal did not receive a warm welcome from the senate democrats, with the Majority Leader Schumer saying it has 'no chance of moving forward in senate'. Read our thoughts from Research US - X-date looms closer as 'Tax Day' disappoints, 20 April.
Japanese inflation came out largely in line with expectations. Consumer prices excl. fresh food rose by 3.1% y/y in March, but excluding energy as well, inflation continued to accelerate to 3.8% y/y - the fastest since 1980s. Next week, we do not expect Bank of Japan to make changes to their monetary policy in the meeting ending on Friday, even if we think BoJ is still moving towards loosening the grip on the yield curve. BoJ likely wants confirmation on broad based wage hikes before they move at the June or July meeting.
We expect Rikbank to hike rates by 50bp, read more in the Nordic section below.
On the data front, Q1 flash GDP figures will be released from the euro area and the US. In the euro area, we look for a decline of -0.1% as a strong rebound in private consumption is not yet in sight. We also get Ifo (Monday) and EU Commission sentiment indicator (Thursday), which will give more insights how the economy started into Q2. German CPI figures on Friday will also be watched closely by the market, especially for signs of moderating underlying inflation pressures ahead of ECB's May meeting.
US GDP likely continued its modest recovery in Q1, supported by brisk consumer spending especially in the first two months of the quarter. We look for +0.8% q/q AR, although risks are likely to the upside given that the economy still appears resilient to the banking sector uncertainty, which began in March.
Cliff Notes: RBA Review Received as China’s Economic Strength Shines Bright
Key insights from the week that was.
Monetary policy remained centre stage across the world this week, but particularly in Australia as the RBA Review and April Board meeting minutes were released.
The April RBA meeting minutes highlight the Board’s preference for optionality. As detailed by Chief Economist Bill Evans, the “case for an increase is much stronger than was the case for the April meeting”, with the Board members noting: “the forecasts produced by the staff in February had inflation returning to target range only by mid-2025 and that it would be inconsistent with the Board’s mandate for it to tolerate a slower return to target”; these “forecasts were conditioned on monetary policy being tightened a little further”. The Board also raised some new risks, in particular: that the current strength in population growth “could put significant pressure on Australia’s existing capital stock, especially housing, which would in turn manifest in higher consumer prices”; and there was “increased risk of larger wage increases in parts of the economy, including the public sector”. Also critical to the decision in May will be next week’s Q1 CPI report. Westpac remains of the view that, while moderating, another high annual inflation print in Q1 warrants one further 25bp hike in May to 3.85% after which the cash rate will be left on hold until early-2024 to quell lingering risks.
Subsequent to the minutes, the Government commissioned RBA Review was publicly released and commented on by RBA Governor Lowe. ‘An RBA fit for the Future’ “analyses the RBA’s performance over the past 30 years and makes recommendations on the monetary policy framework, governance, leadership and culture of the RBA”. Many of the recommendations are significant, albeit with the detail and timing still to be worked through. Chief Economist Bill Evans’ note discusses the implications for policy setting.
Ahead of Australia’s Q1 CPI next week, New Zealand’s latest update (pleasingly) disappointed market and RBNZ expectations for a second-consecutive quarter, printing at 1.2%, 6.7%yr (from 7.2%yr at December). Individual items showed considerable volatility. But measures of underlying momentum steadied or eased back in Q1. Our NZ economics team remains of the view that inflation won’t be back below 3.0%yr until the second half of 2024. The RBNZ is therefore seen hiking by 25bps at the May meeting to a cycle peak of 5.50% to be held until mid-2024.
Of the data from further afield, China’s Q1 GDP release and associated partial data was most significant. At 2.2%, the Q1 gain was strong but broadly in line with expectations. However, Q4 2022’s outcome was revised up from 0.0% to 0.6%, seeing the annual rate at 4.5%yr at March 2023 versus the market’s expectation of 4.0%. We remain of the view that GDP growth will continue to outperform during 2023, coming in above 6.0%yr – a rate materially above authorities’ guidance and current market estimates. The primary support for this view from the March data round is the building strength in consumer spending, year-to-date retail sales growth jumping from 3.5%yr in February to 5.8%yr in March. Although property investment disappointed, likely as a result of the limited pipeline of work to be done on existing projects, residential property sales created confidence in the outlook for 2023 and beyond, year-to-date growth accelerating from 3.5%yr in February to 7.1%yr in March. That new home prices look to have based and are now rising points to further near-term momentum in activity, particularly given the robust health of household wealth and income. In our view, the momentum apparent in China’s domestic economy along with their exposure to Asia will well and truly offset the negative influence of weakening developed-world demand, setting China apart from other major economies in 2023 and beyond.
Turning to the US, data has been light this week and concentrated on housing. Starts and permits remained volatile in March as they were caught between tight financial conditions and a lack of new housing supply. Existing home sales meanwhile disappointed falling 2.4%, although it remains unclear whether demand or supply is the prime influence.
Arguably of greatest significance for US monetary policy however was the release of the latest Beige Book, covering conditions across the 12 Federal Reserve districts. Broadly this update suggests the US economy is stagnating and that labour market slack is building, weighing on wage growth and easing risks related to inflation. Also critical for policy into 2024, “Several Districts noted that banks tightened lending standards amid increased uncertainty and concerns about liquidity”.
Together with the sanguine inflation data received last week, these observations point to little need for further action by the FOMC to tame inflation. The economy arguably instead needs an extended period of stable contractionary policy to allow remaining inflation risks to abate and consumer expectations to reset without heightened fears over economic activity. However, we also need to be aware of the mindset of FOMC members, many of whom continue to reference a need for a further marginal increase in the policy rate, which the market is taking to mean another 25bp hike at or before the June meeting. Whereas FOMC members argue policy will then remain on hold for a lengthy period, the market has approximately 75bps of rate cuts priced by January 2024. This view speaks to the downside risks that are building for activity given the already contractionary stance of monetary policy and the tightening of financial conditions occurring through the US banking system.
Nikkei 225 Wave Analysis
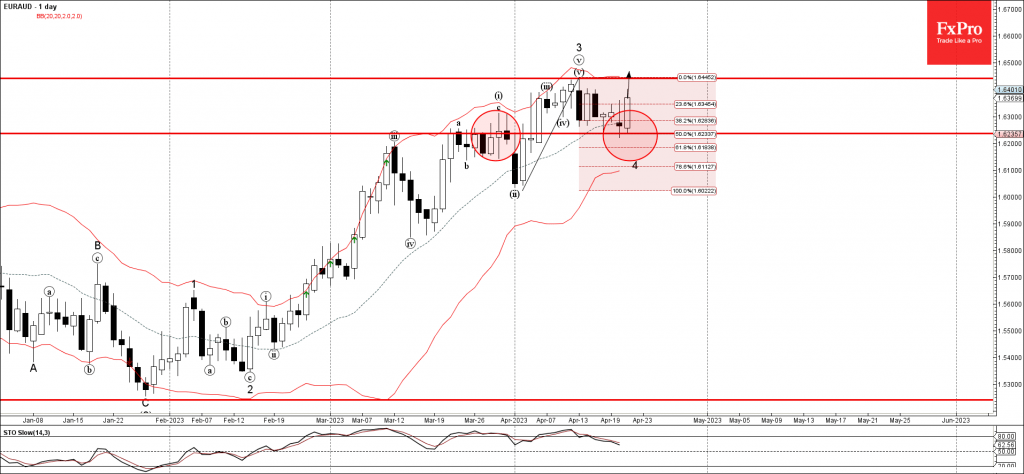
- Nikkei 225 reversed from resistance level 28645.00
- Likely to fall to support level 28250.00
Nikkei 225 index recently reversed down from the long-term resistance level 28645.00 (which has been steadily reversing the price from August of 2021).
The resistance level 28645.00 was strengthened by the upper daily Bollinger Band.
Given the strength of the resistance level 28645.00 and the overbought daily Stochastic, Nikkei 225 index can be expected to fall further toward the next support level 28250.00.
CADJPY Wave Analysis
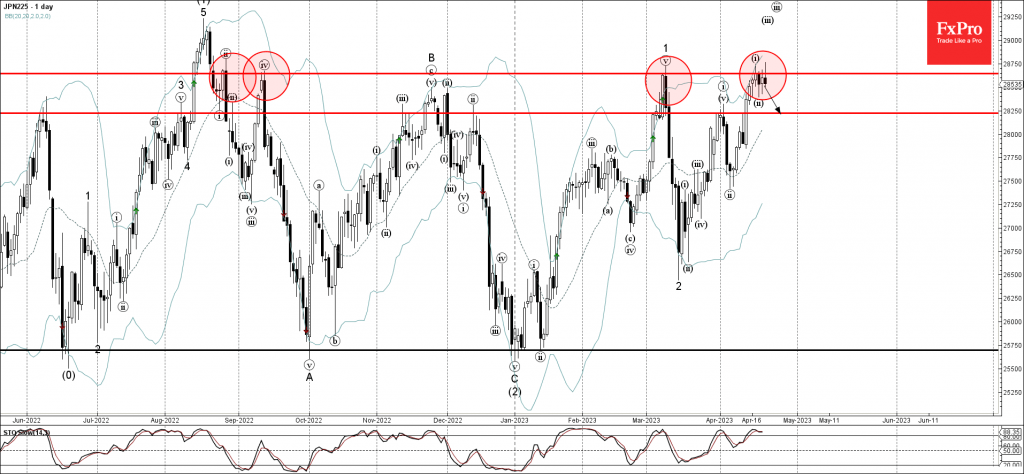
- CADJPY reversed from resistance level 100.50
- Likely to fall to support level 98.00
CADJPY currency pair recently reversed down from the pivotal resistance level 100.50 (which has been reversing the price from the middle of December) coinciding with the upper daily Bollinger Band and the 38.2% Fibonacci correction of the downward impulse from October.
The downward reversal from the resistance level 100.50 stopped the previous minor ABC correction 2.
Given the strong daily downtrend, CADJPY can be expected to fall further toward the next support level 98.00.
EURAUD Wave Analysis
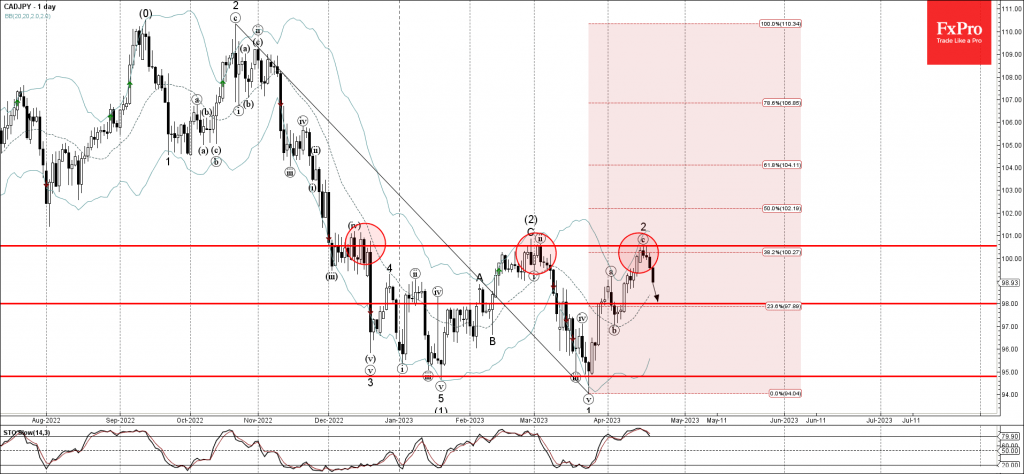
- EURAUD reversed from support level 1.6235
- Likely to rise to resistance level 1.
EURAUD currency pair recently reversed up from the support level 1.6235 (former resistance from March) coinciding with the 20-day moving average and the 50% Fibonacci correction of the upward impulse from March.
The upward reversal from the support level 1.6235 created the weekly Japanese candlesticks reversal pattern Morning Star.
Given the clear daily uptrend, EURAUD can be expected to rise further toward the next resistance level 1.6440 (top of the previous impulse wave 3).
Japan Inflation: Higher Than Expected But Slowing
Consumer price inflation in Japan is in no hurry to slow down. In March, prices rose 3.2% y/y, compared with 3.3% in February and an expected 2.6%.
The core price index excludes food and energy but has not yet peaked, reaching 3.8% y/y from 3.5% the previous month. The last time core inflation was this high in Japan was in 1981. Worse, this index has risen by 0.6% in just one month without any visible slowdown, as we see in most developed countries.
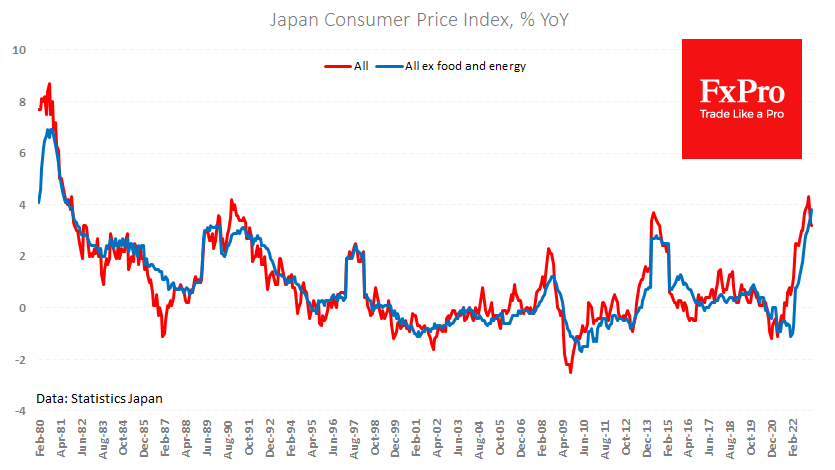
However, the situation calls for patience rather than immediate intervention. The Corporate Goods Price index slowed to 7.2% YoY in March, down from 8.3% in February and a peak of 10.6% in December. We will see the Corporate Service Price Index next Tuesday, but the February pace was 1.8%, well within the inflation target.
For forex traders, higher-than-expected inflation is often a reason to buy currencies (in our case, sell USDJPY). However, with the overall growth rate in consumer and producer prices have peaked without active intervention from the BoJ, we should not expect the central bank to warm to raising interest rates now.
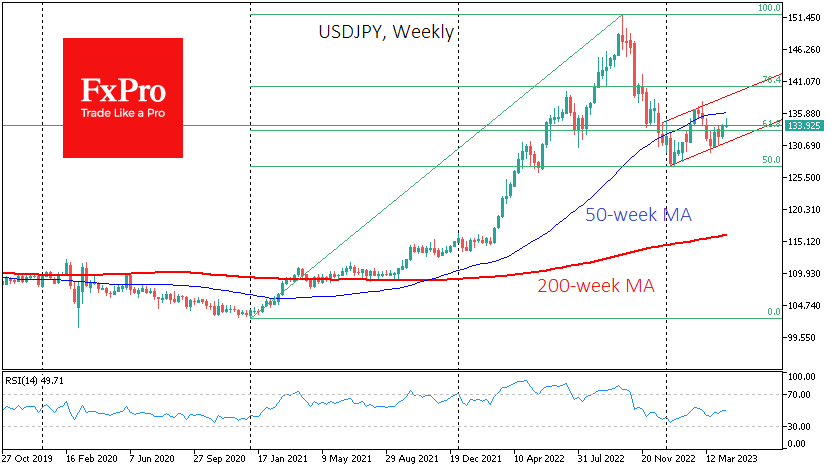
This interest rate differential between Japan and the rest of the world is working against the Yen.
From October 2022 to January 2023, the USDJPY gave back 50% of its rally from January 2021. Since then, the pair has returned to the upside. And we expect this moderate uptrend to prevail until interest rate cuts begin in the US and Europe.
Canada: Retail Sales Post a Moderate Decline in February
Retail sales fell by 0.2% month-on-month (m/m) in February – a shallower decline than 0.6% loss reported by the Statistics Canada's advanced estimate. January's print remained unrevised at a 1.4% gain.
Adjusting for the impact of inflation, the decline in volume of sales was even more pronounced at 0.7% m/m.
The decline in today's headline reading was largely driven by receipts at gasoline stations, which lost 5.0% m/m due to prices at the pump. In volume terms, sales at gasoline stations decreased 4.9% m/m – reversing three months of gains .
Offsetting some of these losses, sales at motor vehicle and parts dealers rose for the seventh month in a row, up 0.9% m/m. That is a step down from a 3.0% gain in January.
Excluding sales of autos and gasoline, core retail sales were 0.1% m/m higher in February.
- The gain in core sales was led by higher sales at clothing & accessories stores (+4.4% m/m), followed by strong performance at health & personal care (+1.1% m/m) and furniture & home furnishings stores (+1.1 % m/m). Sales at electronics and appliance stores (+1.3% m/m) and building material, garden equipment & supplies dealers (+0.2% m/m) were also positive.
- Meanwhile, miscellaneous store retailers (-2.3% m/m), general merchandise retailers (-1.6% m/m), food and beverage stores (-0.2% m/m) and sporting goods, hobby items, musical instruments and books stores (-0.2% m/m) were the biggest underperformers.
- E-commerce sales, which are not included in the headline tally, were up a whopping 7.8% on the month in February.
- Statistics Canada's advanced estimate for March indicates a 1.4% m/m decline. In contrast, our internal card spending data (which excludes auto sales and tilts toward housing-related categories) points to a moderate increase in retail sales.
Key Implications
The decline in retail sales has been expected as the boost from one-time government transfers, such as daycare subsidies and several one-off provincial inflation relief programs, continues to wane. One category that stands out is auto sales, which have been supported by relatively strong pent-up demand. But even here, growth is slowing as higher borrowing costs worsen affordability, especially as mortgage costs continue to creep higher.
Looking one month ahead, Statistics Canada expects a more pronounced decline in retail trade in March. The recent Survey of Consumer Expectations for the first quarter of 2023 suggests that consumers are expecting to spend less on discretionary items. That said, our internal high-frequency data points to a moderate gain in total spending in March and that puts our tracking for consumer spending slightly above 4% (annualized) in Q1 2023.
Sunset Market Commentary
Markets
The EMU composite PMI for April rose from 53.7 to 54.4, indicating that growth momentum in the region improved further at the start of the second quarter. However, growth has become increasingly unbalanced. The headline manufacturing PMI unexpectedly declined from 47.3 to 45.5. The services headline measures improved further from 55 to 56.6. According to S&P global, the outperformance of the services sector relative to manufacturing was the widest since early 2009. Overall orders growth improved, but this also masked a decline in manufacturing being more than counterbalanced by rise in services orders. Employment growth slowed in manufacturing but accelerated to the fastest pace since 2007 for services. Similar narrative for price trends as manufacturing input costs declined while services costs continued to raise sharply. Average prices charged for goods and services continued to rise at a pace above the long-term average. The reaction on European interest rate markets initially was remarkably moderate. European yields swapped a minor decline for a small daily rise. Even so, the ongoing rise in EMU services costs (wages) and final prices for consumers suggests persistent core inflation. The internal debate within the ECB MPC is ongoing with April CPI data and the ECB lending survey to published early May providing key data evidence. That said, we consider the current pricing of a 30% chance of a 50 bps hike rather than a 25 bps a steps being an ‘underpricing’. US bonds outperformed Europe going into the release of the US PMI’s. However, the US manufacturing PMI (50.4 from 49.2) as well as the services gauge (53.7 from 52.6) surprised on the upside. The impact of the ‘financial instability’ in March apparently stays limited for now. US yields after the releases try to erase negative daily prints (2-3-bps higher). German yields still take the lead gaining 4/5 bps. Equities again show no clear trend today. The Eurostoxx 50 trades marginally higher (0.2%). US indices also opened mixed/little changed. The break lower of the oil price slowed after two days of sharp losses (Bent $81.50/b).
On FX markets, EUR/USD after a brief dip early in Europe, currently trades little changed (at 1.096). DXY (101.7) lost a few ticks in a daily perspective. The yen outperformed going into the US PMI but currently rebounds to 134.3.(from 133.6 earlier today). This morning’s softer than expected UK retail sales were the trigger from quite a striking underperformance of sterling. EUR/GBP rallied from the 0.882 area to currently trade near 0.8855. UK PMI’s brought a similar message as was the case in EMU (manufacturing easing from 47.9 to 46.6, services gaining from 52.9 to 54.9). The report initially didn’t change the intraday dynamics.
News & Views
French finance minister Le Maire said the electricity price caps will remain in place beyond 2023, arguing that power prices haven’t normalized yet. The cap will likely be phased out over a two-year period by 2025. Prices soared in the wake of the Russian invasion, as did those for natural gas. But because the latter have lowered significantly in recent months, Le Maire said it will remove gas price caps at the end of 2023. Dutch TTF gas futures today trade below €41/MWh, around the lowest since July 2021.
China’s central bank hinted that it may start to gradually withdraw some of the stimulus measures introduced during the pandemic. Zou Lan, head of the monetary policy department said that most of the structural tools introduced were temporary in nature and will fade out as the economy begins recovering and credit demand picks up. These structural tools include relending programs and target specific areas of the economy. They were increasingly relied on to deliver economic stimulus rather than the blunt conventional measures such as the PBOC’s one-year policy loans and the reserve requirement ratio. The rates of the loans offered by the central bank often carried interest rates at around 1.75%, lower than the one-year policy rate of currently 2.75%.
EUR/USD Mid-Day Outlook
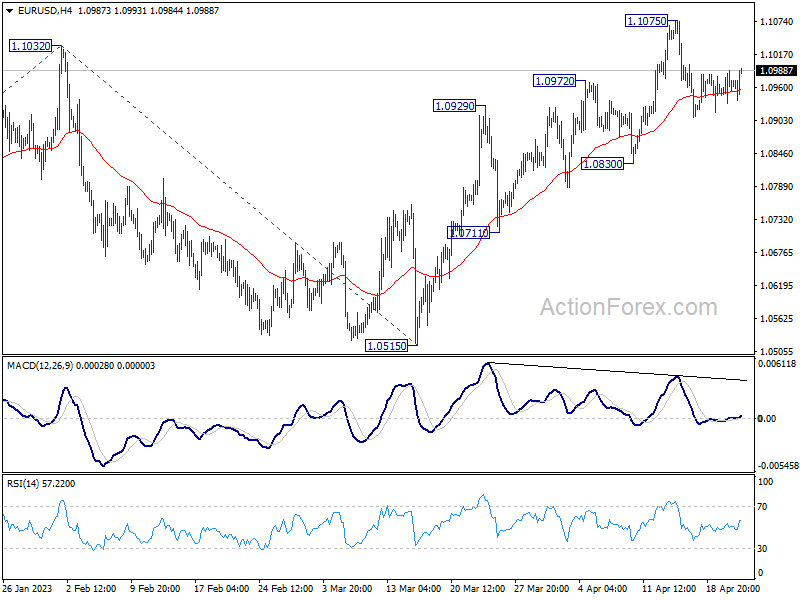
Daily Pivots: (S1) 1.0940; (P) 1.0965; (R1) 1.0996; More...
EUR/USD is staying in sideway trading below 1.1075 and intraday bias remains neutral. Outlook remains bullish with 1.0830 support intact. On the upside, break of 1.1075 will will resume larger up trend to 1.1273 fibonacci level. Break there will target 61.8% projection of 0.9534 to 1.1032 from 1.0515 at 1.1441. However, firm break of 1.0830 will confirm short term topping and bring deeper decline to 1.0711 support instead.
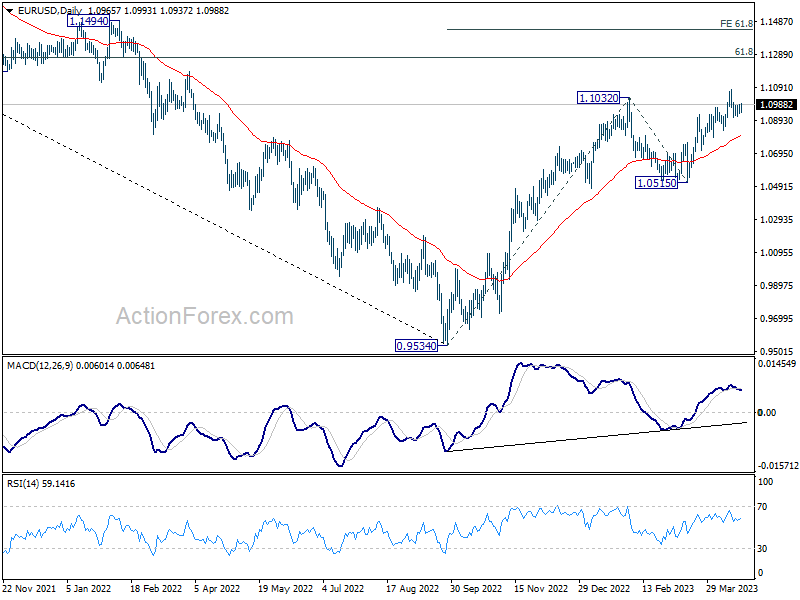
In the bigger picture, rise from 0.9534 (2022 low) is in progress for 61.8% retracement of 1.2348 (2021 high) to 0.9534 at 1.1273. Sustained break there will solidify the case of bullish trend reversal and target 1.2348 resistance next (2021 high). This will now remain the favored case as long as 1.0515 support holds, even in case of deeper pull back.
GBP/USD Mid-Day Outlook
Daily Pivots: (S1) 1.2409; (P) 1.2439; (R1) 1.2472; More...
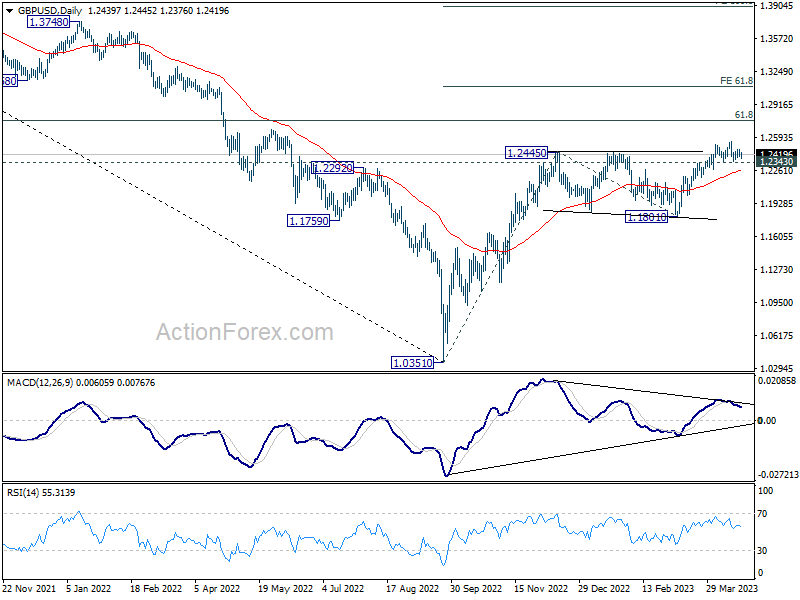
Intraday bias in GBP/USD remains neutral as sideway trading continues below 1.2545. Another rise is in favor with 1.2343 support intact. On the upside, above 1.2545 will target 1.2759 fibonacci level first. Firm break there will target 61.8% projection of 1.0351 to 1.2445 from 1.1801 at 1.3095. However, considering bearish divergence condition in 4H MACD, firm break of 1.2343 will confirm short term topping, and turn bias back to the downside for deeper pullback.
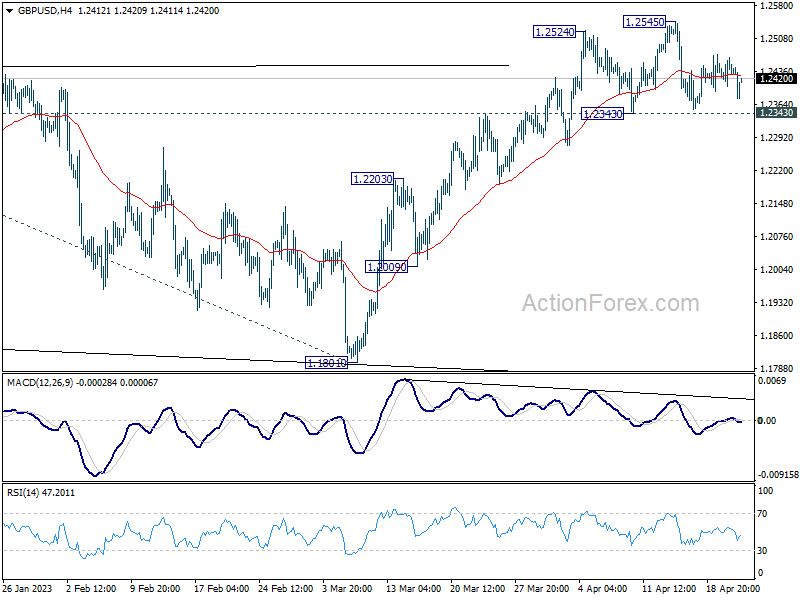
In the bigger picture, the rise from 1.0351 medium term term bottom (2022 low) is in progress for 61.8% retracement of 1.4248 (2021 high) to 1.0351 at 1.2759. Sustained break there will add to the case of long term bullish trend reversal. Further break of 61.8% projection of 1.0351 to 1.2445 from 1.1801 at 1.3095 could prompt upside acceleration to 100% projection at 1.3895. For now, this will remain the favored case as long as 1.1801 support holds, even in case of deep pull back.