Sample Category Title
Technical Outlook and Review
DXY:
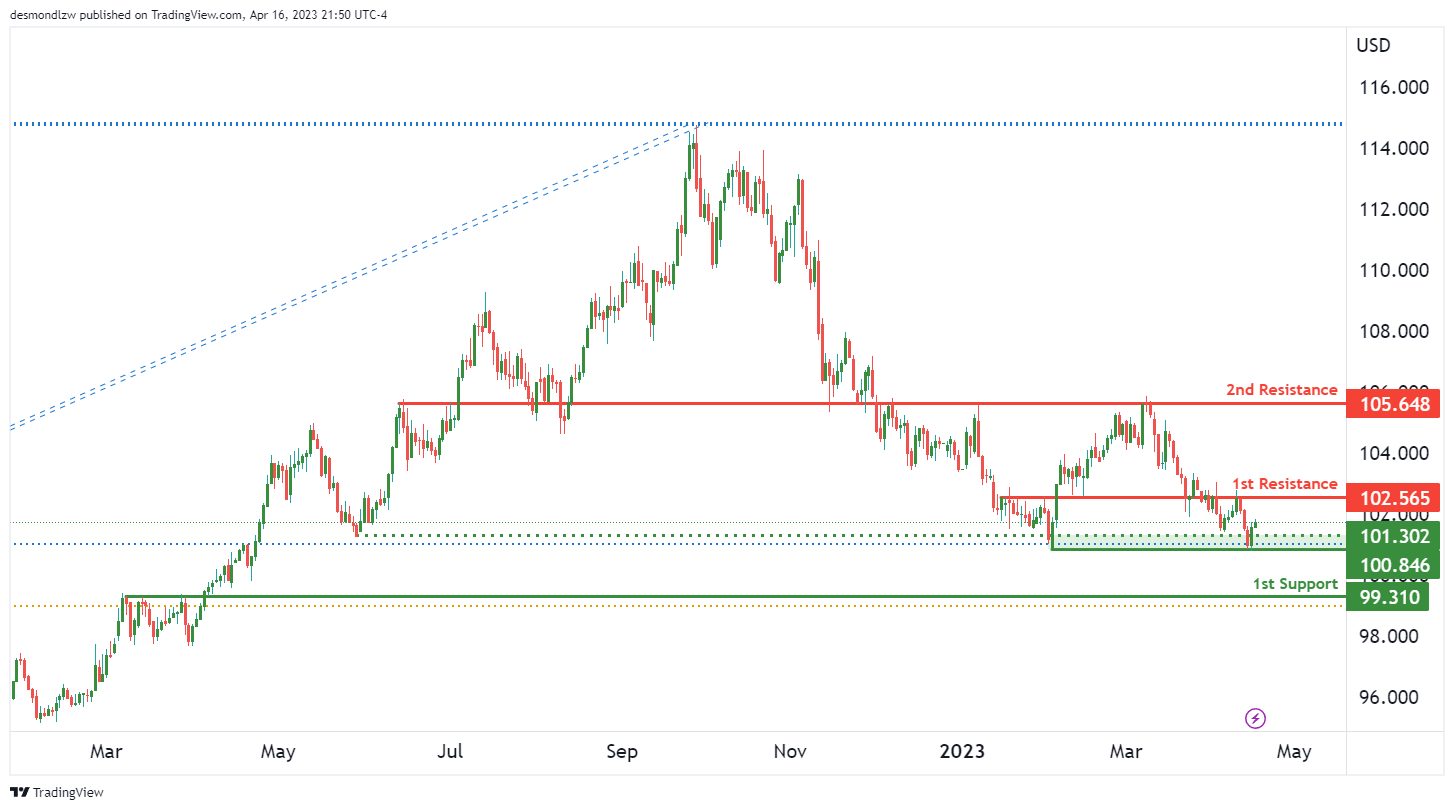
The overall momentum of theDXY, which currently shows a bullish momentum overall. This suggests that the price could potentially continue to rise further, with the potential to make a bullish continuation towards the 1st resistance level.
The first support level for DXY is at 100.85, which is a multi-swing low support. This level has proven to be a strong support in the past, and if the price were to bounce from this level, it could rise towards the 1st resistance at 102.56. The 1st resistance level is an overlap resistance, making it a key level to watch for potential bullish movements.
If the price were to break through the 1st resistance, it could potentially rise towards the 2nd resistance at 105.64, which is also an overlap resistance. However, if the price were to drop instead, the 2nd support level is at 99.31, which is a pullback support.
It’s worth noting that there is an intermediate support level between the current price and the 1st support, although it hasn’t been specified in the information provided. This intermediate support level could potentially trigger a strong bullish acceleration towards the 1st resistance if the price were to break through it.
EUR/USD:
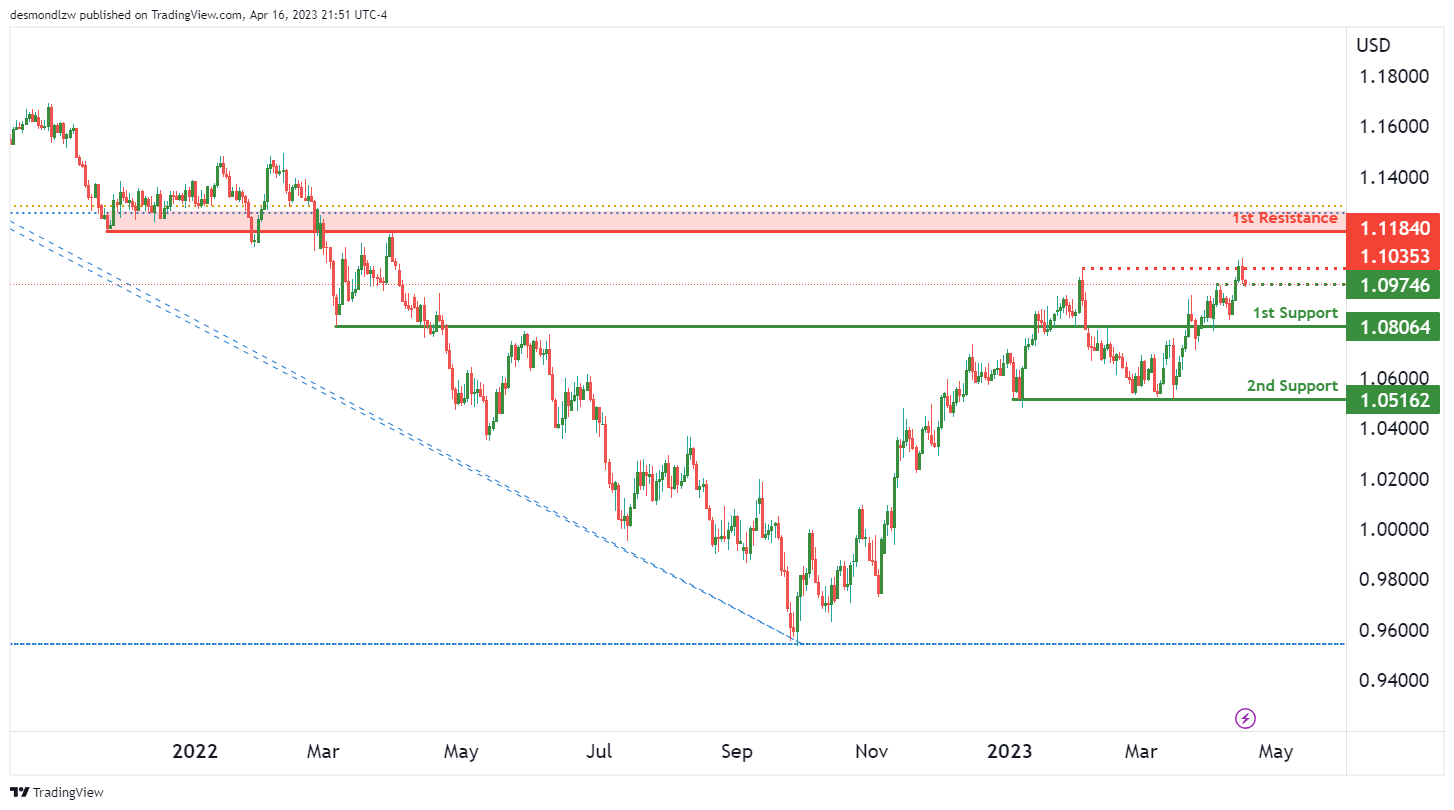
The chart of EUR/USD is currently showing bearish momentum overall, which suggests that the price could potentially make a bearish continuation towards the 1st support level.
The 1st support level for EUR/USD is at 1.0806, which is an overlap support. This level has proven to be a strong support in the past, and if the price were to break through this level, it could potentially drop towards the 2nd support at 1.0516, which is a multi-swing low support.
On the resistance side, the 1st resistance level is at 1.1184, which is an overlap resistance. This level is key to watch for potential bearish movements. Additionally, there is an intermediate resistance level at 1.1035, which is a multi-swing high resistance. If the price were to break through this intermediate resistance level, it could trigger a stronger bearish acceleration towards the 1st support.
It’s worth noting that there is also an intermediate support level at 1.0974, which is a pullback support. If the price were to bounce from this level, it could potentially rise towards the intermediate resistance at 1.1035.
GBP/USD:
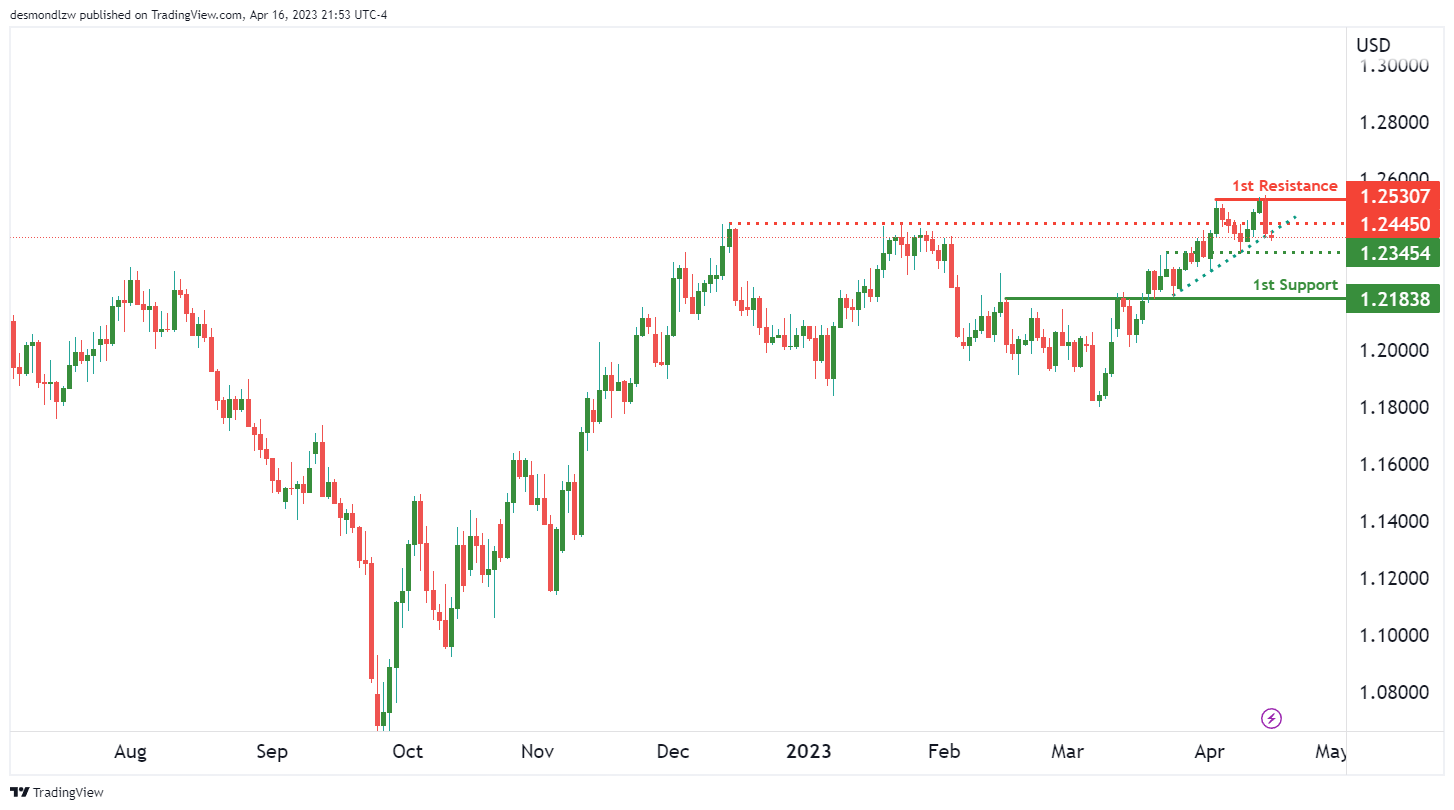
The GBP/USD, which currently shows a bearish momentum overall. This is due to the fact that the price is currently below a major descending trend line, which suggests that further bearish momentum is on the cards. Additionally, if the price were to break below the ascending trend line, it could potentially drop towards the 1st support level.
The 1st support level for GBP/USD is at 1.2183, which is an overlap support and is on an ascending trend line that acts as a support. This level has proven to be a strong support in the past, and if the price were to break through this level, it could potentially drop towards the intermediate support at 1.2345, which is also an overlap support.
On the resistance side, the 1st resistance level is at 1.2530, which is a multi-swing high resistance. This level is key to watch for potential bearish movements. Additionally, there is an intermediate resistance level at 1.2445, which is an overlap resistance. If the price were to break through this intermediate resistance level, it could trigger a stronger bullish acceleration towards the 1st resistance.
USD/CHF:
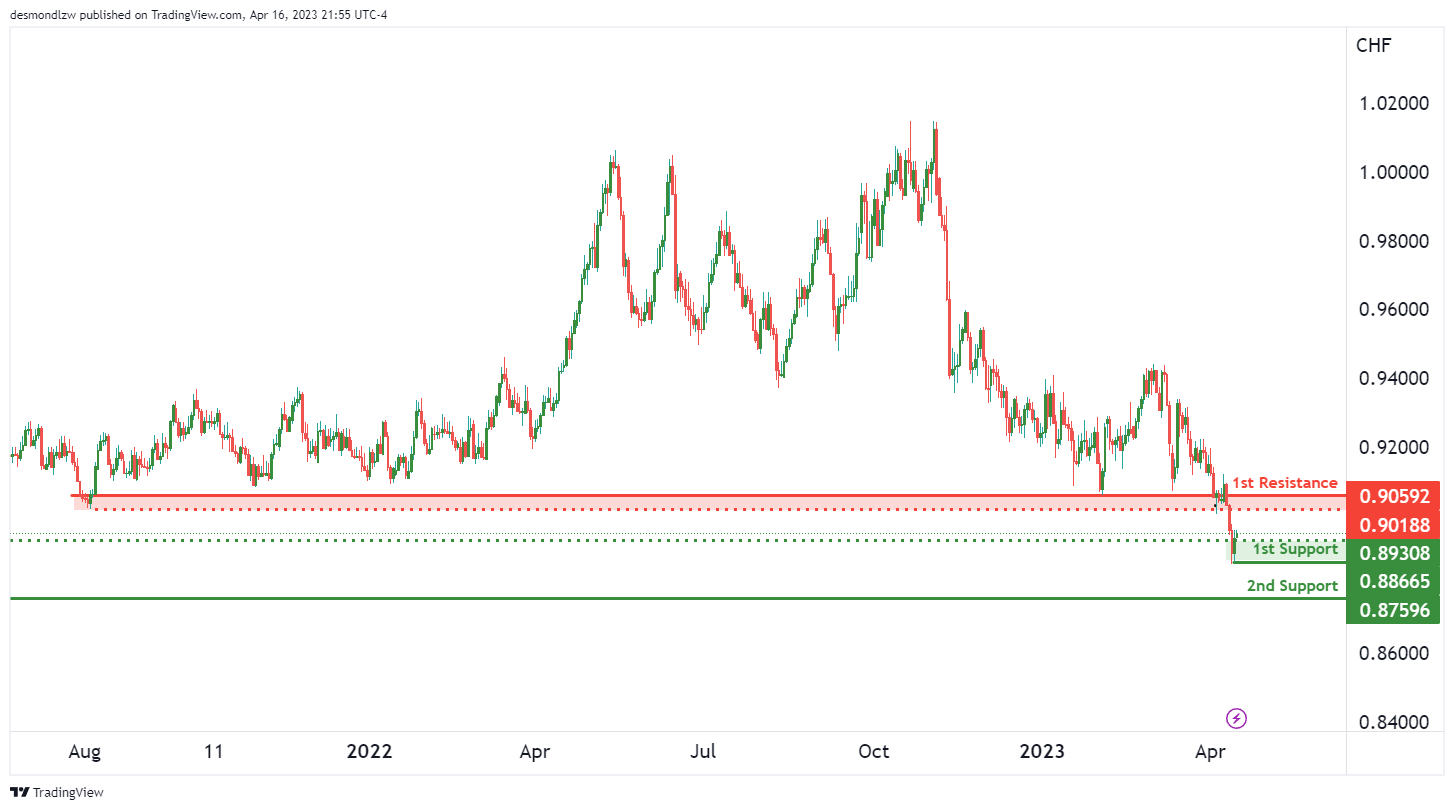
The chart of USD/CHF, which currently shows a bullish momentum overall. This suggests that the price could potentially continue to rise further, with the potential to make a bullish continuation towards the 1st resistance level.
The first support level for USD/CHF is at 0.8866, which is a multi-swing low support. This level has proven to be a strong support in the past, and if the price were to bounce from this level, it could rise towards the 1st resistance at 0.9059. The 1st resistance level is an overlap resistance, making it a key level to watch for potential bullish movements.
If the price were to break through the 1st resistance, it could potentially rise towards the intermediate resistance at 0.9018, which is a pullback resistance. However, if the price were to drop instead, the 2nd support level is at 0.8759, which is a swing low support.
USD/JPY:
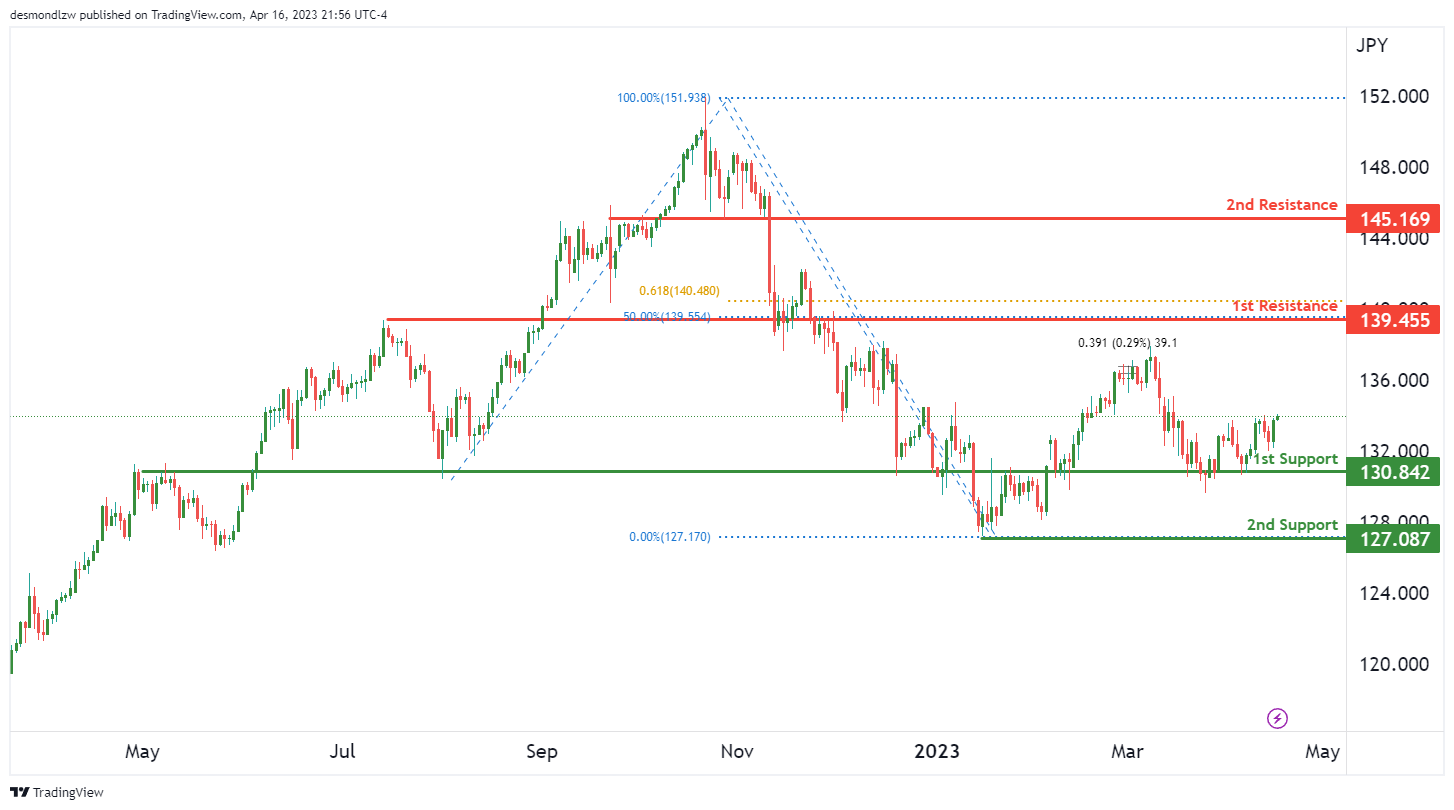
The chart of USD/JPY, which currently shows a bullish momentum overall. This suggests that the price could potentially continue to rise further, with the potential to make a bullish continuation towards the 1st resistance level.
The first support level for USD/JPY is at 130.84, which is an overlap support. This level has proven to be a strong support in the past, and if the price were to bounce from this level, it could rise towards the 1st resistance at 139.45. The 1st resistance level is an overlap resistance and also coincides with a 50% Fibonacci retracement, making it a key level to watch for potential bullish movements.
If the price were to break through the 1st resistance, it could potentially rise towards the 2nd resistance at 145.16, which is a pullback resistance. However, if the price were to drop instead, the 2nd support level is at 127.08, which is a swing low support.
AUD/USD:
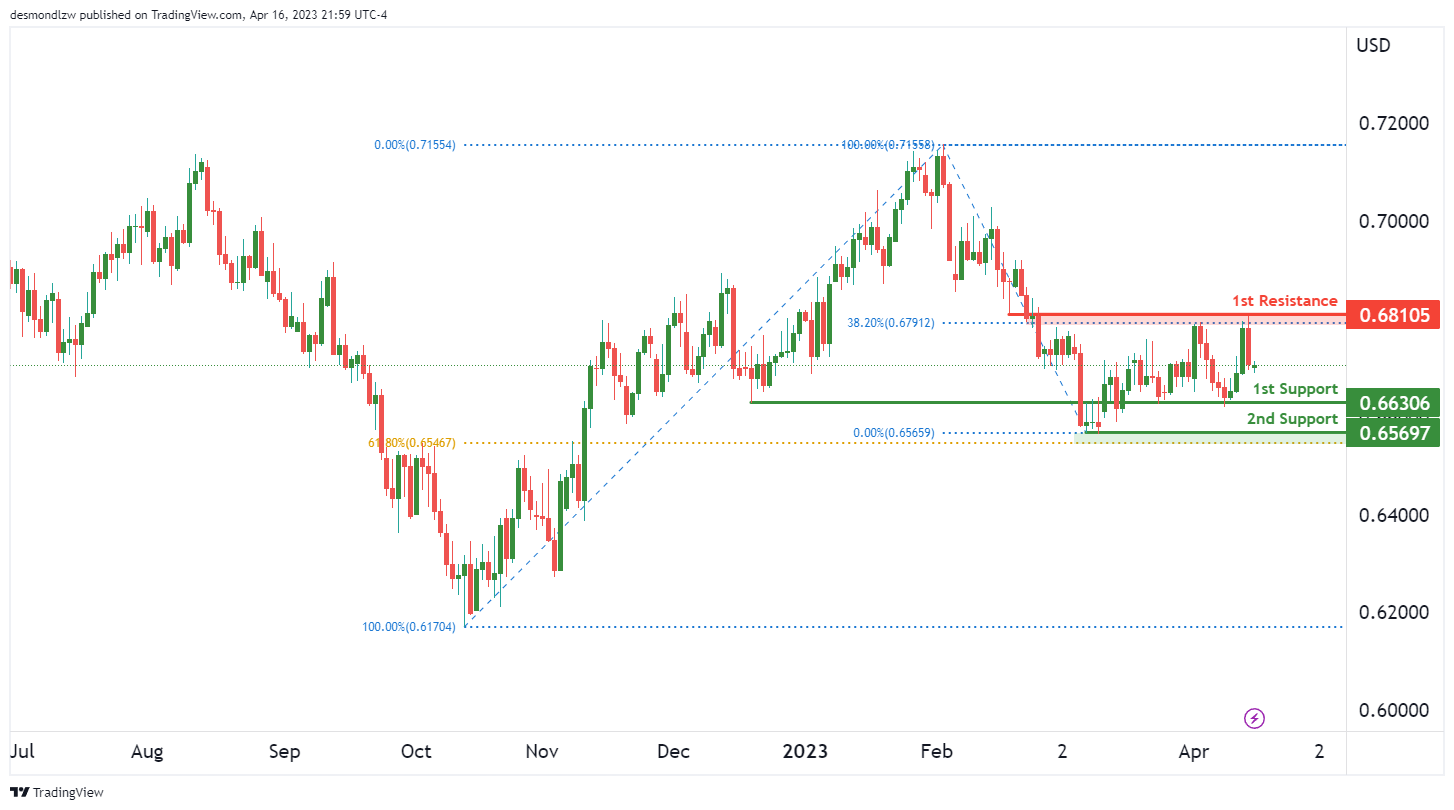
The chart of AUD/USD, which currently shows a bearish momentum overall. This suggests that the price could potentially continue to drop further, with the potential to make a bearish continuation towards the 1st support level.
The 1st support level for AUD/USD is at 0.66, which is an overlap support. This level has proven to be a strong support in the past and is currently at a 61.80% Fibonacci retracement. If the price were to break through this support level, it could potentially drop towards the 2nd support at 0.66, which is a multi-swing low support.
On the resistance side, the 1st resistance level is at 0.68, which is a pullback resistance and also coincides with a 38.20% Fibonacci retracement. If the price were to break through this resistance level, it could potentially rise towards the next resistance level. However, with the current bearish momentum in the chart of AUD/USD, a drop towards the support levels is more likely.
NZD/USD:
the chart of NZD/USD, which currently shows a bearish momentum overall. This suggests that the price could potentially continue to drop further, with the potential to make a bearish continuation towards the 1st support level.
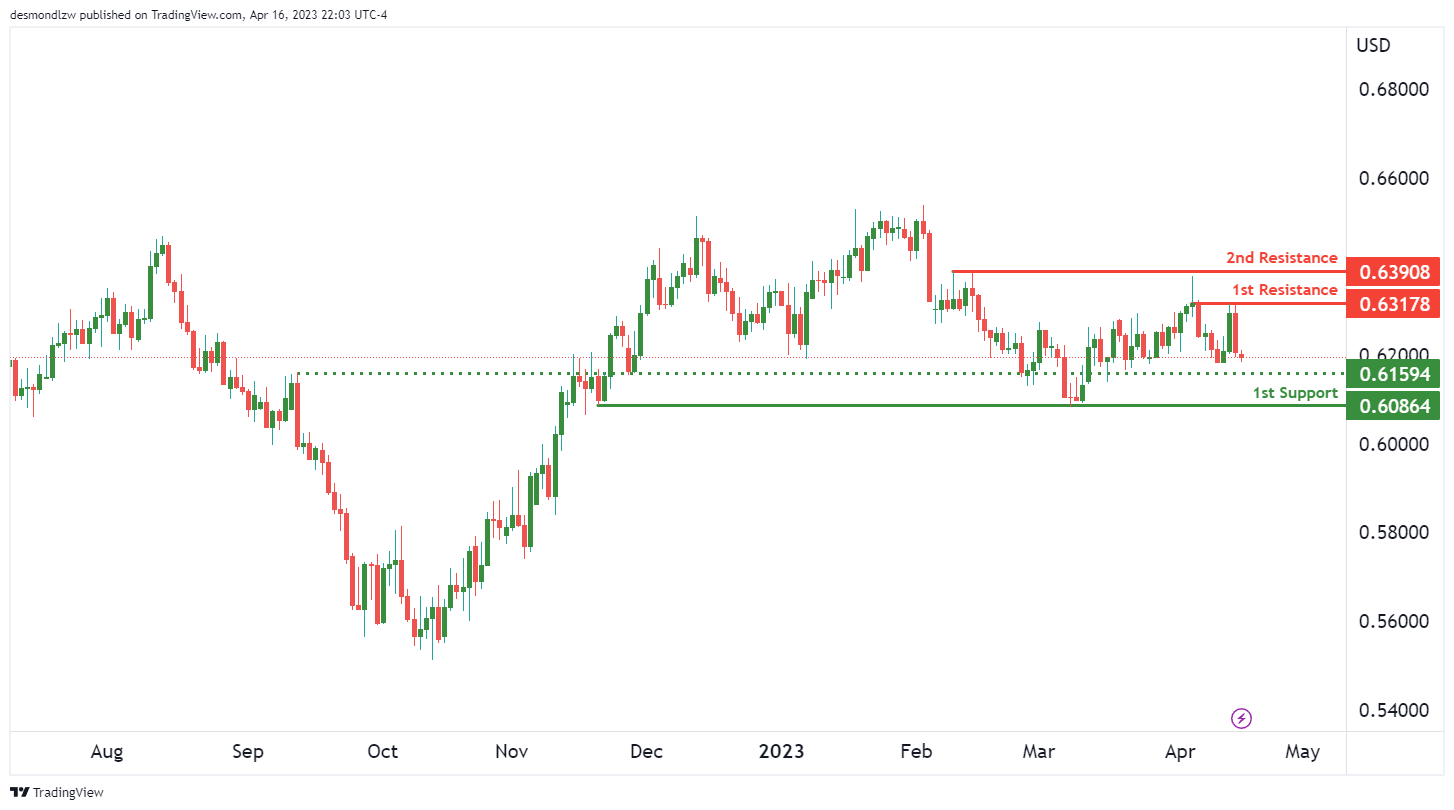
The first support level for NZD/USD is at 0.6086, which is a multi-swing low support. This level has proven to be a strong support in the past and is currently an attractive entry point for investors looking to invest in this particular asset. If the price were to bounce from this level, it could potentially rise towards the intermediate support level at 0.6159, which is an overlap support.
On the resistance side, the 1st resistance level is at 0.6317, which is a multi-swing high resistance. If the price were to break through this resistance level, it could potentially rise towards the 2nd resistance level at 0.6390, which is another multi-swing high resistance.
USD/CAD:
The overall momentum of the USD/CAD chart is currently bullish, suggesting that prices may continue to rise. In addition, the price is currently above the Ichimoku cloud, which further supports the bullish sentiment.
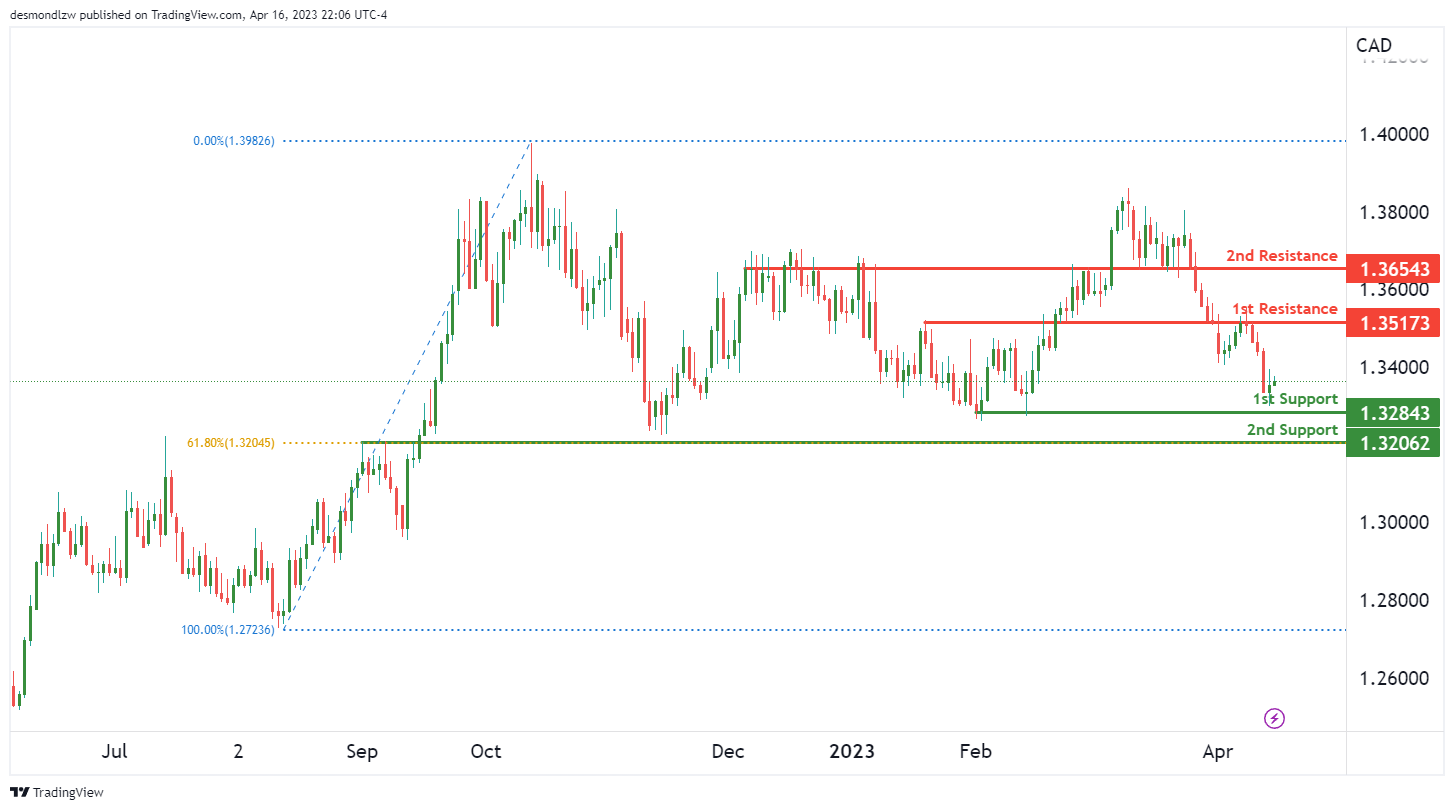
Looking at the support and resistance levels, we can see that the 1st support is at 1.3284. This level is a multi-swing low support and could potentially act as a key level for buyers to enter the market. The 2nd support is at 1.3206, and this level is an overlap support, adding to its significance as a potential buying zone.
On the resistance side, the 1st resistance is at 1.3517, which is an overlap resistance. This level is also important as it coincides with the 23.6% Fibonacci retracement level. If the price were to break above this level, it could potentially rise to the 2nd resistance at 1.3654. This level is a pullback resistance, adding to its significance as a potential target for buyers.
DJ30:
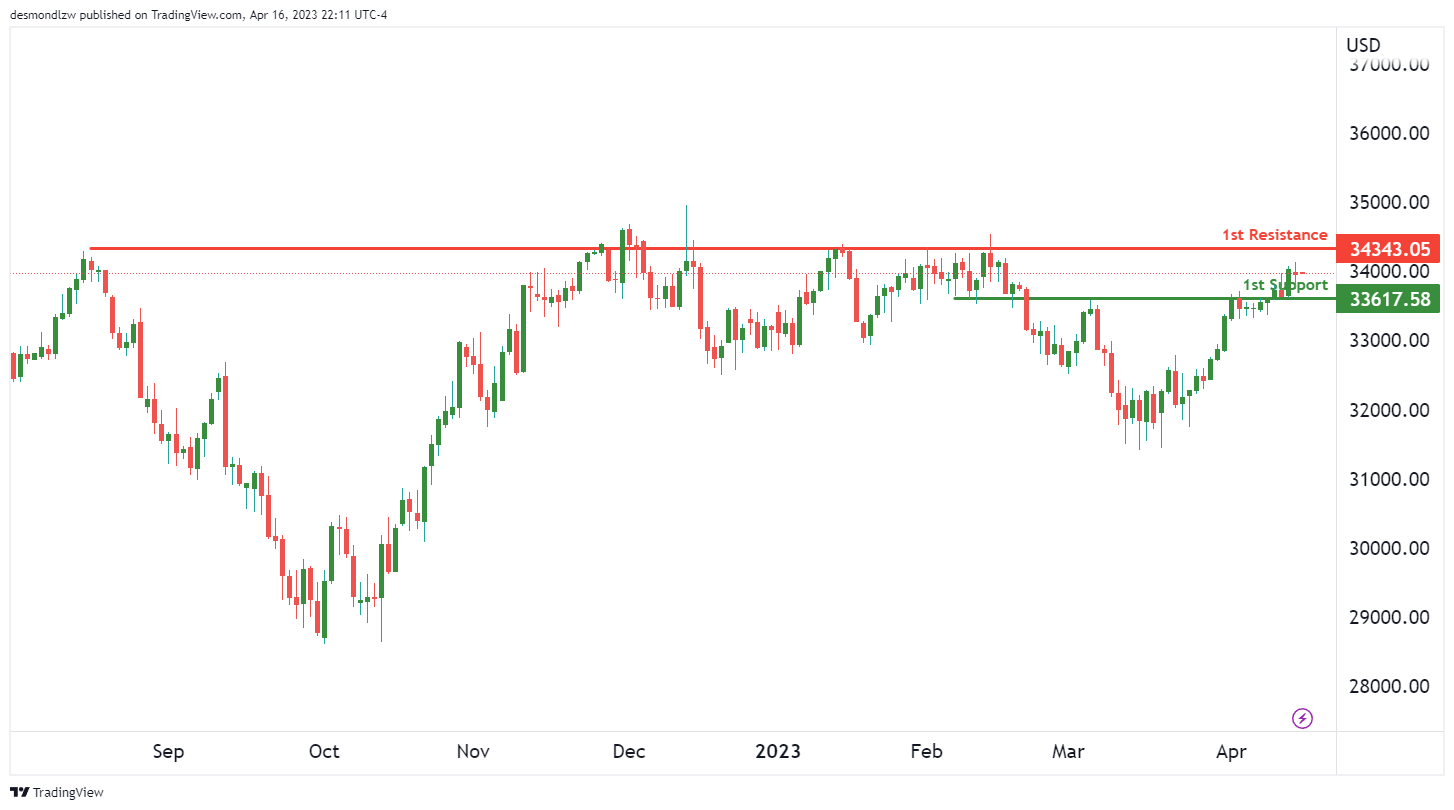
The DJ30 chart is currently showing neutral momentum, with price potentially fluctuating between the 1st support and 1st resistance levels. The 1st support level is at 33617.58, which is an overlap support. On the other hand, the 1st resistance level is at 34343.05, which is a multi-swing high resistance.
While the overall momentum is neutral, the DJ30 chart could see some movement as price fluctuates between these two levels. It’s important to note that breakouts from these levels may not be high conviction in nature due to the lack of a clear trend and momentum.
GER30:
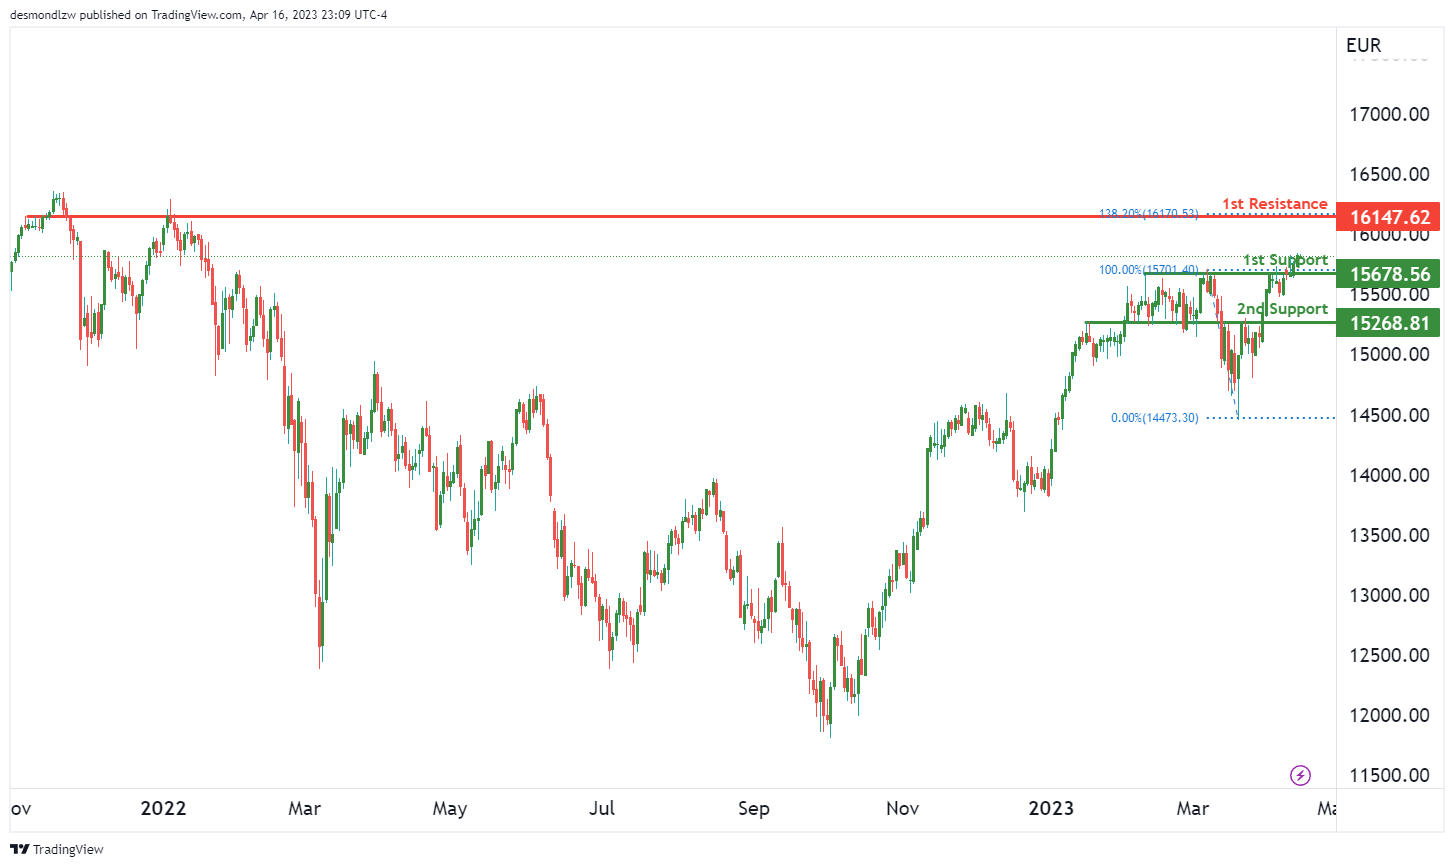
The GER30 chart currently shows a bullish momentum, suggesting that prices may continue to rise. The current price could potentially make a bullish continuation towards the 1st resistance level. This indicates that the market is in an uptrend and may continue to be so for the foreseeable future.
In terms of support, the 1st support level is at 15678.56, which is a good pullback support. The 2nd support level at 15268.81 is also a pullback support, and both levels are below the current price. If the price falls, these levels may provide support and prevent the price from falling further.
On the other hand, the 1st resistance level at 16147.62 is a good overlap resistance level, with a 138.20% Fibonacci Extension. This level is above the current price, and if the price rises, this level may provide resistance and prevent the price from rising further.
BTC/USD:
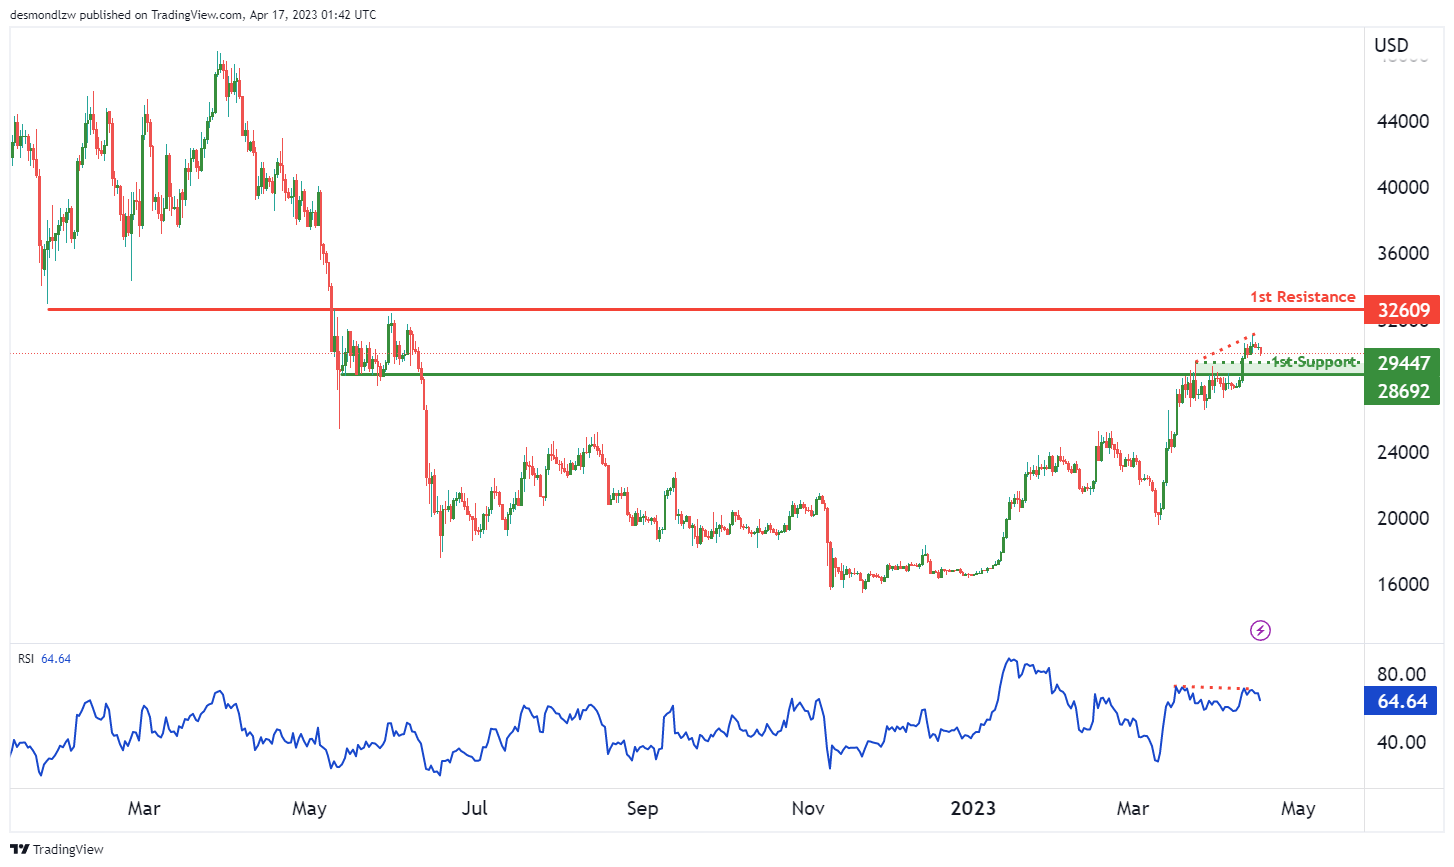
Bitcoin Analysis: Potential Short-Term Drop Before Reaching 1st Resistance
The overall momentum of the Bitcoin chart is currently bullish. However, it seems that price could potentially drop further in the short term before rising towards the first resistance level.
At the moment, price is testing the 1st support at 28692. This level is a pullback support and could potentially act as a bouncing point for price to rise towards the 1st resistance at 32609. However, there is an intermediate support at 29447 which is also a pullback support, suggesting that price may drop further in the short term before bouncing from there.
It’s worth noting that the RSI is displaying bearish divergence versus price, indicating that a reversal might occur soon.
US500
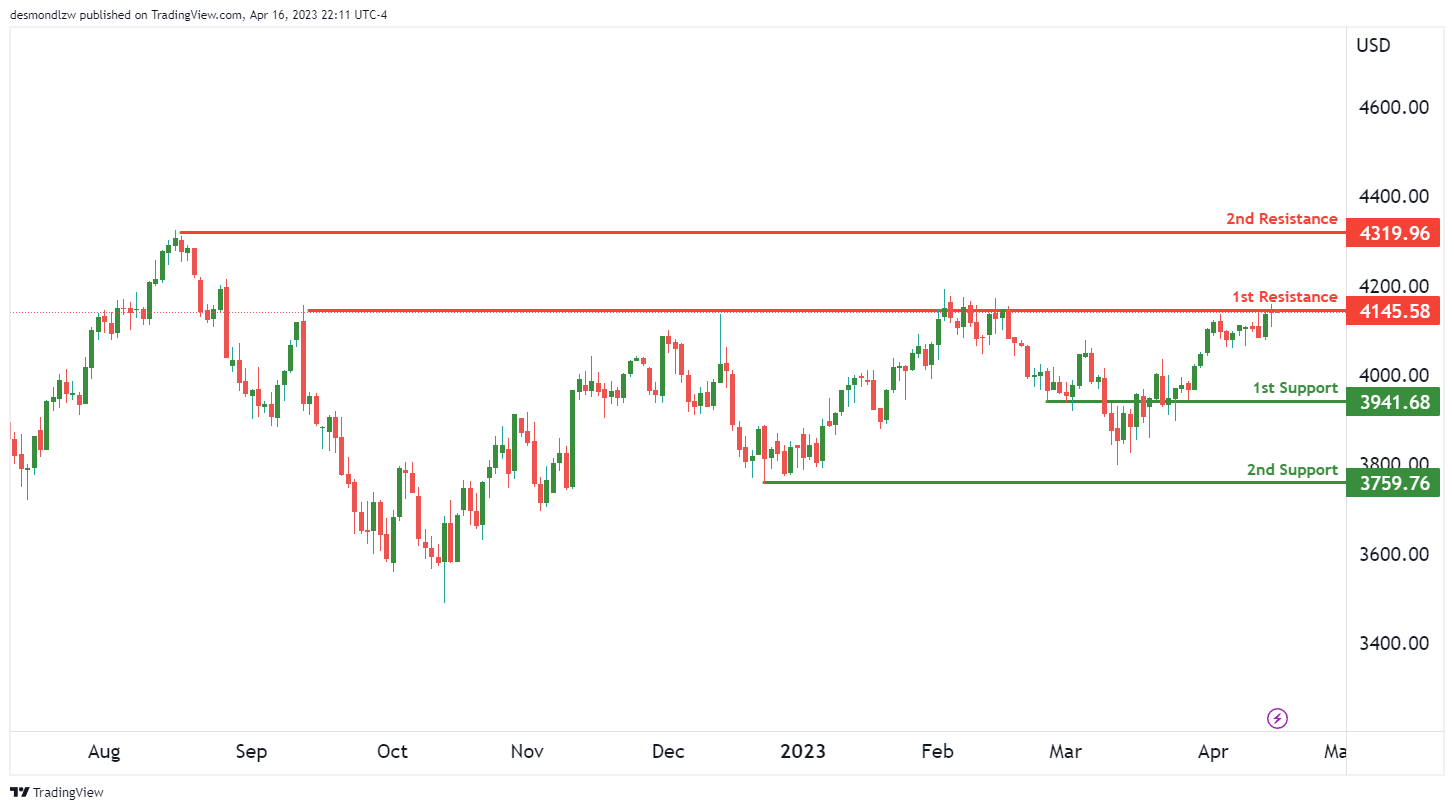
The US500 chart is currently showing a bearish momentum. There is a potential for a bearish reaction off the 1st resistance at 4145.58, which is a strong multi-swing high resistance level. Additionally, there is a 2nd resistance level at 4319.96 which is a swing high resistance.
On the other hand, there are support levels to look out for. The 1st support level is at 3941.68 which is a strong overlap support level, while the 2nd support level is at 3759.76 which is a swing low support.
If price were to break the 1st resistance, it could potentially rise towards the 2nd resistance level. However, given the overall bearish momentum of the chart, it is more likely that price will drop towards the 1st support level.
ETH/USD:
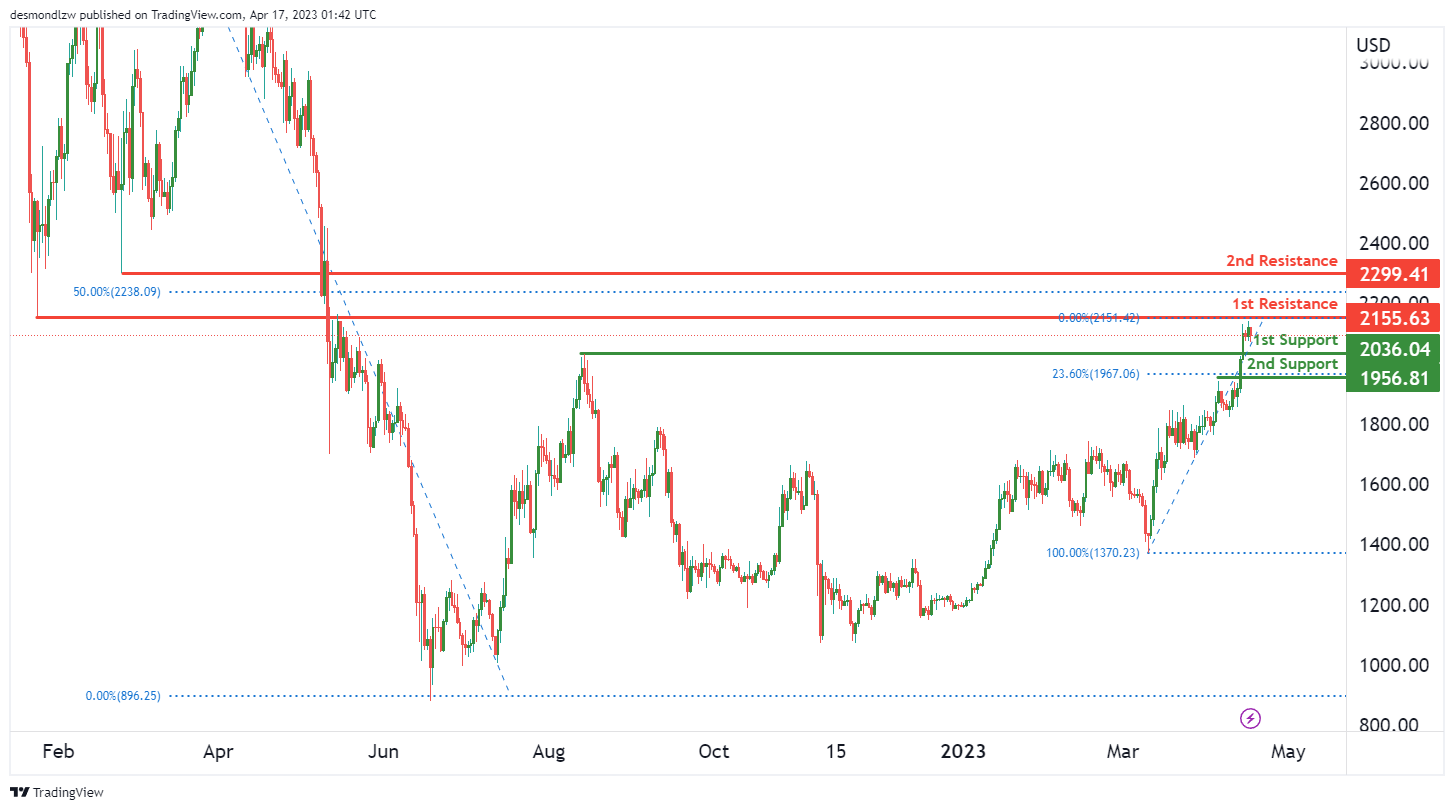
The price of ETH/USD has been showing bearish momentum on the chart, with potential for a continuation towards the 1st support at 2036.04, which is a pullback support level. Another support level to consider is the 2nd support at 1956.81, which is also a pullback support and aligns with the 23.6% Fibonacci retracement level.
On the resistance side, the 1st resistance is at 2155.63, which is a strong overlap resistance level. If the price manages to break above this level, it could potentially rise towards the 2nd resistance at 2299.41, which is a pullback resistance level. However, given the bearish momentum of the chart, it is more likely that the price will continue to drop towards the support levels rather than break above the resistance levels.
WTI/USD:
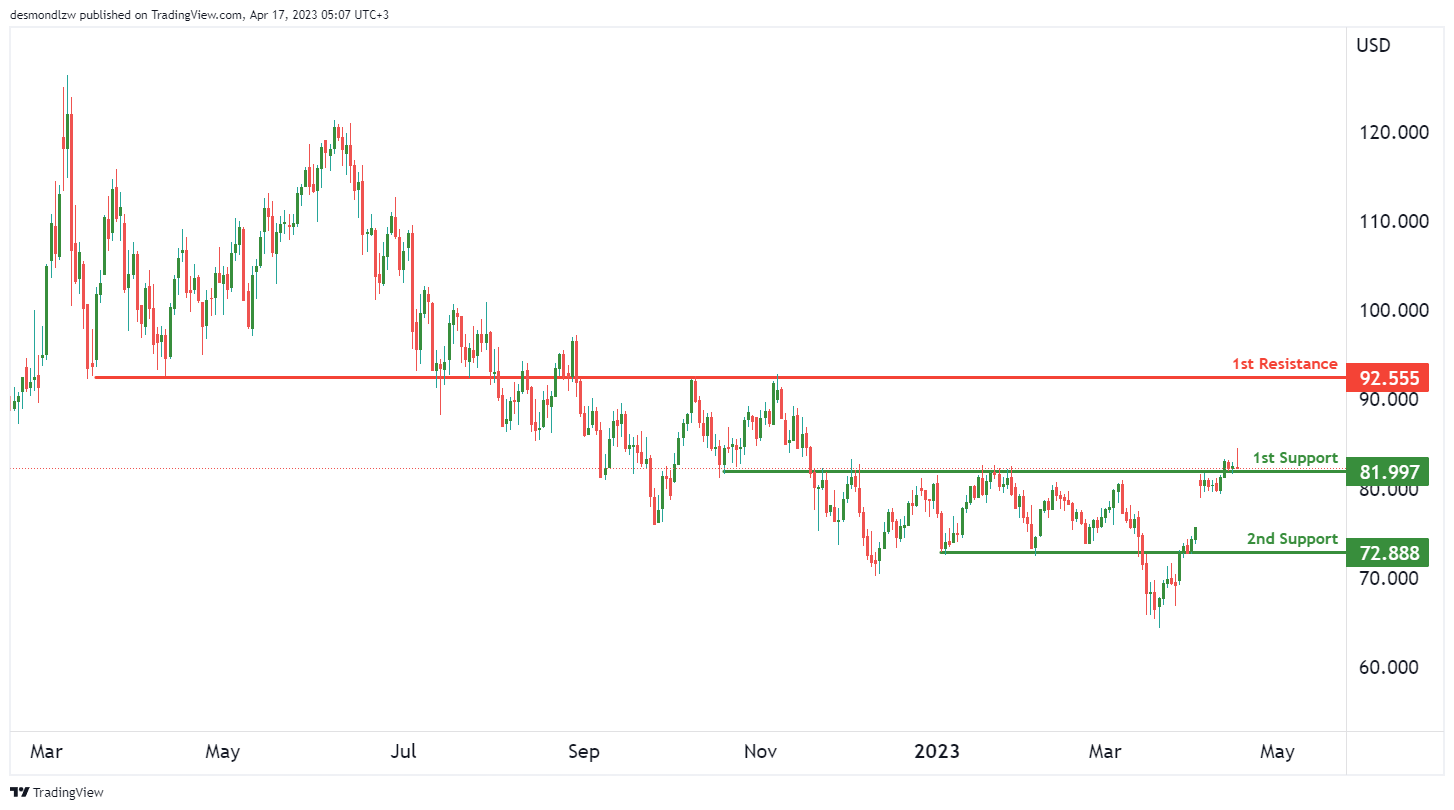
The price of WTI has been showing bullish momentum on the chart. However, in the short term, the price could potentially retrace towards the 1st support at 81.99, which is a strong overlap support level. If the price bounces off this support, it could resume its bullish momentum towards the 1st resistance at 92.55, which is also an overlap resistance level.
If the price were to drop below the 1st support, it could potentially fall towards the 2nd support at 72.88, which is another overlap support level. It’s worth noting that a drop towards the 2nd support is not our base scenario, but it is a possible scenario to keep in mind.
XAU/USD (GOLD):
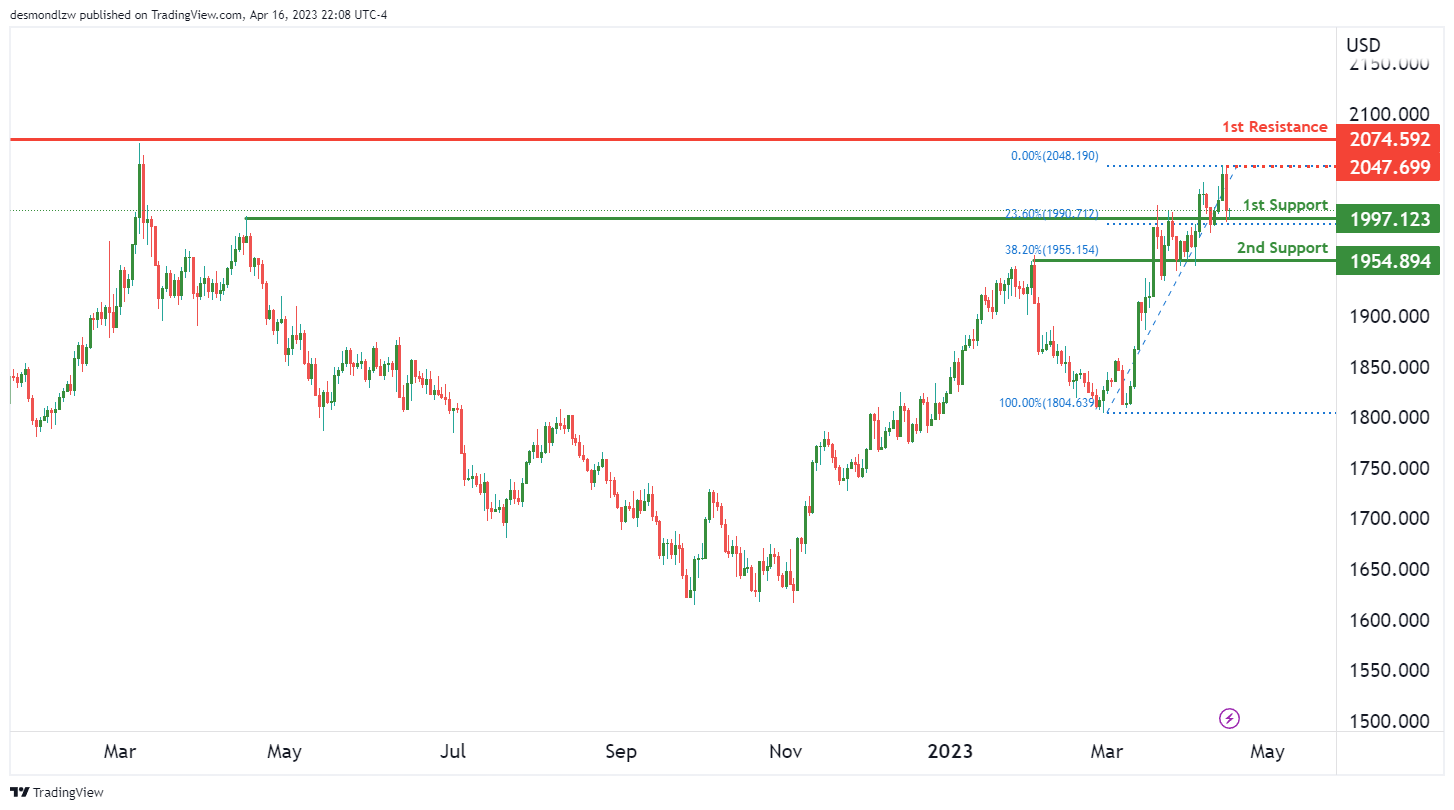
The XAU/USD chart is currently showing bullish momentum, and the price could potentially drop in the short term towards the 1st support at 1997.12, which is a strong overlap support level and also aligns with the 23.6% Fibonacci retracement level. If the price breaks below this level, it could drop further towards the 2nd support at 1954.89, which is also an overlap support and aligns with the 38.2% Fibonacci retracement level.
On the resistance side, the 1st resistance is at 2070.59, which is a swing high resistance level. If the price manages to break above this level, it could potentially rise towards the intermediate resistance at 2047.69, which is also a swing high resistance. Overall, the chart suggests that the momentum is bullish, and the price may continue to rise towards the resistance levels after a short-term drop towards the support levels.
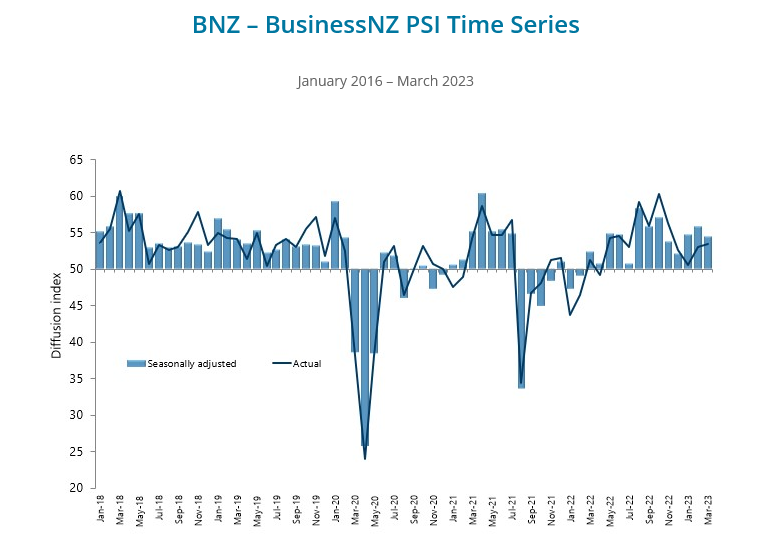
NZ BNZ Services dropped to 54.4, but keeps its head above water
New Zealand's service sector growth slowed down in March, with the BusinessNZ Performance of Services Index (PSI) declining to 54.4 from 55.8 in February. However, the index stayed above the long-term average of 53.6.
BusinessNZ Chief Executive Kirk Hope highlighted the uptick in negative sentiment, with the proportion of negative comments surging from 51.9% in February to 58.6% in March. The main concerns expressed were a cooling economy, the impact of price increases, and overall uncertainty.
Despite these challenges, BNZ Senior Economist Craig Ebert remains cautiously optimistic. He noted that while the PSI held relatively steady in March, the Performance of Manufacturing Index (PMI) slipped into slightly negative territory. Nonetheless, Ebert believes that there is enough positive momentum to suggest an underlying tendency for growth in activity.
EUR/USD Dips But Key Uptrend Support Intact
Key Highlights
- EUR/USD extended gains above 1.1000 before the bears appeared.
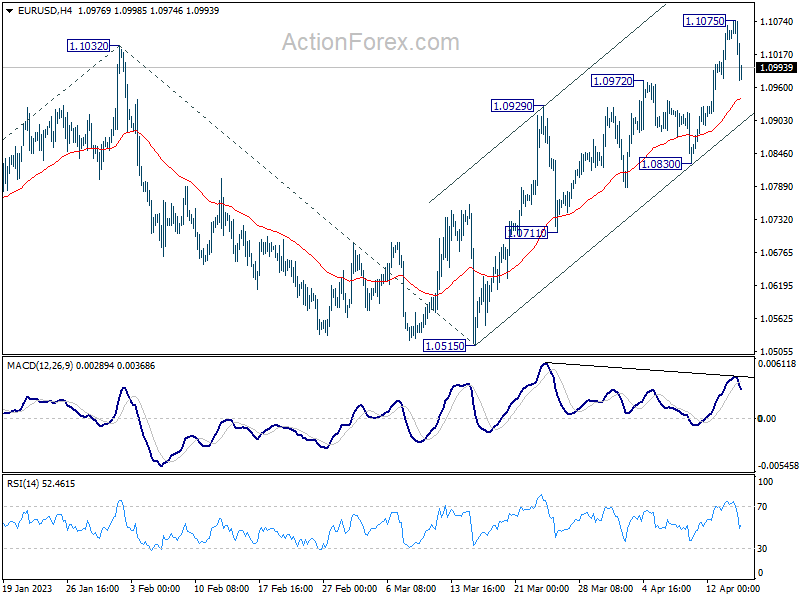
- A key bullish trend line is forming with support near 1.0940 on the 4-hour chart.
- GBP/USD spiked above 1.2540 before it faced resistance.
- Crude oil prices started a consolidation phase above $80.
EUR/USD Technical Analysis
The Euro started another increase from the 1.0820 support against the US Dollar. EUR/USD broke many hurdles near 1.0880 to move into a bullish zone.
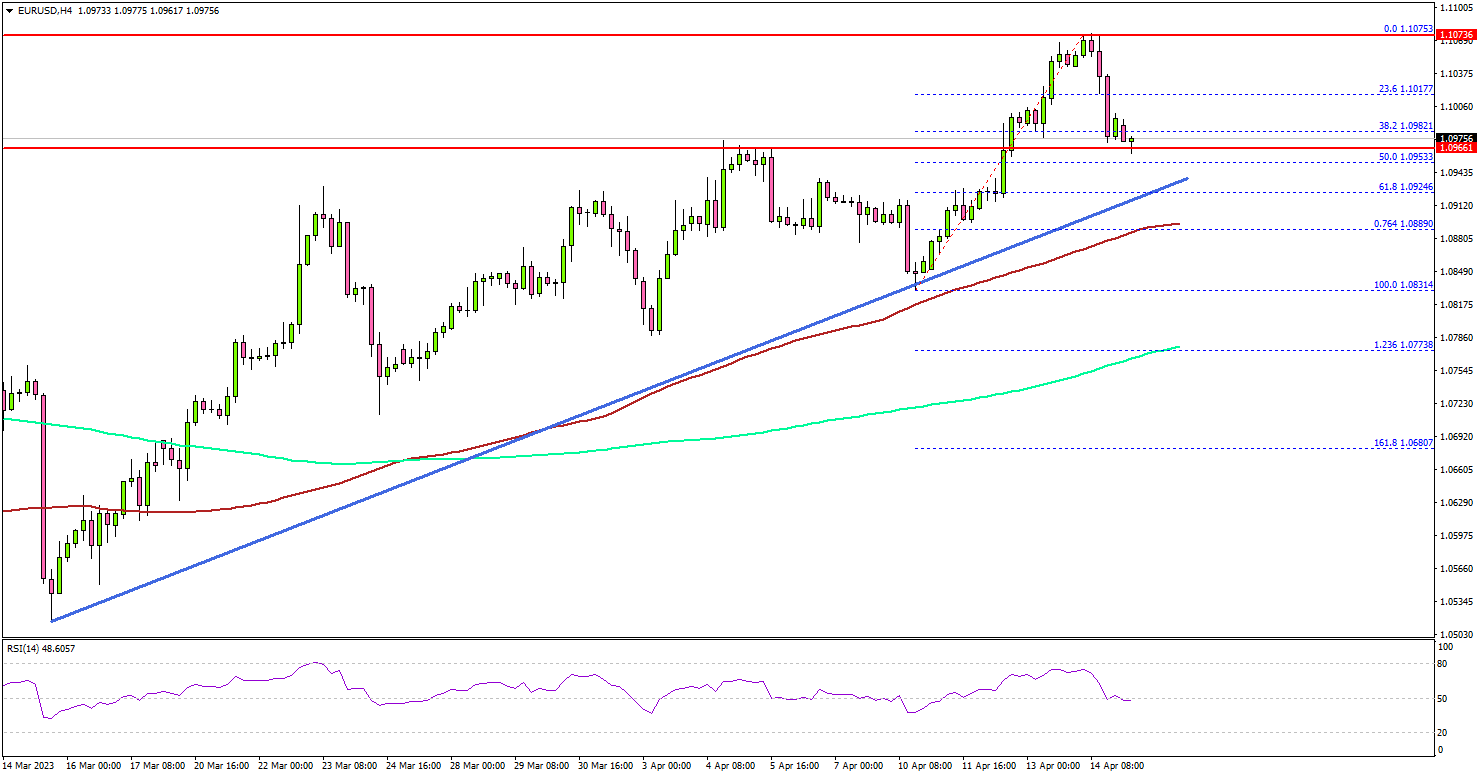
Looking at the 4-hour chart, the pair gained pace after it broke the 1.0920 resistance. The pair even settled above the 1.0950 level, the 200 simple moving average (green, 4 hours), and the 100 simple moving average (red, 4 hours).
It traded as high as 1.1075 before the bears appeared. Recently, there was a downside correction below the 1.1020 level. The pair dipped below the 38.2% Fib retracement level of the upward move from the 1.0831 swing low to the 1.1075 high.
The next major support is near the 1.0940 level. There is also a key bullish trend line forming with support near 1.0940 on the same chart.
The trend line is close to the 50% Fib retracement level of the upward move from the 1.0831 swing low to the 1.1075 high. A break below the trend line might push EUR/USD toward the 1.0890 level or the 100 simple moving average (red, 4 hours).
On the upside, the pair is facing resistance near the 1.1050 level. The next key resistance is near the 1.1075 zone. A clear move above the 1.1075 resistance might send the pair toward the 1.1150 zone. Any more gains might send the pair toward 1.1200.
Looking at GBP/USD, the pair climbed above the 1.2500 resistance zone before it faced sellers and started a short-term downside correction.
Economic Releases
- ECB's President Lagarde speech.
Forex and Cryptocurrency Forecast
EUR/USD: The Dollar Continues to Sink
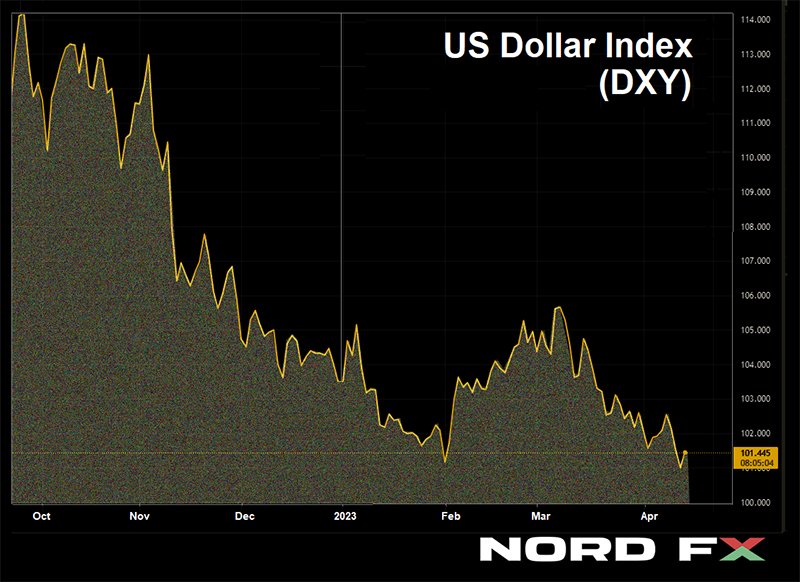
The DXY dollar index updated a 12-month low last week, and EUR/USD, respectively, rose to a maximum (1.1075) since April 04, 2022. The US currency has been falling for the fifth week in a row: the longest series since summer 2020.
The dollar received a serious blow on Wednesday, April 12, when data on consumer inflation (CPI) and the minutes of the March US Federal Reserve FOMC (Federal Open Market Committee) meeting were published. Statistics showed that prices are under control and inflation in the US has been consistently slowing down for nine consecutive months, going from 9.1% y/y to the current 5.0% y/y. The US Producer Price Index (PPI), released a day later, also showed a decrease in inflation, although at the basic level, US price pressure still looks stable.
With regard to the Fed Protocol, at the meeting on March 22, FOMC members discussed the possibility of taking a pause in the rate hike cycle due to problems in the banking sector. Information about a possible mild recession in the US economy later this year was also discussed. However, the rate is likely to be raised again at the next meeting of the Committee on May 3. According to CME FedWatch forecasts, it is likely to grow by another 25 basis points (bp) to 5.25% per annum.
This increase has already been taken into account by the market in quotes and is unlikely to provide any support to the dollar. Moreover, 5.25% is likely to be the peak value of the rate, until the last months of the year, when it starts to decline. The futures market expects that federal funds spending will be 4.30-4.40% in December 2023, and they will fall even lower to 4.12-4.20% in January 2024.
Slower inflation and the end of the Fed's tight monetary policy cycle are putting pressure on the dollar, pushing the DXY down. At the same time, forecasts suggest that, unlike the Fed, the European Central Bank will continue its tightening cycle for now. This was confirmed by the Member of the Board of Governors of the ECB, President of the Bundesbank Joachim Nagel. He said on Thursday, April 13 that it is necessary to continue raising rates, as core inflation in the Eurozone is still very high.
Data on retail sales in the US released at the very end of the working week, on Friday, April 14 slightly supported the US currency. They showed that sales, although falling, were much slower than expected. With the forecast of -0.4% and the previous value of -0.2%, in reality, the decline was -0.1%. Market participants regarded such dynamics in favor of the dollar, and as a result, EUR/USD ended the last week at 1.0993. At the time of writing the review, on Friday evening, April 14, analysts' opinions are almost equally divided: 45% of them expect the dollar to further weaken, 45% expect it to strengthen, and the remaining 10% have taken a neutral position. As for technical analysis, all oscillators and trend indicators on D1 are 100% colored green. The nearest support for the pair is at 1.0975, then 1.0925, 1.0865-1.0885, 1.0740-1.0760, 1.0675-1.0710, 1.0620 and 1.0490-1.0530. Bulls will meet resistance at 1.1050-1.1070, then 1.1110, 1.1230, 1.1280 and 1.1355-1.1390.
We expect quite a lot of economic statistics from the EU next week. Thus, the ZEW Economic Sentiment Index in Germany, the main locomotive of the European economy, will be published on Tuesday, April 18. On Wednesday, we will find out what is happening with inflation (CPI) in the Eurozone as a whole. On Thursday, the Minutes of the last meeting of the ECB on monetary policy will be published, and on Friday, April 21, business activity indicators (PMI) in the manufacturing sector of Germany and in the country as a whole will become known. No significant macro statistics are expected from the US next week.
GBP/USD: Things Are Much Better Than Expected
Against the backdrop of the dollar weakening, GBP/USD still feels good, and it made another high in the first half of Friday, April 14, reaching the height of 1.2545. The pound has not traded this high since the beginning of June 2022. However, then, after the publication of data on retail sales in the US, the dollar improved its position, and the pair completed the five-day period at the level of 1.2414.
As for the UK economy itself, the GDP release on Thursday 13 April showed that the economy stagnated at 0.0% in February, compared with the forecast of 0.1% and the previous reading of 0.3%. The growth of production in the manufacturing industry in February was also 0.0% against the expected 0.2% and -0.1% in January, while the total industrial output is still in the negative zone -0.2% against the forecast of 0.2% and -0.5% a month earlier. On an annualized basis, manufacturing output came in at -2.4%, beating expectations of -4.7%. The total volume of industrial production decreased by -3.1% against the forecast -3.7% and the previous value -3.2%. Data on the trade balance of goods in the UK was also published last week, which in February amounted to £17.534 billion, which is more than the forecast of £17.000 billion and the previous value of £16.093 billion.
What do all these numbers say? Together with the data on business activity (PMI), which became known on April 03 and remained above 50 points, all these statistics give investors hope that the British economy is able to avoid a recession. Which, in turn, supports the position of the national currency. This was confirmed on April 13 by British Treasury Secretary Jeremy Hunt, who said that the economic outlook looks brighter than expected. "Thanks to the steps we have taken, we will avoid a recession," he assured the audience.
The Bank of England (BoE) Chief Economist Hugh Pill's comments were quite optimistic as well. According to him, although "the exact path of inflation may be more uneven than we expect," the Central Bank still forecasts a decrease in CPI in Q2 of this year. "The latest figures are somewhat disappointing," said Hugh Pill, "but they are much better than the BoE's forecasts made at the end of last year." The economist also noted that the UK banking system remains very sound and resilient, and inflationary dynamics is a key factor determining the direction of BoE's monetary policy.
At the moment, 75% of experts side with the pound and expect further growth of the pair, the remaining 25% side with the dollar. Among the oscillators on D1, the balance of power is as follows: 65% vote in favor of green (10% give overbought signals), 10% have turned red and 25% prefer neutral gray. Among the trend indicators, the advantage is also on the side of the greens, they have 65%, the enemy has 35%. Support levels and zones for the pair are 1.2390-1.2400, 1.2330, 1.2275, 1.2200, 1.2145, 1.2075-1.2085, 1.2000-1.2025, 1.1960, 1.1900-1.1920, 1.1800-1.1840. When the pair moves north, it will face resistance at levels 1.2440-1.2455, 1.2480, 1.2510-1.2540, 1.2575-1.2610, 1.2700, 1.2820 and 1.2940.
Among the events of the coming week, the calendar can and should note the publication of the latest unemployment data in the United Kingdom on Tuesday, April 18. On Wednesday, the value of the Consumer Price Index (CPI) will become known, and on Friday the statistics on retail sales and business activity (PMI) in the UK will be published.
USD/JPY: Bank of Japan Is an Island of Stability
Since last December, USD/JPY has been moving in a fairly wide sideways range of 129.00-138.00. (An exception is the brief strengthening of the yen to 127.15 in mid-January). The pair ended the last week almost in its very center, at the level of 133.75, which indicates the absence of significant drivers capable of giving the pair a powerful acceleration in one direction or another.
We have repeatedly written that even after Haruhiko Kuroda, Governor of the Bank of Japan (BoJ), leaves his post, the Central Bank "will continue to support his adequate and expedient policy." This was once again confirmed by Kazuo Ueda, the new head of the regulator, who took office on April 9. He stated at the G20 meeting that he would support the current ultra-soft monetary policy. In addition, Ueda said that core consumer inflation in Japan, which is currently only about 3%, is likely to fall below 2% in the second half of this fiscal year. Market participants concluded from these words that there is no point in fighting it by raising rates for the Bank of Japan, and therefore it is not worth expecting a reversal of the BoJ rate in the foreseeable future. (Recall that economists at Societe Generale and ANZ Bank expected that this could still happen somewhere around June).
Regarding the immediate prospects for USD/JPY, analysts' opinions are distributed as follows. At the moment, 40% of experts vote for the further movement of the pair to the north, 50% point in the opposite direction and 10% prefer neutrality. Among oscillators, 75% point upwards at D1 (a third of them are in the overbought zone), 10% look in the opposite direction and 15% are neutral. For trend indicators, 85% point to the north, the remaining 15% point to the south. The nearest support level is located in the zone 132.80-133.00, then there are levels and zones 132.00-132.40, 131.25, 130.50-130.60, 129.65, 128.00-128.15 and 127.20. Levels and resistance zones are 134.00, 134.90-135.10, 135.90-136.00, 137.00, 137.50 and 137.90-138.00.
As for the release of any important statistics on the state of the Japanese economy, it is not expected this week.
CRYPTOCURRENCIES: Weak Dollar Is Strong Bitcoin
Bitcoin rose above $30,000 on Tuesday, April 11, for the first time since June 2022. This happened due to instability in the banking sector and expectations that mega-regulators, primarily the Fed, will suspend raising interest rates. The MSCI World Index rose to its highest point since early February by Friday, April 14. This confirmed the fact that international investors are waiting for the American, and in the future, for other major Central Banks to curtail the policy of quantitative tightening (QT). Against this background, the main cryptocurrency continues to outperform other major asset classes, such as gold or oil. In addition, BTC has surpassed many top cryptocurrencies in terms of dynamics.
In the middle of the week, the bears had a chance to return BTC/USD to the support of $29,000. However, the FRS saved it from falling again: the published Minutes of the March FOMC meeting, coupled with macro statistics from the US, weakened the dollar, swinging the scales in favor of bitcoin.
The growth of BTC quotes pulls up the entire crypto market. The total market capitalization of cryptocurrencies has grown by more than 55% since the beginning of 2023, rising above $1.2 trillion. However, despite this, it still remains well below the all-time high of $2.9 trillion recorded in November 2021.
Several experts at once expressed their opinion on what happened on April 11. Michael Van De Poppe, a well-known strategist and founder of the investment company Eight, noted that bitcoin successfully passed the $28,600 test, which led to a breakthrough in resistance and reached $30,000. An analyst with the nickname PlanB tweeted that all the goals he set back in October 2022 have now been achieved. At that time, the expert predicted that BTC quotes would overcome $21,000, $24,000, and then $30,000. And another popular blogger and analyst, Lark Davis, stressed that the time will soon come when buying bitcoins for less than $30,000 will seem as fantastic as buying BTC at $3,000 now.
As of this writing, Friday evening April 14, BTC/USD is trading at $30,440. The total capitalization of the crypto market is $1.276 trillion ($1.177 trillion a week ago). The Crypto Fear & Greed Index rose from 64 to 68 in seven days and is still in the Greed zone. But what's next?
A well-known analyst under the nickname PlanB noted that bitcoin has left the deep bear zone and is at the very beginning of a new bull market. According to PlanB, the Stock to Flow (S2F) model he developed is still relevant. The expert claims that bitcoin fundamentals will eventually allow it to rise above the all-time high (ATH) of $69,000 set in November 2021. PlanB has previously predicted bitcoin will rise from $100,000 to $1 million after the 2024 halving. (Recall that the S2F (stock-to-flow ratio) model for predicting the BTC rate measures the relationship between the available supply of an asset and its production volume and has been repeatedly criticized by members of the crypto community).
Larry Lepard, managing partner at Boston-based equity firm Equity Management Associates, also looks extremely optimistic in the long-term outlook. According to him, the dollar will depreciate over the next 10 years, and citizens will begin to actively invest in cryptocurrencies, gold and real estate. The supply of bitcoins is limited, so the digital asset will become a highly sought-after investment vehicle and will benefit from the collapse of the fiat currency. "I believe that the price of bitcoin will go up a lot. I think it will first reach $100,000, then $1 million and eventually rise to $10 million per coin. I'm sure my grandchildren will be shocked at how rich people who own just one bitcoin become," Lepard said in an interview.
In connection with this forecast, the businessman fears that the authorities will put spokes in the wheels of the crypto industry, trying to slow down the growth in the popularity of digital assets. For example, officials could raise taxes on profits from bitcoin trading and tighten regulation of coins to make it harder for startups to enter the market. However, Lepard is confident that bitcoin will be able to overcome these difficulties and succeed in the long run.
Many analysts agree that long-term macro conditions do point to a possible rise in BTC. But their estimates are much more restrained in relation to the current rally. This is due to the fact that bitcoin liquidity is now much lower than in the same period last year. This is manifested in a greater price dispersion among the leading exchanges. (In the previous review, we wrote that on the one hand, there is an increase in trading volumes, and on the other hand, a decrease in BTC liquidity to a 10-month low).
Although, of course, the prospects for this year will largely depend on the actions of the leading Central banks led by the Fed. Recall that the record capitalization of the crypto market in November 2021 was also the result of the actions of this regulator, which then flooded the economy with a huge amount of cheap money (the M2 monetary unit grew by 39%, which is an anomaly by historical standards). Moreover, interest rates were near zero levels at the time, which led to the emergence of a bubble in the market for risky assets, including stocks and digital currencies. The Fed then moved from quantitative easing (QE) to quantitative tightening (QT) through the fastest interest-rate hike cycle in 40 years, and... the bubble burst.
Speaking about the prospects of the flagship cryptocurrency, it is impossible not to mention those who still consider it a bubble and predict its final collapse. Dieter Wermuth, an economist and partner at Wermuth Asset Management, said last week that the economy would be better and simpler without bitcoin. In his opinion, these risky investments are associated with social costs, and the cryptocurrency itself does not contribute to global prosperity. If we consider bitcoin as a currency, then, given the high volatility and lack of real use, BTC is doomed to failure. In this vein, it makes sense to ditch bitcoin altogether: it could be good for shared prosperity, as investing in cryptocurrencies is wasteful and takes away funds from overall economic growth. In addition, bitcoin creates social inequality, allows for money laundering, tax evasion, and is very energy intensive due to mining. Dieter Wermuth even called bitcoin "the biggest climate killer."
Cryptocurrency opponents received unexpected support from … artificial intelligence. ChatGPT Bot spoke about the formation of a recession-resistant investment portfolio. According to a document published by the Gold IRA Guide, it recommended allocating 20% for gold and other precious metals. The rest of its hypothetical portfolio consisted of bonds (40%), "defensive" stocks (30%) and cash (10%). The chatbot did not mention cryptocurrencies, much to the delight of well-known bitcoin critic and gold advocate Peter Schiff. "After all, artificial intelligence is pretty smart. It did not recommend any bitcoin deposit," this investor wrote.
By the way, answering the question of which cryptocurrency is the most promising today, ChatGPT did not name bitcoin, but ethereum. Artificial intelligence, of course, did not know about the latest events, but it seems to have hit the mark. In the last review, we detailed the Shapella hard fork, which will allow validators to withdraw the frozen ETH coins they have invested and locked on the network over the past 3 years in exchange for interest. Investors and traders were worried that an unlock could lead to a massive selling wave and, as a result, a sharp drop in the price. However, we are still seeing the opposite process: on May 13, ETH/USD rose above $2,000, and on the evening of Friday, April 14, it is trading in the $2,100 zone.
EUR/USD Weekly Outlook
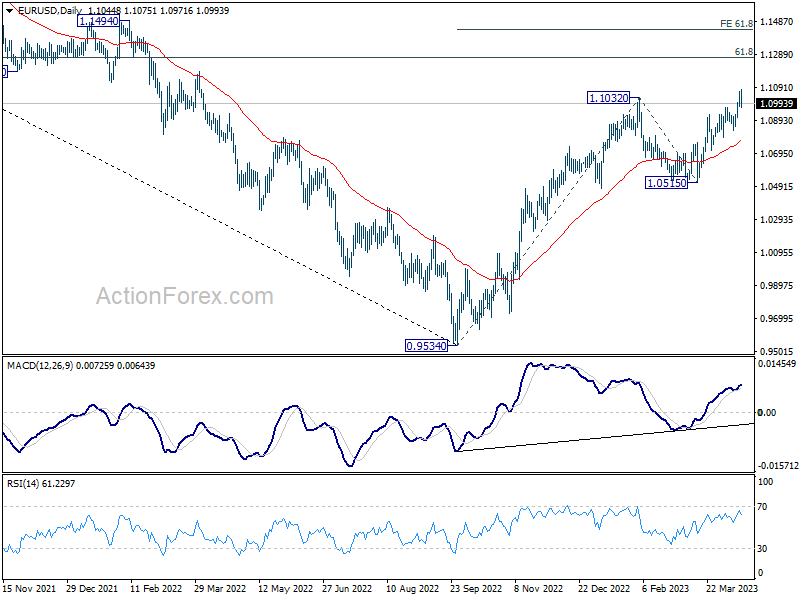
EUR/USD's up trend resumed last week by breaking through 1.1032 resistance. However, a temporary top was formed after hitting 1.1075. Initial bias is neutral this week for consolidations first. Outlook will stay bullish as long as 1.0830 support holds. Above 1.1075 will resume larger up trend to 1.1273 fibonacci level. Break there will target 61.8% projection of 0.9534 to 1.1032 from 1.0515 at 1.1441.
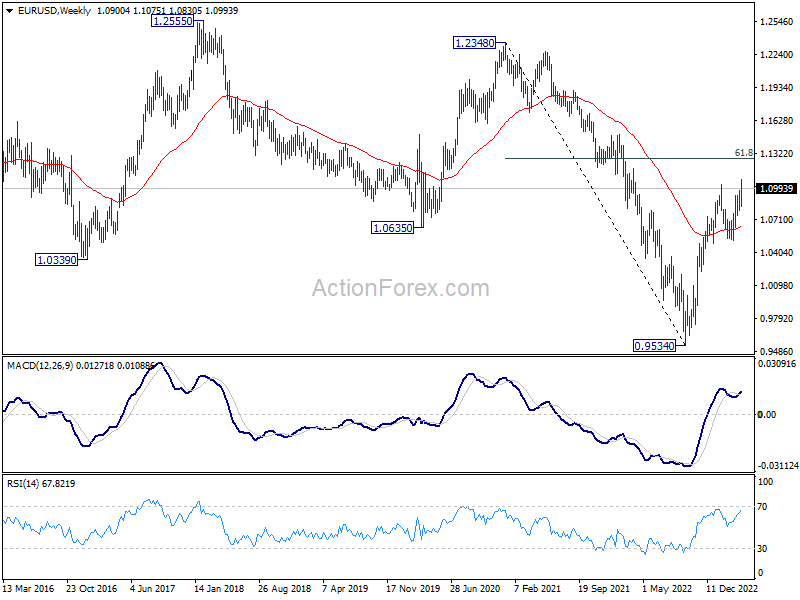
In the bigger picture, rise from 0.9534 (2022 low) is in progress for 61.8% retracement of 1.2348 (2021 high) to 0.9534 at 1.1273. Sustained break there will solidify the case of bullish trend reversal and target 1.2348 resistance next (2021 high). This will now remain the favored case as long as 1.0515 support holds, even in case of deeper pull back.
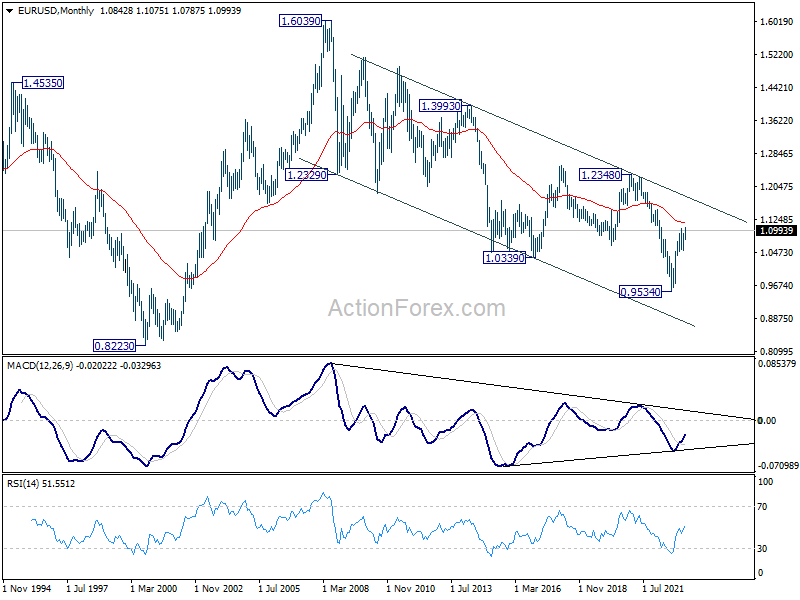
In the long term picture, while it's still early to call for long term trend reversal at this point, the strong break of 1.0635 support turned resistance (2020 low) should at least turn outlook neutral. Focus will turn to 55 M EMA (now at 1.1166). Rejection by this EMA will revive long term bearishness.
USD/JPY Weekly Outlook
USD/JPY edged higher to 134.04 last week but retreated again. Initial bias remains neutral this week first. On the upside, break of 134.04 will resume the rebound from 129.62 towards 137.90 resistance again. On the downside, break of 132.03 support will bring deeper fall to 130.62 support and then 129.62.
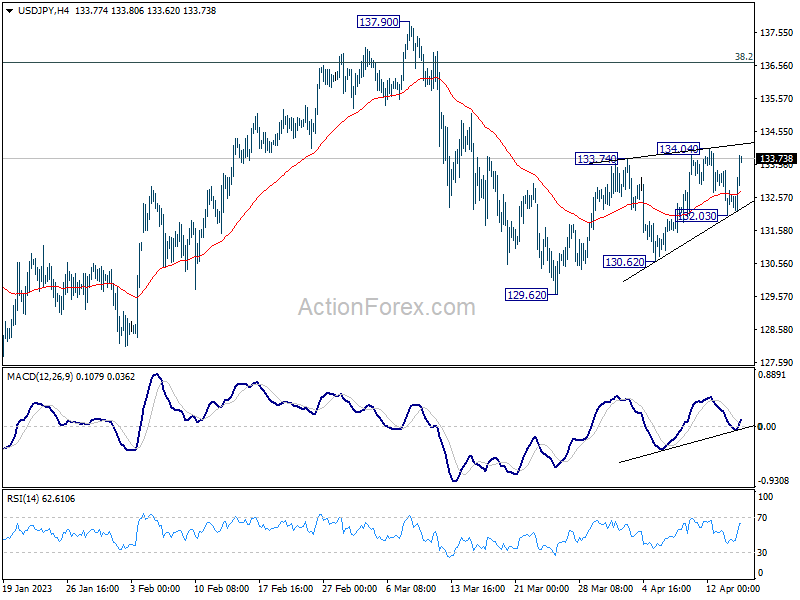
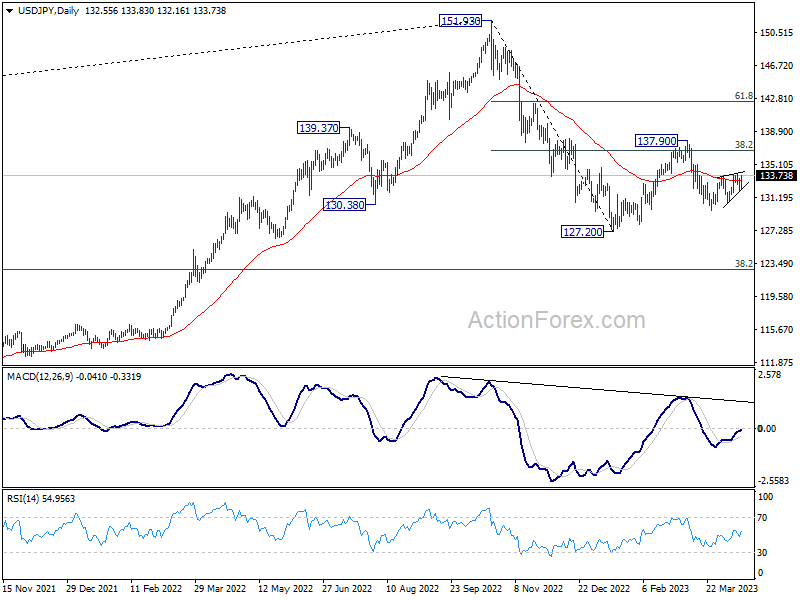
In the bigger picture, corrective pattern from 127.20 might be extending. But after all, down trend from 151.93 is expected to resume at a later stage. Break of 127.20 will resume this down trend and target 61.8% projection of 151.93 to 127.20 from 137.90 at 122.61. This will now be the favored case as long as 137.90 resistance holds.
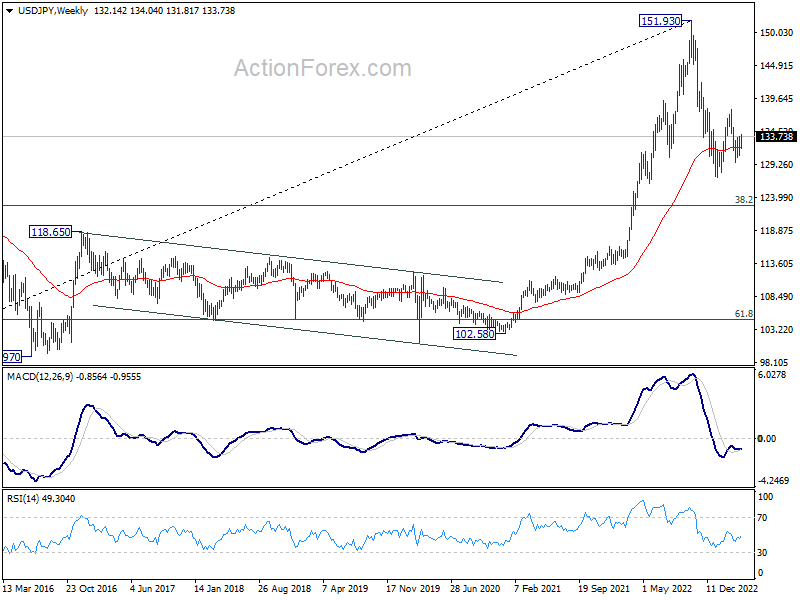
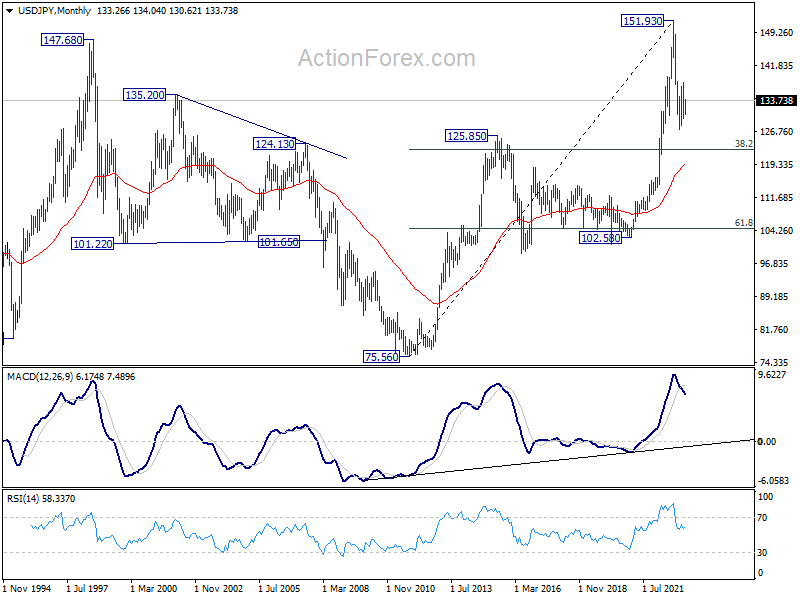
In the long term picture, price action from 151.93 is seen as developing into a corrective pattern to up trend from 75.56 (2011 low). While deeper decline cannot be ruled out, downside should be contained by 38.2% retracement of 75.56 to 151.93 at 122.75.
GBP/USD Weekly Outlook
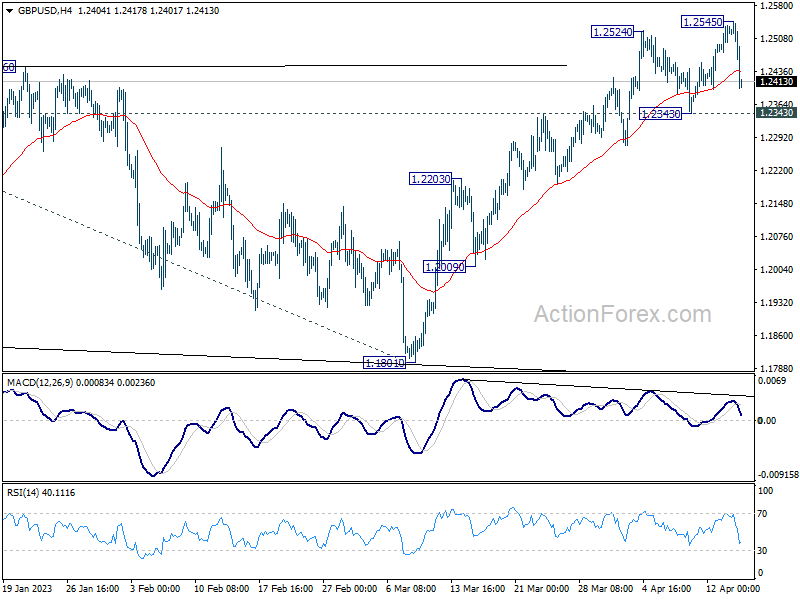
GBP/USD edged higher to 1.2545 last week but retreated again since then. Initial bias remains neutral this week for consolidations. Outlook will remain bullish as long as 1.2343 support holds. Above 1.2545 will target 1.2759 fibonacci level first. Firm break there will target 61.8% projection of 1.0351 to 1.2445 from 1.1801 at 1.3095. However, considering bearish divergence condition in 4H MACD, firm break of 1.2343 will confirm short term topping, and turn bias back to the downside for deeper pullback.
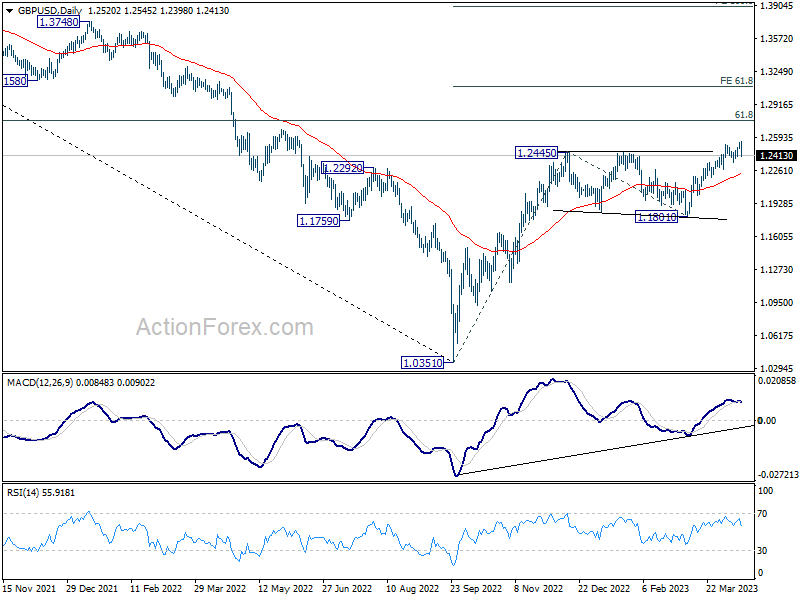
In the bigger picture, the rise from 1.0351 medium term term bottom (2022 low) is in progress for 61.8% retracement of 1.4248 (2021 high) to 1.0351 at 1.2759. Sustained break there will add to the case of long term bullish trend reversal. Further break of 61.8% projection of 1.0351 to 1.2445 from 1.1801 at 1.3095 could prompt upside acceleration to 100% projection at 1.3895. For now, this will remain the favored case as long as 1.1801 support holds, even in case of deep pull back.
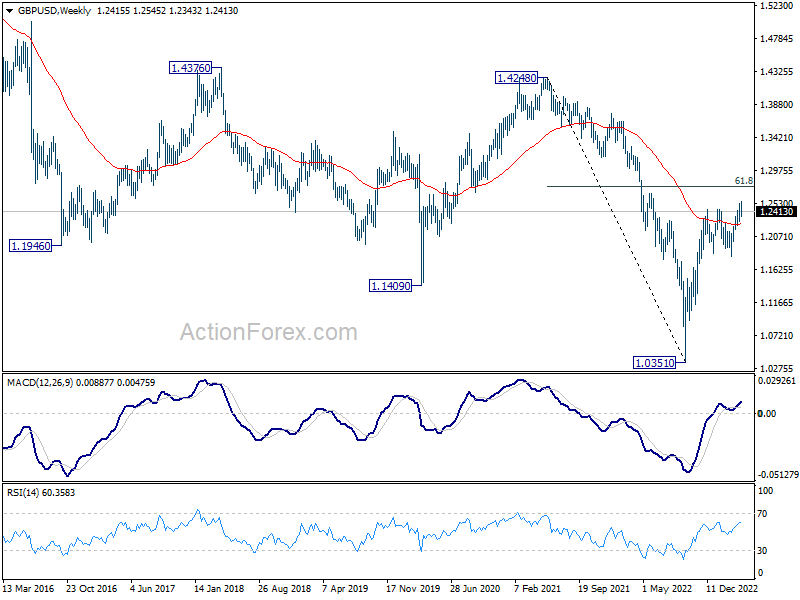
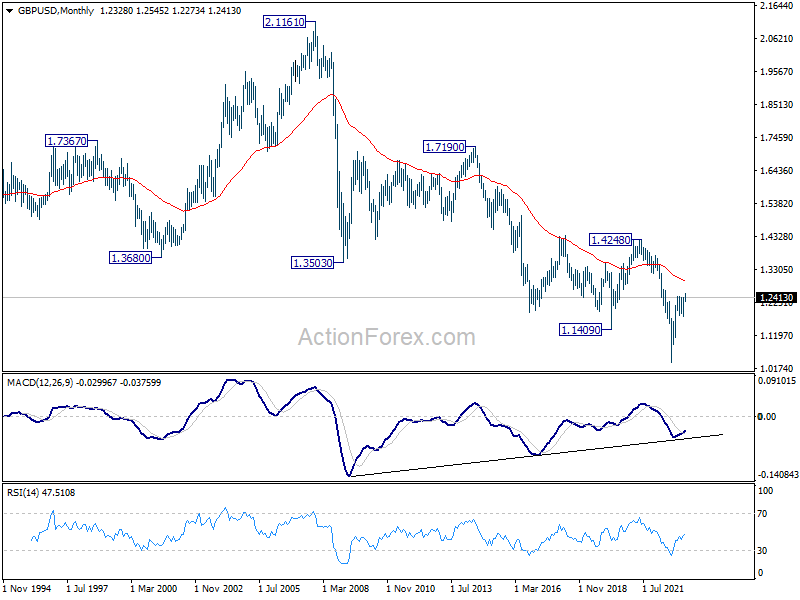
In the long term picture, while the rise from 1.0351 (2022 low) has been strong, there is no clear indicate of long term trend reversal yet. As long as 1.4248 resistance holds (2021 high), long term outlook will remain neutral at best.
USD/CHF Weekly Outlook
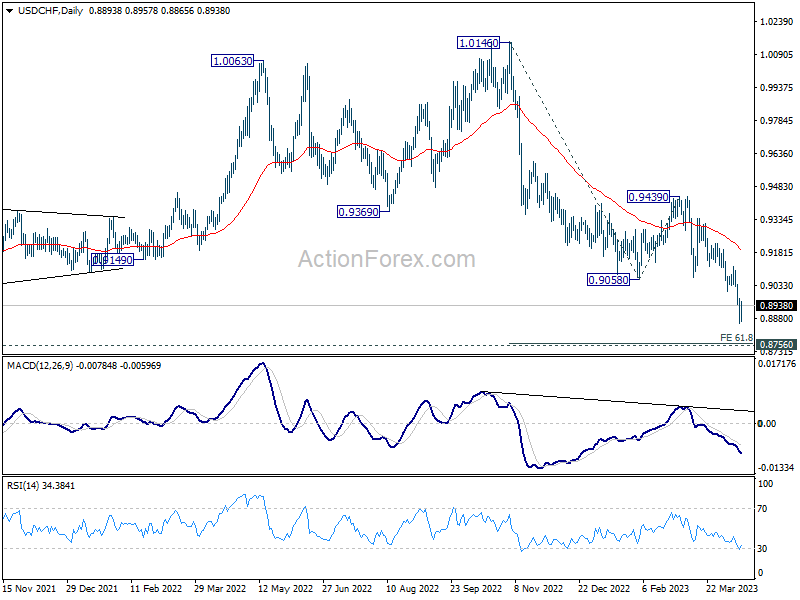
USD/CHF's down trend from 1.1046 resumed last week and fell to as low as 0.8858. A temporary low was formed there with subsequent recovery. Initial bias is turned neutral this week for some consolidations first. On the downside, below 0.8858 will resume the down trend to 61.8% projection of 1.0146 to 0.9058 from 0.9439 at 0.8767, which is close to 0.8756 long term support. Strong support is expected there to bring rebound, at least on first attempt. On the upside, break of 0.9070 support turned resistance will confirm short term bottoming and turn bias back to the upside.
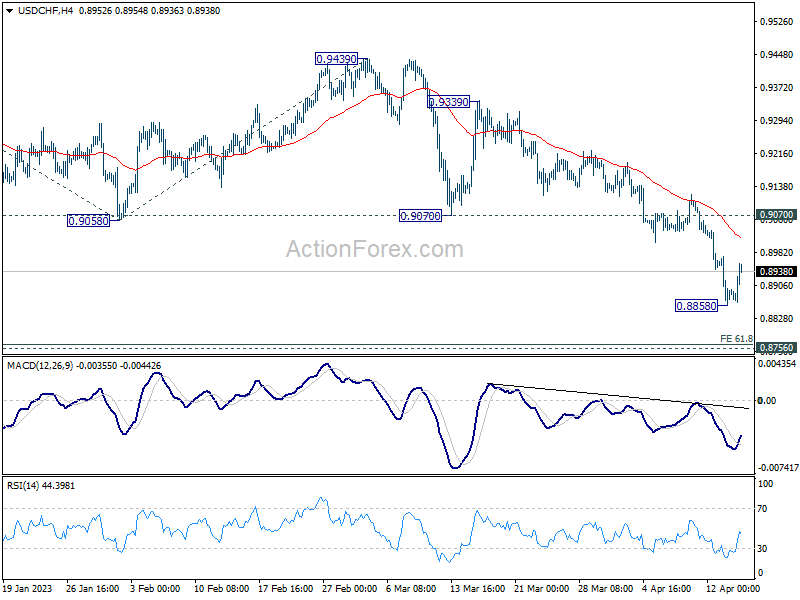
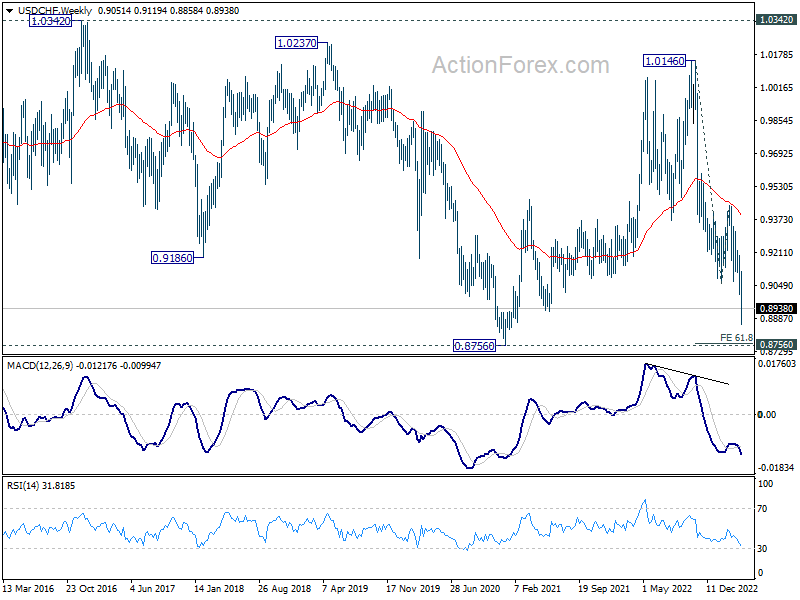
In the bigger picture, fall from 1.1046 (2022 high) is in progress for 0.8756 support (2021 low). But overall, this fall is still seen as a leg in the long term range pattern from 1.0342 (2016 high). So, downside should be contained by 0.8756 to bring reversal. Sustained break of 0.9058 support turned resistance will be the first sign of medium term bottoming. However, decisive break of 0.8756 will carry larger bearish implications.
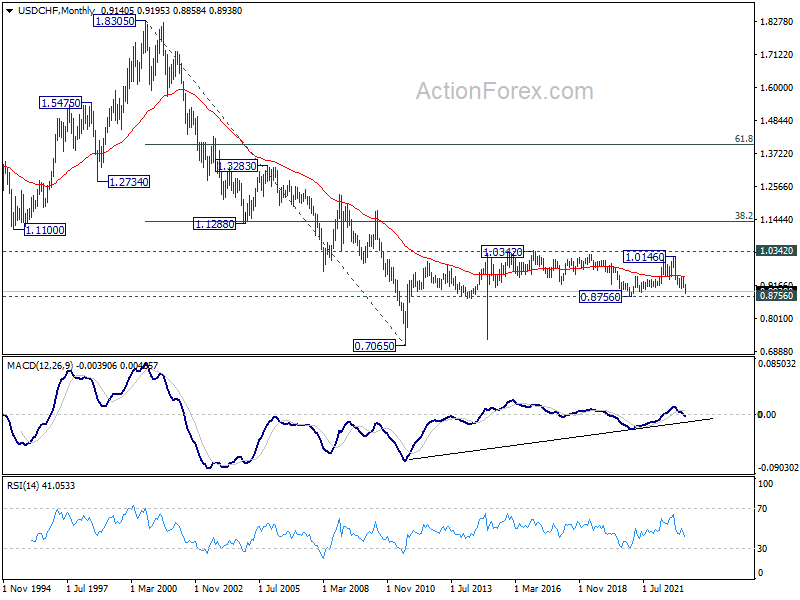
In the long term picture, long term sideway pattern from 1.0342 (2016 high) is expected to continue between 0.8756/1.0342. However, sustained break of 0.8756 will open up deeper fall back towards 0.7065 (2011 low).
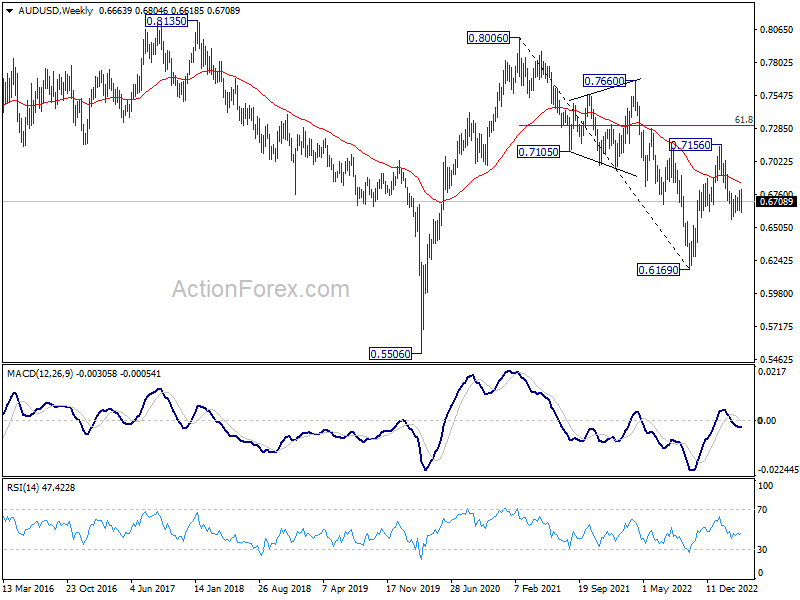
AUD/USD Weekly Report
AUD/USD rebounded strongly to 0.6804 last week but failed to sustained above 0.6792 resistance and dropped sharply since then. Initial bias remains neutral this week first. On the downside, break of 0.6619 will indicate that decline from 0.7156 is resuming through 0.6563 low. Nevertheless, sustained break of 0.6804 will bring stronger rally back to 61.8% retracement of 0.7156 to 0.6563 at 0.6929.
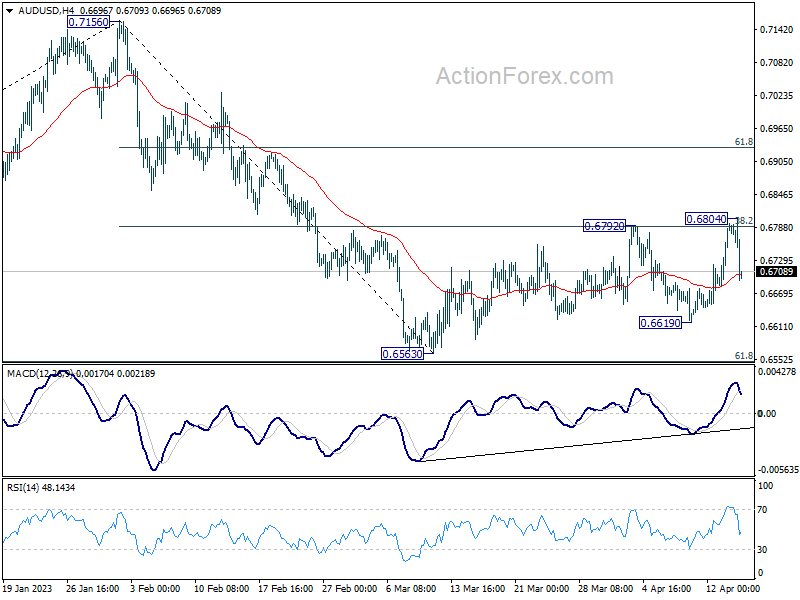
In the bigger picture, as long as 61.8% retracement of 0.6169 to 0.7156 at 0.6546 holds, the decline from 0.7156 is seen as a correction to rally from 0.6169 (2022 low) only. Another rise should still be seen through 0.7156 at a later stage. However, sustained break of 0.6546 will raise the chance of long term down trend resumption through 0.6169 low.
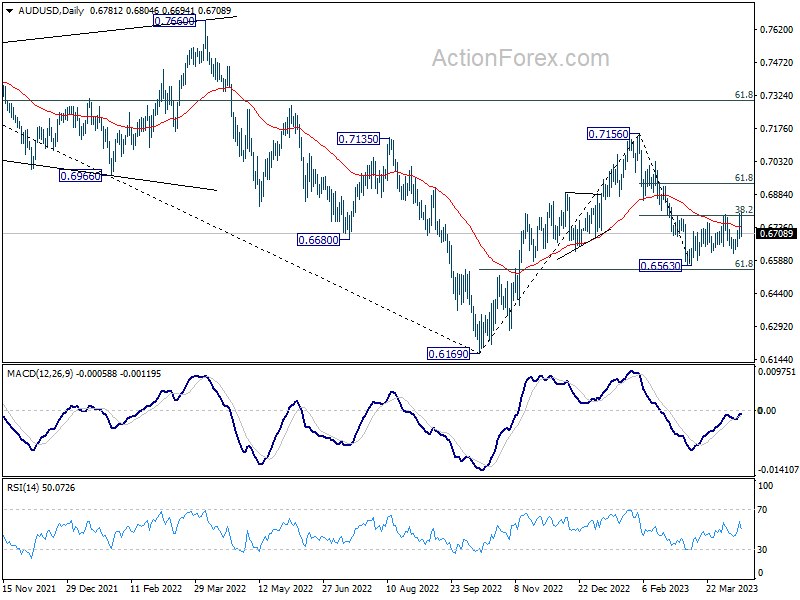
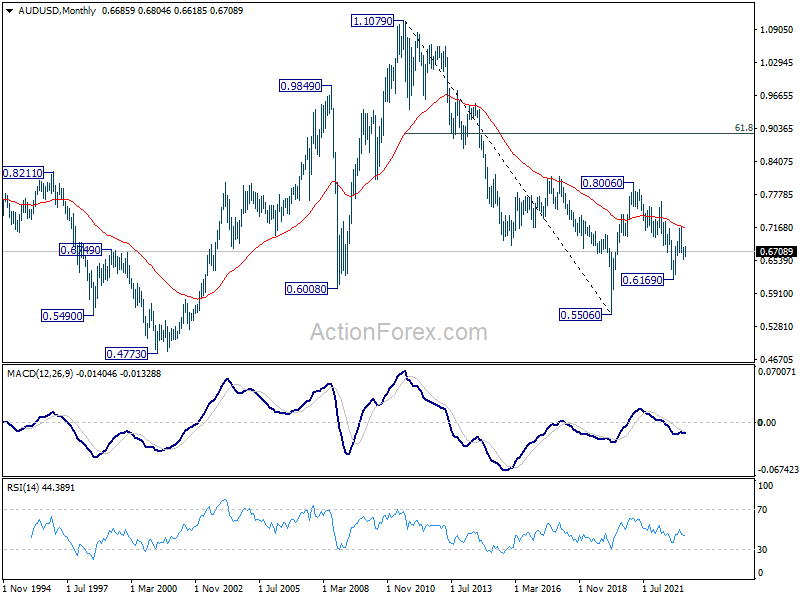
In the long term picture, initial rejection by 55 M EMA (now at 0.7145) retains long term bearishness. That is, down trend from 1.1079 (2011 high) could still resume through 0.5506 (2020 low) on resumption.