
Sample Category Title
Data Probably Have to be Very Weak for Fed to Leave Wait-and-See Bias
Markets
Going into the weekend, market dominos fell in place for an overdue correction on a stretched metals/USD debasement trade. It’s not clear what domino piece went down first. Gold, silver but also copper already showed signs of vertigo on Thursday. The dollar rebound was at that time still limited, but the greenback gained traction on Friday. The announcement of Kevin Warsh to be the new Fed chair also helped the correction. It removed uncertainty and the new Fed governor maybe isn’t a bad choice concerning the debate on Fed independence. Whatever the trigger, metals including gold, silver copper and others fell prey to profit taking. The mirroring image was a rebound of the dollar. DXY closed the week at 97.00, to be compared with a 95.55 low on Tuesday. EUR/USD closed at 1.1855, returning below the previous top of 1.1919. The correction in safe havens like gold and silver didn’t help US equities. The Nasdaq lost 0.94%. US interest rate markets don’t draw any firm conclusions on Fed policy after Warsh’s appointment. The US yield curve steepened slightly (2-y: -3.7 bp; 30-y: +2 bps). German yields changed less than one bp even as some national inflation data (Spain, Germany) printed slightly higher than expected.
Friday’s correction in commodities (gold, silver, copper, oil) but also equities continues this morning. The dollar maintains most of last week’s gain, but the rebound slows. Commodity-related currencies (AUD, NOK) are ceding ground. The fate of this repositioning remains the focus for global trading at the start of the week. However markets this week also get the usual US economic update, to begin with the manufacturing ISM (today), JOLTS job openings (tomorrow), ADP job growth and services ISM (Wed) and the payrolls on Friday. Data might (or might not) validate the Fed’s view that the economy is growing at a solid pace and that the labour market stabilizes. Data probably have to be very weak for the Fed to leave its wait-and-see bias. Warsh looking over Powell’s shoulder won’t change that. Last week’s better than expected EMU growth data and national inflation data also suggest the ECB can consider itself being in a good place to watch and see. At Thursday’s ECB meeting, markets probably will look for the ECB’s assessment on recent (geopolitical) turmoil, including the impact of a weaker dollar/stronger euro. We also keep an eye at the policy meetings of the likes of the Czech National bank, the National Bank of Poland and the Reserve Bank of Australia. The CNB will likely keep its policy rate at 3.5%, but is there room left for an additional finetuning cut? The NBP decision probably will be a close call (unchanged at 4% or 3.75%). Also Tuesday’s policy decision of the Reserve Bank of Australia (RBA) will receive more than average attention. Will the RBA (have to) backtrack on earlier easing as inflation fails to return to target as hoped? For the Bank of England (expected unchanged at 3.75%) it’s probably too early to already front run on hoped for easing of inflation.
News and views
S&P raised Italy’s rating outlook to positive from stable and confirmed the rating at BBB+. The rating agency praised the country’s resilience amidst trade and tariff uncertainty, its ability to post net current account surpluses and the continuous improvements in Italy’s net external creditor position. Budgetary consolidation is gradually advancing, allowing for a projected headline deficit below the European Union’s 3% target in 2026. The numbers are still due for release, but it’s expected that Italy’s deficit already dropped below that mark last year. S&P expects debt-to-GDP to have come in at 136% last year. That is elevated, the agency says, but should start to decline from 2028 onwards. Italy is forecasted to grow steadily over the next three years, be it more slowly than peers.
India in its new budget unveiled on Sunday is sticking to budgetary prudence. It steered clear from big-ticket, economy-boosting spending measures and instead focused on shielding the country from rising global risks. The budget is packed with support for embittered exporters (hurt by 50% US levies) and contains more backing for strategic sectors such as rare earths, semiconductors and critical minerals to boost self-reliance. The spending plan also contains infrastructure spending and an 18% hike in defense expenditure. These measures come along with intentions to cut red tape to do business easier and improve productivity. The deficit under the this budget is expected to ease marginally from 4.4% to 4.3%. Indian stocks during a special session yesterday slumped in a move widely attributed to an equity transaction tax hike. USD/INR this morning declines to 91.61, still close to the 92 record high (INR low) seen and last week.
Metals Slammed as Leverage Gets Flushed
Those who hoped that Friday’s sharp drop in gold and silver prices — which shed 9% off gold and 27% off silver — would slow this Monday woke up to another nightmare this morning. Both metals are heavily sold in Asia, suggesting that leveraged positions and stop losses have not yet been fully cleared.
There has been a lot of speculation in recent weeks, and that speculative air is now coming out quite violently.
Looking at levels, for gold, I had been pointing to a possible correction toward the $4’600–4’800 range in the event of a sell-off, and we are hovering near $4’600 per ounce support this morning. I must admit that the sell-off has been far more brutal than I — and many — expected. This morning, the minor 23.6% Fibonacci retracement from October 2023 to last week has been cleared.
Given the high volatility and the size of leveraged positions, the sell-off could deepen toward the 50-DMA (currently near $4’480) and potentially further to the 200-DMA (currently near $4’235). The key technical level I am watching sits lower, at $4’115 — the major 38.2% Fibonacci retracement of the rally since late 2023. This level should hold if the “Sell America, Sell the Dollar” theme remains in play amid waning trust in White House trade and geopolitical policies.
For silver, the rally on the way up was faster than gold’s, so the correction on the way down is faster too. Silver was down more than 26% on Friday, another 13% this morning, and losses are being printed faster than I can finish my sentence. Overall, it has given back nearly 40% since last week’s peak at the time of writing.
More importantly, silver has slipped below two key technical levels: the 50-DMA and the major 38.2% Fibonacci retracement. The latter suggests silver has entered a bearish consolidation phase, with the risk of deeper losses before the correction slows.
How deep? The next key level is the 50% retracement, just below $70 per ounce — a psychological level that could act as a speed bump and attract dip buyers. Below that, the major 61.8% retracement at $57.80 per ounce would be another level to watch.
Whether the latest sell-off in metals becomes an opportunity for a fresh start — especially for those who missed the rally — will depend on several factors, including the US dollar.
The US dollar has been better bid since Friday, with the dollar index rebounding around 1% off four-year lows following news that the Federal Reserve may have a new Chair. Kevin Warsh was chosen to be the next Fed President and will replace Jerome Powell if confirmed.
The nomination ends months of speculation over who would lead the Fed next and offers clues about the future policy direction. Based on his past views, Mr Warsh has been critical of the Fed’s leadership and its relentlessly expanding balance sheet. He has also voiced strong concerns about inflation eroding purchasing power while inflating asset prices.
As such, he is expected to favour balance sheet reduction for bringing inflation down. And there is scope to shrink the Fed’s balance sheet substantially! Before 2008, the balance sheet stood below $1 trillion, peaked near $9 trillion in 2022, and now sits around $6.5 trillion. That could mark the end of the era of free money for markets — and that is bad news.
A balance sheet reduction could pose a major challenge for long-dated US bonds and US equity indices that have enjoyed a multi-decade climb. The knee-jerk reaction to the Warsh news was a spike in the US 10-year yield, which has eased this morning, partly as flows exit metals. But over a longer horizon — 12 months and beyond — a smaller Fed balance sheet would add upward pressure on long maturity yields.
Regarding rate cuts... the market reaction in the US 2-year yield suggests markets still expect rate cuts, betting that balance sheet reduction — combined with AI-driven productivity gains — could ultimately lower inflation. I won’t lie: I agree. The Fed’s monstrous balance sheet was always going to be addressed. It just might be happening now.
So what does that mean for equities? Could lower rates offset the impact of a smaller Fed balance sheet? It all depends on how quickly that balance sheet shrinks. The US — and global — economy has become deeply addicted to central bank buying, and weaning markets off free money could be so painful that some think the Fed’s balance sheet could ultimately end up larger under Warsh than before. Time will tell.
US equities are poised to start the week with a sharp sell-off, despite falling yields. Risk-off dominates the narrative — ironically triggered in part by the collapse in gold. If gold cannot protect investors during a sell-off, what can?
The Swiss franc? The USDCHF is trading below 0.78, raising questions about whether negative rates could return in Switzerland this year.
Elsewhere, the European Central Bank (ECB) and the Bank of England (BoE) are expected to stand pat this week, while the Reserve Bank of Australia (RBA) is expected to hike. Policy divergence should create attractive FX opportunities.
In equities, it is a heavy earnings week: Palantir and Disney today, AMD tomorrow, Google and Qualcomm on Wednesday, and Amazon on Thursday. Even strong results from Meta, Microsoft and Apple have failed to fully revive bullish sentiment. Investors are increasingly selective, scrutinising whether cloud growth is truly AI-driven and whether AI investments are delivering real returns. Earnings will not be a walk in the park.
First 2026 Manufacturing PMIs Set to Release
In focus this week
Monetary policy meetings are scattered throughout the week with the Reserve Bank of Australia (RBA) on Tuesday, National Bank of Poland on Wednesday and the Bank of England and ECB on Thursday. We expect the RBA to deliver its first 25bp rate hike after three cuts seen in 2025. Analyst consensus is also expecting a hike, and markets are pricing around 75% probability for the increase. For the ECB, we expect them to leave the deposit rate unchanged at 2.00% in line with market pricing, with Lagarde refraining from giving new policy signals. Read more in our ECB Preview - Stronger euro? No problem, 30 January.
Today, January manufacturing PMIs are set for release for the euro area and UK, alongside the ISM manufacturing figures for the US. We expect the final euro area manufacturing PMI data to confirm the flash print which rebounded slightly to 49.4. In the US, flash PMI and the regional Fed indices that were released earlier have signalled improving, but still subdued growth.
Rounding off the week on Friday, the US labour market will be in the spotlight. We expect January nonfarm payrolls to release at +60k (cons: +78k, prior, +50k) pointing to a modest increase, yet a clear cooling compared to earlier last year. We expect the unemployment rate at 4.4% in line with the market consensus (cons: 4.4%, prior 4.4%).
Economic and market news
What happened overnight
In China, Chinese PMIs for January were a mixed bag but continue to point to muddling through for the Chinese economy. The official NBS PMI manufacturing dropped from 50.1 to 49.3 (consensus 50.1) whereas the private RatingDog PMI manufacturing increased from 50.1 to 50.3 (consensus 50.0). The details show the difference is due to export orders where NBS PMI dropped slightly while RatingDog PMI increased. Other details of interest was a rise in the PMI output price index from both sources above 50 suggesting the deflationary pressures are easing. Employment hung on to gains from previous months giving some rays of light for the consumers. But the construction PMI nose-dived from 47.4 to 40.1 after some improvement in recent months.
In Japan, Nikkei manufacturing PMI climbed to 51.5 in January, confirming the flash print, and up from 50 in December, signalling the first expansion since June. The increase was the strongest improvement since August 2022, driven by an increase in new orders, including exports, while output and employment increased notably.
What happened over the weekend
In the US, President Trump announced his nomination of Kevin Warsh as Fed chair. As a previous Fed governor, Warsh obtained a hawkish reputation, however, leading up to the nomination he has aligned with Trump in the push for lower interest rates. The nomination of Warsh still awaits Senate approval, where a majority is required for him to be instated.
The PPI increased by 0.5% m/m (cons: 0.2% m/m, prior: 0.2%), the largest increase in five months. The larger-than-expected increase was driven by the service sector, while the goods market remained unchanged.
On Saturday, the US entered a government shutdown after the House of Representatives failed to meet the deadline for passing the appropriations bill, despite the Senate approving it with a 71-29 vote. Following last week's escalations in Minnesota, where two US citizens were killed, the Senate separated funding for the Department of Homeland Security from the broader spending package in order to approve. This approach ensures continued funding for other federal agencies once passed by the House, granting Congress two weeks to negotiate the remaining funding for the Department of Homeland Security. The House is expected to address the spending package on Monday, with the shutdown potentially ending on Tuesday.
In Finland, Scope downgraded the Finnish credit rating to AA from AA+. Finland's public debt ratio has continued to rise and is now projected by the Finnish Finance Ministry to exceed 97% by 2030, which is 4 pp higher than Scope expected last August. Finland is also being placed under the European Union's Excessive Deficit Procedure (EDP). However, the debt brake agreement, supported by nearly all political parties in Finland, might ease concerns about insufficient fiscal consolidation.
In the euro area, the economy grew more than expected in the final quarter of 2025 and unemployment fell. Real GDP growth came in at 0.3% q/q (cons: 0.2% q/q, prior: 0.3% q/q). The surprise was driven by stronger-than-expected growth in Germany, Spain, and Italy while France grew as expected - still at a modest pace. As growth seems to be driven by consumption and it was broad-based in the eurozone, this is a hawkish surprise for the ECB that forecasted 0.2% q/q growth. Data on the unemployment was also hawkish with the unemployment rate ticking down to 6.2% in December from 6.3% due to a reduction in the number of unemployed by 60k. These data releases support the "good place" assessment of the ECB and cements our expectations of an unchanged decision at the coming meetings.
In Norway, retail sales declined by 0.7% m/m in December, slightly below our estimate of 0.5% m/m and a decline from the 1.2% m/m revised increase in November. The decline was broad-based across goods and due to Black Week shifting Christmas trades. Retail sales rose 3.2% y/y in December marking the weakest growth since May.
In Sweden, December retail sales declined as expected by 0.7% m/m, after a 1.1% m/m increase in November. Retail sales increased by 1.5% y/y, down from a revised increase in November of 6.9% y/y primarily driven by Black week sales.
In China, manufacturing PMI came in below consensus at 49.3 in January, a drop from 50.1 in December. Non-manufacturing PMI declined to 49.4 from 50.2 in December, resulting in its lowest levels since December 2022, although January historically is a slower period.
Equities: Global equities were marginally lower on Friday, recording a -0.4% decline, in what at face value could look like a classic risk-off mode with a continuation of last week's equity rotation, with large caps faring better than small caps. The S&P 500 closed -0.4%, Nasdaq -0.9%, and Russell 2000 down more than 2%.
FI and FX: While US yields showed no clear direction on Friday, UST10y has dropped from 4,25% to 4.21% this morning. The USD strengthened broadly on Friday after the nomination of Kevin Warsh as new Fed Chair and EUR/USD slipped from just below 1.20 to around 1.1850. Meanwhile, USD/JPY moved from 153 to 155 after dovish remarks from PM Takaichi, and cable slipped from above 1.38 to below 1.37. The SEK traded poorly going into January close amid broad dollar strength, risk-off and SEK-negative rebalancing flows, where EUR/SEK gained five, and USD/SEK ten figures in the last hours on Friday. The NOK underperformed in a similar fashion. EUR/SEK is now at 10.58 and EURNOK at 11.47.
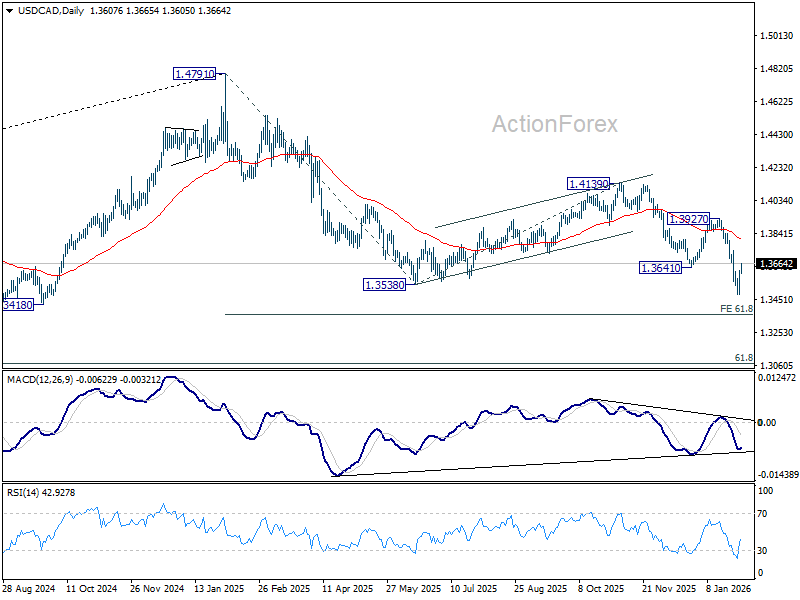
USD/CAD Daily Outlook
Daily Pivots: (S1) 1.3525; (P) 1.3575; (R1) 1.3669; More...
Intraday bias in USD/CAD is turned neutral with current recovery and some consolidations would be seen above 1.3480. Further decline is in favor as long as 55 4H EMA (now at 1.3664) holds. Below 1.3480 will target 61.8% projection of 1.4791 to 1.3538 from 1.4139 at 1.3365. However, firm break of 55 4H EMA will indicate short term bottoming, and bring stronger rebound towards 55 D EMA (now at 1.3805) instead.
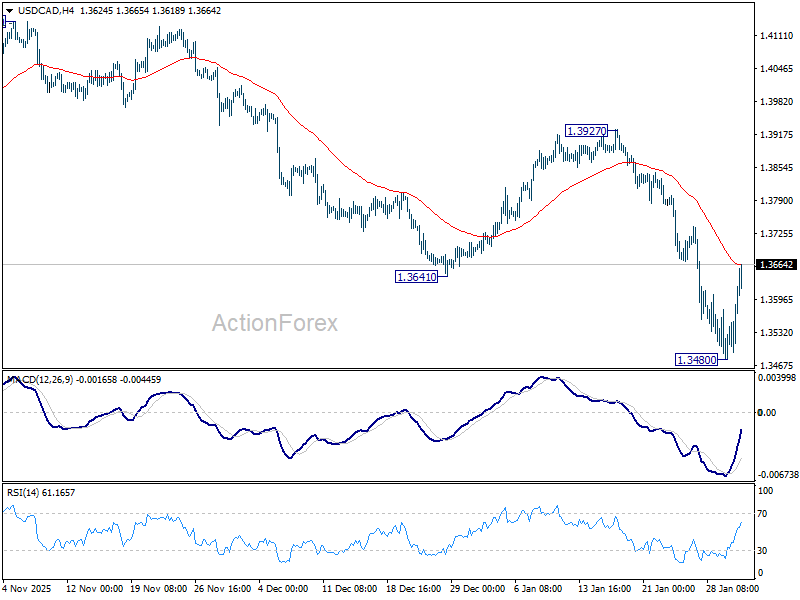
In the bigger picture, price actions from 1.4791 are seen as a corrective pattern to the whole up trend from 1.2005 (2021 low). Deeper fall could be seen as the pattern extends, and break of 1.3538 will target 61.8% retracement of 1.2005 to 1.4791 at 1.3069. For now, medium term outlook will be neutral at best, until there are signs that the correction has completed, or that a bearish trend reversal is confirmed.
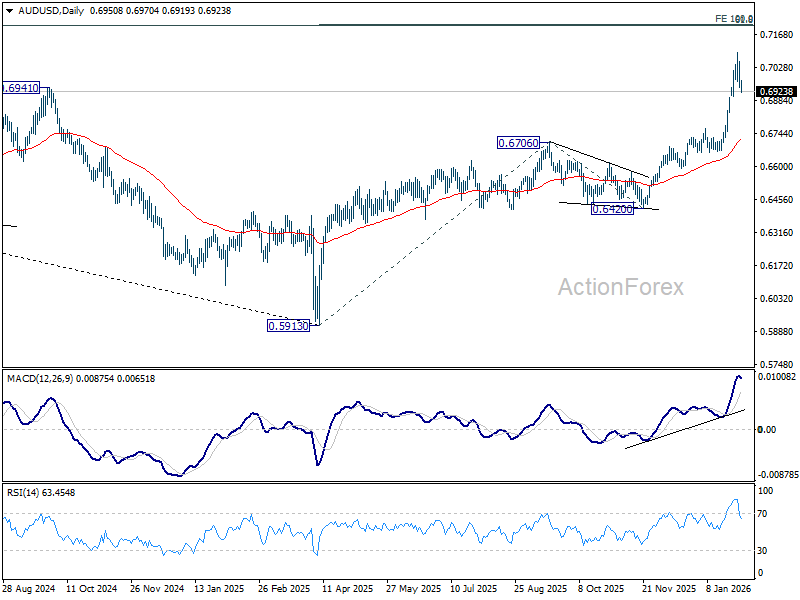
AUD/USD Daily Report
Daily Pivots: (S1) 0.6917; (P) 0.6986; (R1) 0.7033; More...
Intraday bias in AUD/USD stays neutral for consolidations below 0.7093. Risk will stay on the upside as long as 55 4H EMA (now at 0.6914) holds. Above 0.7093 will extend larger up trend to 100% projection of 0.5913 to 0.6706 from 0.6420 at 0.7213 next. Nevertheless, break of 55 4H EMA will confirm short term topping, and bring lengthier consolidations before rally resumption.
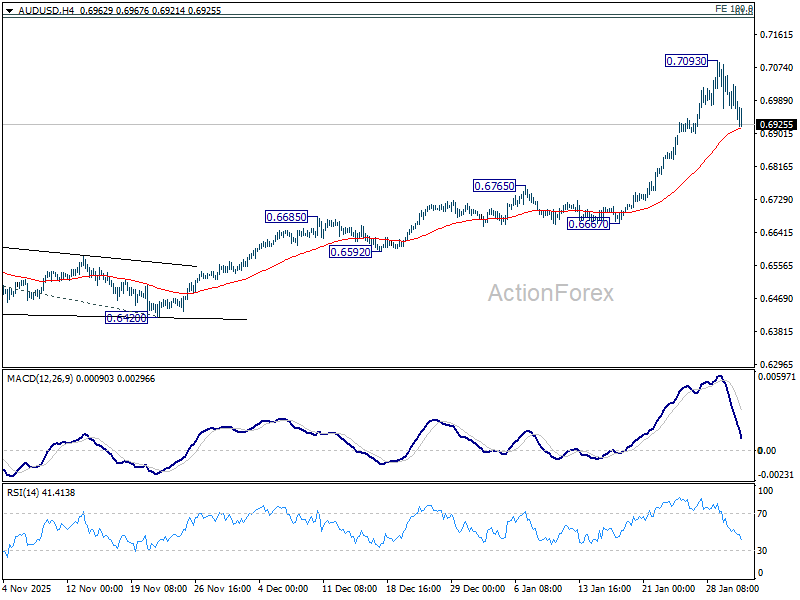
In the bigger picture, current development argues that rise from 0.5913 (2024 low) is reversing whole down trend from 0.8006 (2021 high). Further rally should be seen to 61.8% retracement of 0.8006 to 0.5913 at 0.7206. This will remain the favored case as long as 0.6706 resistance turned support holds, even in case of deep pullback.
EUR/USD Daily Outlook
Daily Pivots: (S1) 1.1809; (P) 1.1892; (R1) 1.1934; More….
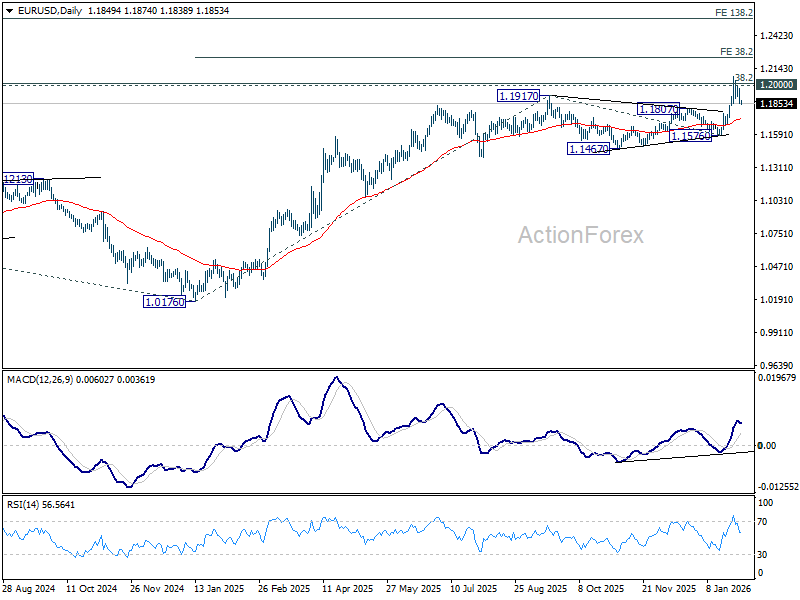
Intraday bias in EUR/USD stays neutral and more consolidations would be seen. Downside of retreat should be contained by 1.1835 support. Decisive break above 1.2 will carry larger bullish implications. Next near term target will be 38.2% projection of 1.0176 to 1.1917 from 1.1576 at 1.3434. However, break of 1.1835 will indicate short term topping, and turn bias to the downside for deeper pullback.
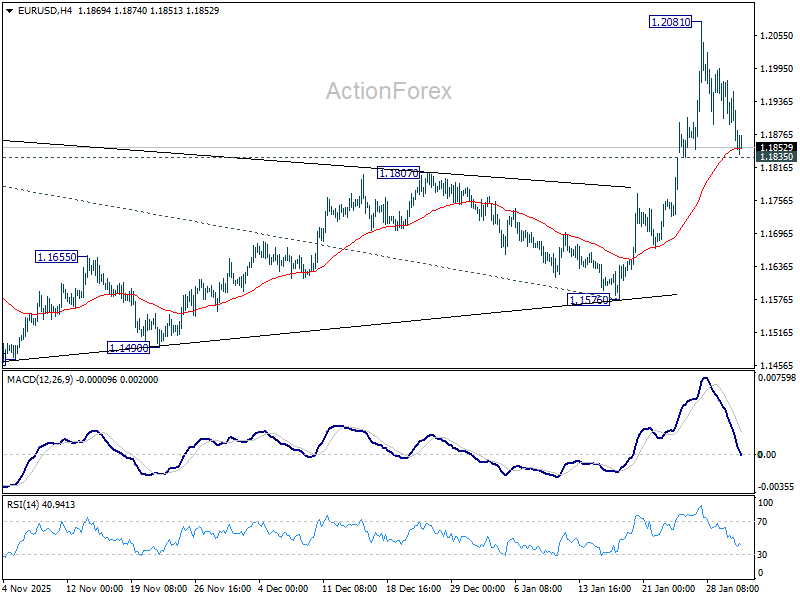
In the bigger picture, as long as 55 W EMA (now at 1.1458) holds, up trend from 0.9534 (2022 low) is still in favor to continue. Decisive break of 1.2 key psychological level will add to the case of long term bullish trend reversal. Next medium term target will be 138.2% projection of 0.9534 to 1.1274 from 1.0176 at 1.2581. However, sustained trading below 55 W EMA will argue that rise from 0.9534 has completed as a three wave corrective bounce, and keep long term outlook bearish.
GBP/USD Daily Outlook
Daily Pivots: (S1) 1.3638; (P) 1.3726; (R1) 1.3774; More...
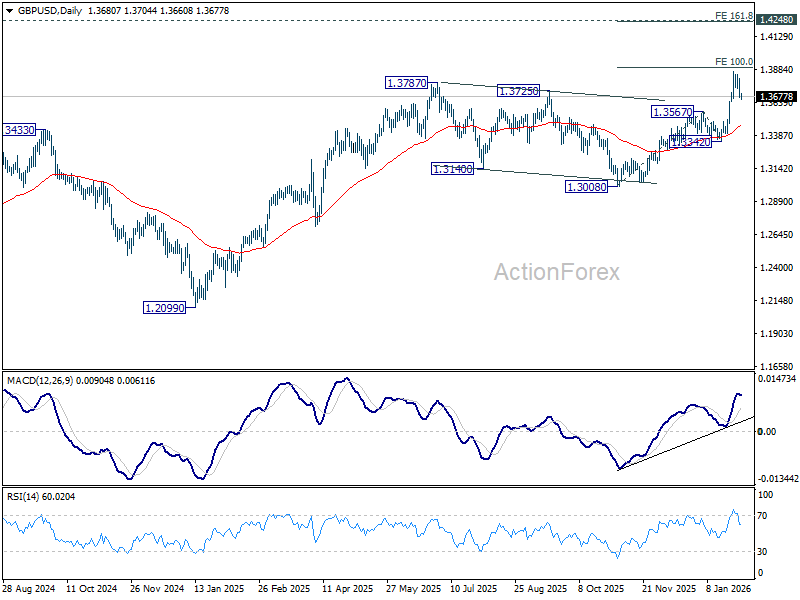
Intraday bias in GBP/USD remains neutral and more consolidations could be seen. But downside should be contained by 1.3641 to bring another rally. Firm break of 100% projection of 1.3008 to 1.3567 from 1.3342 at 1.3901 will pave the way to 161.8% projection at 1.4246, which is close to 1.4248 key structural resistance. However, break of 1.3641 will turn bias to the downside for deeper pullback.
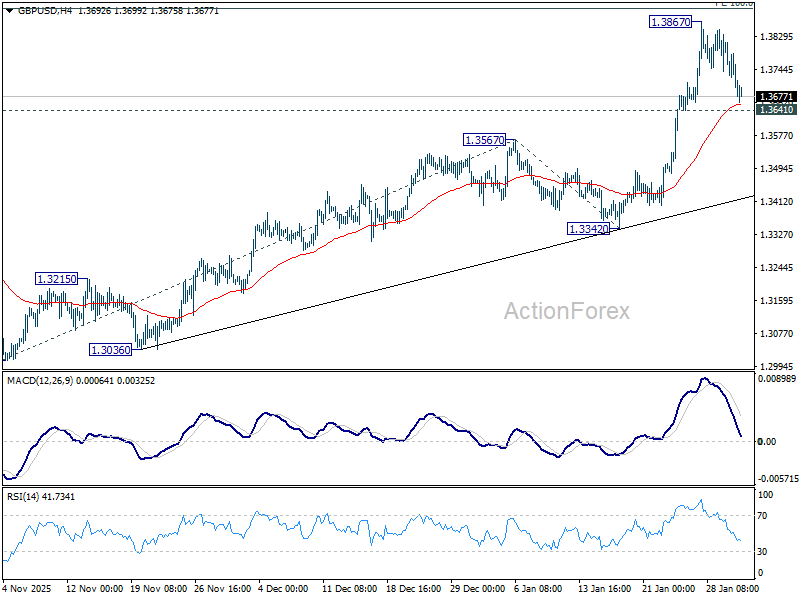
In the bigger picture, rise from 1.0351 (2022 low) is resuming by breaking through 1.3787 high. Further rally should be seen to 1.4284 key resistance (2021 high). Decisive break there will add to the case of long term bullish trend reversal. For now, outlook will stay bullish as long as 1.3008 support holds, even in case of deep pullback.
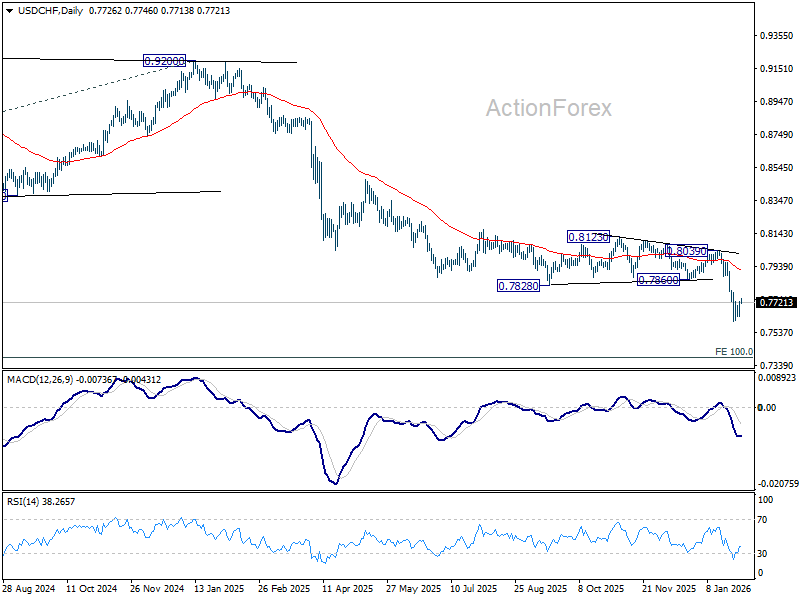
USD/CHF Daily Outlook
Daily Pivots: (S1) 0.7667; (P) 0.7699; (R1) 0.7762; More….
Intraday bias in USD/CHF remains neutral and more consolidations could be seen above 0.7603. With 0.7792 resistance intact, outlook remains bearish. On the downside, break of 0.7603 will resume the larger down trend to 0.7382 projection level next. However, firm break of 0.7792 will turn bias back to the upside, for stronger rebound to 0.7860 support turned resistance and above.
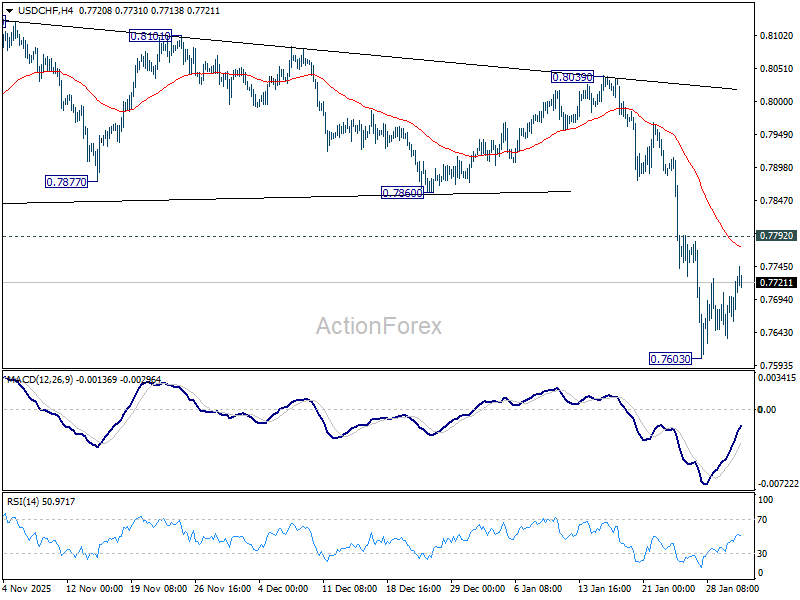
In the bigger picture, larger down trend from 1.0342 (2017 high) is still in progress and resuming. Next target is 100% projection of 1.0146 (2022 high) to 0.8332 from 0.9200 at 0.7382. In any case, outlook will stay bearish as long as 55 W EMA (now at 0.8166) holds.
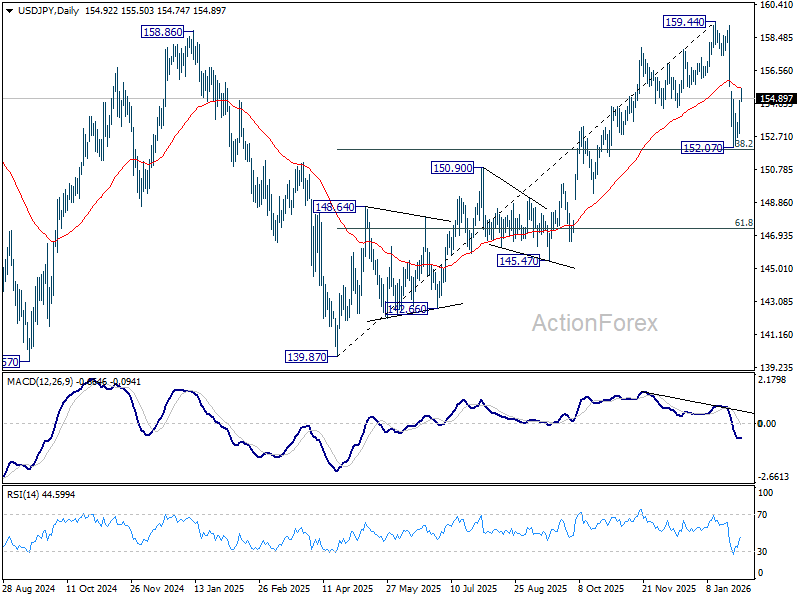
USD/JPY Daily Outlook
Daily Pivots: (S1) 153.49; (P) 154.15; (R1) 155.42; More...
USD/JPY's break of 154.86 resistance suggests that a short term bottom was formed at 152.07, ahead of 38.2% retracement of 139.87 to 159.44 at 151.96. Corrective pattern from 159.44 should be in the second leg. Intraday bias is back on the upside, and sustained trading above 55 D EMA (now at 155.52) will pave the way back to retest 159.44. However, decisive break of 151.96 will argue that it is reversing whole rise from 139.87. Deeper decline would then be seen to 61.8% retracement at 147.34.
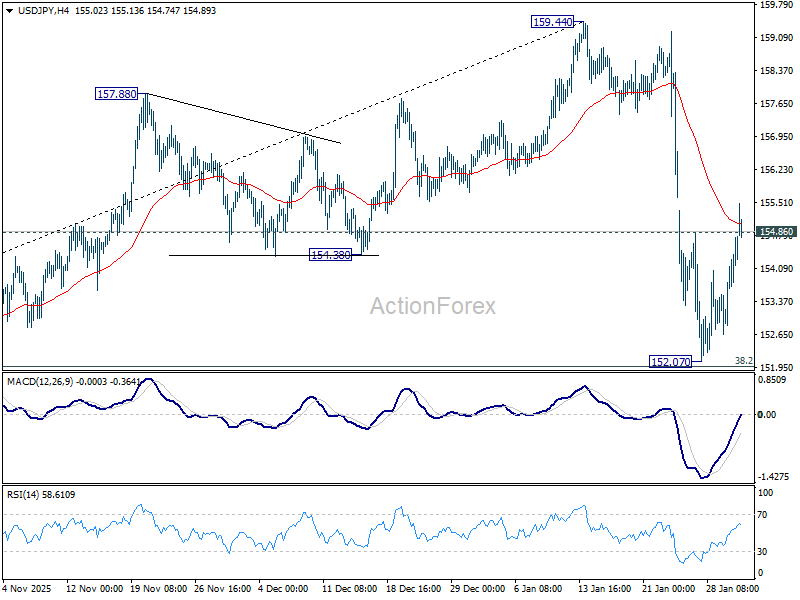
In the bigger picture, outlook is unchanged that corrective pattern from 161.94 (2024 high) should have completed with three waves at 139.87. Larger up trend from 102.58 (2021 low) could be ready to resume through 161.94. This will remain the favored case as long as 55 W EMA (now at 151.59) holds. However, sustained break of 55 W EMA will argue that the pattern from 161.94 is extending with another falling leg.
Yen Slips as Takaichi Tones Down Intervention Rhetoric
Yen came under renewed pressure today after comments over the weekend from Japanese Prime Minister Sanae Takaichi suggested a softer stance on currency weakness. The shift in tone has been interpreted as reducing the near-term threat of official intervention, reopening the door for Yen sellers.
In a campaign speech on Saturday, Takaichi highlighted the benefits of a weaker Yen for Japan’s export sector. “People say the weak Yen is bad right now, but for export industries, it’s a major opportunity,” Takaichi said, adding that the currency has helped cushion the impact of U.S. tariffs on sectors ranging from food to automobiles. Her remarks were seen as implicitly tolerant of Yen depreciation.
However, the rhetoric was partly walked back on Sunday. In a post on X, Takaichi said she did not favor any specific Yen direction and stressed that her intention had been misinterpreted. She added that, as prime minister, she would refrain from commenting directly on currency levels. “I did not say which is better or worse — a strong Yen or a weak Yen,” she wrote. She also emphasized the need to build an economic structure resilient to exchange-rate fluctuations by boosting domestic investment.
Despite the clarification, markets have focused on the reduced immediacy of intervention risk. Still, traders remain wary that official warnings could quickly return to headlines, especially if volatility accelerates.
Besides, with a snap lower house election scheduled for February 8, traders are likely to remain cautious. According to a survey by the Asahi newspaper, Takaichi’s party is on track for a landslide victory. A decisive LDP majority could embolden expectations of expansionary fiscal policy, potentially pushing stocks higher and lifting USD/JPY back toward the 160 area. In contrast, a coalition outcome could cap the pair closer to 155.00, depending on the makeup of partners.
Beyond Japan, Asian markets are also digesting the nomination of former Fed Governor Kevin Warsh by Donald Trump as the next Fed chair. Stocks have generally softened on expectations of a less dovish Fed under Warsh. Risk sentiment elsewhere remains fragile, with Gold, Silver, and Bitcoin all trading heavy. Given Warsh’s strong data focus, this week’s ISM surveys and U.S. non-farm payrolls are likely to carry extra weight.
In FX, Euro is leading gains on the day so far, followed by Swiss Franc and Dollar. Aussie is the weakest, trailed by Loonie and Kiwi. Sterling and Yen are trading mid-pack.
In Asia, at the time of writing, Nikkei is down -0.69%. Hong Kong HSI is down -2.40%. China Shanghai SSE is down -1.32%. Singapore Strait Times is down -0.34%. Japan 10-year JGB yield is down -0.001 at 2.250.
Japan PMI manufacturing finalized at 51.5, growth returns, inflation a risk
Japan’s manufacturing sector returned to expansion in January, with PMI Manufacturing finalized at 51.5. This marks the first improvement in operating conditions since mid-2025 and represents the strongest rate of growth since August 2022, offering early evidence of a cyclical recovery taking hold.
The details were encouraging. S&P Global Market Intelligence noted that output and new orders recorded their sharpest increases in almost four years, while export demand rose for the first time since 2022. Employment growth also accelerated to its fastest pace since September 2022, suggesting the sector is "gearing up for further increases in output in the months ahead."
That said, cost pressures are resurfacing as a potential constraint. Input price inflation climbed to a near one-year high, driven in part by the weaker yen, and firms passed some of those costs on to customers. Whether these price pressures intensify will be key in assessing how durable the recovery proves to be.
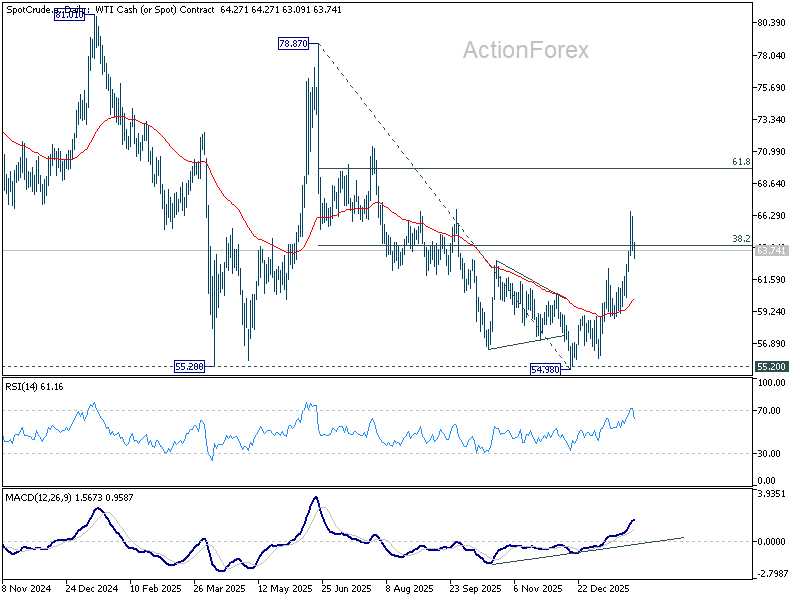
WTI oil rally pauses on OPEC+ hold, bullish trend reversal still intact for 70 later
Oil prices edged lower today after OPEC+ agreed to keep output unchanged for March. Sunday’s brief meeting reaffirmed earlier decisions to freeze planned output increases through the first quarter of 2026.
Those increases—amounting to roughly 2.9 million barrels per day—were scheduled to be phased in from April through December 2025 by eight producers, including Saudi Arabia and Russia, representing about 3% of global demand. With seasonal consumption typically weaker early in the year, the group has opted to stay patient.
What stood out was not what OPEC+ said, but what it avoided saying. The statement offered no clues on production plans beyond March, effectively keeping all options open. With U.S.–Iran tensions rising and crude prices having pushed to six-month highs last week on fears of potential military escalation, that strategic ambiguity is likely intentional.
Against that backdrop, today’s pullback in WTI looks more corrective than trend-changing. Technically, the dip helps confirm a short-term top at 66.55. WTI now appears to be consolidating the five-wave rally from the 54.98 low. While deeper retracement cannot be ruled out in the near term, downside should be limited. Strong support is expected near the 38.2% retracement of 54.98 to 66.55 at 62.13, where buying interest is likely to re-emerge.
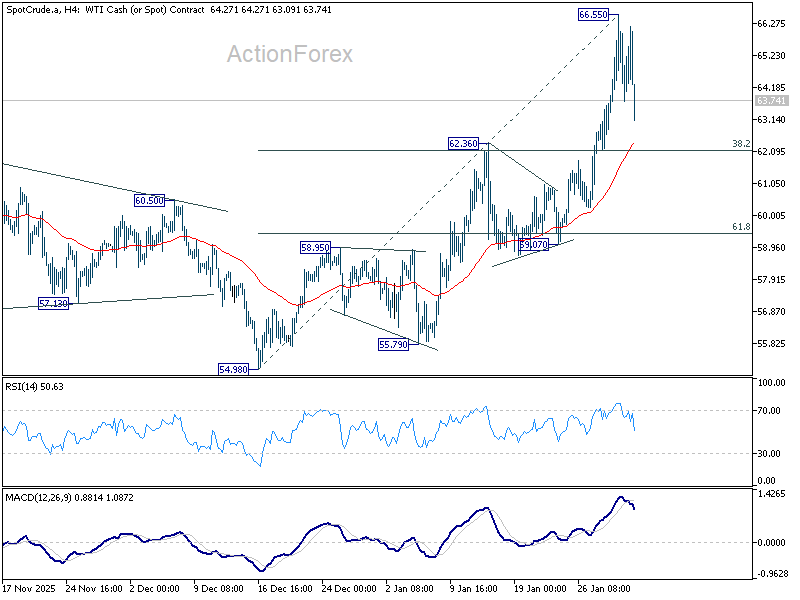
Beyond the short-term noise, the broader technical picture has improved materially. The earlier break above 38.2% retracement of 78.87 to 54.98 at 64.10 argues that the entire sell-off from last year’s highs has likely been completed. In that context, the rise from 54.98 is tentatively viewed as the third leg of the larger pattern that began at 55.20. As long as the 55 D EMA (now at 60.14) holds, the medium-term bias remains to the upside for 61.8% retracement at 69.74 and potentially beyond at a later stage.
Unless geopolitical risks—particularly around Iran—ease decisively, any near-term dips may continue to attract buyers rather than signal a reversal.
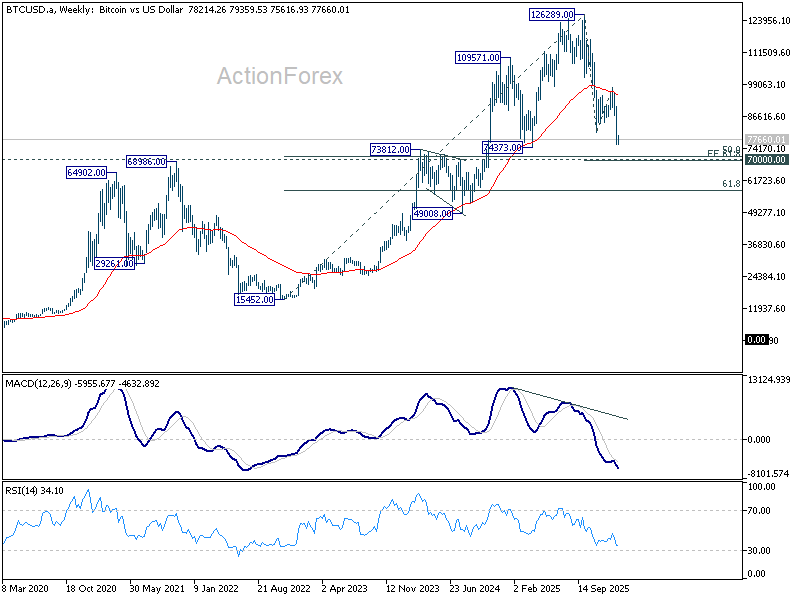
Bitcoin breaks down, 70k becomes critical test for broader market sentiment
Bitcoin remains under heavy pressure after plunging late last week, with prices still struggling to regain 80,000. The selloff closely follows last week’s crash in precious metals, suggesting a shared catalyst of US President Donald Trump’s decision to nominate Kevin Warsh as the next Fed chair.
For now, broader risk assets have so far absorbed the shock. Equity indexes and volatility measures remain relatively calm, indicating that investors are not yet pricing in a wider risk-off regime. That calm, however, may prove misleading. Given Bitcoin’s persistent correlation with tech stocks, sustained weakness in crypto could serve as an early warning signal that underlying sentiment is deteriorating beneath the surface, even as traditional risk gauges remain resilient.
Technically, the damage is already done. The break below 80,492 confirms that Bitcoin's broader downtrend from 126,289 record high has resumed. As long as 84,380 support turned resistance holds, deeper decline should be seen to 61.8% projection of 126,289 to 80,492 from 97,922 at 69,619, which is slightly below 70k psychological level.
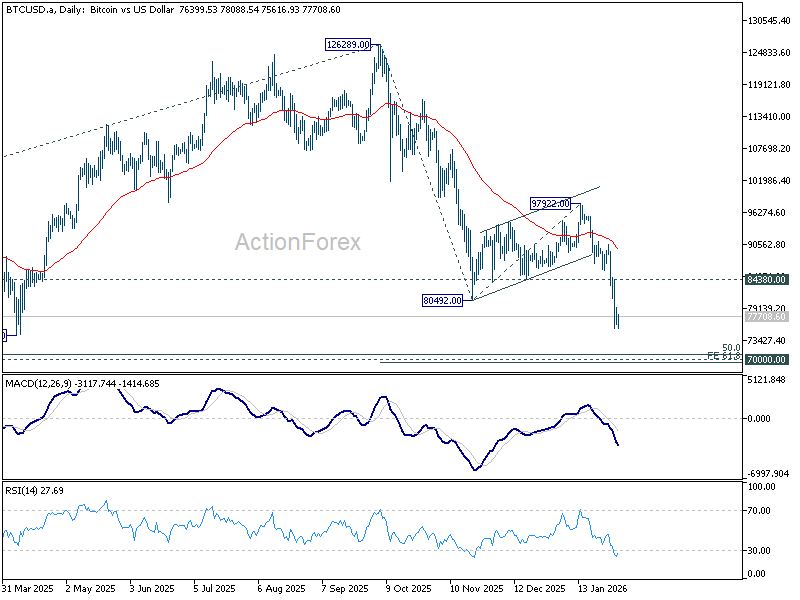
This target sits just beneath the key 70,000 psychological level, making that zone a critical battleground between medium-term bulls and bears. It coincides with 50% retracement of the entire 2022–2025 advance. A strong rebound from that zone would keep the post-peak price action in a medium-term sideway consolidation. However, decisive break would open the door to deeper unwind toward 49,008.
Should that bearish scenario unfolds, close monitoring of NASDAQ will be essential, as confirmation from equities would point to broader liquidation across risk markets rather than a crypto-only reset.
Week ahead: RBA, BoE, ECB and US NFP in focus
A dense macro calendar awaits markets, with three central bank meetings and critical US labor data set to shape near-term policy expectations.
The most immediate event risk comes from the RBA, where a rate hike has become the dominant expectation. The RBA is widely expected to raise the cash rate by 25bps to 3.85%, undoing part of its prior easing. The case for action has strengthened as inflation has crept back above the Bank’s 2–3% target band. Particular attention is on trimmed mean inflation, which rose to 3.3%, a level that will be uncomfortable for policymakers. Combined with unemployment holding at a low 4.1%, the RBA has room to tighten without immediate concern about growth or labor market damage.
That said, a hike this week is unlikely to mark the start of an extended tightening cycle. There is little evidence of consensus within the RBA that rates need to be pushed decisively above 4% at this stage. Instead, a return to a wait-and-see stance is likely after the meeting. The Bank may communicate a willingness to follow up if inflation fails to cool, but without committing to a sequence of further moves.
In the UK, the BoE is expected to hold Bank Rate at 3.75%. While further easing remains the central scenario, the timing is increasingly contentious. A recent Reuters poll showed economists split, with only 55% expecting a cut by end-March, down sharply from December when nearly three-quarters anticipated easing this quarter. Beyond Q1, there is no clear majority view on the rate path.
One cut later this year looks relatively assured, but whether the BoE delivers a second move remains highly uncertain. As ever, the MPC vote split will be scrutinized closely for signals on internal divisions.
The ECB meeting is likely to pass quietly. A hold at 2.00% is fully priced, with policymakers expected to stress comfort with current settings barring material new developments. The ECB is also likely to dismiss market talk of a potential hike as premature.
In the US, focus turns to non-farm payrolls and ISM manufacturing and services, especially in light of Kevin Warsh’s nomination by Donald Trump to chair the Fed. Warsh’s data-driven approach puts added weight on labor market signals. For now, even with lingering tariff risks, the Fed is likely to view price effects as transitory. The key question is whether the “no hiring, no firing” dynamic evolves into a deeper labor market deterioration that would force earlier rate cuts. Absent that, policy is likely to remain on hold, with markets tentatively leaning toward a June cut, but with little conviction.
Canadian and New Zealand jobs data, alongside Eurozone CPI flash, round out a week dense with economic data and events.
Here are some highlights for the week:
- Monday: Swiss retail sales, PMI manufacturing; Eurozone PMI manufacturing final; UK PMI manufacturing final; US ISM manufacturing.
- Tuesday: RBA rate decision.
- Wednesday: New Zealand employment; Eurozone PMI services final, CPI flash, PPI; US ISM services.
- Thursday: Australia trade balance; Germany factory orders; France industrial production; Eurozone retail sales; BoE rate decision; ECB rate decision; US jobless claims.
- Friday: Japan household spending, Germany industrial production, trade balance; Swiss foreign currency reserves, unemployment rate; Canada employment; US non-farm payroll, U of Michigan consumer sentiment.
USD/JPY Daily Outlook
Daily Pivots: (S1) 153.49; (P) 154.15; (R1) 155.42; More...
USD/JPY's break of 154.86 resistance suggests that a short term bottom was formed at 152.07, ahead of 38.2% retracement of 139.87 to 159.44 at 151.96. Corrective pattern from 159.44 should be in the second leg. Intraday bias is back on the upside, and sustained trading above 55 D EMA (now at 155.52) will pave the way back to retest 159.44. However, decisive break of 151.96 will argue that it is reversing whole rise from 139.87. Deeper decline would then be seen to 61.8% retracement at 147.34.
In the bigger picture, outlook is unchanged that corrective pattern from 161.94 (2024 high) should have completed with three waves at 139.87. Larger up trend from 102.58 (2021 low) could be ready to resume through 161.94. This will remain the favored case as long as 55 W EMA (now at 151.59) holds. However, sustained break of 55 W EMA will argue that the pattern from 161.94 is extending with another falling leg.