Sample Category Title
Yen Slips as Takaichi Tones Down Intervention Rhetoric
Yen came under renewed pressure today after comments over the weekend from Japanese Prime Minister Sanae Takaichi suggested a softer stance on currency weakness. The shift in tone has been interpreted as reducing the near-term threat of official intervention, reopening the door for Yen sellers.
In a campaign speech on Saturday, Takaichi highlighted the benefits of a weaker Yen for Japan’s export sector. “People say the weak Yen is bad right now, but for export industries, it’s a major opportunity,” Takaichi said, adding that the currency has helped cushion the impact of U.S. tariffs on sectors ranging from food to automobiles. Her remarks were seen as implicitly tolerant of Yen depreciation.
However, the rhetoric was partly walked back on Sunday. In a post on X, Takaichi said she did not favor any specific Yen direction and stressed that her intention had been misinterpreted. She added that, as prime minister, she would refrain from commenting directly on currency levels. “I did not say which is better or worse — a strong Yen or a weak Yen,” she wrote. She also emphasized the need to build an economic structure resilient to exchange-rate fluctuations by boosting domestic investment.
Despite the clarification, markets have focused on the reduced immediacy of intervention risk. Still, traders remain wary that official warnings could quickly return to headlines, especially if volatility accelerates.
Besides, with a snap lower house election scheduled for February 8, traders are likely to remain cautious. According to a survey by the Asahi newspaper, Takaichi’s party is on track for a landslide victory. A decisive LDP majority could embolden expectations of expansionary fiscal policy, potentially pushing stocks higher and lifting USD/JPY back toward the 160 area. In contrast, a coalition outcome could cap the pair closer to 155.00, depending on the makeup of partners.
Beyond Japan, Asian markets are also digesting the nomination of former Fed Governor Kevin Warsh by Donald Trump as the next Fed chair. Stocks have generally softened on expectations of a less dovish Fed under Warsh. Risk sentiment elsewhere remains fragile, with Gold, Silver, and Bitcoin all trading heavy. Given Warsh’s strong data focus, this week’s ISM surveys and U.S. non-farm payrolls are likely to carry extra weight.
In FX, Euro is leading gains on the day so far, followed by Swiss Franc and Dollar. Aussie is the weakest, trailed by Loonie and Kiwi. Sterling and Yen are trading mid-pack.
In Asia, at the time of writing, Nikkei is down -0.69%. Hong Kong HSI is down -2.40%. China Shanghai SSE is down -1.32%. Singapore Strait Times is down -0.34%. Japan 10-year JGB yield is down -0.001 at 2.250.
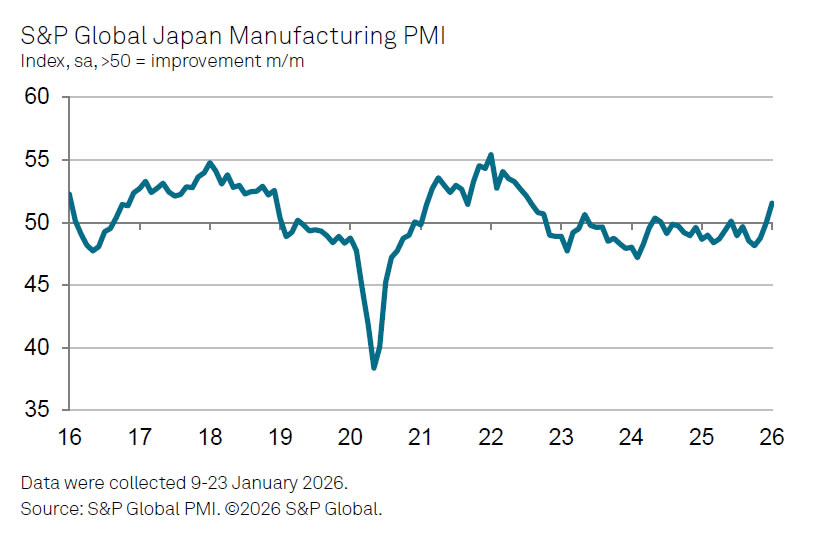
Japan PMI manufacturing finalized at 51.5, growth returns, inflation a risk
Japan’s manufacturing sector returned to expansion in January, with PMI Manufacturing finalized at 51.5. This marks the first improvement in operating conditions since mid-2025 and represents the strongest rate of growth since August 2022, offering early evidence of a cyclical recovery taking hold.
The details were encouraging. S&P Global Market Intelligence noted that output and new orders recorded their sharpest increases in almost four years, while export demand rose for the first time since 2022. Employment growth also accelerated to its fastest pace since September 2022, suggesting the sector is "gearing up for further increases in output in the months ahead."
That said, cost pressures are resurfacing as a potential constraint. Input price inflation climbed to a near one-year high, driven in part by the weaker yen, and firms passed some of those costs on to customers. Whether these price pressures intensify will be key in assessing how durable the recovery proves to be.
WTI oil rally pauses on OPEC+ hold, bullish trend reversal still intact for 70 later
Oil prices edged lower today after OPEC+ agreed to keep output unchanged for March. Sunday’s brief meeting reaffirmed earlier decisions to freeze planned output increases through the first quarter of 2026.
Those increases—amounting to roughly 2.9 million barrels per day—were scheduled to be phased in from April through December 2025 by eight producers, including Saudi Arabia and Russia, representing about 3% of global demand. With seasonal consumption typically weaker early in the year, the group has opted to stay patient.
What stood out was not what OPEC+ said, but what it avoided saying. The statement offered no clues on production plans beyond March, effectively keeping all options open. With U.S.–Iran tensions rising and crude prices having pushed to six-month highs last week on fears of potential military escalation, that strategic ambiguity is likely intentional.
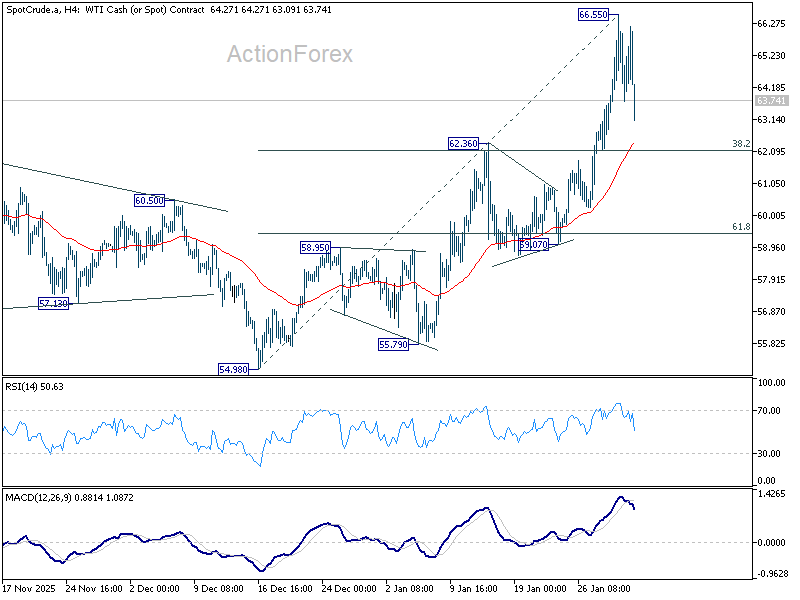
Against that backdrop, today’s pullback in WTI looks more corrective than trend-changing. Technically, the dip helps confirm a short-term top at 66.55. WTI now appears to be consolidating the five-wave rally from the 54.98 low. While deeper retracement cannot be ruled out in the near term, downside should be limited. Strong support is expected near the 38.2% retracement of 54.98 to 66.55 at 62.13, where buying interest is likely to re-emerge.
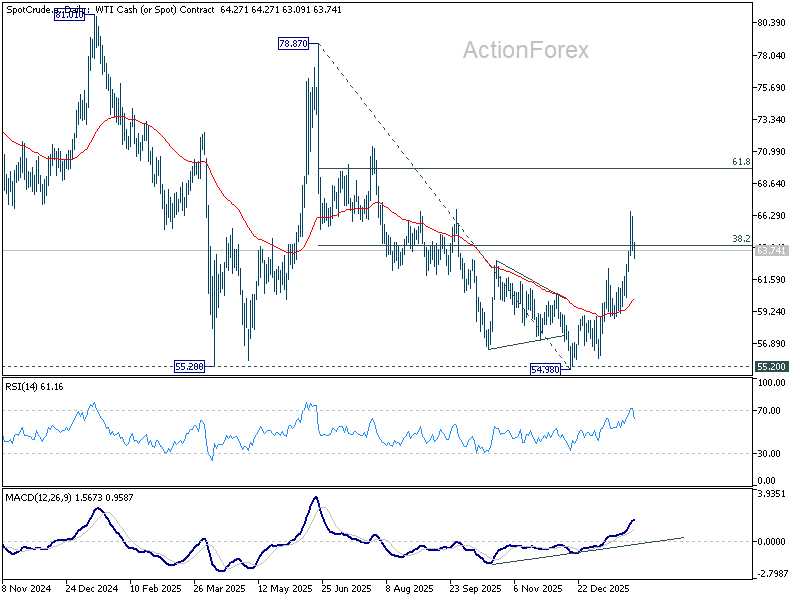
Beyond the short-term noise, the broader technical picture has improved materially. The earlier break above 38.2% retracement of 78.87 to 54.98 at 64.10 argues that the entire sell-off from last year’s highs has likely been completed. In that context, the rise from 54.98 is tentatively viewed as the third leg of the larger pattern that began at 55.20. As long as the 55 D EMA (now at 60.14) holds, the medium-term bias remains to the upside for 61.8% retracement at 69.74 and potentially beyond at a later stage.
Unless geopolitical risks—particularly around Iran—ease decisively, any near-term dips may continue to attract buyers rather than signal a reversal.
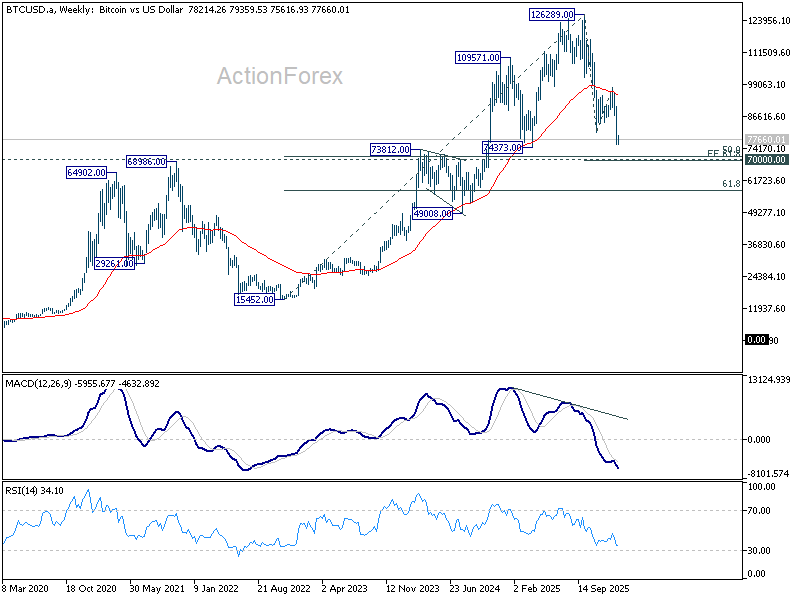
Bitcoin breaks down, 70k becomes critical test for broader market sentiment
Bitcoin remains under heavy pressure after plunging late last week, with prices still struggling to regain 80,000. The selloff closely follows last week’s crash in precious metals, suggesting a shared catalyst of US President Donald Trump’s decision to nominate Kevin Warsh as the next Fed chair.
For now, broader risk assets have so far absorbed the shock. Equity indexes and volatility measures remain relatively calm, indicating that investors are not yet pricing in a wider risk-off regime. That calm, however, may prove misleading. Given Bitcoin’s persistent correlation with tech stocks, sustained weakness in crypto could serve as an early warning signal that underlying sentiment is deteriorating beneath the surface, even as traditional risk gauges remain resilient.
Technically, the damage is already done. The break below 80,492 confirms that Bitcoin's broader downtrend from 126,289 record high has resumed. As long as 84,380 support turned resistance holds, deeper decline should be seen to 61.8% projection of 126,289 to 80,492 from 97,922 at 69,619, which is slightly below 70k psychological level.
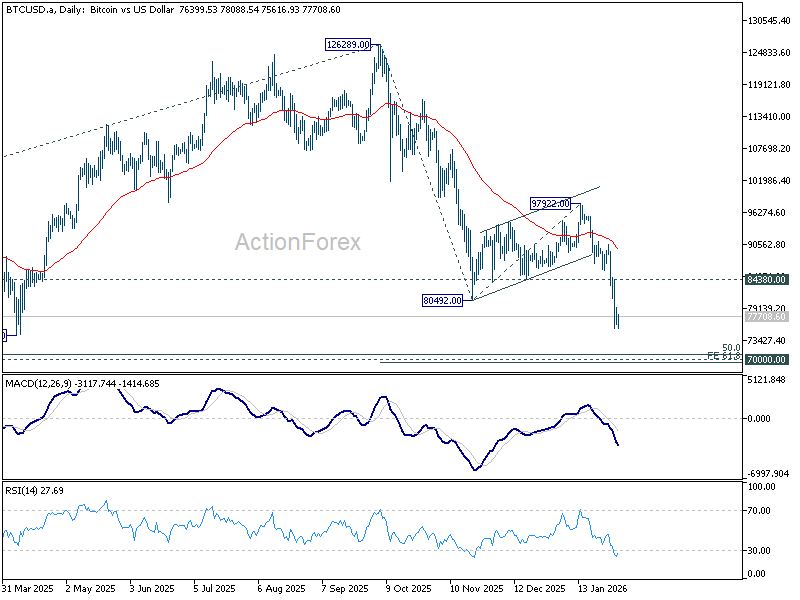
This target sits just beneath the key 70,000 psychological level, making that zone a critical battleground between medium-term bulls and bears. It coincides with 50% retracement of the entire 2022–2025 advance. A strong rebound from that zone would keep the post-peak price action in a medium-term sideway consolidation. However, decisive break would open the door to deeper unwind toward 49,008.
Should that bearish scenario unfolds, close monitoring of NASDAQ will be essential, as confirmation from equities would point to broader liquidation across risk markets rather than a crypto-only reset.
Week ahead: RBA, BoE, ECB and US NFP in focus
A dense macro calendar awaits markets, with three central bank meetings and critical US labor data set to shape near-term policy expectations.
The most immediate event risk comes from the RBA, where a rate hike has become the dominant expectation. The RBA is widely expected to raise the cash rate by 25bps to 3.85%, undoing part of its prior easing. The case for action has strengthened as inflation has crept back above the Bank’s 2–3% target band. Particular attention is on trimmed mean inflation, which rose to 3.3%, a level that will be uncomfortable for policymakers. Combined with unemployment holding at a low 4.1%, the RBA has room to tighten without immediate concern about growth or labor market damage.
That said, a hike this week is unlikely to mark the start of an extended tightening cycle. There is little evidence of consensus within the RBA that rates need to be pushed decisively above 4% at this stage. Instead, a return to a wait-and-see stance is likely after the meeting. The Bank may communicate a willingness to follow up if inflation fails to cool, but without committing to a sequence of further moves.
In the UK, the BoE is expected to hold Bank Rate at 3.75%. While further easing remains the central scenario, the timing is increasingly contentious. A recent Reuters poll showed economists split, with only 55% expecting a cut by end-March, down sharply from December when nearly three-quarters anticipated easing this quarter. Beyond Q1, there is no clear majority view on the rate path.
One cut later this year looks relatively assured, but whether the BoE delivers a second move remains highly uncertain. As ever, the MPC vote split will be scrutinized closely for signals on internal divisions.
The ECB meeting is likely to pass quietly. A hold at 2.00% is fully priced, with policymakers expected to stress comfort with current settings barring material new developments. The ECB is also likely to dismiss market talk of a potential hike as premature.
In the US, focus turns to non-farm payrolls and ISM manufacturing and services, especially in light of Kevin Warsh’s nomination by Donald Trump to chair the Fed. Warsh’s data-driven approach puts added weight on labor market signals. For now, even with lingering tariff risks, the Fed is likely to view price effects as transitory. The key question is whether the “no hiring, no firing” dynamic evolves into a deeper labor market deterioration that would force earlier rate cuts. Absent that, policy is likely to remain on hold, with markets tentatively leaning toward a June cut, but with little conviction.
Canadian and New Zealand jobs data, alongside Eurozone CPI flash, round out a week dense with economic data and events.
Here are some highlights for the week:
- Monday: Swiss retail sales, PMI manufacturing; Eurozone PMI manufacturing final; UK PMI manufacturing final; US ISM manufacturing.
- Tuesday: RBA rate decision.
- Wednesday: New Zealand employment; Eurozone PMI services final, CPI flash, PPI; US ISM services.
- Thursday: Australia trade balance; Germany factory orders; France industrial production; Eurozone retail sales; BoE rate decision; ECB rate decision; US jobless claims.
- Friday: Japan household spending, Germany industrial production, trade balance; Swiss foreign currency reserves, unemployment rate; Canada employment; US non-farm payroll, U of Michigan consumer sentiment.
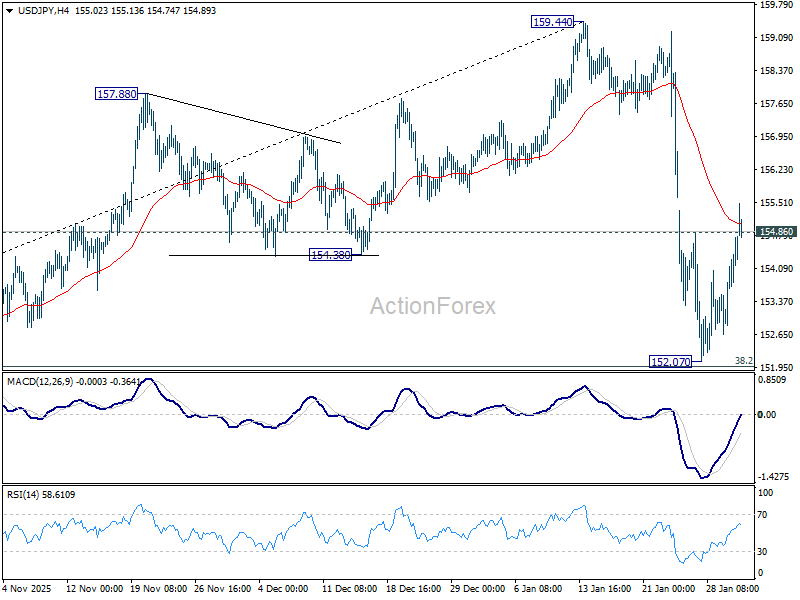
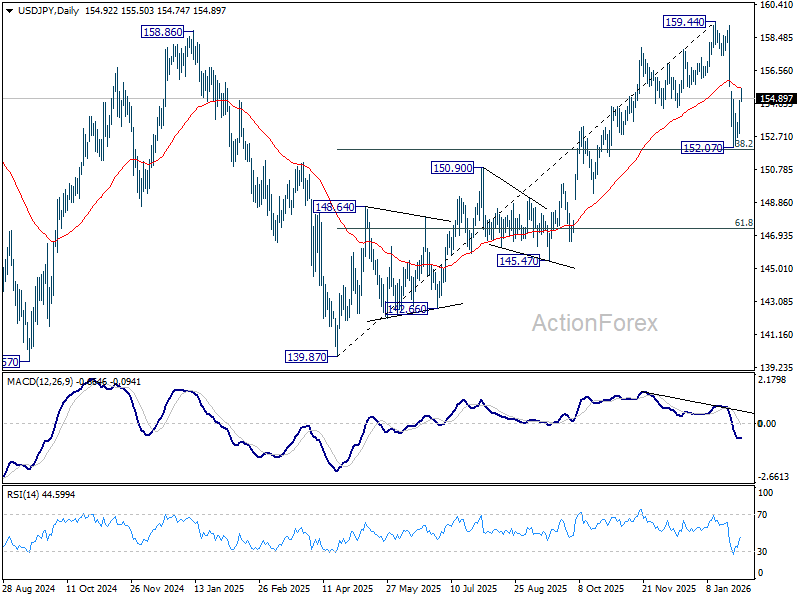
USD/JPY Daily Outlook
Daily Pivots: (S1) 153.49; (P) 154.15; (R1) 155.42; More...
USD/JPY's break of 154.86 resistance suggests that a short term bottom was formed at 152.07, ahead of 38.2% retracement of 139.87 to 159.44 at 151.96. Corrective pattern from 159.44 should be in the second leg. Intraday bias is back on the upside, and sustained trading above 55 D EMA (now at 155.52) will pave the way back to retest 159.44. However, decisive break of 151.96 will argue that it is reversing whole rise from 139.87. Deeper decline would then be seen to 61.8% retracement at 147.34.
In the bigger picture, outlook is unchanged that corrective pattern from 161.94 (2024 high) should have completed with three waves at 139.87. Larger up trend from 102.58 (2021 low) could be ready to resume through 161.94. This will remain the favored case as long as 55 W EMA (now at 151.59) holds. However, sustained break of 55 W EMA will argue that the pattern from 161.94 is extending with another falling leg.
EUR/USD Flashes Breakdown Signals — Is Another Drop Coming?
Key Highlights
- EUR/USD started a fresh decline from 1.2080.
- It traded below a key bullish trend line with support at 1.1880 on the 4-hour chart.
- GBP/USD trimmed some gains and traded below 1.3800.
- Bitcoin declined by over 10%, and Ethereum dived 20%.
EUR/USD Technical Analysis
The Euro rallied above 1.1800 and 1.2000 against the US Dollar. EUR/USD traded as high as 1.2082 before there was a pullback.
Looking at the 4-hour chart, the pair traded below a key bullish trend line with support at 1.1880 to start the recent decline. The pair dipped below the 38.2% Fib retracement level of the upward move from the 1.1577 swing low to the 1.2083 high.
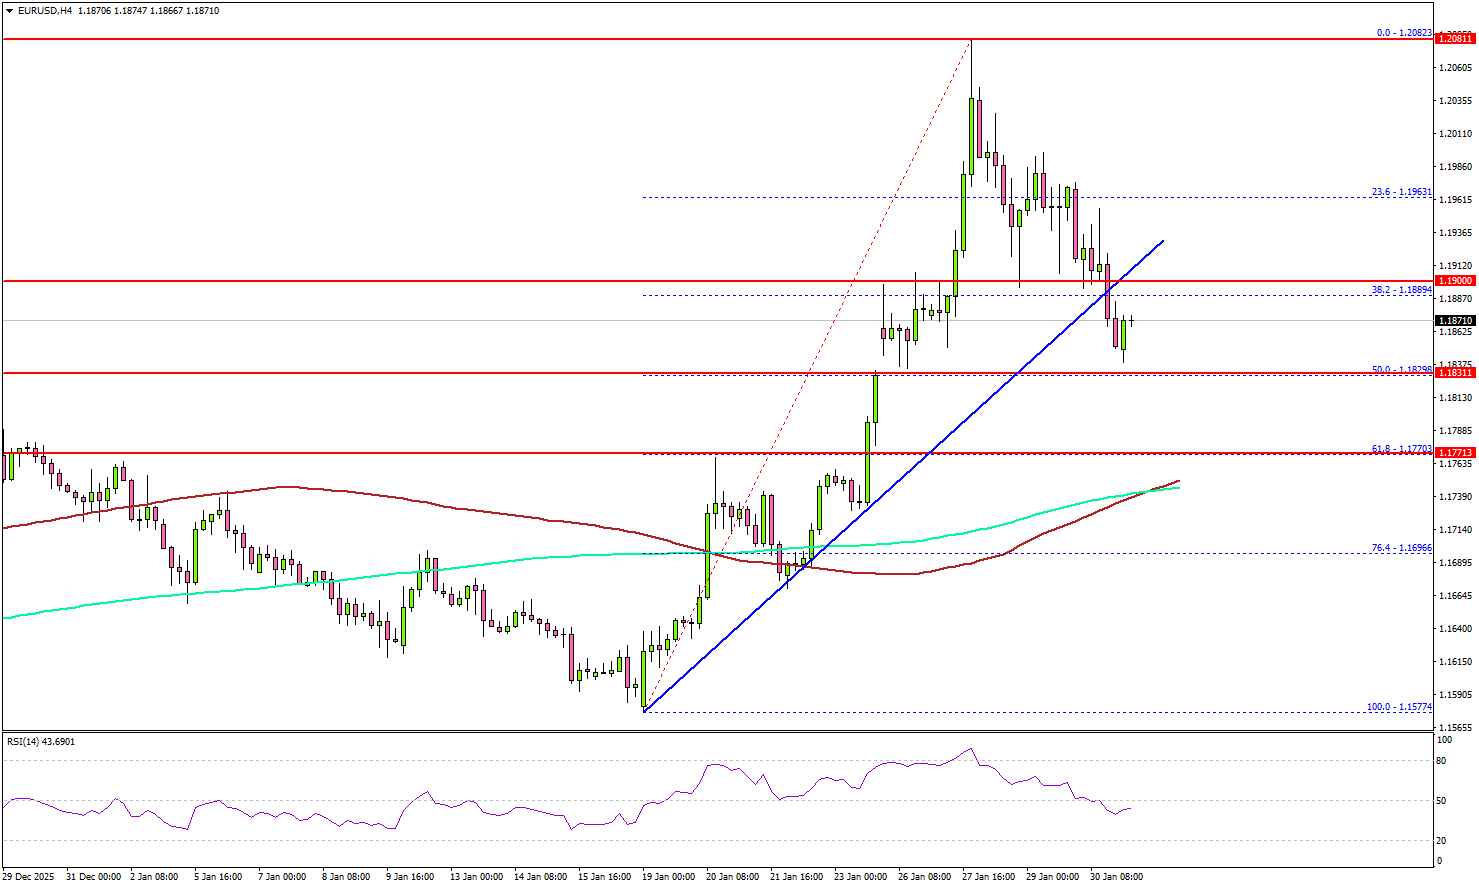
Immediate support could be 1.1820 or the 50% Fib retracement level of the upward move from the 1.1577 swing low to the 1.2083 high. The first major area for the bulls might be near 1.1800.
The main support sits at 1.1770, below which the pair might test the 200 simple moving average (green, 4-hour) and the 100 simple moving average (red, 4-hour).
If there is a fresh increase, the pair could face resistance near 1.1910. The first key hurdle could be 1.1940. The next stop for the bulls might be 1.1960, where they could face hurdles. A close above 1.1960 could open the doors for more gains. In the stated case, the bulls could aim for a move toward 1.2080.
Looking at GBP/USD, the pair peaked near 1.3880 and recently started a downside correction below 1.3800.
Upcoming Key Economic Events:
- Euro Zone Manufacturing PMI for Jan 2026 – Forecast 49.4, versus 49.4 previous.
- UK Manufacturing PMI for Jan 2026 – Forecast 51.6, versus 51.6 previous.
- US S&P Global Manufacturing PMI for Jan 2026 – Forecast 51.9, versus 51.9 previous.
- US ISM Manufacturing PMI for Jan 2026 – Forecast 48.3, versus 47.9 previous.
Gold Surges Above $5,000 Then Crashes in Historic Volatility
It was a very volatile week. USD/JPY came under pressure early, testing lower levels as markets remained cautious about possible yen-buying intervention. Stronger-than-expected U.S. Durable Goods Orders failed to support the U.S. dollar. At the same time, gold and silver surged early in the week, with gold breaking above $5,000 as investors sought safe-haven assets.
Sentiment shifted on Friday after President Trump nominated Kevin Warsh as the next Federal Reserve Chair. Markets view Warsh as cautious about cutting interest rates too quickly. Combined with strong U.S. PPI data, this triggered a recovery in the U.S. dollar and heavy profit-taking in gold. Gold fell around 10% on Friday, though it finished the week only slightly lower overall.
U.S. and Japanese equities remained range-bound for most of the week and closed marginally lower. In Europe, GDP data came in above expectations, offering some support despite continued market uncertainty.
Markets This Week
U.S. Stocks
It was a relatively quiet week for U.S. stocks. Better-than-expected U.S. economic data helped push prices higher, but rallies were met with strong selling as investors remained cautious about the outlook amid elevated geopolitical risks. In the current environment, the preferred short-term strategy continues to be selling into strength rather than chasing breakouts. Resistance is seen at 49,500 and 50,000, while support is located at 48,500, 48,000, 47,500, and 47,000.
Japanese Stocks
The Nikkei started the week under pressure as the yen strengthened but later recovered to close slightly higher. Market sentiment improved as investors expect Prime Minister Takaichi to secure a majority in the February 8 election and pursue policies aimed at supporting economic growth. Technical indicators point to sideways conditions, and with some caution likely ahead of the election, the market may offer multiple range-trading opportunities in the coming week. Resistance is seen at 54,000円, 54,500円, and 55,000円, while support is located at 52,500円, 52,000円, 51,500円, and 51,000円.
USD/JPY
USD/JPY fell sharply early in the week as traders cut long positions on rising fears of yen-buying intervention. Midweek, U.S. officials denied plans to support the yen, allowing the pair to recover, and it finished the week stronger after better-than-expected U.S. data and comments from President Trump suggesting the next Fed Chair may be cautious about cutting rates too quickly. Despite the rebound, the overall trend remains lower, and as long as USD/JPY stays below 155.50, selling rallies remains the preferred approach. Resistance is seen at 155.5, 156.6, 157.5, 158, 159, 159.5, and 160, while support is located at 153, 152, 151, and 150.
Gold
Gold surged to fresh record highs above $5,000 earlier in the week as speculative buying accelerated, but this was followed by a sharp reversal on Friday as profit-taking emerged and the U.S. dollar recovered after President Trump named a new Federal Reserve Chair. Volatility has risen sharply, and prices have slipped back below the 10-day moving average, suggesting the short-term uptrend has weakened. While the longer-term trend for gold remains positive, near-term price action is likely to stay choppy, though the size of Friday’s drop may attract dip buyers. Resistance is seen at $5,000, $5,200, $5,500, and $5,600, while support is located at $4,700, $4,600, and $4,500.
Crude Oil
WTI crude had a strong week as ongoing unrest in Iran and better-than-expected U.S. growth data supported speculative buying. The technical picture has improved, with the 10-day moving average turning higher and pointing to further upside. In the short term, selling interest may emerge ahead of the $66.50 level, particularly if President Trump moves to ease tensions with Iran. Resistance is seen at $66.50, $70, and $75, while support is located at $59, $55, and $50.
Bitcoin
Bitcoin’s weak start to 2025 continued last week, with a break below $85,000 triggering further selling. Sentiment was also hurt by President Trump’s appointment of a new Federal Reserve Chair, which markets see as less supportive of rapid interest rate cuts. Prices have now fallen close to support around $75,000, which could lead to a short-term bounce, but the medium-term trend remains bearish. As a result, selling into strength—especially near the 10-day moving average—still looks like the preferred strategy. Resistance is seen at $85,000, $95,000, and $100,000, while support is located at $75,000, $72,500, and $65,000.
This Week’s Focus
- Monday: U.K. Nationwide HPI, E.U. HCOB Eurozone Manufacturing PMI, U.K. S&P Global Manufacturing PMI, U.S. S&P Global Manufacturing PMI and ISM Manufacturing PMI
- Tuesday: Australia RBA Interest Rate Decision
- Wednesday: Japan au Jibun Bank Services PMI, E.U. HCOB Eurozone Services PMI and CPI, U.K. S&P Global Services PMI, U.S. S&P Global Services PMI
- Thursday: Australia Trade Balance, U.K. BoE Interest Rate Decision, E.U. ECB Interest Rate Decision
- Friday: Japan Household Spending, U.S. Nonfarm Payrolls and Michigan Consumer Sentiment
Another volatile week is expected, with gold in focus and traders positioning around the yen and the Nikkei ahead of Japan’s February 8 election. The Bank of England and the ECB are both expected to keep interest rates unchanged, shifting attention to the tone of their post-meeting statements. U.S. employment data on Friday could trigger sharp market moves, while the Australian central bank may add to volatility if it signals a potential interest rate increase.
Japan PMI manufacturing finalized at 51.5, growth returns, inflation a risk
Japan’s manufacturing sector returned to expansion in January, with PMI Manufacturing finalized at 51.5. This marks the first improvement in operating conditions since mid-2025 and represents the strongest rate of growth since August 2022, offering early evidence of a cyclical recovery taking hold.
The details were encouraging. S&P Global Market Intelligence noted that output and new orders recorded their sharpest increases in almost four years, while export demand rose for the first time since 2022. Employment growth also accelerated to its fastest pace since September 2022, suggesting the sector is "gearing up for further increases in output in the months ahead."
That said, cost pressures are resurfacing as a potential constraint. Input price inflation climbed to a near one-year high, driven in part by the weaker yen, and firms passed some of those costs on to customers. Whether these price pressures intensify will be key in assessing how durable the recovery proves to be.
Bitcoin breaks down, 70k becomes critical test for broader market sentiment
Bitcoin remains under heavy pressure after plunging late last week, with prices still struggling to regain 80,000. The selloff closely follows last week’s crash in precious metals, suggesting a shared catalyst of US President Donald Trump’s decision to nominate Kevin Warsh as the next Fed chair.
For now, broader risk assets have so far absorbed the shock. Equity indexes and volatility measures remain relatively calm, indicating that investors are not yet pricing in a wider risk-off regime. That calm, however, may prove misleading. Given Bitcoin’s persistent correlation with tech stocks, sustained weakness in crypto could serve as an early warning signal that underlying sentiment is deteriorating beneath the surface, even as traditional risk gauges remain resilient.
Technically, the damage is already done. The break below 80,492 confirms that Bitcoin's broader downtrend from 126,289 record high has resumed. As long as 84,380 support turned resistance holds, deeper decline should be seen to 61.8% projection of 126,289 to 80,492 from 97,922 at 69,619, which is slightly below 70k psychological level.
This target sits just beneath the key 70,000 psychological level, making that zone a critical battleground between medium-term bulls and bears. It coincides with 50% retracement of the entire 2022–2025 advance. A strong rebound from that zone would keep the post-peak price action in a medium-term sideway consolidation. However, decisive break would open the door to deeper unwind toward 49,008.
Should that bearish scenario unfolds, close monitoring of NASDAQ will be essential, as confirmation from equities would point to broader liquidation across risk markets rather than a crypto-only reset.
WTI oil rally pauses on OPEC+ hold, bullish trend reversal still intact for 70 later
Oil prices edged lower today after OPEC+ agreed to keep output unchanged for March. Sunday’s brief meeting reaffirmed earlier decisions to freeze planned output increases through the first quarter of 2026.
Those increases—amounting to roughly 2.9 million barrels per day—were scheduled to be phased in from April through December 2025 by eight producers, including Saudi Arabia and Russia, representing about 3% of global demand. With seasonal consumption typically weaker early in the year, the group has opted to stay patient.
What stood out was not what OPEC+ said, but what it avoided saying. The statement offered no clues on production plans beyond March, effectively keeping all options open. With U.S.–Iran tensions rising and crude prices having pushed to six-month highs last week on fears of potential military escalation, that strategic ambiguity is likely intentional.
Against that backdrop, today’s pullback in WTI looks more corrective than trend-changing. Technically, the dip helps confirm a short-term top at 66.55. WTI now appears to be consolidating the five-wave rally from the 54.98 low. While deeper retracement cannot be ruled out in the near term, downside should be limited. Strong support is expected near the 38.2% retracement of 54.98 to 66.55 at 62.13, where buying interest is likely to re-emerge.
Beyond the short-term noise, the broader technical picture has improved materially. The earlier break above 38.2% retracement of 78.87 to 54.98 at 64.10 argues that the entire sell-off from last year’s highs has likely been completed. In that context, the rise from 54.98 is tentatively viewed as the third leg of the larger pattern that began at 55.20. As long as the 55 D EMA (now at 60.14) holds, the medium-term bias remains to the upside for 61.8% retracement at 69.74 and potentially beyond at a later stage.
Unless geopolitical risks—particularly around Iran—ease decisively, any near-term dips may continue to attract buyers rather than signal a reversal.
Eco Data 2/2/26
| GMT | Ccy | Events | Act | Cons | Prev | Rev |
|---|---|---|---|---|---|---|
| 00:00 | AUD | TD-MI Inflation Gauge M/M Jan | 0.20% | 1% | ||
| 00:30 | JPY | Manufacturing PMI Jan F | 51.5 | 51.5 | 51.5 | |
| 01:45 | CNY | RatingDog Manufacturing PMI Jan | 50.3 | 50.3 | 50.1 | |
| 07:00 | EUR | Germany Retail Sales M/M Dec | 0.10% | -0.20% | -0.60% | |
| 07:30 | CHF | Real Retail Sales Y/Y Dec | 2.90% | 2.50% | 2.30% | |
| 08:30 | CHF | Manufacturing PMI Jan | 48.8 | 47.9 | 45.8 | |
| 08:50 | EUR | France Manufacturing PMI Jan F | 51.2 | 51 | 51 | |
| 08:55 | EUR | Germany Manufacturing PMI Jan F | 49.1 | 48.7 | 48.7 | |
| 09:00 | EUR | Eurozone Manufacturing PMI Jan F | 49.5 | 49.4 | 49.4 | |
| 09:30 | GBP | Manufacturing PMI Jan F | 51.8 | 51.6 | 51.6 | |
| 14:30 | CAD | Manufacturing PMI Jan | 50.4 | 48.6 | ||
| 14:45 | USD | Manufacturing PMI Jan F | 52.4 | 51.9 | 51.9 | |
| 15:00 | USD | ISM Manufacturing PMI Jan | 52.6 | 48.3 | 47.9 | |
| 15:00 | USD | ISM Manufacturing Prices Paid Jan | 59.0 | 59.3 | 58.5 | |
| 15:00 | USD | ISM Manufacturing Employment Index Jan | 48.1 | 44.9 |
| 00:00 | AUD |
| TD-MI Inflation Gauge M/M Jan | |
| Actual | 0.20% |
| Consensus | |
| Previous | 1% |
| 00:30 | JPY |
| Manufacturing PMI Jan F | |
| Actual | 51.5 |
| Consensus | 51.5 |
| Previous | 51.5 |
| 01:45 | CNY |
| RatingDog Manufacturing PMI Jan | |
| Actual | 50.3 |
| Consensus | 50.3 |
| Previous | 50.1 |
| 07:00 | EUR |
| Germany Retail Sales M/M Dec | |
| Actual | 0.10% |
| Consensus | -0.20% |
| Previous | -0.60% |
| 07:30 | CHF |
| Real Retail Sales Y/Y Dec | |
| Actual | 2.90% |
| Consensus | 2.50% |
| Previous | 2.30% |
| 08:30 | CHF |
| Manufacturing PMI Jan | |
| Actual | 48.8 |
| Consensus | 47.9 |
| Previous | 45.8 |
| 08:50 | EUR |
| France Manufacturing PMI Jan F | |
| Actual | 51.2 |
| Consensus | 51 |
| Previous | 51 |
| 08:55 | EUR |
| Germany Manufacturing PMI Jan F | |
| Actual | 49.1 |
| Consensus | 48.7 |
| Previous | 48.7 |
| 09:00 | EUR |
| Eurozone Manufacturing PMI Jan F | |
| Actual | 49.5 |
| Consensus | 49.4 |
| Previous | 49.4 |
| 09:30 | GBP |
| Manufacturing PMI Jan F | |
| Actual | 51.8 |
| Consensus | 51.6 |
| Previous | 51.6 |
| 14:30 | CAD |
| Manufacturing PMI Jan | |
| Actual | 50.4 |
| Consensus | |
| Previous | 48.6 |
| 14:45 | USD |
| Manufacturing PMI Jan F | |
| Actual | 52.4 |
| Consensus | 51.9 |
| Previous | 51.9 |
| 15:00 | USD |
| ISM Manufacturing PMI Jan | |
| Actual | 52.6 |
| Consensus | 48.3 |
| Previous | 47.9 |
| 15:00 | USD |
| ISM Manufacturing Prices Paid Jan | |
| Actual | 59.0 |
| Consensus | 59.3 |
| Previous | 58.5 |
| 15:00 | USD |
| ISM Manufacturing Employment Index Jan | |
| Actual | 48.1 |
| Consensus | |
| Previous | 44.9 |
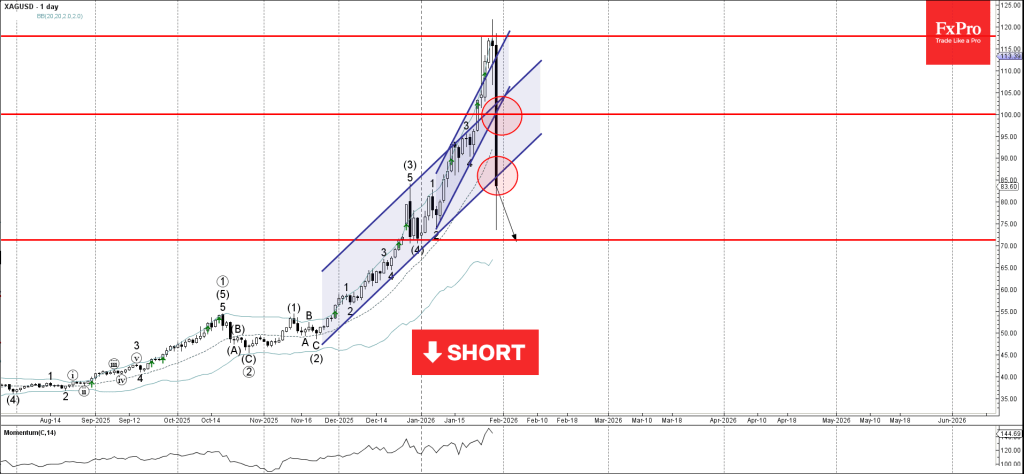
Silver Wave Analysis
Silver: ⬇️ Sell
- Silver broke the round support level 100.00
- Likely to fall to support level 70.00
Silver under strong bearish pressure after the price broke the round support level 100.00, intersecting with two up channels from January and November.
The price just broke the lower trendline of the daily up channel from November – indicating further losses for Silver ahead.
Silver can be expected to fall to the next round support level 70.00, which stopped the previous intermediate correction (4) in December.
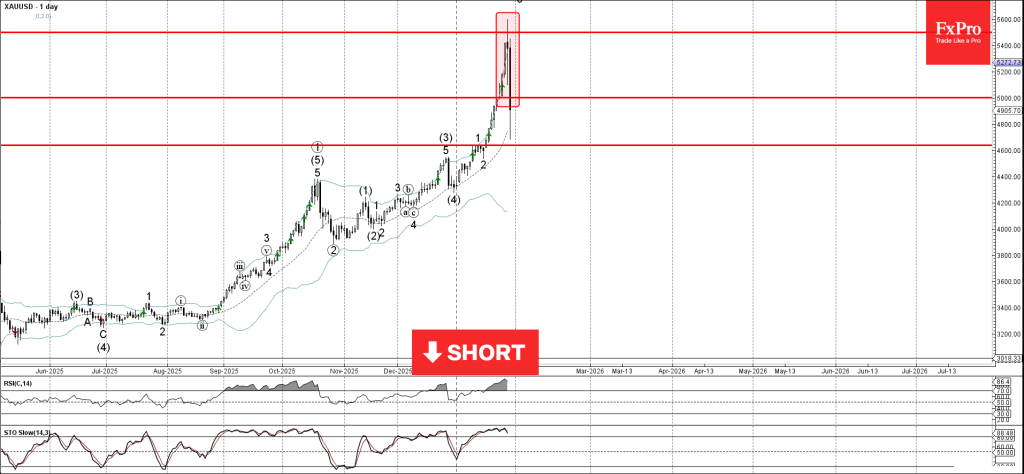
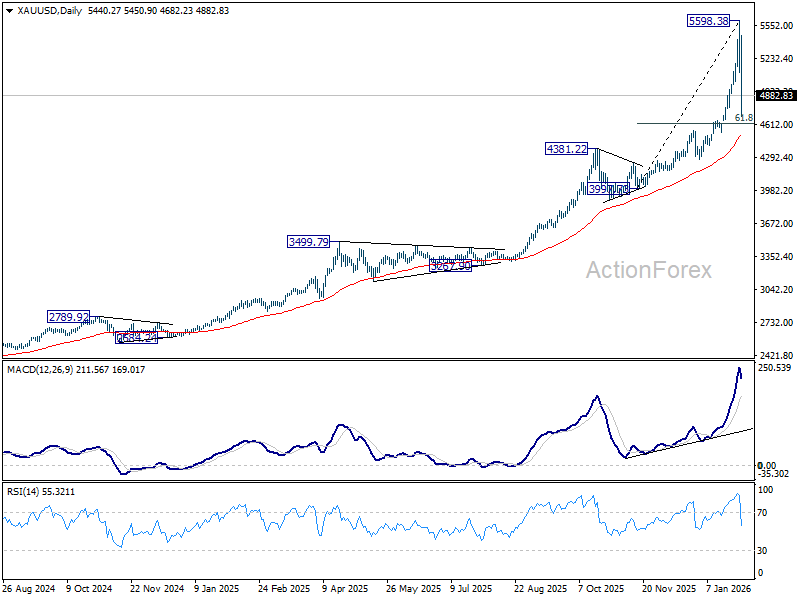
Gold Wave Analysis
Gold: ⬇️ Sell
- Gold formed daily Evening Star
- Likely to fall to support level 4600.00
Gold today fell down sharply after the price failed to close above the major resistance level 5500.00, as can be seen from the daily Gold chart below.
The downward reversal from the resistance level 5500.00 formed the daily Japanese candlesticks reversal pattern long-legged Doji – which is now the middle candle of the daily Evening Star.
Given the overbought Stochastic and RSI, Gold can be expected to fall to the next support level 4600.00 (former top if wave 1 from the start of January).
A Credible Fed Choice Tames Tail Risks, Not the Cycle
Last week delivered yet another reminder that volatility has become a feature this year, rather than an exception. Sudden repricing episodes continue to emerge, often driven by political and institutional developments rather than changes in economic fundamentals.
The latest bout of turbulence was triggered by market repricing around the nomination of former Fed Governor Kevin Warsh as the next Federal Reserve chair. The move forced a rapid reassessment of risks that had built up over monthly weeks, unleashing violent adjustments in select corners of the market.
The intensity of the reaction, however, was far from uniform. While precious metals experienced dramatic swings, other asset classes showed far more restraint. Equities and Treasuries largely stayed within familiar ranges, hinting that the shock was narrowly concentrated rather than systemic.
That divergence mattered. It suggested that markets were not questioning the broader economic outlook or the Fed’s near-term policy path, but instead recalibrating around perceived shifts in institutional risk and long-term credibility.
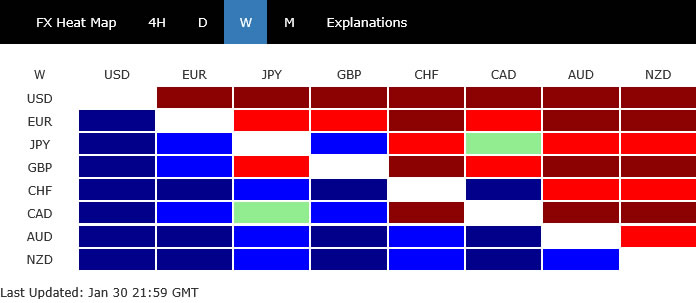
In currency markets, Dollar staged a late-week rebound but still finished as the worst performer overall, followed by Euro and Sterling. At the other end, Kiwi led gains, with Aussie and Swiss Franc close behind. Yen and Loonie ended the week mixed, reflecting cross-currents rather than a clear directional bias.
Gold and Silver Exodus: When the Party Ends
The most dramatic action unfolded in precious metals. Gold and Silver surged to fresh record highs, only to suffer violent reversals that erased weeks of gains in a matter of house. Gold briefly peaked near 5,598 before collapsing to close the week around 4882, a drawdown of more than 13% from the high. Silver’s reversal was even more brutal, plunging from a record 121.81 to 85.07, a decline of roughly 30%. These are classic signs of terminal momentum, not healthy consolidation.
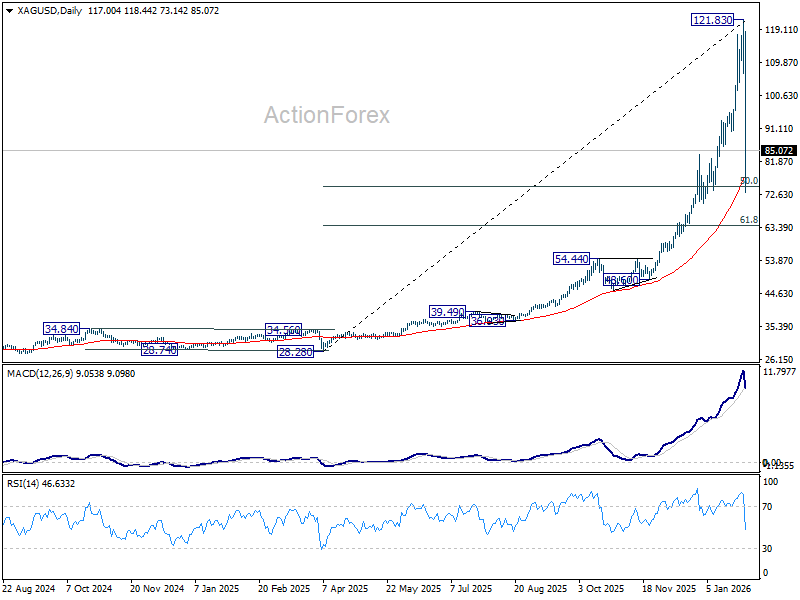
Such price behavior strongly suggests that major tops have been formed. While this does not invalidate the longer-term bullish trend, it does mark the end of the one-way, momentum-driven phase that had defined the previous rallies.
Technically, both metals have now transitioned into a corrective phase. This distinction is critical. Corrections following blow-off tops are rarely clean or directional. Instead, they tend to be prolonged, erratic, and psychologically punishing.
The problem is not just direction—it is structure. At this stage, price action can morph into any number of patterns: flats, zigzags, triangles, or complex combinations. Early in a correction, it is impossible to know which will dominate, making risk-reward unattractive for all but the most tactical traders.
During such phases, short-term speculators take control. Whipsaws become frequent, false breakouts multiply, and both longs and shorts are routinely punished. Trend-following strategies fail, while mean-reversion trades become increasingly unstable.
Fundamentally, corrections also represent a breakdown in narrative clarity. The dominant bullish story—Fed politicization, institutional erosion, currency debasement—has been partially challenged. New information has arrived, but it remains unclear whether it represents a regime shift or temporary noise.
This ambiguity is toxic for positioning. When conviction dissolves, markets no longer reward holding risk. Instead, they reward speed, flexibility, and capital preservation—qualities that most investors do not associate with Gold and Silver exposure.
For professional traders, opportunity may still exist on very short timeframes. But for investors and medium-term participants, the odds are stacked against clean outcomes. Capital can be deployed more efficiently elsewhere while metals reset.
In short, Gold and Silver are not broken, but they are no longer tradable with confidence, not at least in the near term. Until volatility compresses, structures mature, and sentiment stabilizes, the prudent course is to step aside and wait for clarity to return.
Why Warsh Mattered: Experience, Symbolism, and Institutional Lines
The nomination of Kevin Warsh as the next Fed chair was never just about a personnel change. It carried outsized significance because it arrived after weeks of market anxiety over the future independence and credibility of the US central bank.
Warsh is not a newcomer to monetary policy. He served as a Fed governor from 2006 to 2011, spanning the global financial crisis, where he was deeply involved in emergency liquidity measures, bank rescues, and the early phases of unconventional policy. That experience still carries weight in financial circles.
Before joining the Fed, Warsh built his career on Wall Street and in public service, giving him fluency in both market mechanics and policymaking. That dual background has long made him a familiar and generally respected figure among investors, particularly those concerned with institutional continuity.
In the weeks leading up to the decision, markets had focused on Kevin Hassett, the National Economic Council director, as a frontrunner. Hassett’s perceived dovish leanings mattered, but more importantly, his proximity to the White House raised fears of overt political influence over monetary policy.
Those fears had real market consequences. Investors began to price in a more severe erosion of Fed independence, accelerating flows into hard assets and amplifying volatility in Gold and Silver. The assumption was not just easier policy, but a structural shift in how policy decisions would be made.
Against that backdrop, Warsh’s selection was widely interpreted as a line drawn. While he is not immune to political pressure, he is not seen as an extension of the executive branch either. His appointment suggested that there are still boundaries around how far presidential influence over the Fed can stretch.
The symbolism mattered as much as the individual. Rather than installing a close political ally, US President Donald Trump opted for a figure with established Fed credentials and institutional legitimacy. That choice sent a message that continuity, at least in form, still matters.
For markets, this did not mean a reversal of policy direction or an abrupt shift in rate expectations. But it did mean that the most extreme scenarios around politicization were dialed back, helping to stabilize expectations—even if deeper questions about the Fed’s future remain unresolved.
Relief, Not Repricing: What Warsh Did—and Didn’t—Change
Despite the violent reaction in precious metals, the short answer to whether Kevin Warsh’s appointment materially changed the macro outlook is no. Once the initial shock passed, other parts of the market sent a clear signal: expectations around growth, inflation, and monetary policy remain largely intact.
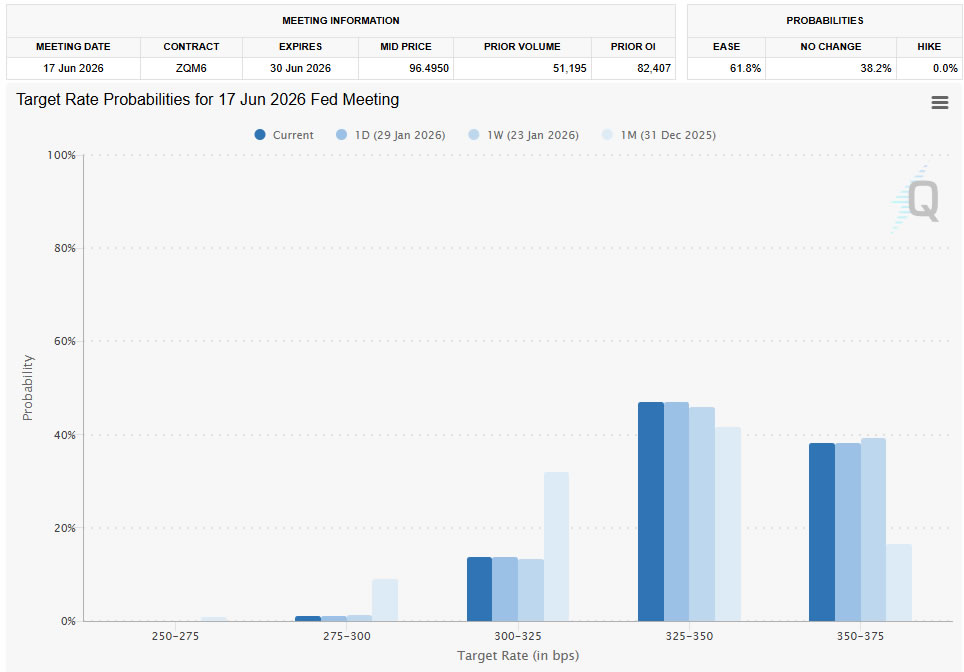
Most tellingly, Fed rate cut pricing barely moved. Futures continue to imply roughly a 60% chance of a 25bp cut by the end of June, little changed from the prior week. If markets believed Warsh marked a meaningful hawkish turn, that pricing would have shifted decisively.
The Federal Open Market Committee’s own behavior reinforced that message. While Stephen Miran and Christopher Waller dissented in favor of a cut at the last meeting, the majority opted to hold rates at 3.50–3.75%, maintaining a cautious, wait-and-see stance. That internal balance remains unchanged.
After delivering three risk-management cuts last year, policymakers appear content to pause and assess incoming data. Inflation has cooled but remains exposed to upside risks, while employment has stabilized rather than weakened decisively. In that environment, urgency to ease further is limited.
Crucially, the Warsh appointment does not remove the wild cards facing the Fed. Rising oil prices linked to Iran instability, renewed trade tensions with the EU and Canada, and the broader geopolitical backdrop all complicate the inflation outlook in ways that argue for caution rather than haste.
Equity and bond markets reflected this realism. US stocks did not break out of established ranges, and Treasury yields continued to trade sideways. There was no confirmation of a regime shift—just selective repositioning.
This contrast with precious metals is important. Gold and silver reacted violently because they were pricing institutional decay scenarios that were partially unwound. Other asset classes, which had not embraced those extremes, had far less to reverse.
In that sense, Warsh’s appointment reduced tail risk, but it did not rewrite the base case. The Fed remains data-dependent, the policy path remains conditional, and markets are still operating in a world where uncertainty—not clarity—dominates decision-making.
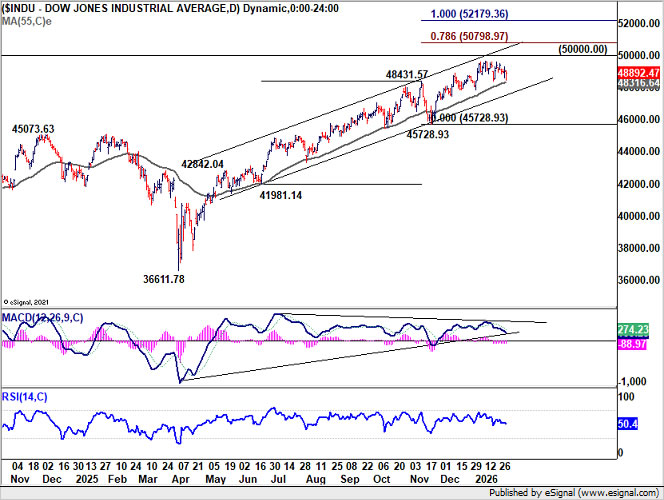
DOW and 10-Year Yield Stay Caged
US equities continued to trade within established ranges. DOW struggled to sustain upside traction below the 50,000 psychological level, with price action reflecting indecision rather than conviction.
Technically, the picture is mixed. On the supportive side, DOW is still holding comfortably within its medium-term rising channel and above the rising 55 D EMA (now at 48,316.64), which continues to offer dynamic support and argues against an immediate trend reversal.
At the same time, warning signs persist. Bearish divergence in D MACD remains unresolved, suggesting upside momentum is fading. This divergence limits confidence in any clean breakout and keeps the risk of a corrective phase alive.
For now, the path of least resistance still points higher, with a break above 50,000 marginally favored. But even in that scenario, upside is unlikely to be smooth. Technical resistance is expected near 78.6% projection of 41,981.14 to 48,431.57 from 45,728.93 at 50,798.97 to limit upside.
On the other hand, Decisive break below 55 D EMA would shift the balance more clearly toward a medium-term correction. That level remains the key fault line between continuation and consolidation, and it has yet to be tested convincingly.
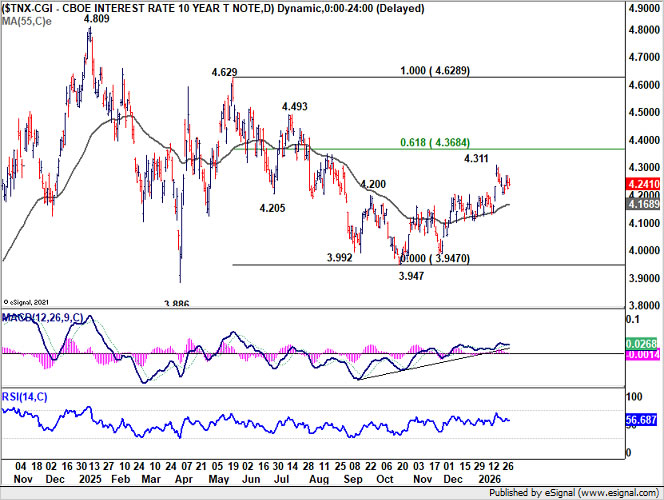
Treasury markets told a similar story of restraint. US 10-year yield continued to oscillate in a tight range above 4.200, after briefly spiking to 4.311 earlier in January. There was no sustained follow-through in either direction.
For now, outlook is unchanged that rise from 3.947 is reversing whole fall from 4.629. Further rally is expected as long as 55 D EMA (now at 4.168) holds. Another rise should be seen back to 61.8% retracement of 4.629 to 3.947 at 4.368. Firm break there will pave the way back 4.628 resistance.
Dollar’s Problems Run Deeper Than the Fed: Euro Normalization and Yen Asymmetry
Even with the Warsh appointment reducing some tail risks, Dollar remains vulnerable to forces that extend well beyond Fed leadership. Chief among these are developments in the Euro and Yen, both of which continue to exert structural pressure on the greenback.
In Europe, the debate around a stronger Euro has quietly shifted. What once sounded like fringe speculation—EUR/USD pushing decisively above 1.20—is now being discussed more openly by market participants. That change in tone matters. Acceptance often precedes price. Euro’s resilience is not built on rapid growth, but on relative stability. The ECB has little incentive to aggressively lean against currency strength. As long as that remains the case, Euro appreciation becomes a feature rather than a bug.
From a flow perspective, diversification out of US assets continues to favor Euro. Reserve managers, institutional investors, and long-term allocators are reassessing concentration risk after years of Dollar dominance. That process is slow, but persistent—and difficult to reverse with a single personnel change at the Fed.
Japan presents a different, but equally powerful, challenge to Dollar. The upcoming snap election remains a major wild card, even if Prime Minister Sanae Takaichi is still expected to secure a solid result. Markets have learned the hard way that political certainty should never be taken for granted.
Any unfavorable election outcome—or even a weaker-than-expected mandate—could trigger a sharp selloff in Japanese equities. Such a move would likely unwind the crowded “Takaichi trade,” forcing capital back into Yen at speed.
That matters because Yen strength tends to feed on itself. Equity weakness, falling foreign asset exposure, and hedging demand can combine to produce outsized currency moves that are difficult for authorities to counter quickly.
In that context, Dollar faces a pincer movement. Euro appreciation reflects gradual, structural diversification, while Yen strength would arrive through sudden, risk-driven adjustments. Neither dynamic is easily neutralized by modest shifts in US rate expectations.
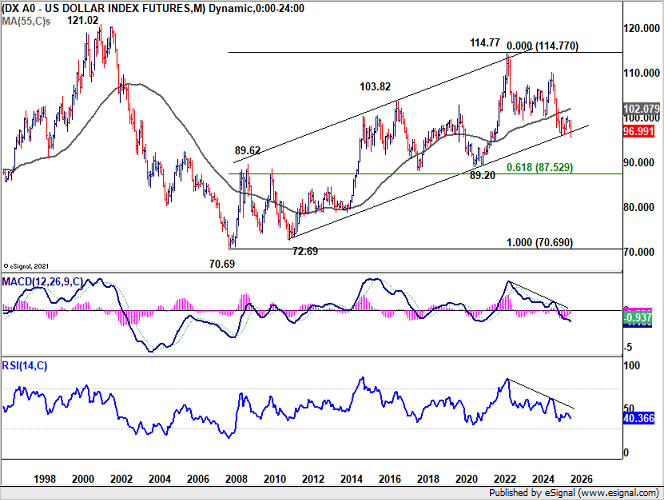
Technically, Dollar Index reflects this pressure. The break below 96.21 to 95.55 last week signaled renewed downside momentum. As long as 97.74 resistance holds, the long term down trend is seen as resuming.
The key level is 38.2% projection of 110.17 to 96.37 from 100.39 at 95.11. Decisive break there would prompt downside acceleration through 61.8% projection at 91.86. Nevertheless, firm break of 97.74 will tremendously ease immediate downside risk and bring stronger rebound back towards 100.39.
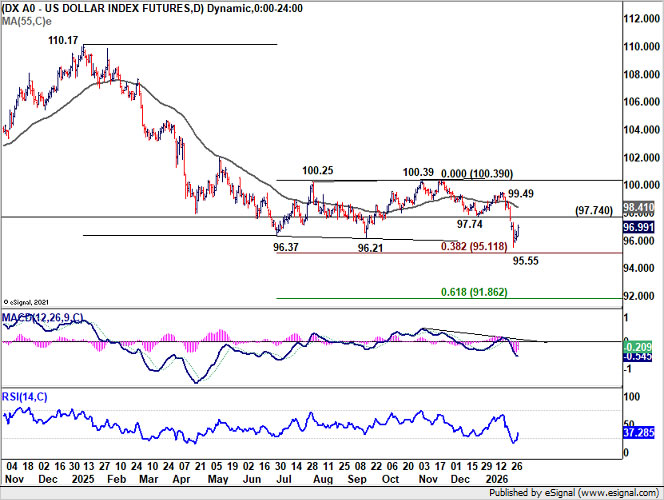
And more importantly, as mentioned many times before, another fall with downside acceleration would push Dollar Index through the multi-decade channel floor decisively. That, if happen, would confirm that Dollar Index is reversing whole uptrend from 70.69 (2008 low). That should open up further down trend to 90 psychological level and below.