Sample Category Title
Technical Outlook and Review
DXY:
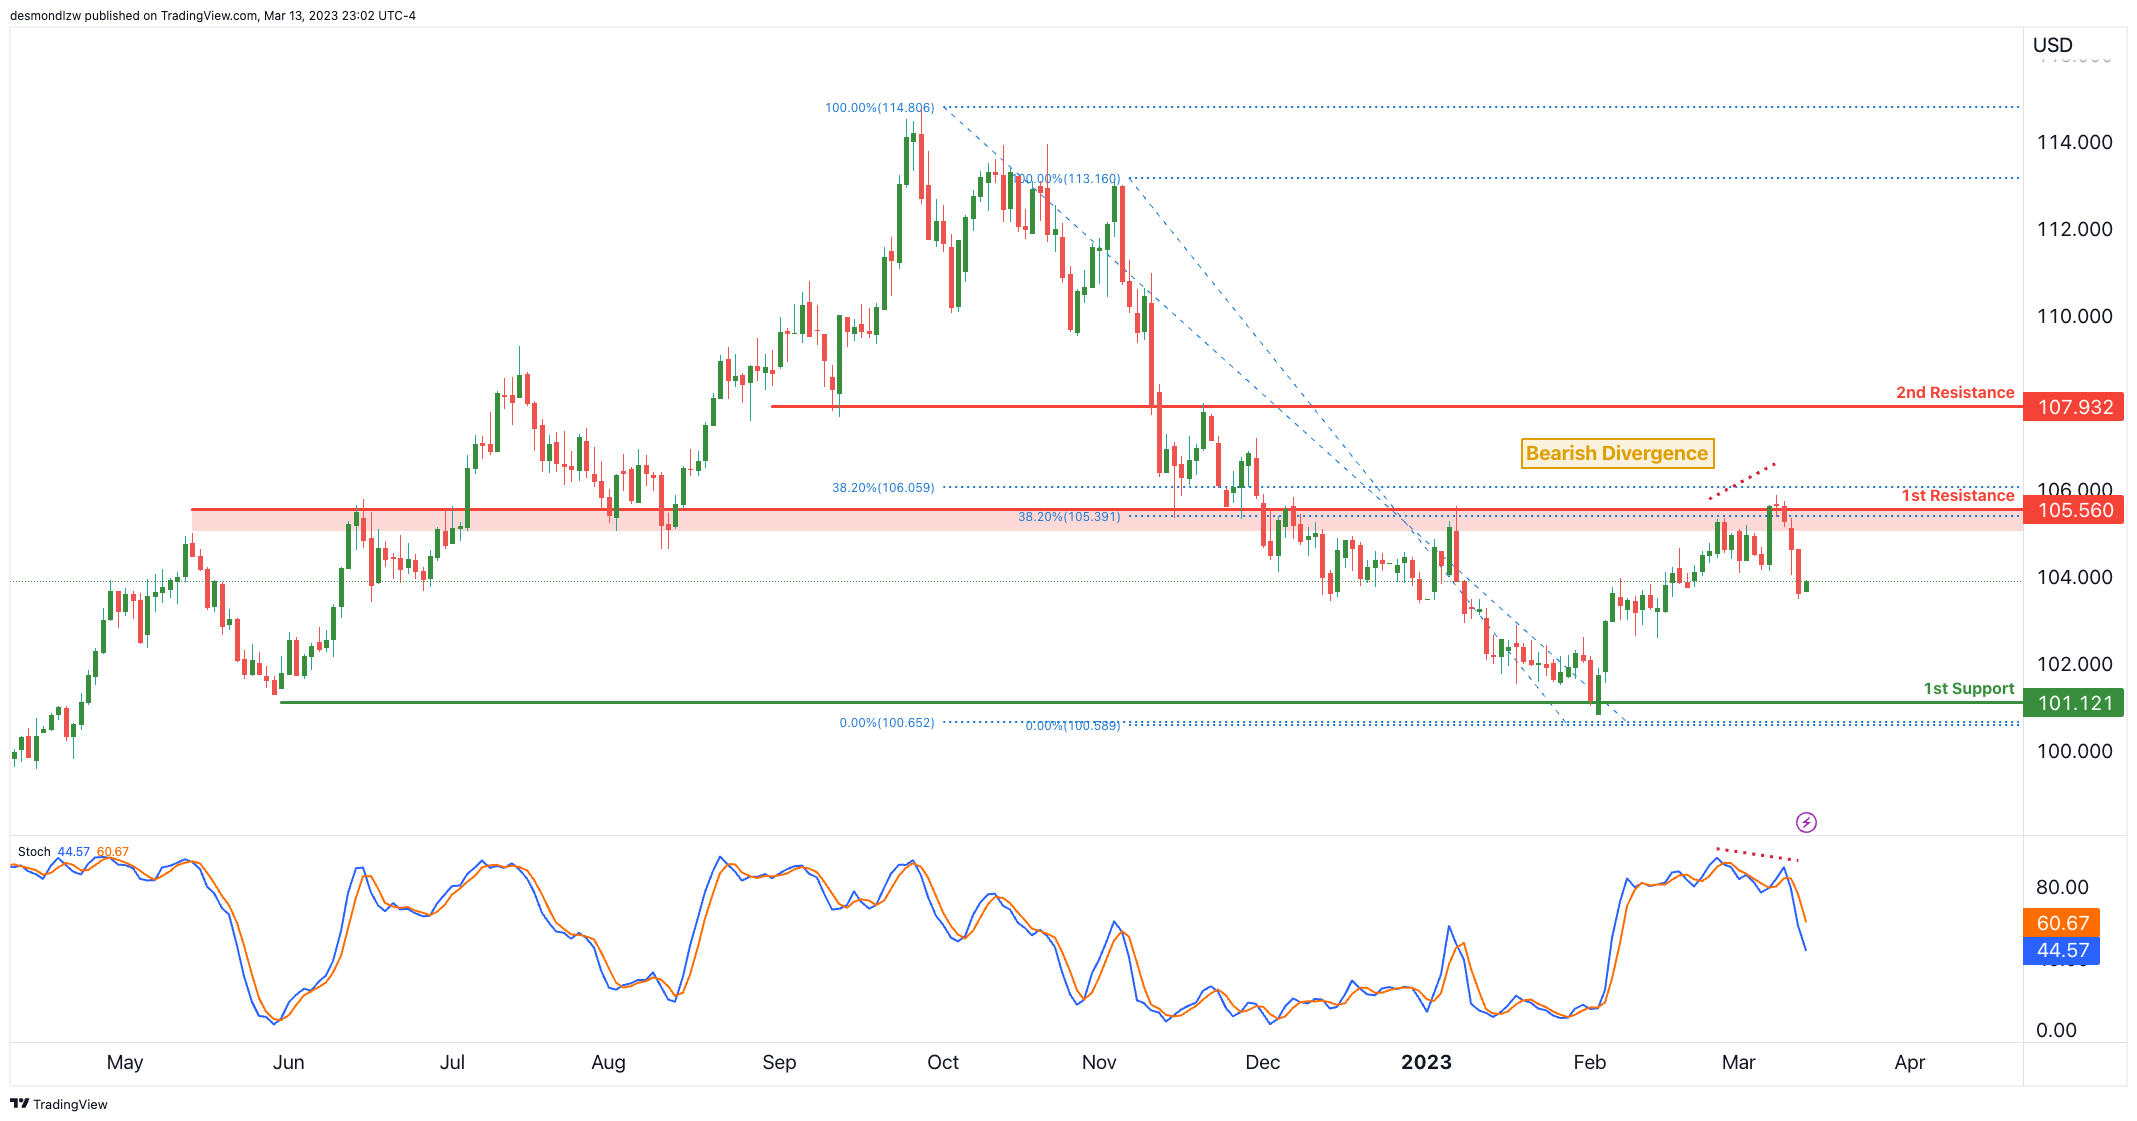
Price has started to reverse from our 1st resistance at 105.56 really nicely and has also started to form a bearish divergence vs Stochastic. We could see a reversal from this level to push prices all the way down to 1st support which is a multi-swing low support.
Stochastic is also reversing from an overbought zone with significant downside potential.
EUR/USD:
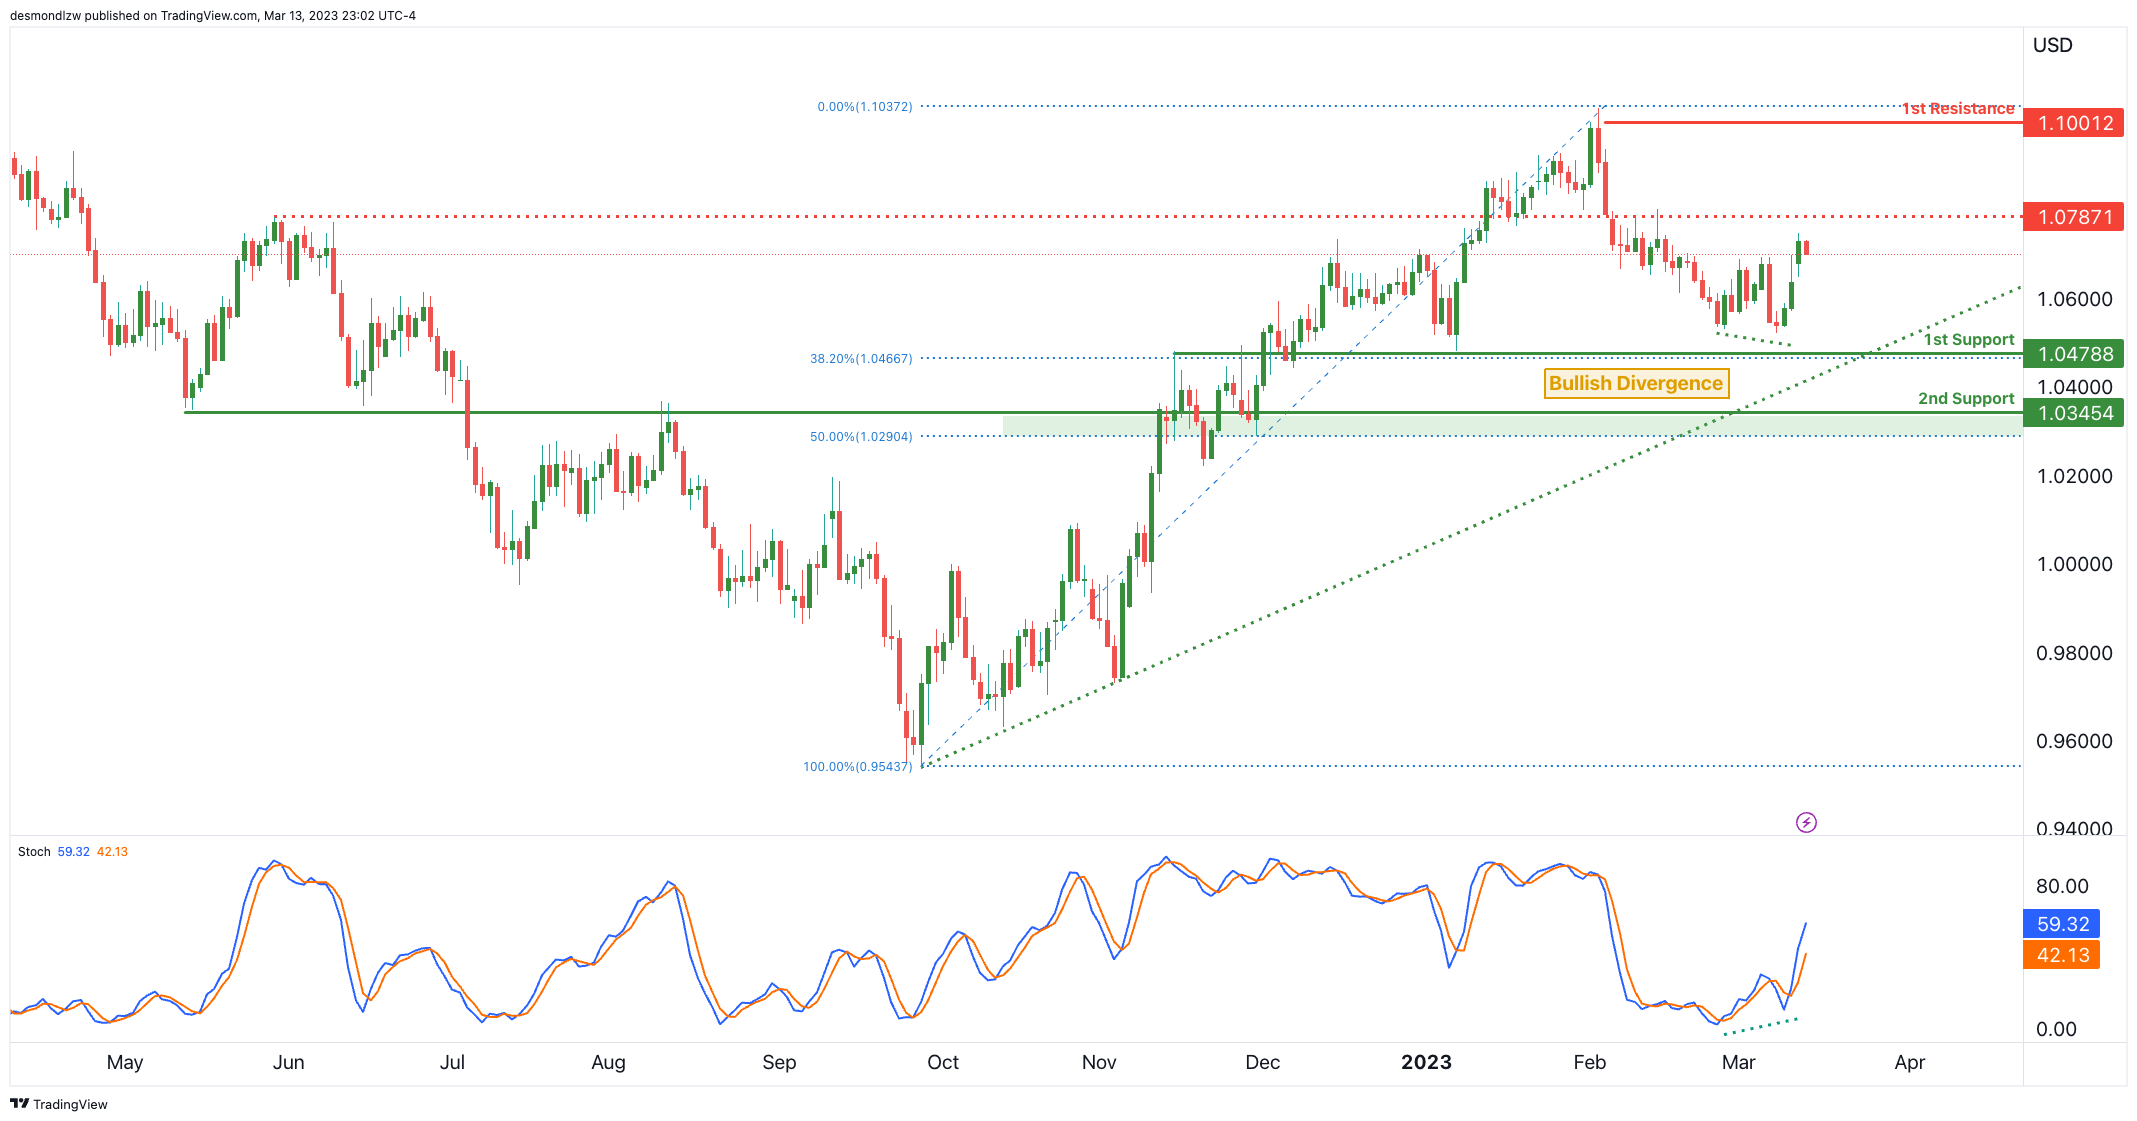
Price has started to bounce nicely off 1st support and at the same time, is displaying bullish divergence vs Stochastic suggesting that there might be a further move up. We see an ascending trend line suggesting there’s a bit more bullish momentum for EURUSD.
In terms of resistance, there is an intermediate resistance at the 1.0787 level where price needs to break past to trigger a further move to 1.1000 level which is a swing high resistance and big figure.
GBP/USD:
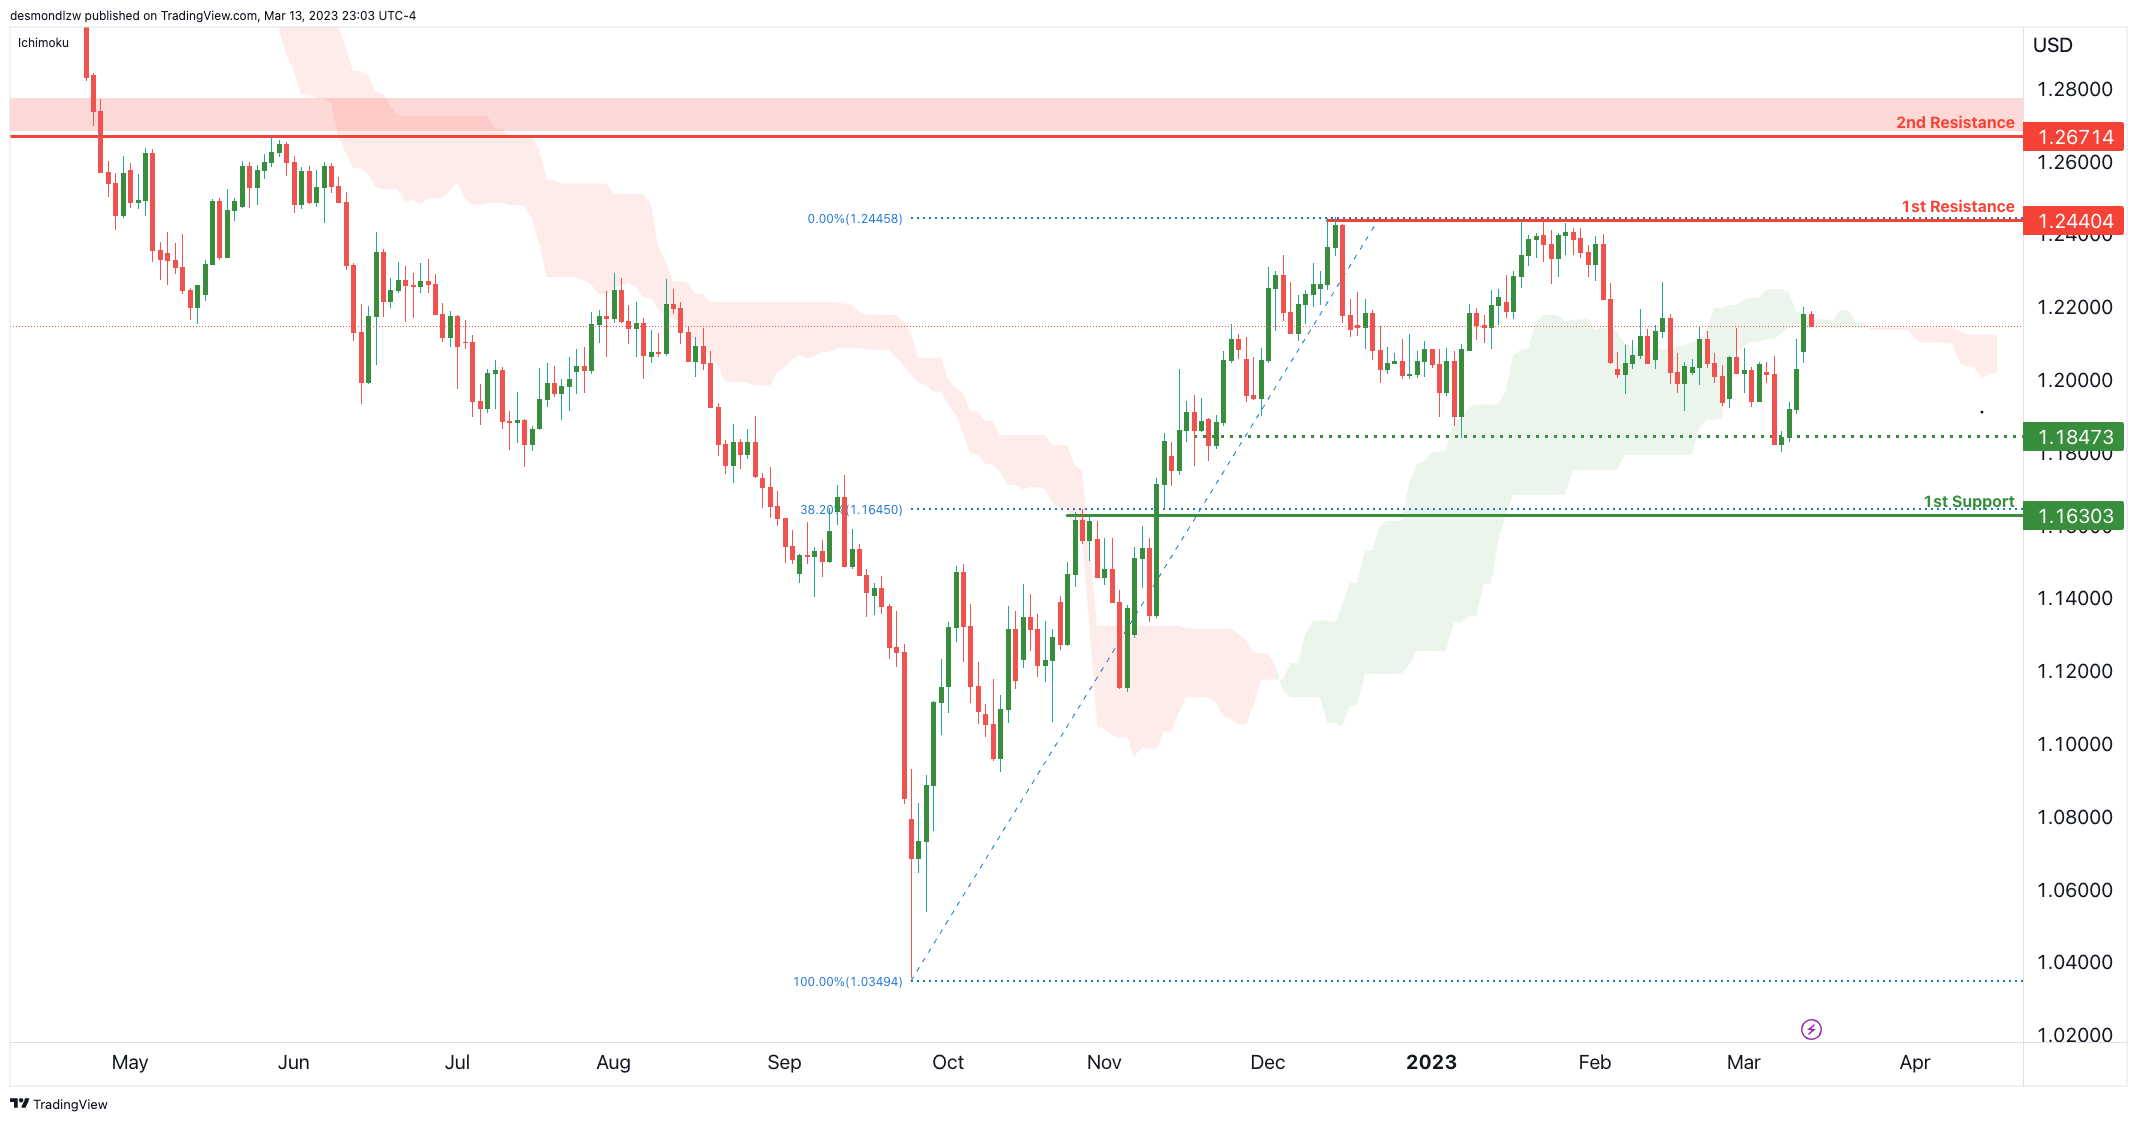
Price continues to hold well above our intermediate support at 1.1847 which needs to be broken to trigger a double top reversal. It has also crossed below the Ichimoku cloud suggesting there might be more bearishness in this move.
1st resistance remains at 1.2440 which is a multi-swing high resistance level that price needs to break past to reach the 2nd long-tern resistance at 1.2671.
USD/CHF:
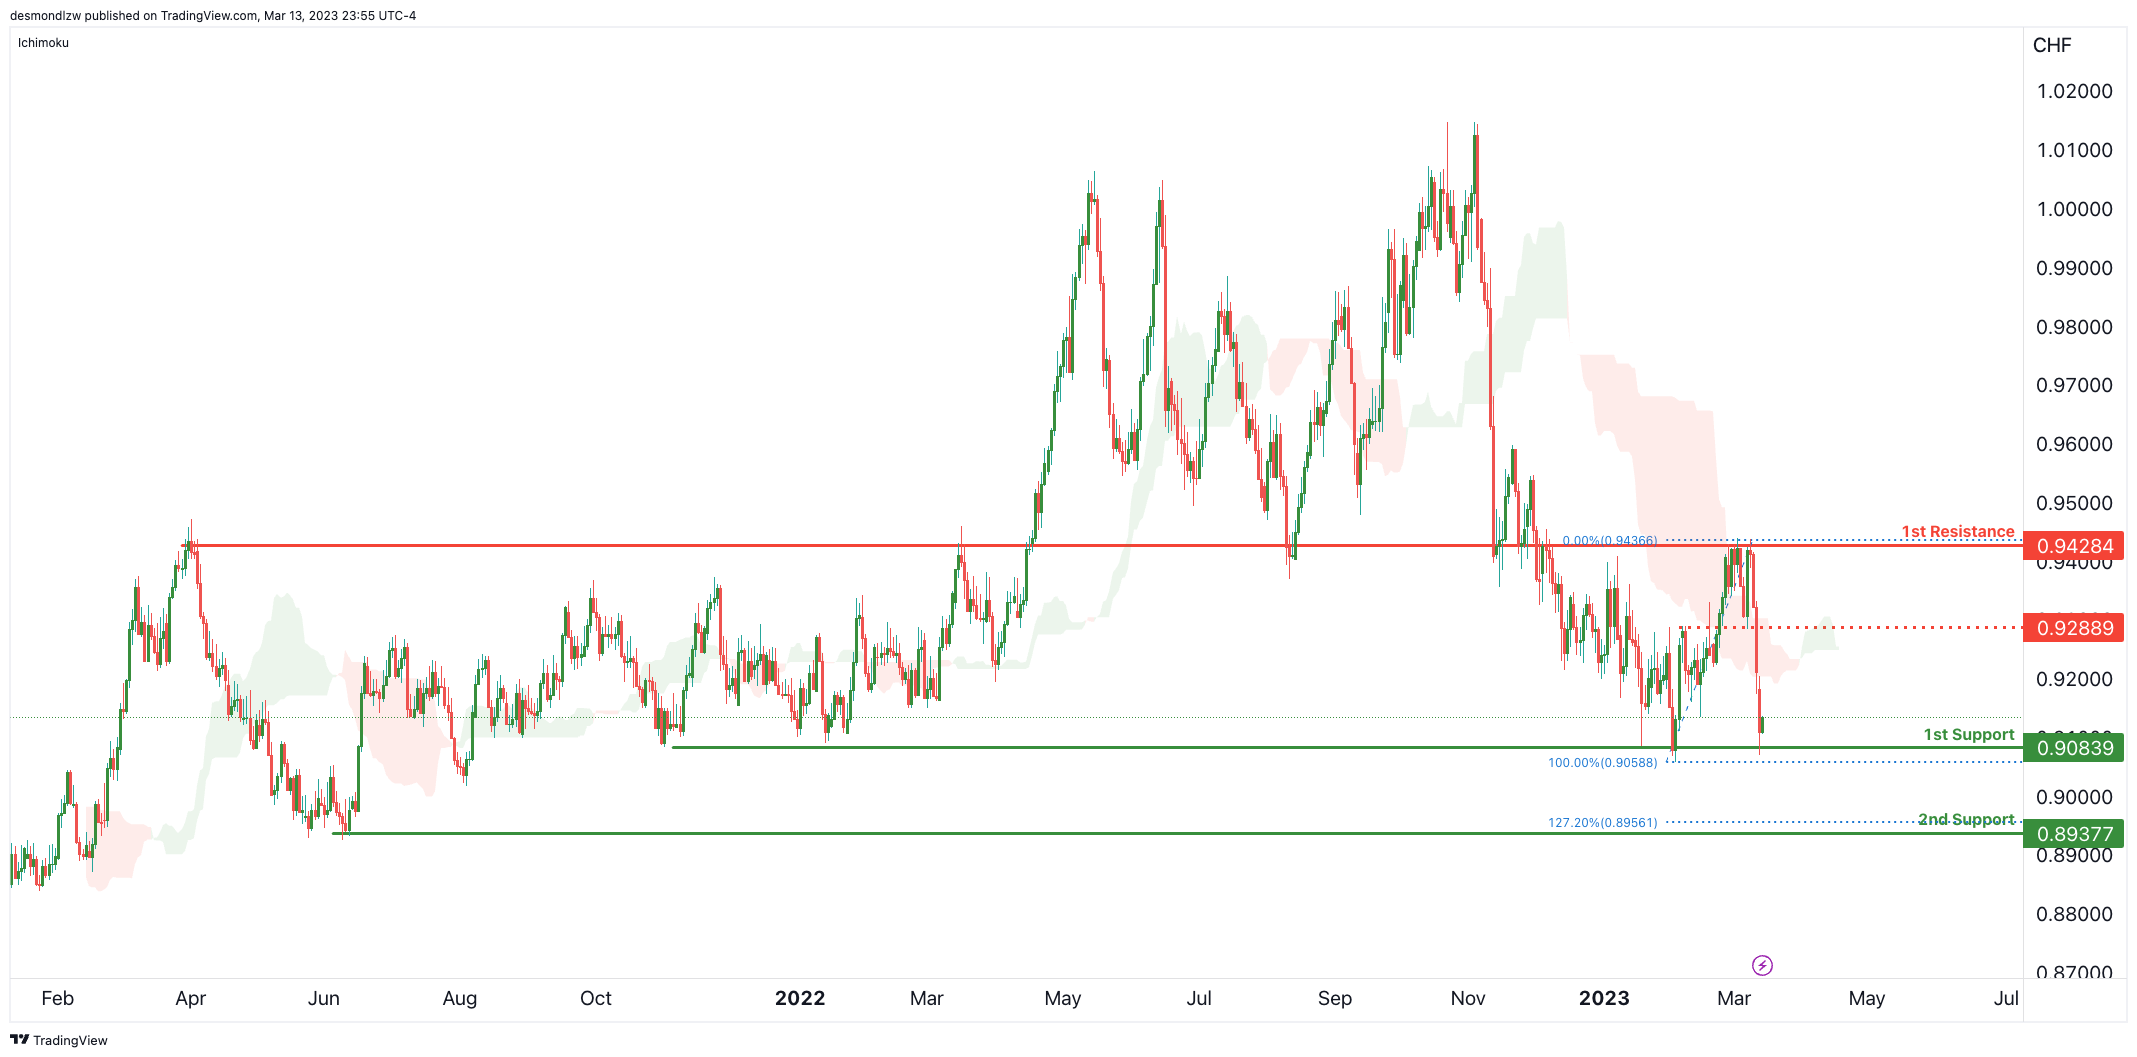
Price has dropped really nicely from our forecasted 1st resistance at 0.9428 previously and is back at major support at 0.9083 which is a multi-swing low support. It’s worth noting that price has also dropped below the Ichimoku cloud suggesting a bit more bearishness.
Price needs to brak the 1st support to trigger the next move down to 2nd support at 0.8937 which is a major swing low support from June 2021.
USD/JPY:
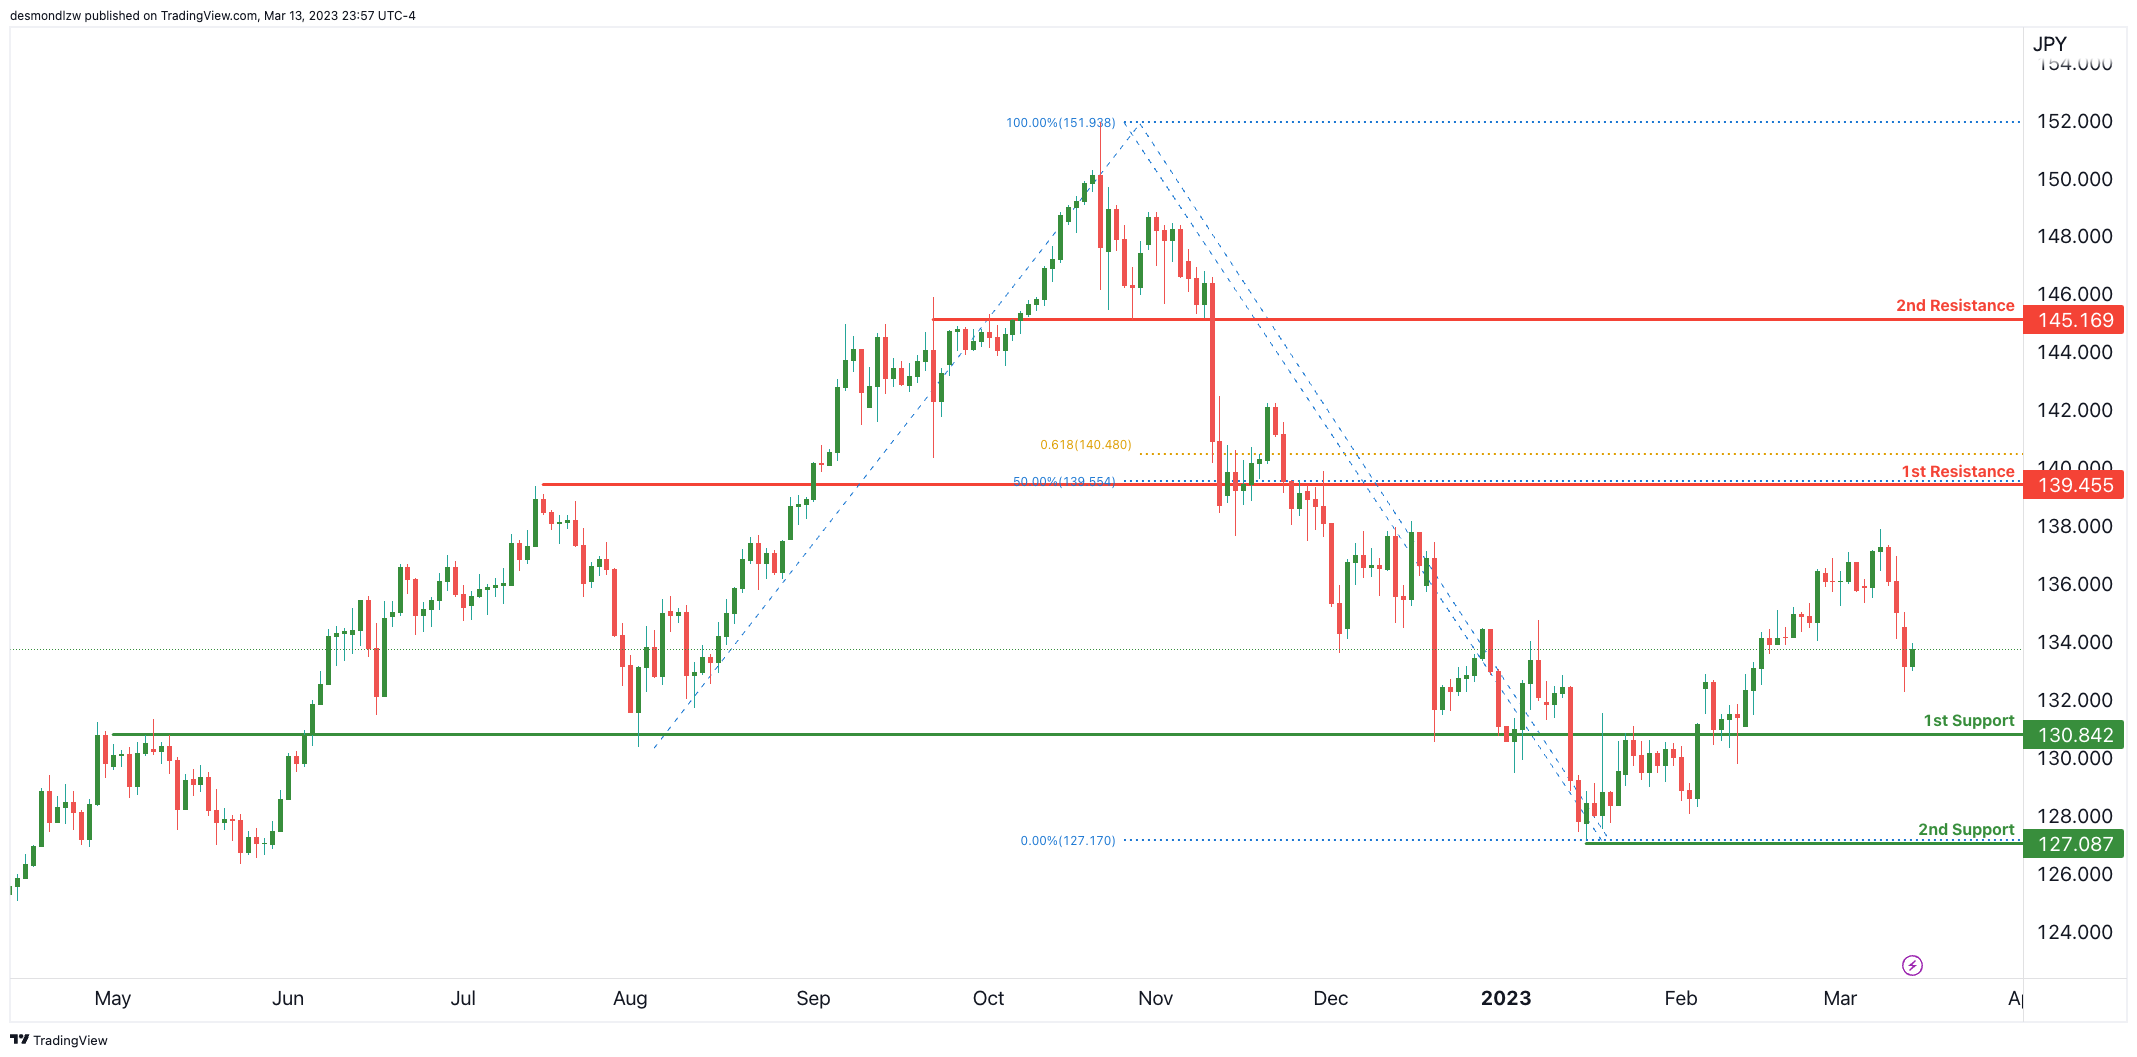
Price has dropped strongly and is fast approaching a major overlap support at 130.84. This level needs to be broken to trigger a drop to 2nd support at 127.08 which is the recent major swing low support.
In terms of resistance, there’s 1st resistance at 139.45 which is an overlap resistance and a 50% Fibonacci retracement along with a 61.8% Fibonacci projection.
AUD/USD:
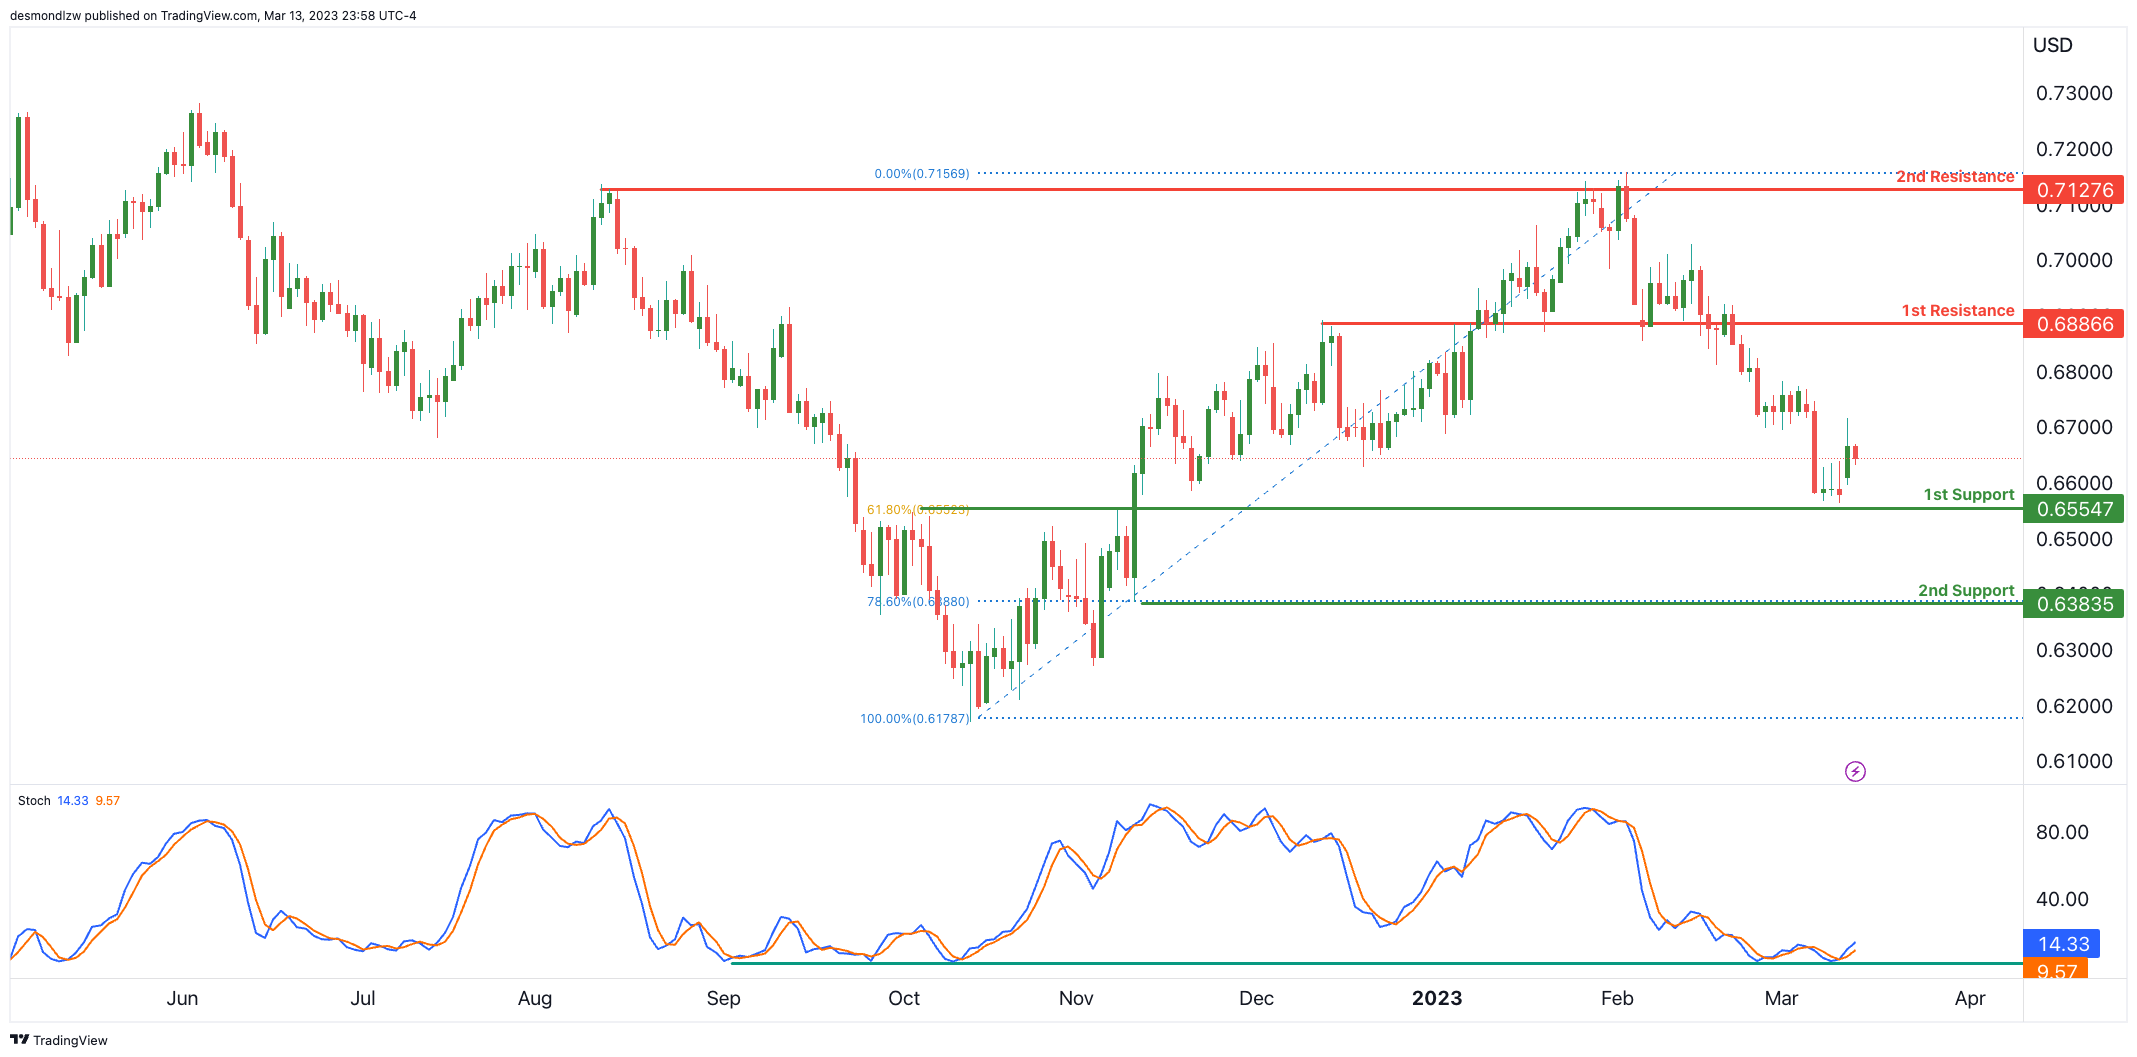
Price is lingering above our 1st support area at 0.6554 which lines up the 61.8% Fibonacci retracement, if price were to break through it, the next key support level would be at 0.6383, which is another overlap support that lines up with the 78.6% Fibonacci retracement.
Regarding resistance levels, the 1st resistance is at 0.6886 which is a strong Overlap resistance, and the 2nd resistance is at 0.7127 which is a multi-swing high resistance level.
It’s worth noting that Stochastic is right on major support and could suggest a bounce is coming soon.
NZD/USD:
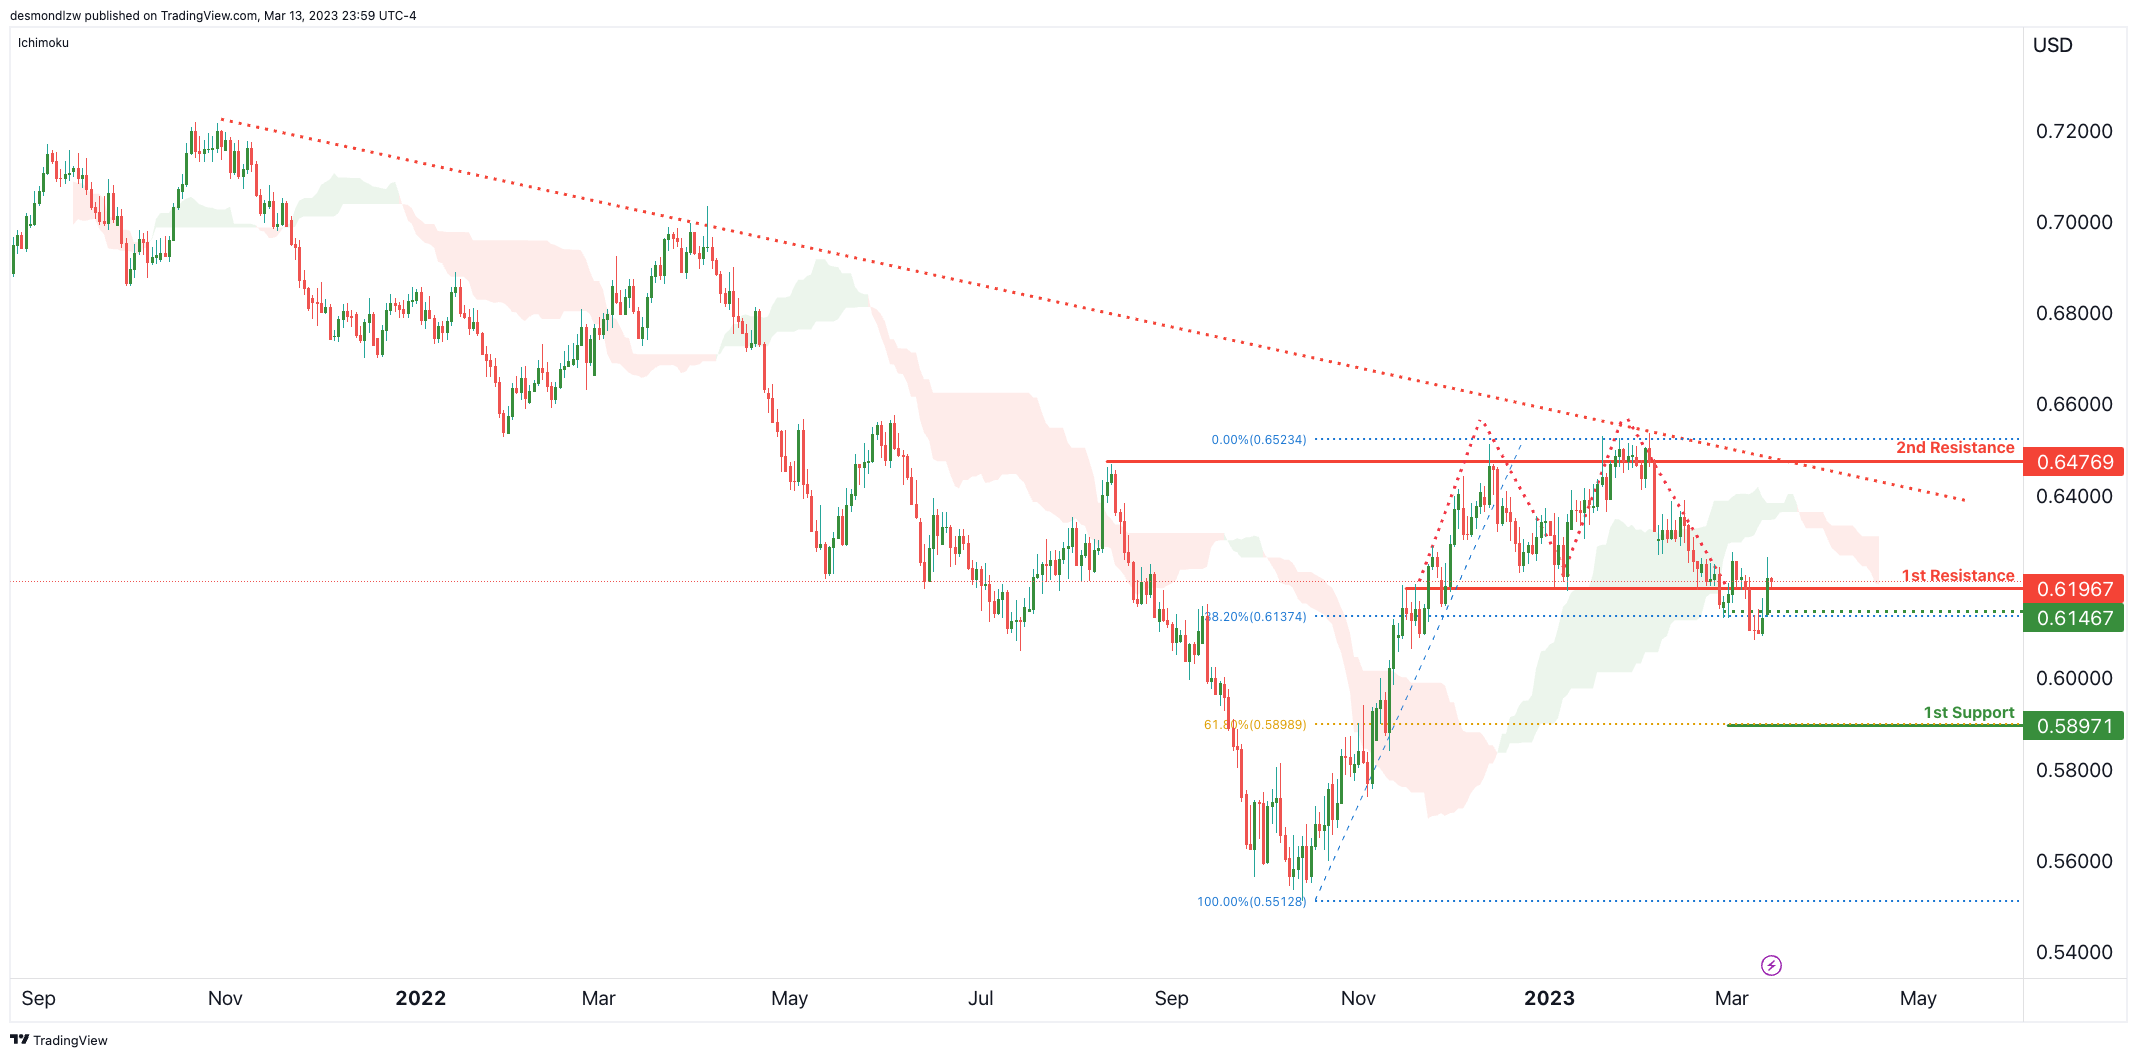
Price is seeing a long term descending resistance line push prices lower and a cross below the Ichimoku cloud + double top breakout level suggests further bearishness might be on the cards. If prie is able to break the 38.2% Fibonacci retracement at 0.6137, we could see a further move down to 1st support at 0.5897.
USD/CAD:
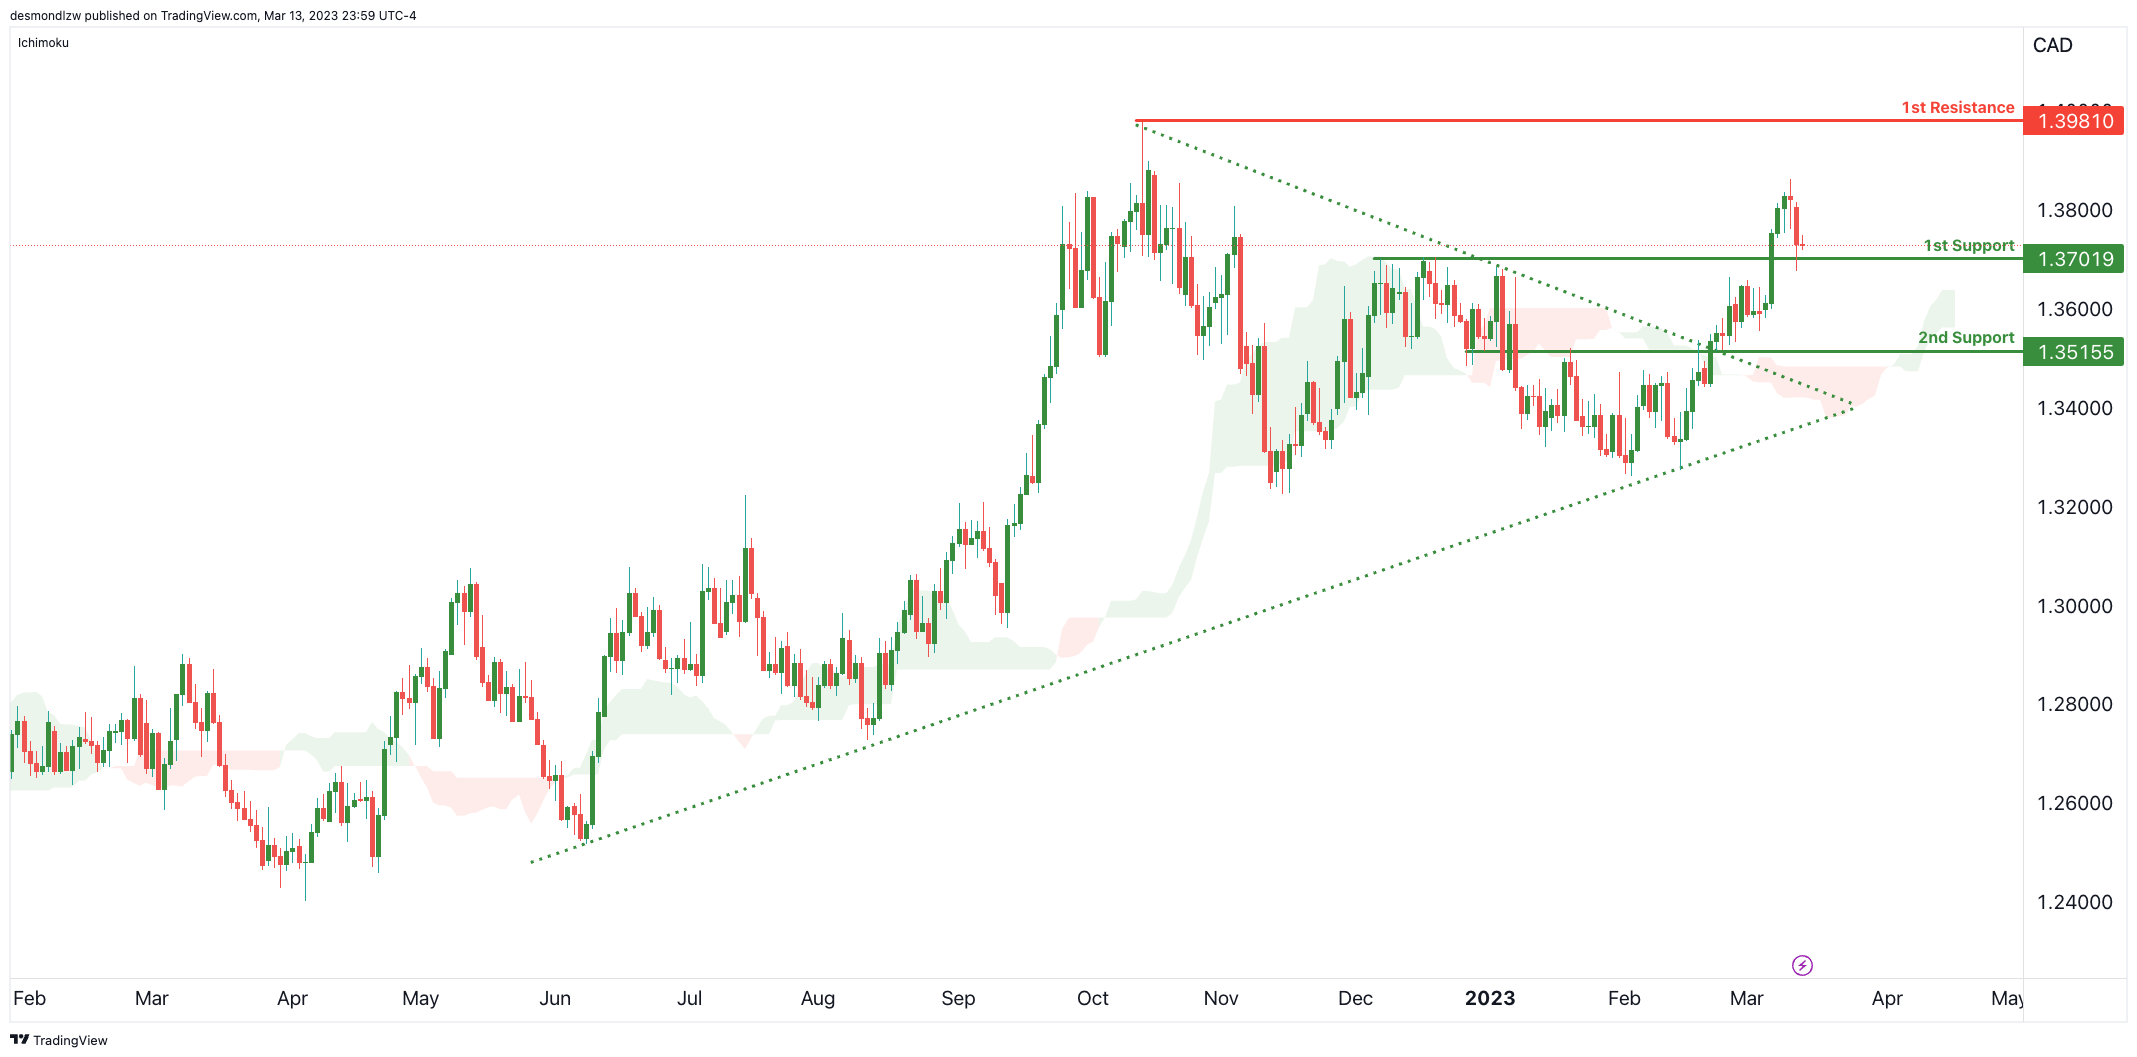
Price is back on major support at 1.3701 which is a pullback support. The ascending support line continues to hold prices up suggesting a further push up to 1st resistance at 1.3981 which is the major swing high resistance.
If price were to break the 1st support level, we could see a drop to 2nd support at 1.3515 which is the short term overlap support.
DJ30:
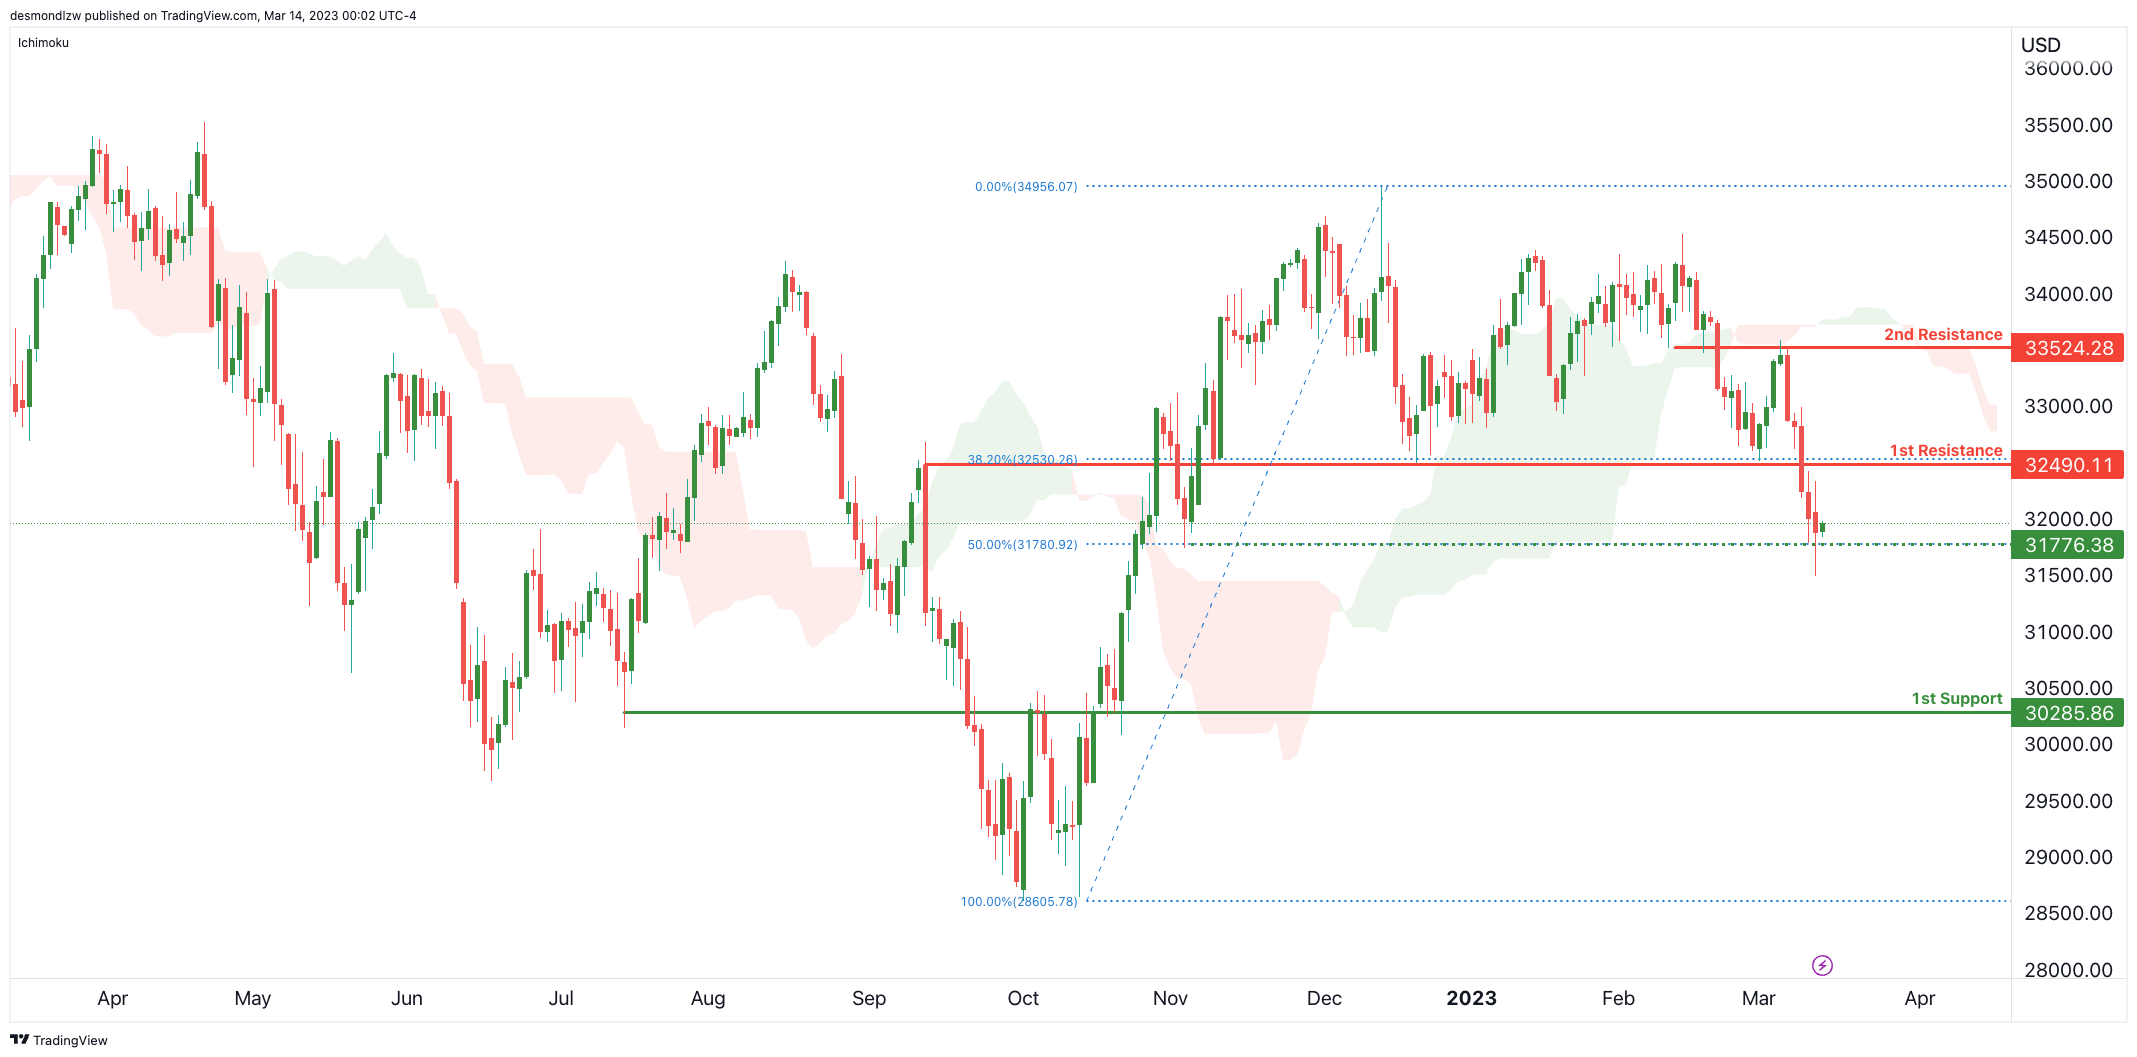
Price has broken the 1st support-turned-resistance at 32490 which has triggered a sort of double-top reversal – suggesting that prices might drop strongly towards the 30285 level. However, there’s an intermediate support level down at 31776 which is a small swing low + 50% Fibonacci retracement. This level needs to be broken to trigger a potential bigger move down.
GER30:
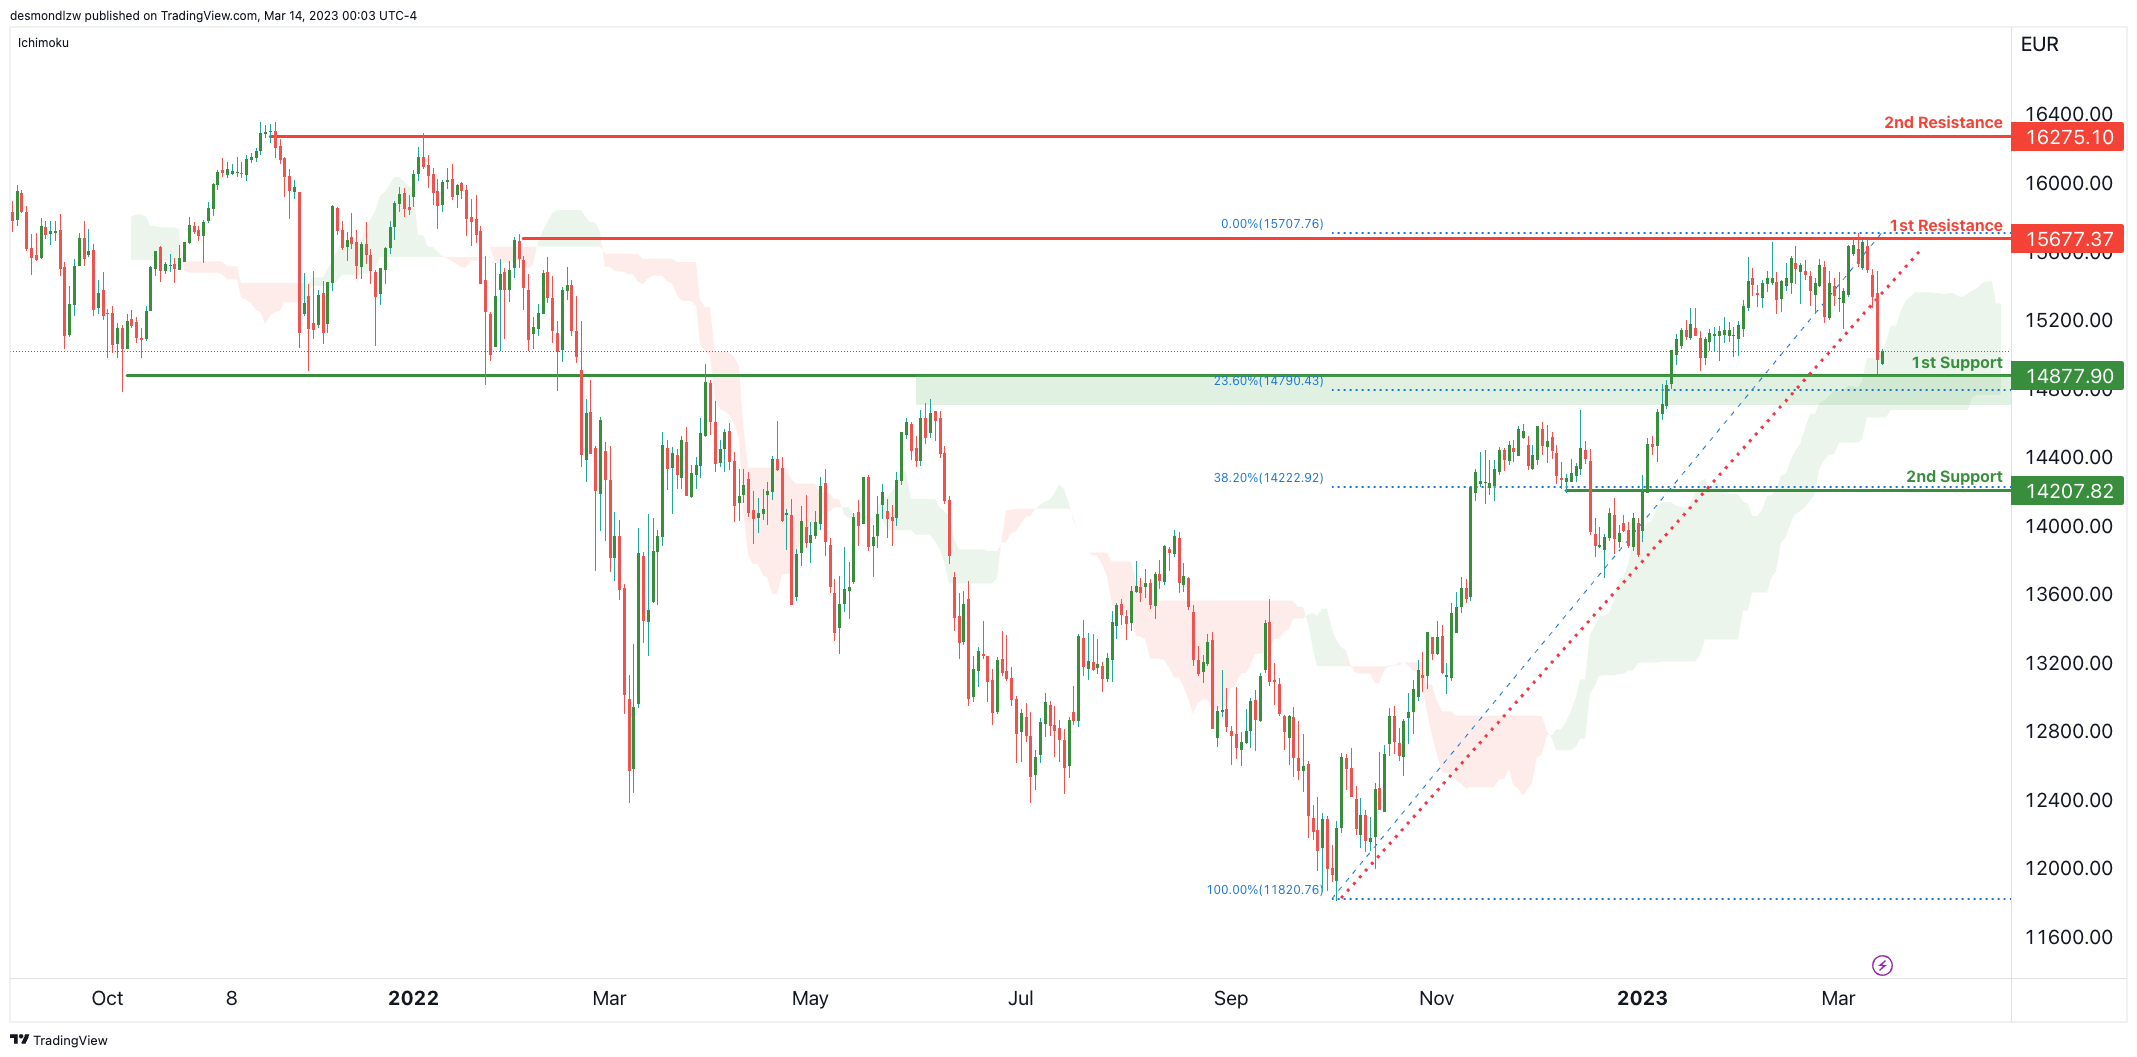
Price has broken a long term ascending support line that stretches back to October 2022. However, it is currently being held up by the 1st support at 14877 which is an overlap support and a 23.6% Fibonacci retracement – along with that, there is a strong bullish Ichimoku cloud that is holding prices up too.
Price would need to break the 14877 area to potentially trigger a move down to 2nd support at 14207 which is the 38.2% Fibonacci retracement and a small overlap support.
BTC/USD:
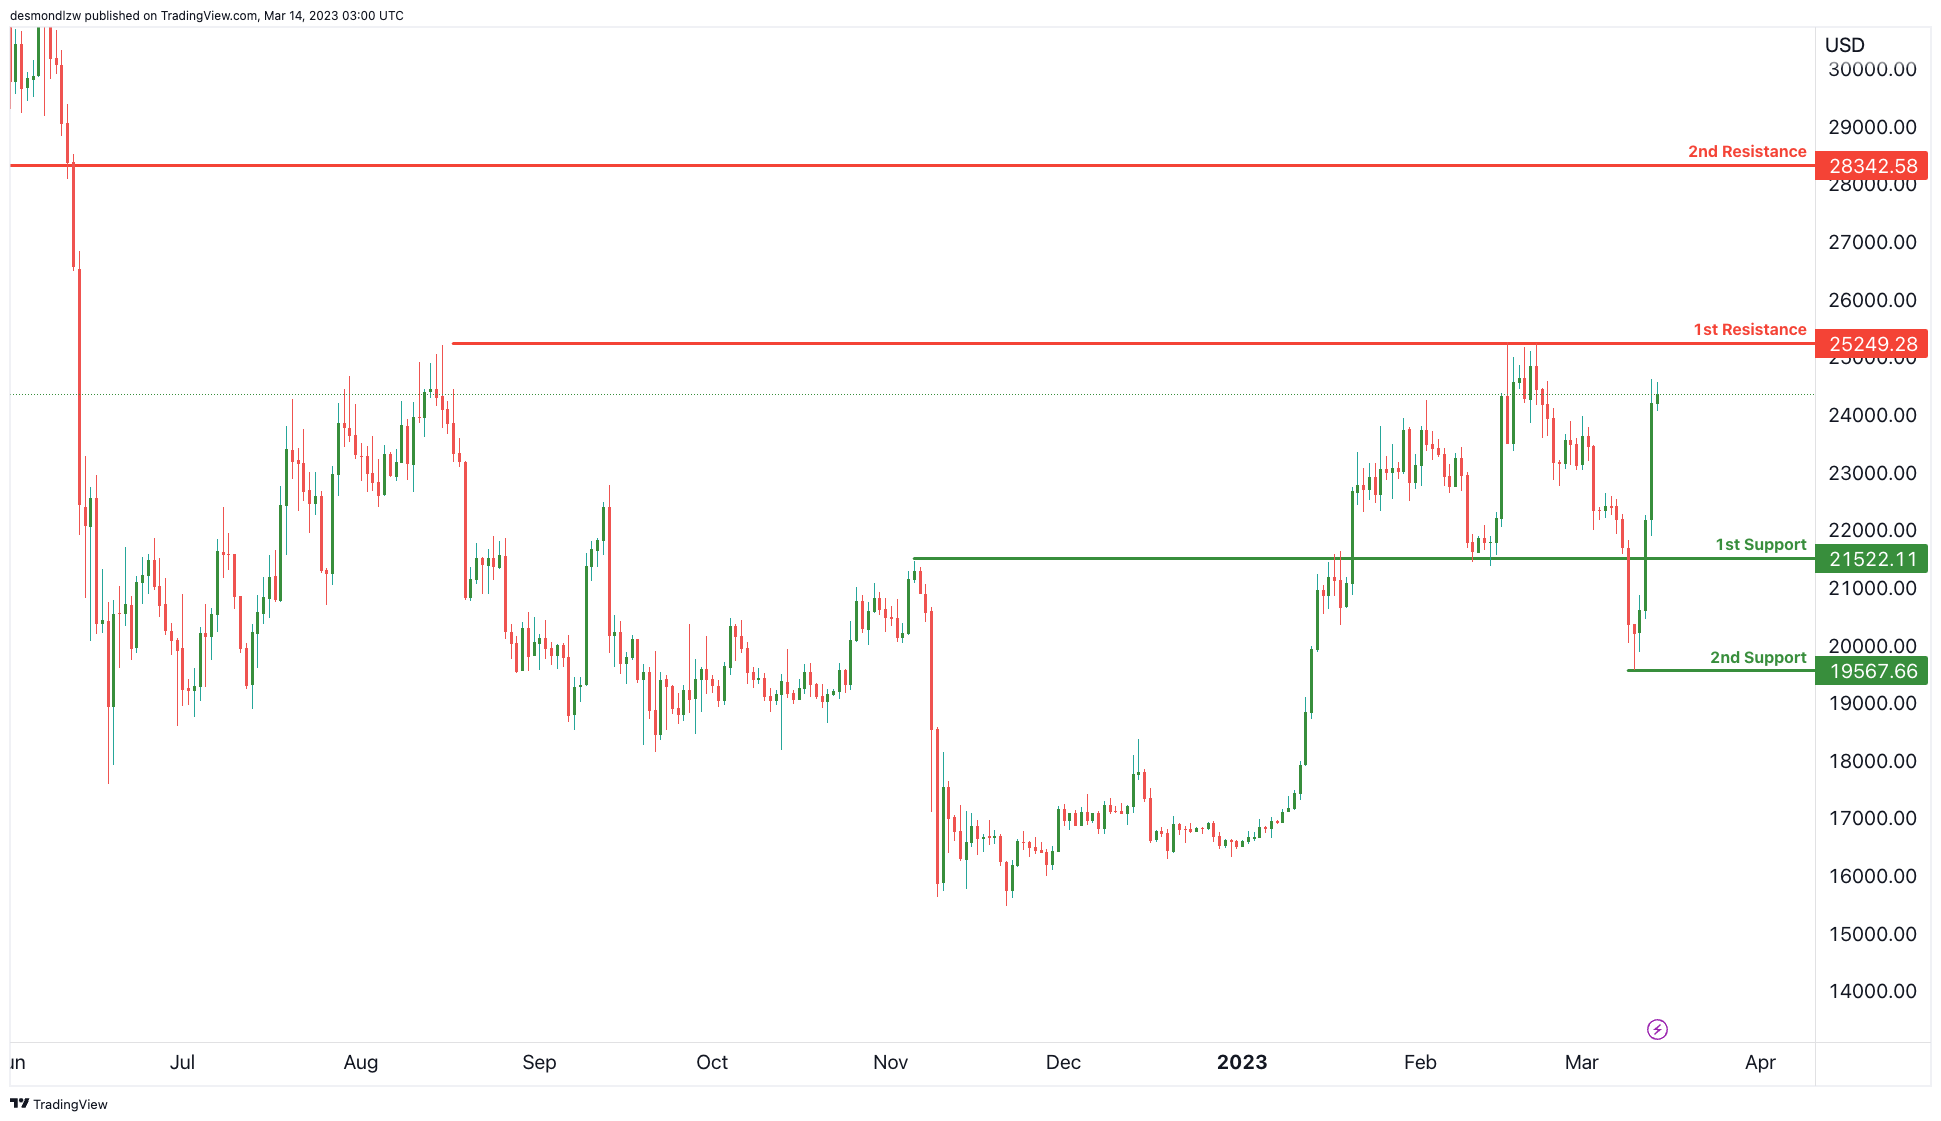
Price is approaching our 1st resistance at 25249 which is a multi-swing high resistance. If price were to break that level, the next big resistance is at 28342 which is a major overlap resistance and Fibonacci retracement.
In terms of support, the first support is at 21522 which is an overlap support that price recently broke. A break of that level would then suggest a move down to 19567.
US500
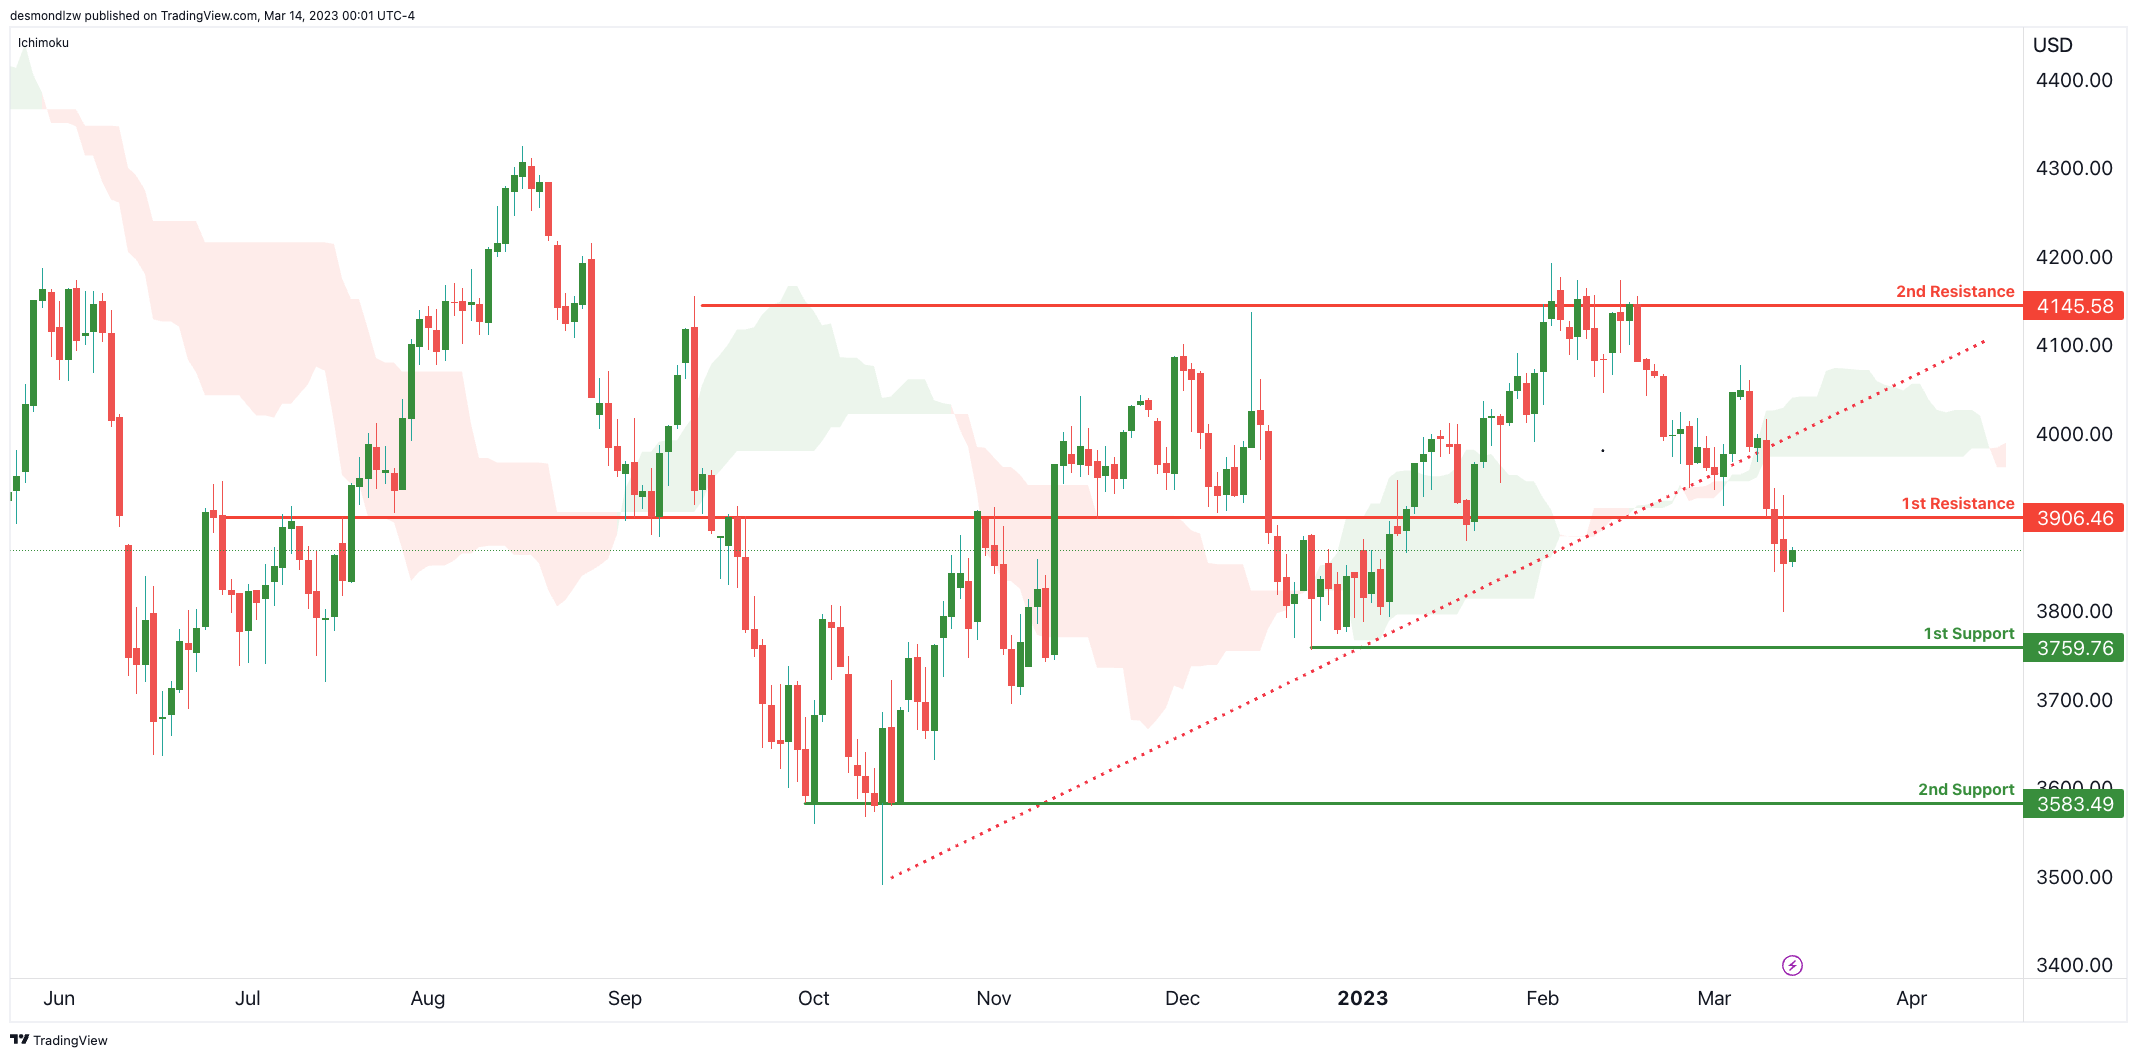
Price recently broke an ascending support-turned-resistance line and crossed below the Ichimoku cloud – suggesting there might be some bearishness coming into play. It iis also currently testing our 1st resistance at 3906 which is an overlap resistance, if price were to break through, it could potentially push up to our 2nd resistance at 4145 which is a multi-swing high resistance.
Regarding the support levels, If the price were to reverse from the 1st resistance level, our 1st support is 3759 and 2nd support is 3583 which is another swing low support.
ETH/USD:
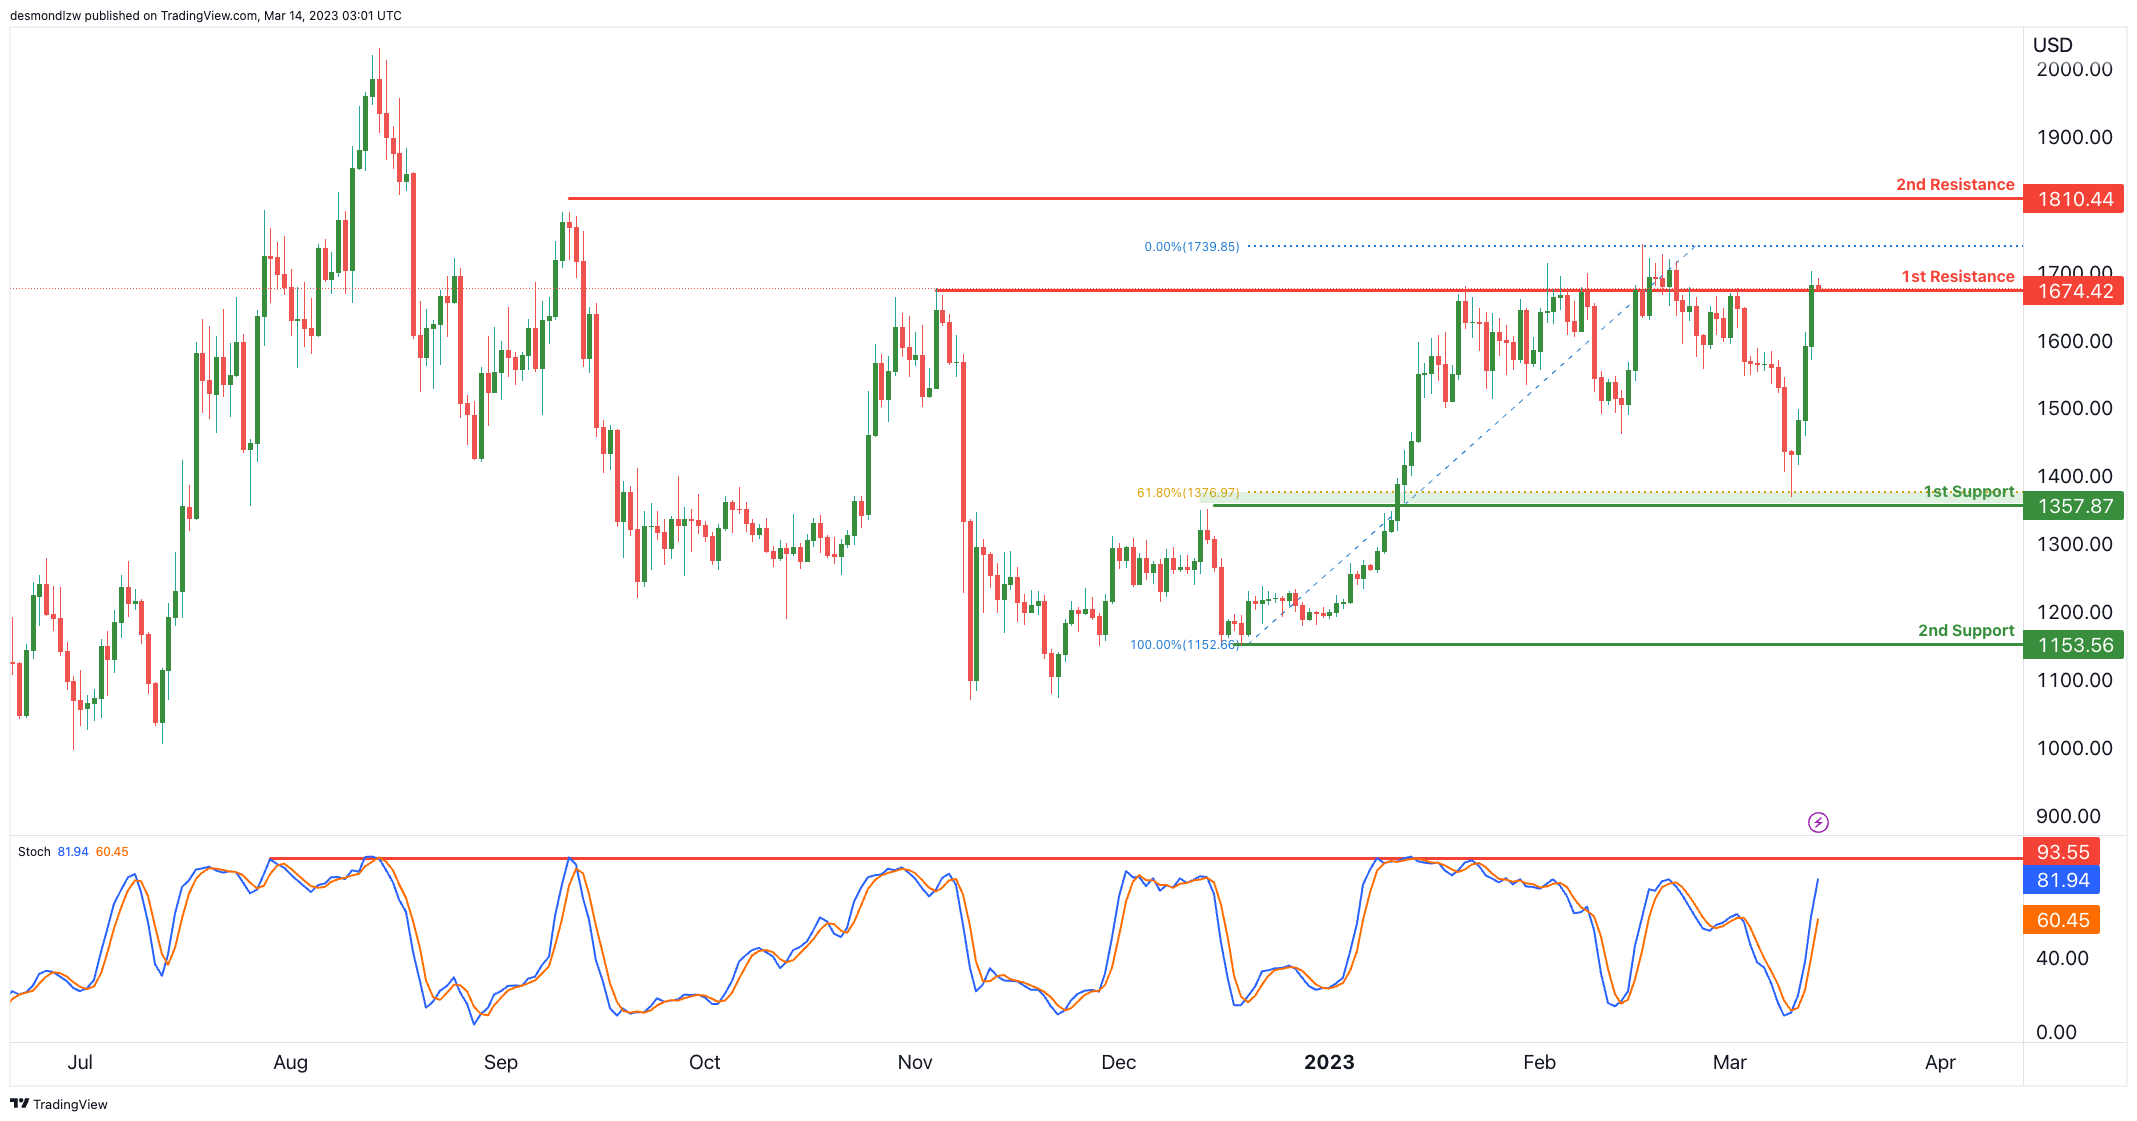
Price is testing a major resistance level at 1674 which is a multi-swing high resistance. If price were to break through this level, the next resistance would be at 1810.
Reversing from this level, we could see price drop to 1st support at 1357 which also lines up with a 61.8% Fibonacci retracement. Breaking that, the next major support would be at 1153.
WTI/USD:
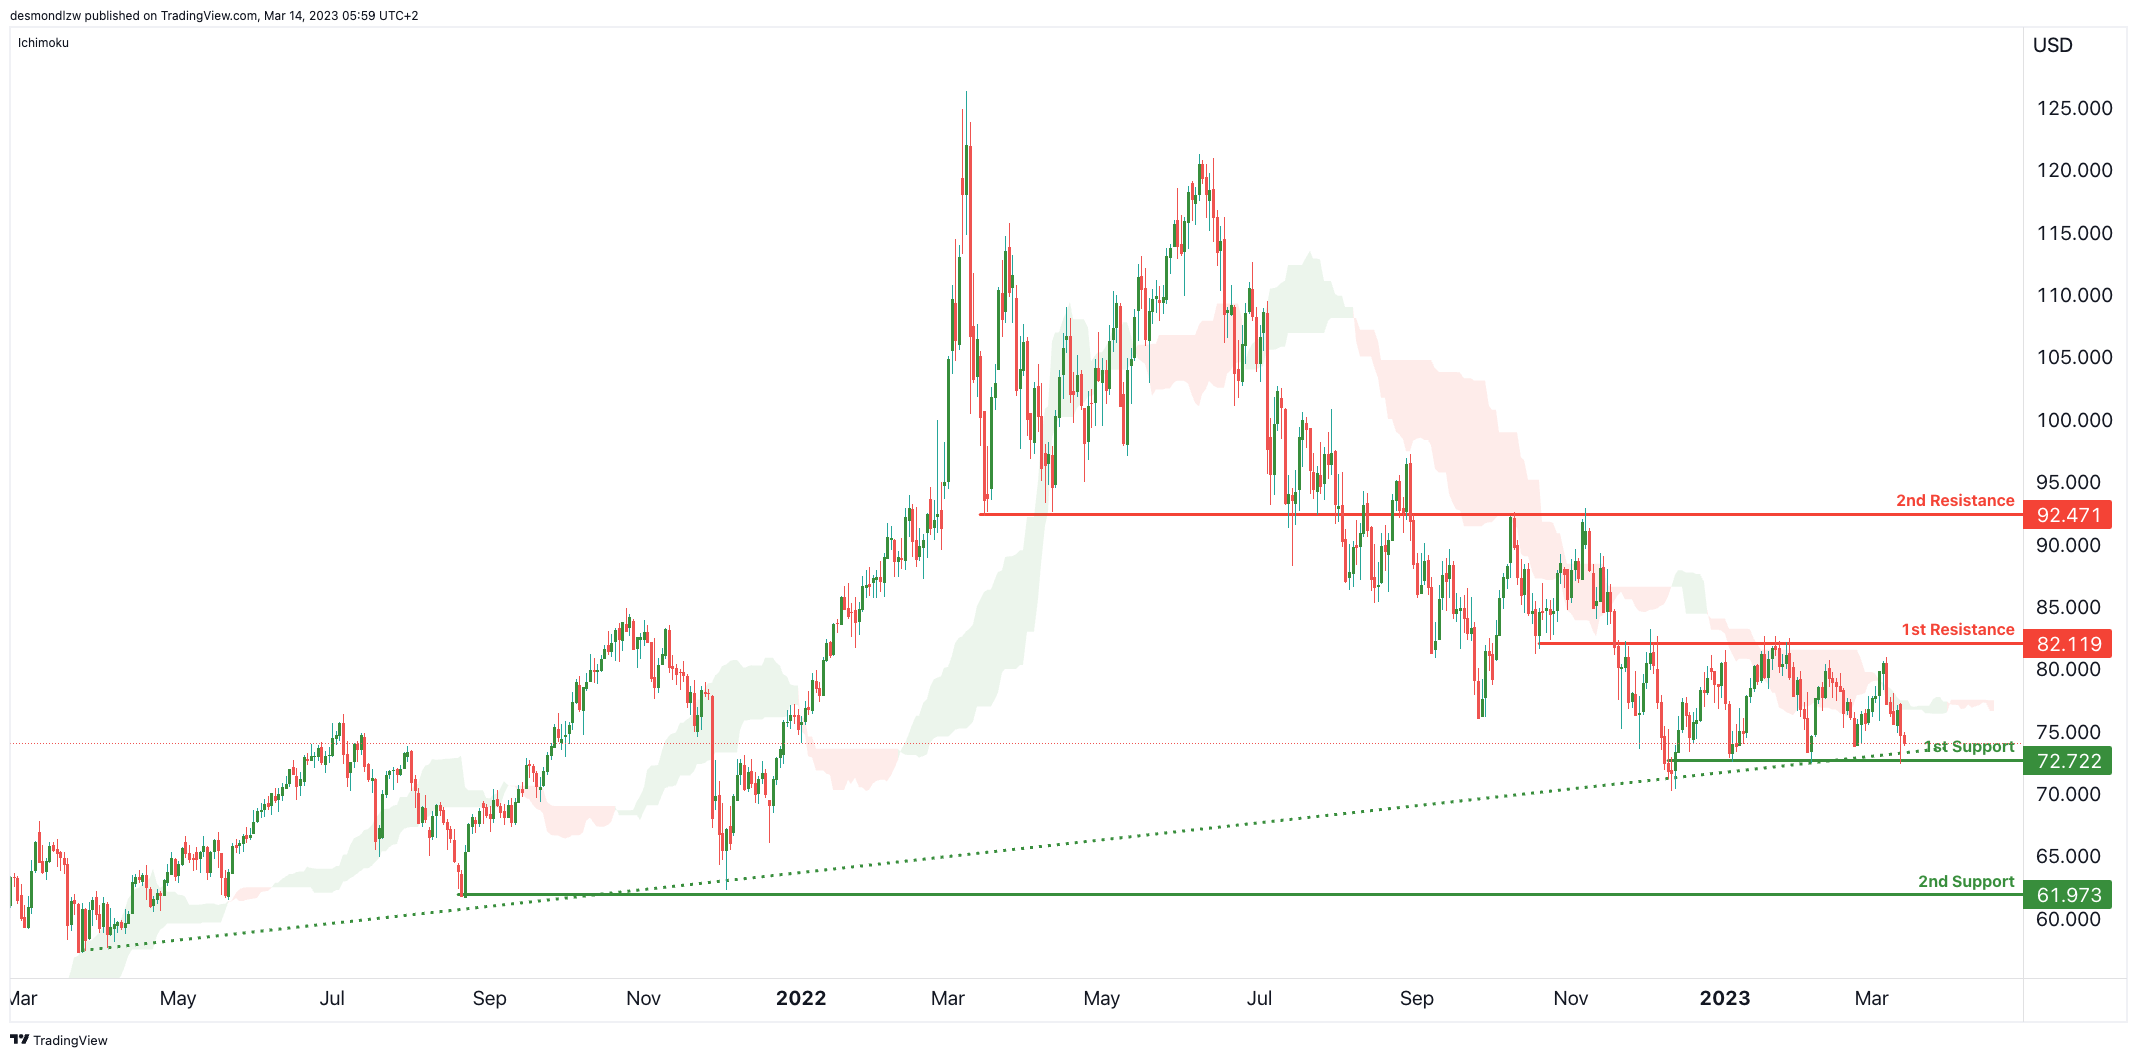
Price is respecting our ascending trendline which lines up with our 1st support level at 72.72, if price were to bounce from this level, it could push up to our 1st resistance at 82.119 which is an overlap resistance. Breaking that resistance, we could see a bigger move up to 2nd resistance at 92.47 which is a strong overlap resistance and 50% Fibonacci retracement.
If price were to break the ascending support and our 1st support at 72.72, we could see a bigger drop to 61.97 which is a major multi-swing low support.
XAU/USD (GOLD):
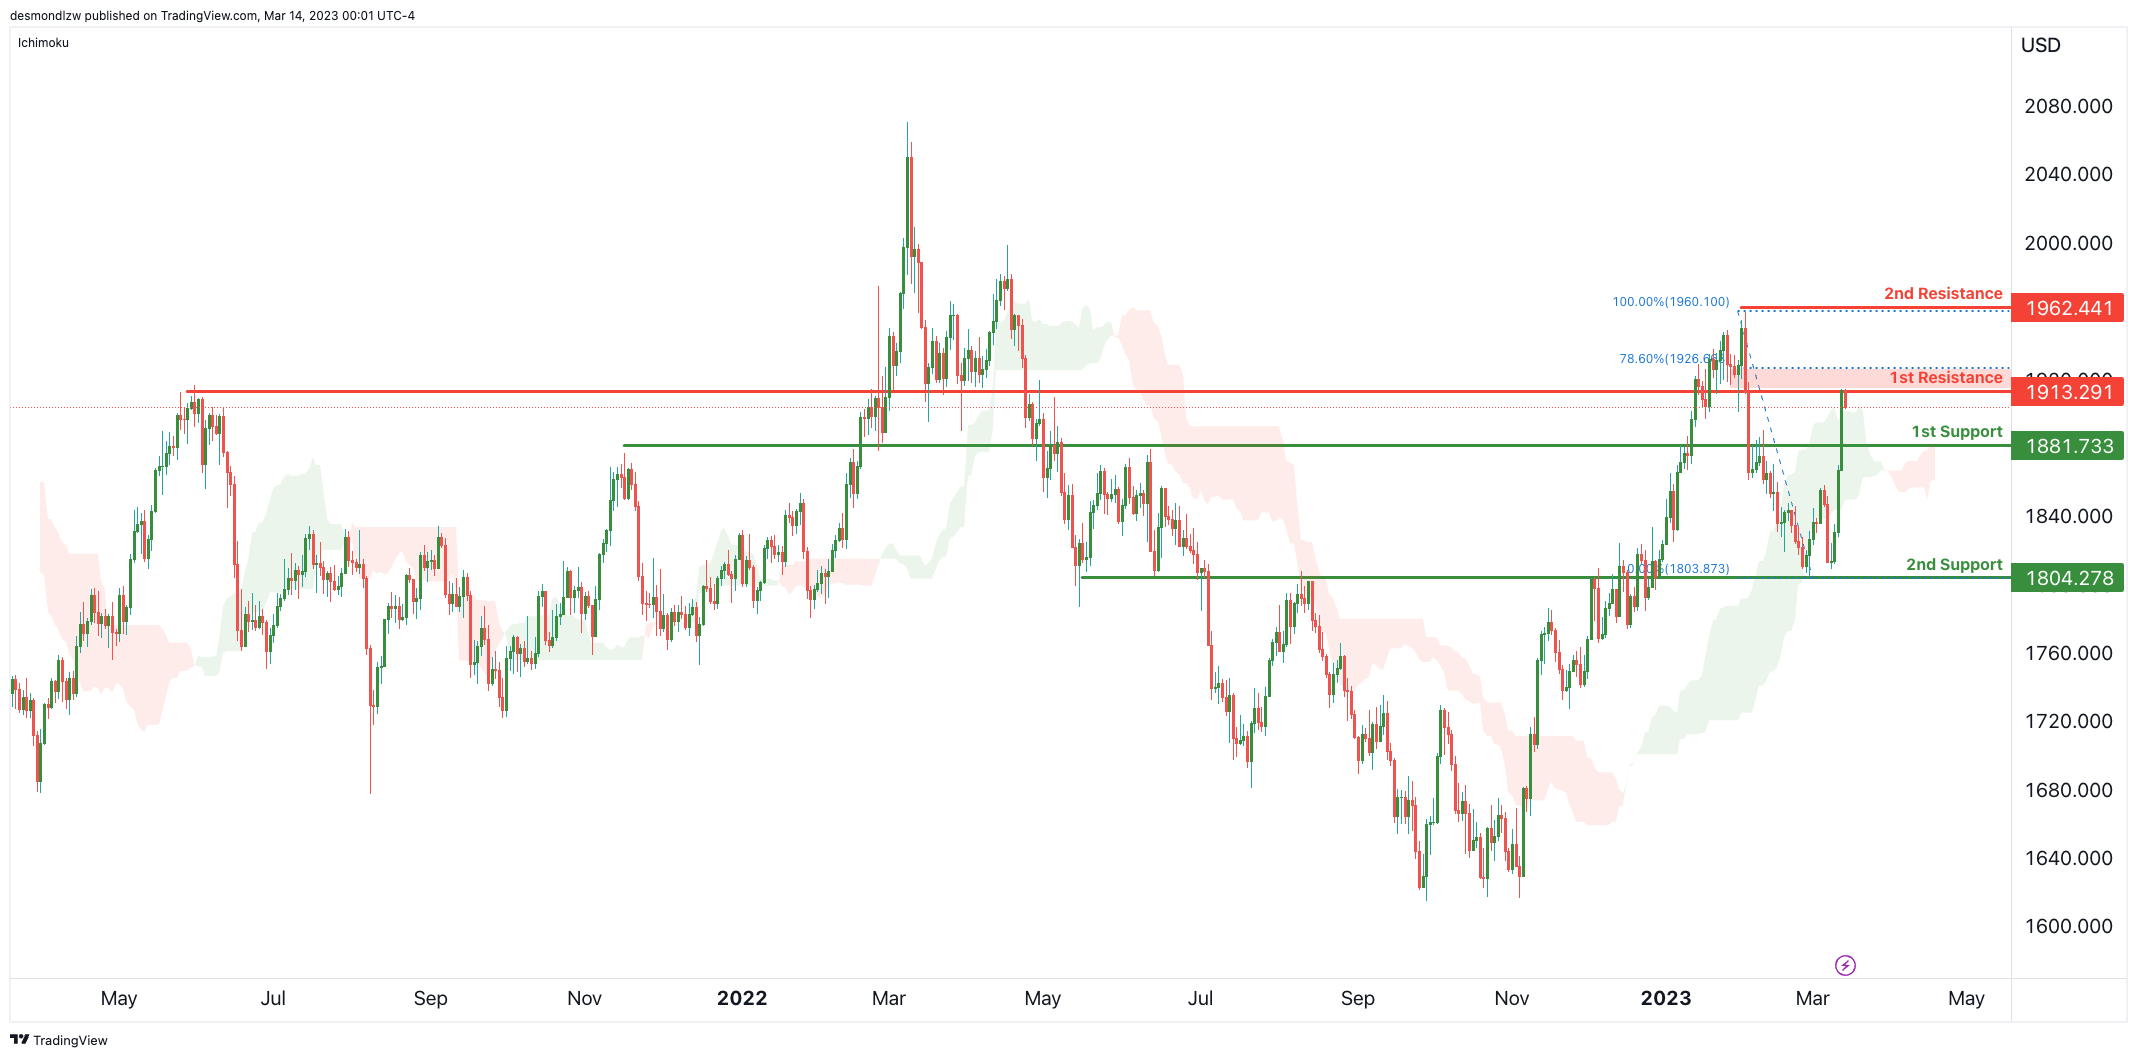
Price is now testing a major overlap resistance at 1913 which is slightly below the 78.6% short term Fibonacci retracement. A break of this level could suggest a move up to 1962 is possible – which is the recent swing high resistance.
However, a reversal from this resistance level could see support at 1881 which is also another nice overlap support – breaking this level could trigger a move down to 2nd support at 1804 which is now only an overlap support, but a Fibonacci retracement too.
US yield curve inversion unwinding quickly, imminent recession concerns
US yield curve inversion unwinding quickly, imminent recession concerns US Treasury yield has experienced a significant decline as funds continue to pour into bonds due to the collapse of Silicon Valley Bank. Overnight, the 2-year yield dropped by -0.585 to 4.030, after breaching the 4% handle. This is the worst one-day drop since the 2008 global financial crisis. The yield fell by nearly 100 basis points from Wednesday's 5.066, which was the most significant three-day decline since the 1987 market crash.
However, an even more critical development is the rapid unwinding of the yield curve inversion. Last week, the 10-year yield was more than 100 basis points below the 2-year yield. But now, it's around 50 basis points below. It's still too early to tell if the yield curve is normalizing, but recent history suggests that a recession in the US is imminent if that is the case.
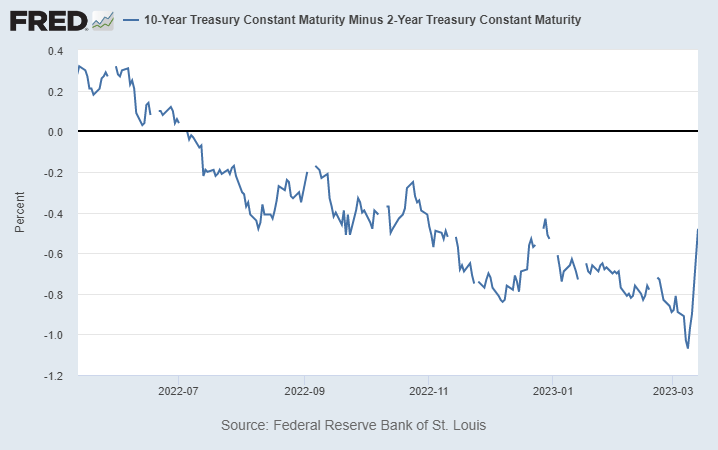
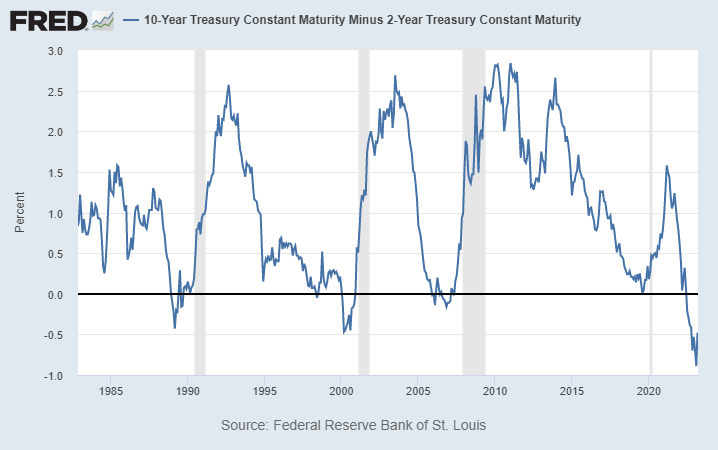
In the first example, for the 1988/90 inversion period, yield curve can be considered fully normalized in April 1990. Recession officially began in July 1990, three months later.
In the second example, for the 2000 inversion period, yield curve can be considered fully normalized in January 2001, and recession started in March 2001, three months later.
In the third example, for the 2006/2007 inversion period, yield curve can be considered fully normalized in June 2007. Recession officially started in December, six months later.
Australia NAB business confidence fell to -4, conditions down to 17
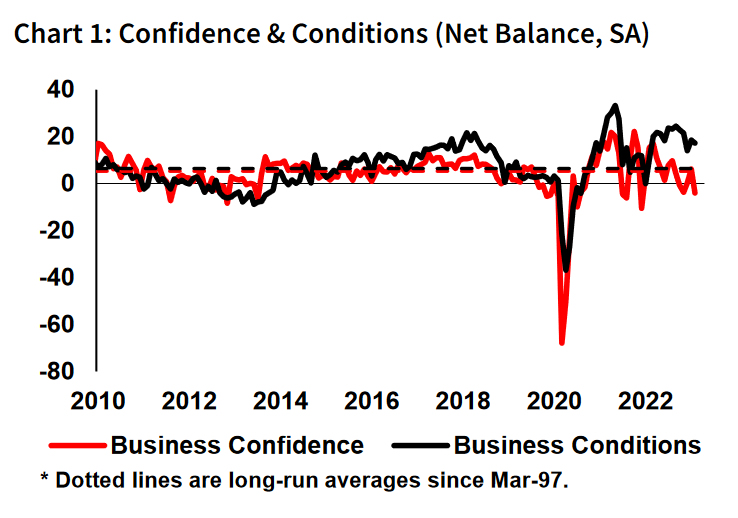
Australia NAB Business Confidence dropped sharply from 6 to -4 in February. Business Conditions dropped from 18 to 17. Looking at some details, trading conditions were unchanged at 27. Profitability conditions dropped from 18 to 14. Employment conditions rose from 11 to 12.
"Overall, the survey confirms the ongoing resilience of the economy through the first months of 2023, though we continue to expect a more material slowdown in demand later in the year when the full effect of rate rises has passed through," said NAB.
GBP/USD Aims Fresh Run To 1.2200, US CPI Next
Key Highlights
- GBP/USD recovered and surpassed the 1.2200 resistance.
- EUR/USD might extend gains and revisit 1.0800.
- The UK Claimant count could change -12.4K in Feb 2023.
- The US CPI could drop from 6.4 to 6.0% in Feb 2023 (YoY).
GBP/USD Technical Analysis
The British Pound started a strong increase from the 1.1800 zone against the US Dollar. GBP/USD broke a major hurdle near 1.1920 to move into a positive zone.
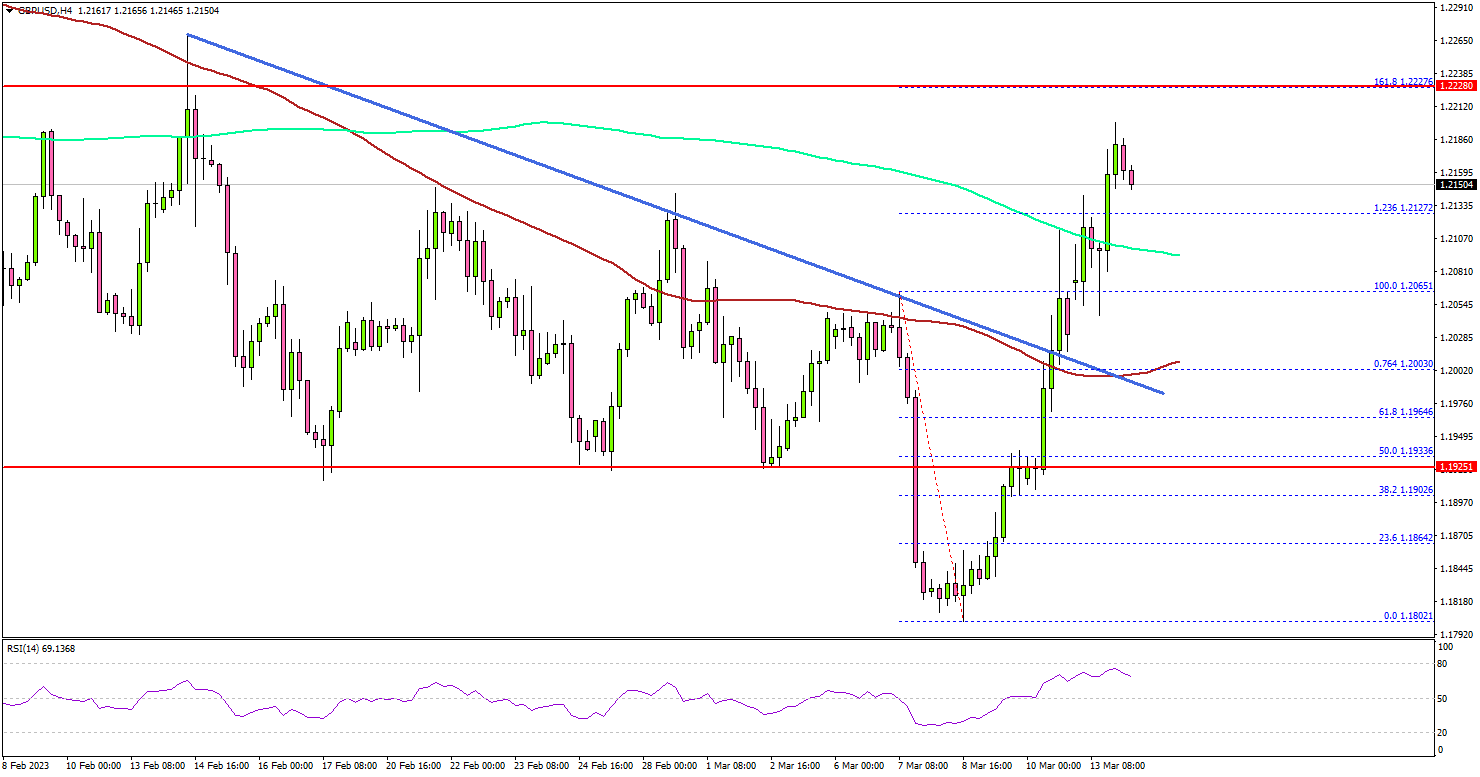
Looking at the 4-hours chart, the pair gained pace above the 1.2000 resistance and the 100 simple moving average (red, 4-hours). Besides, the pair broke a key bearish trend line with resistance near 1.2000.
The bulls even pumped the pair above the 1.2100 level and the 200 simple moving average (green, 4-hours). The pair is now trading above the 1.2120 level.
An immediate resistance is near the 1.2185 level. The next major resistance is near the 1.2220 level. It is near the 1.618 Fib extension level of the downward move from the 1.2065 swing high to 1.1802 low.
A clear move above the 1.2220 resistance might start another increase towards the 1.2320 zone. Any more gains might send the pair towards 1.2400.
On the downside, an immediate support is near the 1.2065. The next major support is near the 1.2000 level and the 100 simple moving average (red, 4-hours), below which there is a risk of a move towards the 1.1920 level.
Looking at EUR/USD, the pair is showing positive signs above the 1.0650 level and there could be more upsides towards the 1.0800 level.
Economic Releases
- UK Claimant Count Change for Feb 2023 – Forecast -12.4K, versus -12.9K previous.
- UK ILO Unemployment Rate for Jan 2023 (3M) – Forecast 3.8%, versus 3.7% previous.
- US Consumer Price Index for Feb 2023 (MoM) – Forecast +0.4%, versus +0.5% previous.
- US Consumer Price Index for Feb 2023 (YoY) – Forecast +6.0%, versus +6.4% previous.
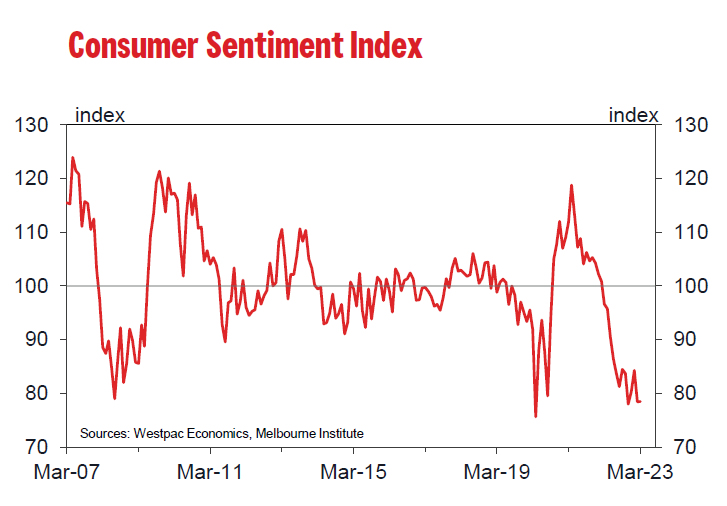
Australia Westpac consumer sentiment unchanged at 78.5, second sub-80 read in a row
Australia Westpac Consumer Sentiment Index was unchanged at 78.5 in March, a second month of extremely weak reading, near historical lows. Areas of most concern remain inflation, interest rates, and the economy.
Westpac noted that there were only one month of sub-80 reading during the COVID pandemic and the global financial crisis period. Runs of sub-80 have only been seen during the recession during the 1980s and 1990s.
Regarding RBA policy, Westpac will wait after release of data on employment, inflation, spending, and confidence, before deciding to change the expectation of a 25bps hike in April. But Westpac maintained the forecast of another 25bps hike in May.
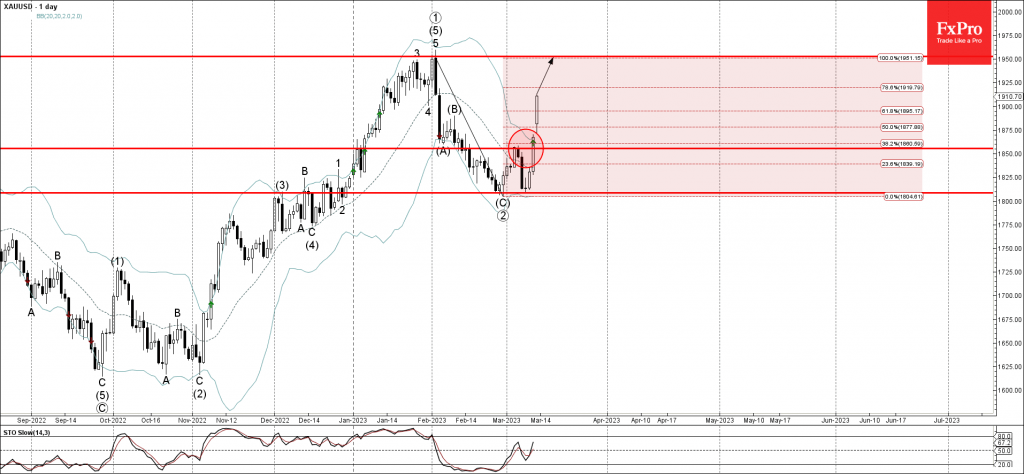
Gold Wave Analysis
- Gold broke resistance area
- Likely to rise to resistance level 1950.00
Gold recently broke the resistance area located between the resistance level 1855.00 and the 38.2% Fibonacci correction of the downward correction from the start of February.
The breakout of this resistance area accelerated the active intermediate impulse wave (1).
Gold can be expected to rise further toward the next resistance level 1950.00 (previous multi-month high from the start of February).
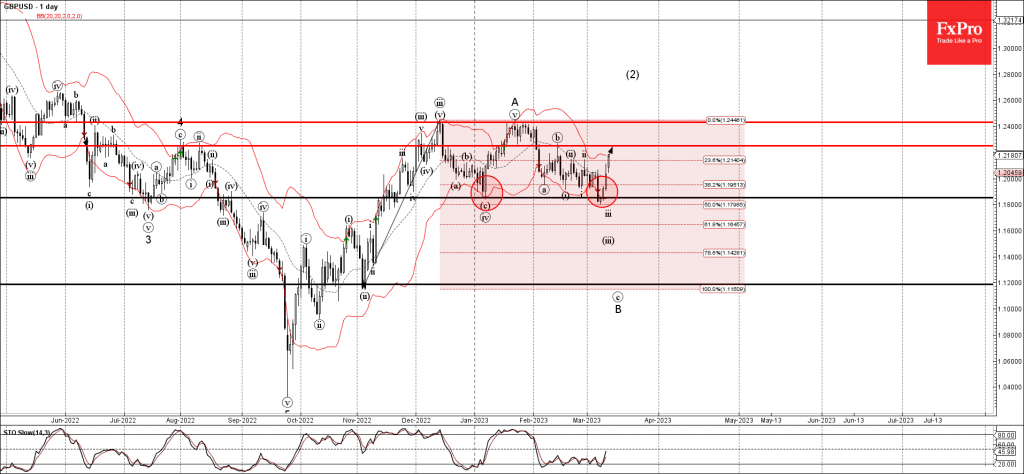
GBPUSD Wave Analysis
- GBPUSD reversed from support level 1.1855
- Likely to rise to resistance level 1.2250
GBPUSD currency pair recently reversed up from the key support level 1.1855 (previous monthly low from January) standing near the lower daily Bollinger Band and the 50% Fibonacci correction of the upward impulse from November.
The upward reversal from the support level 1.1855 created the daily candlesticks reversal pattern Morning Star.
GBPUSD can be expected to rise further toward the next resistance level 1.2250 (top of wave (b) from February).
Sunset Market Commentary
Markets
During the weekend, US authorities took steps to restore confidence in the US financial system after the collapse of Silicon Valley Bank (SVB). They included full protection for all depositors of SVB (and Signature Bank). At the same time, the Federal Reserve, with the backing of the Treasury, put in place a new ‘Bank Term Funding Program’ to provide 1-year funding for banks at less tight collateral conditions (full face value). Similar collateral requirements now also apply for the discount window. Despite the action from the US authorities, markets today again are trading extremely volatile as investors continue to ponder the consequences post SVB in terms of financial stability, the impact on the economy and the impact on Fed/CB policy going forward. At a time of market panic, it’s always difficult to assess what part of a move is due to a ‘simple’ defensive run for safety or to what extent investors are really changing expectations on central bank policy going forward. Whatever the explanation, US yields today additionally lose between 50 bps (2-y) and 15 bps (10-y)!!! Compared to Wednesday evening US 2-year yield has lost about 100 bps. The US 10-y yield ceded about 55 bps. Markets currently hardly discount one additional 25 bps Fed hike anymore. In Europe, German yields are tumbling between 53 bps (2-y) and 23 bps (30-y). Cumulative declines currently amount to 75+ bps for the 2-y yield (since Wednesday) and 55 bps for the German 10-y yield (compared to March 2 peak). Despite very explicit ECB guidance of late, market now also see an almost even chance on 50 bps or 25 bps ECB rate hike later this week. The expected peak in the ECB deposit rate has been reduced to about 3.15% down from 4.0%+ levels recorded mid last week. Markets obviously are solely focused on financial stability risks when assessing CB’s reaction function. Interesting to see whether this might change tomorrow when the US inflation data will be published. This morning, US equity futures initially reacted positively to the measures announced during the weekend. Sentiment deteriorated as the European trading session proceeded. The Euro Stoxx 50 at some point lost 3.5%+ (currently -3.0%). US equities also opened in red, but currently try to return in green with financials still feeling most of the strain. (Brent) oil dropped further to test the $80 p/b level. The combination of a sharp decline in core yields and an aggressive risk-off sentiment propels gold to the strongest level since early February ($1908 p/oz).
On FX markets, the dollar still doesn’t profit from the overall risk-off environment as the focus remains on US financial stability. Major USD cross rates showed substantial intraday swings. DXY hovers near the 103.75 area. EUR/USD after a strong open and a temporary intra-day dip, currently trades near the 1.07 big figure. The yen outperforms, against the dollar (USD/JPY 133 from a close on Friday near 135), but also against the euro (EUR/JPY 142.5 from 143.7). The Swiss franc also again enjoys as strong safe have bid, but EUR/CHF (0.974) at the lowest level since mid-October last year. Smaller less liquid currencies are fighting an uphill battle. EUR/SEK (10.43) intraday touched an new post-corona top. EUR/NOK also reached the highest level since May 2020. Among the CE currencies, the forint suffers most, with EUR/HUF returning to the 390 area. The Czech koruna eases to the 23.73 area. The zloty outperforms the region holding little changed near 4.685. Sterling also held relatively strong with EUR/GBP even easing slightly to 0.882.News Headlines
CNB vice governor Eva Zamrazilova said Czech interest rates will have to stay above neutral for longer than initially expected so that inflation doesn’t flare up again. She added that she doesn’t agree with the idea that when inflation returns to target, the CNB can go back to the decade-old policy of low interest rates. Czech money markets for a long time agreed but started pricing in faster rate cuts over the previous days amid heightened volatility in the wake of the SVB collapse. A first cut is anticipated in early Q3. The Czech crown, together with regional peers, is under pressure today. EUR/CZK advances from a Friday close at 23.64 to 23.74 currently.
XAU/USD: Gold Surges Above $1900 On Growing Uncertainty
Gold surged above $1900 mark on Monday and hit its highest since early February, as growing uncertainty after collapse of Silicon Valley Bank and subsequent downgrade in expectations about the size of Fed’s next rate hikes, prompted investors out of dollar, boosting yellow metal’s safe-haven appeal.
Markets became increasingly worried that collapse of SVB may spark a chain reaction, as banking sector seems to be hurt by rising borrowing cost more than estimated, despite the US President Biden, in his speech today, declared that the US baking system is safe, after the collapse of Silicon Valley Bank and Signature Bank in New York.
Immediate measures taken by government to protect bank customers and save their deposits and President Biden’s promises that American banking system is safe, and regulators are going to apply new and stricter rules, did not fully convince investors, which fled into safety in the highly uncertain conditions.
Gold price is in steep ascend for the third straight day, after the dollar was initially dented by speculations about Fed’s coming action and further pressured by last Friday’s US labor report and SVB collapse.
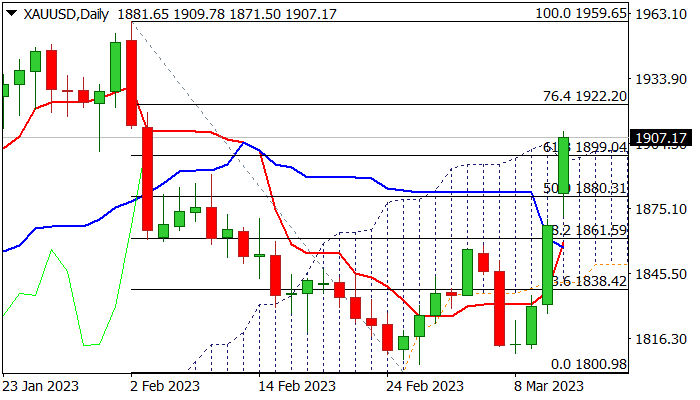
Fresh bullish acceleration on Monday further improved the structure of daily technical studies, as positive momentum is gaining pace, moving averages are in bullish setup and strong bullish signal was generated on break through very significant $1900 barrier (psychological / Fibo 61.8% of $1959/$1800 / top od daily Ichimoku cloud).
In addition, completion of bullish failure swing pattern on daily chart contributed to positive signals.
Daily close above $1900 level is needed to confirm bullish stance and signal further advance of metal’s price, mainly driven by fundamentals.
Bulls eye immediate target at $1922 (Fibo 76.4%) the last obstacle en-route to key barrier at $1959 (2023 high, posted on Feb 2).
Meanwhile, bulls may take a breather after strong rally, as daily studies are overbought, and traders are focusing on Tuesday’s release of the US Feb inflation report.
Res: 1909; 1923; 1929; 1949.
Sup: 1900; 1882; 1866; 1856.