

Sample Category Title
GBP/USD Seeks Support
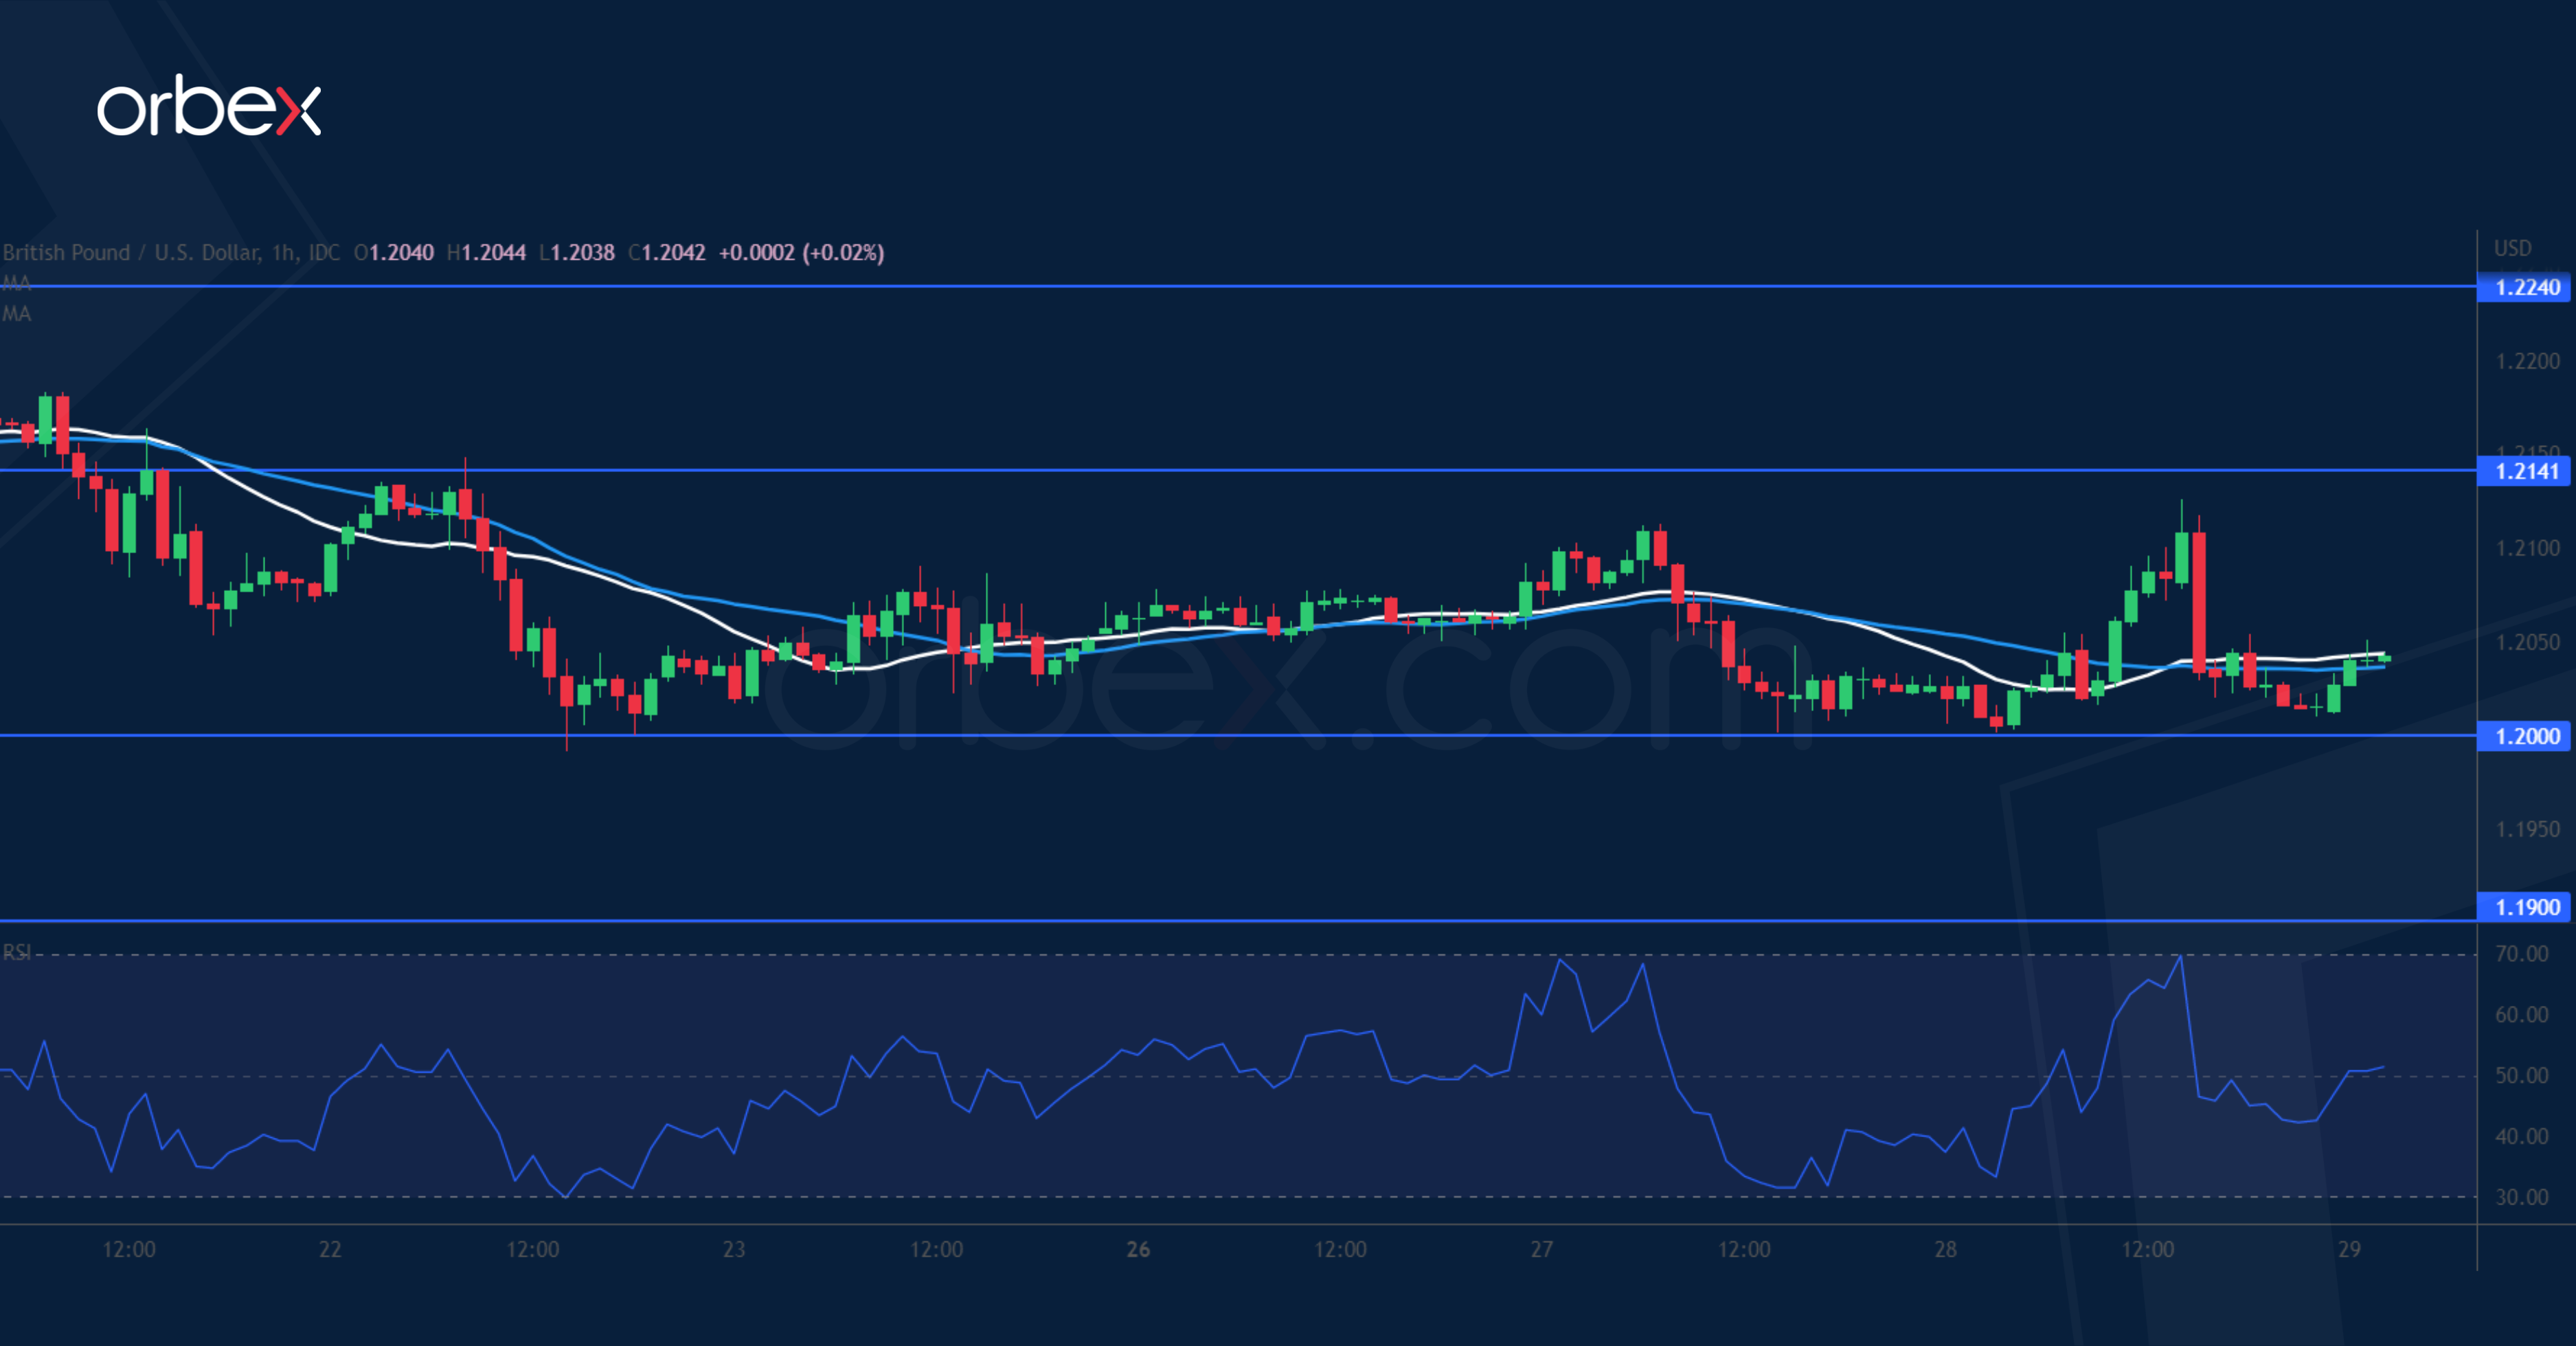
The pound struggles as market sentiment remains cautious with thin liquidity. The pair is still looking to hold onto its gains after clearing last August’s high of 1.2280. Even though short-term buyers have bailed out, the psychological level of 1.2000 has seen an inflow of buying interests. But only a close above 1.2140 would signal confidence in Sterling and help turn the market mood around. 1.1190 is a critical level to keep the directional bias upward in the weeks to come, and its break could trigger a deeper correction.
FTSE 100 to Close the Year in the Positive, While S&P500 Lost a Fifth of its Value
The good news with China’s reopening is that it should boost global growth.
The bad news with China’s reopening is that it will not only boost global growth, but also energy and commodity prices - hence inflation, the interest rate hikes from central banks and potentially the global Covid cases – which could then give birth to a new, and a dangerous Covid variant, which would, in return, bring the restrictive Covid measures back on the table, and hammer growth.
Note that the reasoning stops here right now, the risky markets are painted in the red, but we could eventually go one step further and say that if the Chinese reopening hits the global health situation – hence the economy badly, the central banks could become softer on their rate hike strategies. But no one is cheery enough to see silver lining anywhere.
This year really needs to end, now!
So, Wednesday was marked by further selloff across European and US markets. The S&P500 slid 1.20% and closed below the 50% Fibonacci retracement on the latest rally. The index gave back half of gains collected from October to November. Trend and momentum indicators, and more importantly market sentiment remain supportive of a deeper dive to meet the major 61.8% Fibonacci retracement, at 3724 mark.
Likewise, Nasdaq lost another 1.32%, and the dips don’t look like anyone wants to grab them right now.
In Europe, the DAX struggles to keep its head above the 50-DMA, near 13925.
Across the Channel, despite political shenanigans and Brexit’s knock-on effects, high inflation and the cost-of-living crisis, Britain’s 100 biggest companies are preparing to close the year with small gains, while the S&P500 has lost more than a fifth of its value.
Why?
First, the British companies had to compensate for the weakening sterling this year – but that’s also true for the DAX, for example, but the DAX is also preparing to end the year around 15% lower. So, it’s not only an FX story.
Second, and the most relevant, the fact that the FTSE 100 is heavily crowded in energy and mining stocks is what made the FTSE 100 perform so well this year. The two biggest market caps in the index, which make up to 20% of the index, Antofagasta and Fresnillo – both mining stocks, are preparing to close the year in the positive.
Antofagasta is up by 20% ytd, while Fresnillo, which is a goldminer and suffered from subdued gold prices this year is still up by 6% a day before the trading year ends.
Other energy companies like BP and Shell are up by 40%.
Plus, British big caps make most of their revenues in terms of US dollars; a good thing for a year when sterling lost up to 23% against the greenback at some point and is still down around 10% right now.
And I believe that the FTSE 100’s outperformance could stretch into the new year. If the Chinese reopening brings along another bump in inflation due to higher energy and commodity prices, the FTSE 100 could continue offering a good shelter to those willing to hedge against an energy-led global inflation to temper the negative effects.
Of course, the biggest British companies do not reflect the underlying British economy, so the FTSE 100’s good performance won’t change the fact that smaller, and domestic focused companies will likely continue to suffer from high inflation, recession and perhaps another year of political turmoil as a cherry on top.
EUR/USD Daily Outlook
Daily Pivots: (S1) 1.0588; (P) 1.0632; (R1) 1.0656; More...
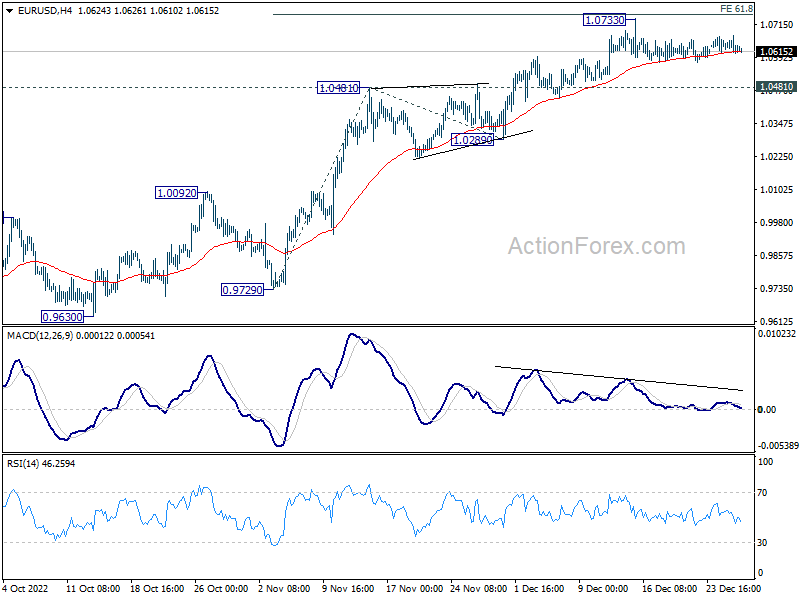
No change in EUR/USD's outlook as consolidation is extending. Further rally is expected as long as 1.0481 resistance turned support holds. Firm break of 61.8% projection of 0.9729 to 1.0481 from 1.0289 at 1.0754 will pave the way to 100% projection at 1.1041. However, firm break of 1.0481 will confirm short term topping and bring deeper fall to 1.0289 support.
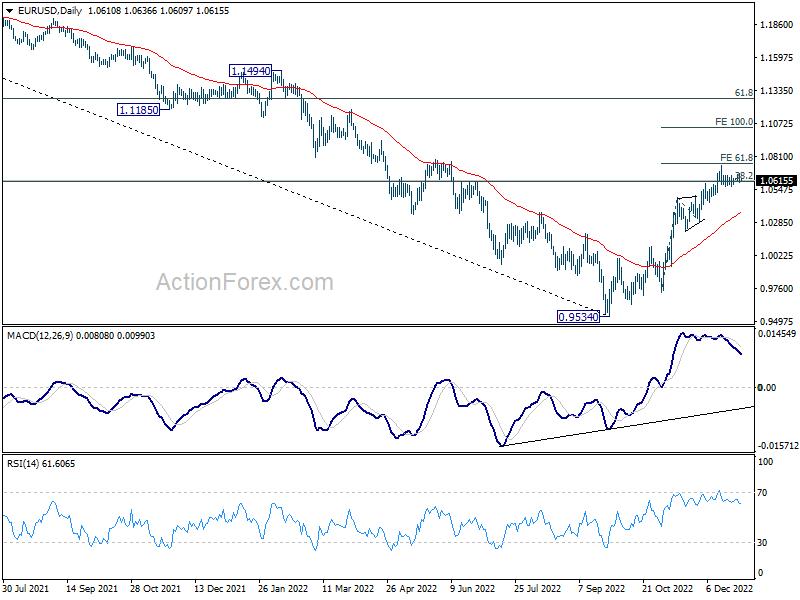
In the bigger picture, focus stays on 38.2% retracement of 1.2348 (2021 high) to 0.9534 at 1.0609. Rejection by 1.0609 will suggest that price actions from 0.9534 medium term bottom are developing into a corrective pattern. Thus, medium bearishness is retained for another fall through 0.9534 at a later stage. However, sustained break of 1.0609 will raise the chance of trend reversal and target 61.8% retracement at 1.1273.
GBP/USD Daily Outlook
Daily Pivots: (S1) 1.1973; (P) 1.2049; (R1) 1.2096; More...
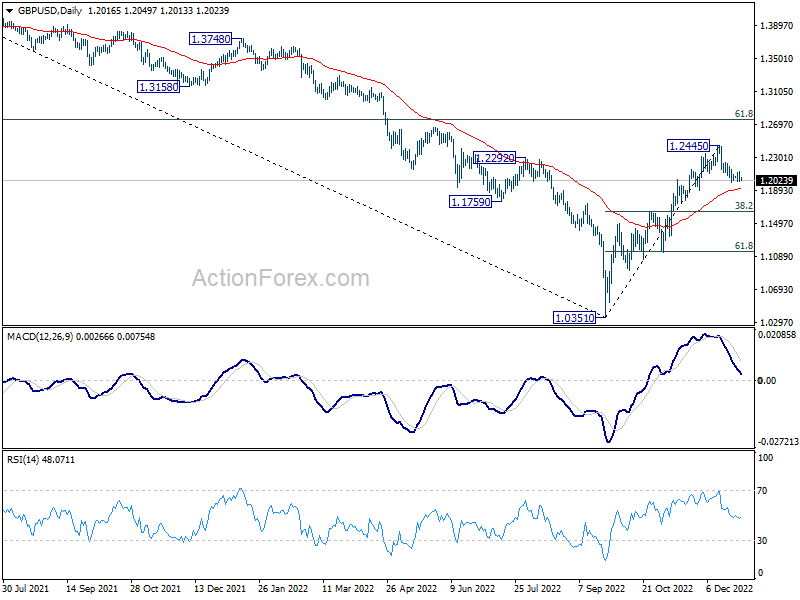
Intraday bias in GBP/USD stays neutral at this point. On the downside, break of 1.1991 will resume the fall from 1.2445 to 55 day EMA (now at 1.1916). Firm break there will target 38.2% retracement of 1.0351 to 1.2445 at 1.1645. On the upside, break of 1.2240 minor resistance will turn bias back to the upside for retesting 1.2445 instead.
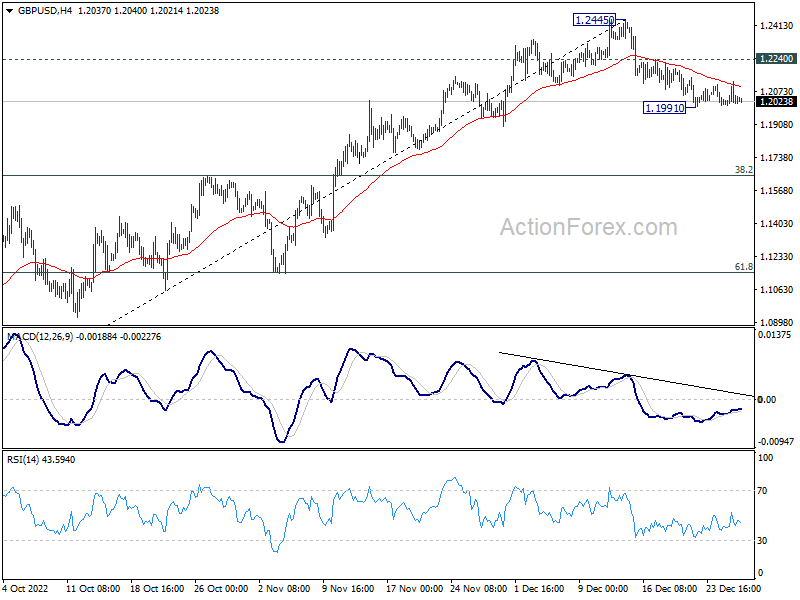
In the bigger picture, rise from 1.0351 medium term bottom is at least correcting whole down trend from 1.4248 (2021 high). Further rise is expected as long as 1.1644 resistance turned support holds. Next target is 61.8% retracement of 1.4248 to 1.0351 at 1.2759. Sustained break there will pave the way back to 1.4248. This will remain the favored case as long as 55 day EMA (now at 1.1916) holds.
USD/CHF Daily Outlook
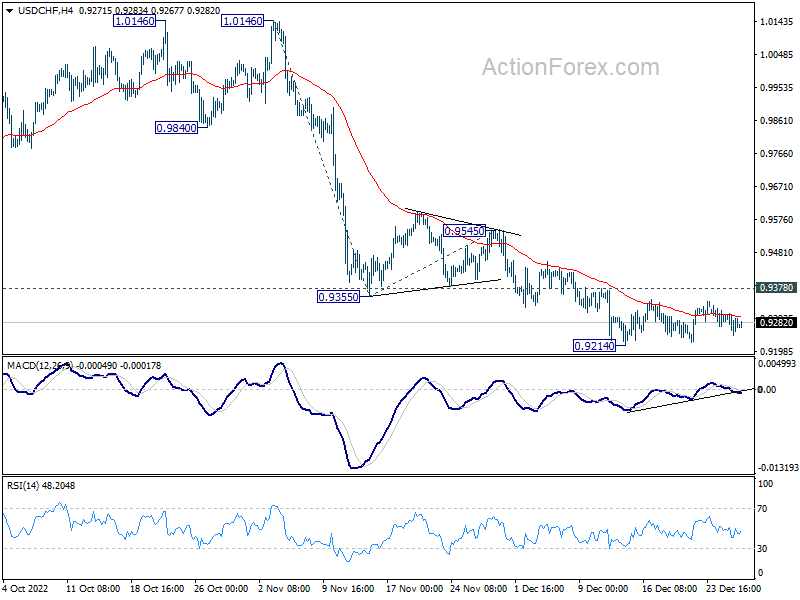
Daily Pivots: (S1) 0.9254; (P) 0.9281; (R1) 0.9315; More...
Intraday bias in USD/CHF remains neutral as range trading is still in progress. Further decline is in favor with 0.9378 resistance intact. On the downside, break of 0.9214 will resume the fall and target 61.8% projection of 1.0146 to 0.9355 from 0.9545 at 0.9056. However, break of 0.9378 resistance will indicate short term bottoming and turn bias back to the upside for 0.9545 resistance instead.
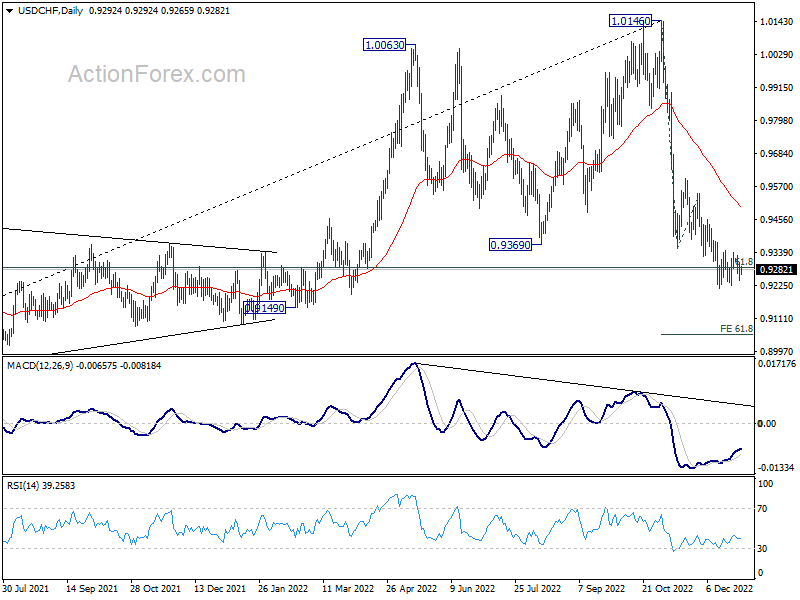
In the bigger picture, rise from 0.8756 (2021 low) has completed at 1.0146, well ahead of 1.0342 long term resistance (2016 high). Based on current downside momentum, fall from 1.0146 might be a medium term down trend itself. Sustained break of 61.8% retracement of 0.8756 to 1.0146 at 0.9287 will pave the way to 0.8756. In any case, risk will stay on the downside as long as 0.9545 resistance holds.
USD/CAD Daily Outlook
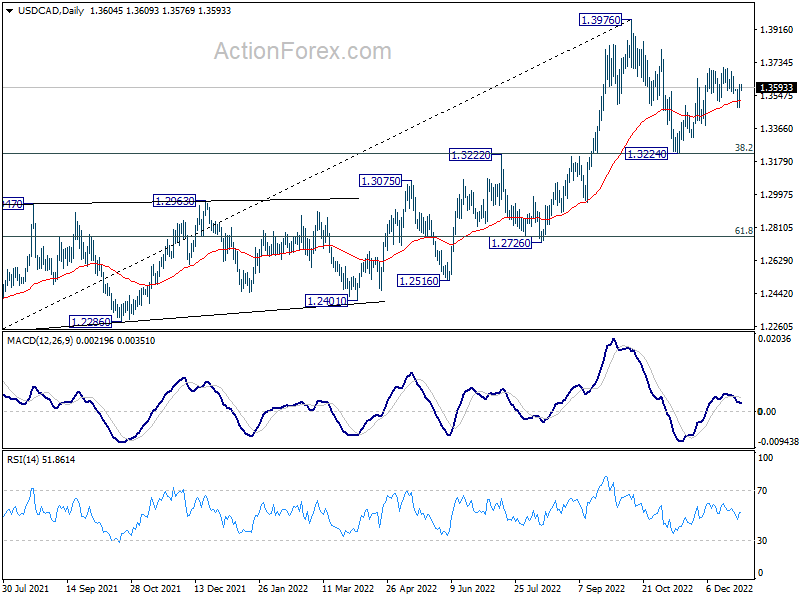
Daily Pivots: (S1) 1.3524; (P) 1.3568; (R1) 1.3650; More....
USD/CAD recovered quickly after dipping to 1.3483 and intraday bias is turned neutral first. On the upside, break of 1.3704 will resume the rebound form 1.3224 to retest 1.3976 high. On the downside, break of 1.3483 will turn bias back to the downside for 1.3224 support zone.
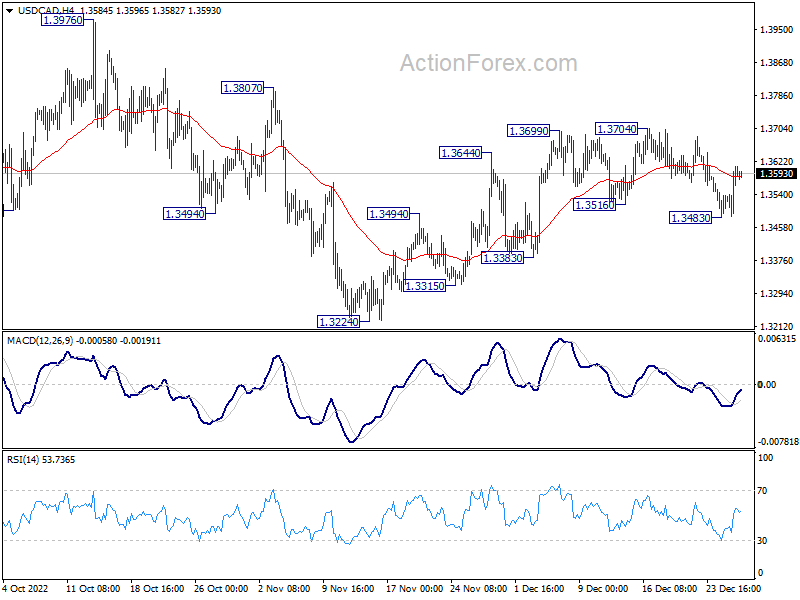
In the bigger picture, as long as 1.3222 cluster support (38.2% retracement of 1.2005 to 1.3976 at 1.3223) holds, larger up trend from 1.2005 (2021 low) is still expected to resume through 1.3976 high at a later stage. However, firm break of 1.3222/3 will indicate that the trend might have reversed. Deeper fall would be seen to next cluster support at 1.2726 (61.8% retracement at 1.2758).
Technical Outlook and Review
USD/JPY:
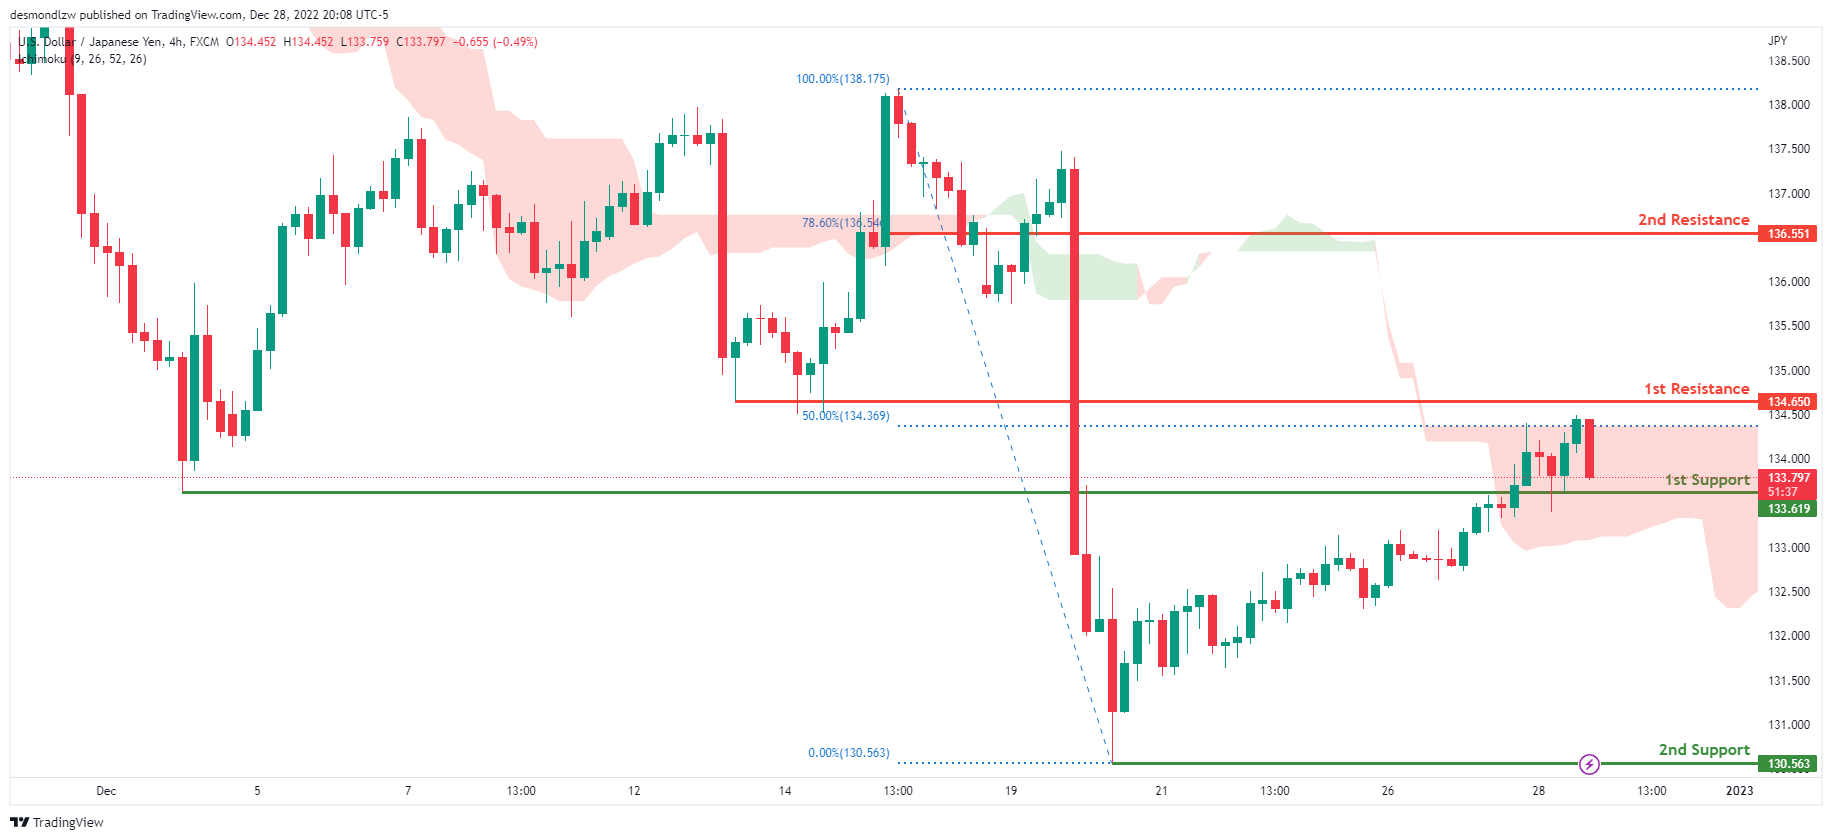
Looking at the H4 chart, my overall bias for USDJPY is bearish due to the current price crossing below the Ichimoku cloud, indicating a bearish market. If this bearish momentum continues, expect price to possibly break the 1st support at 133.619, where the previous swing low is located, before heading towards the 2nd support at 130.563, where the previous swing low is. In an alternate scenario, price could possibly head back up towards the 1st resistance level at 134.650 where the 50% Fibonacci line is.
Areas of consideration:
- H4 time frame, 1st resistance at 134.650
- H4 time frame, 1st support at 133.619
- H4 time frame, 2nd support at 130.563
DXY:
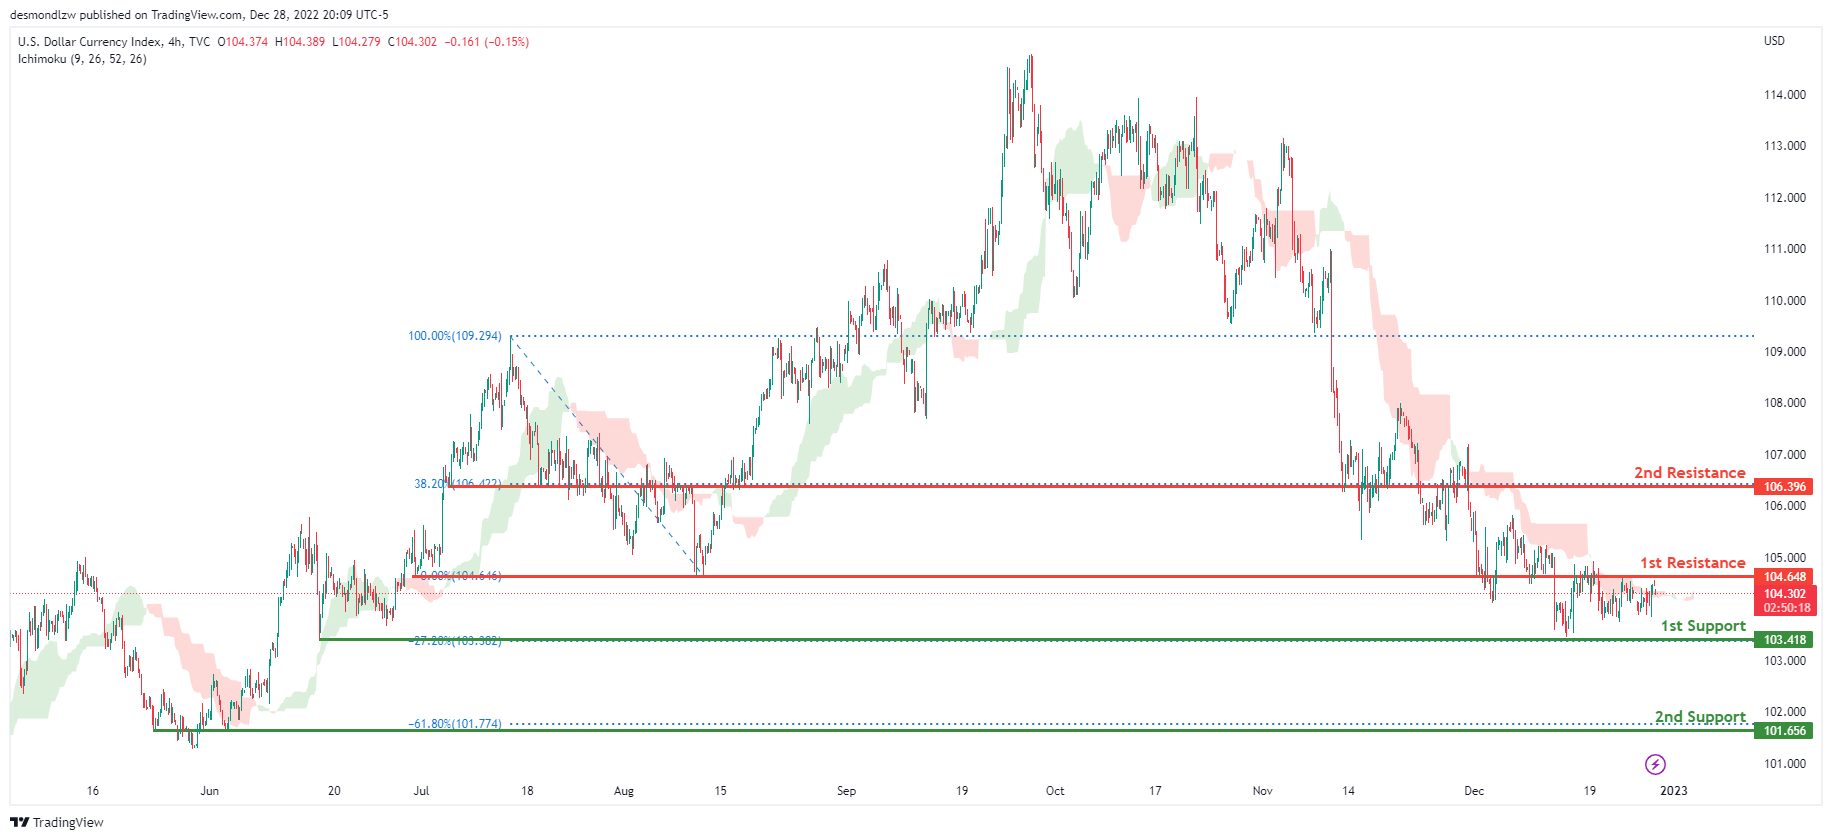
On the H4 chart, the overall bias for DXY is bearish. To add confluence to this, the price is below the Ichimoku cloud which indicates a bearish market. If this bearish momentum continues, expect the price to possibly break the 1st support line at 103.418, where the -27.2% Fibonacci expansion line is before heading towards the 2nd support at 101.656, where the -61.8% Fibonacci expansion line is. In an alternative scenario, price could head back up and break the 1st resistance line resistance at 104.648, where the previous swing low is before heading towards the 2nd resistance at 106.396, where the 38.2% Fibonacci line is.
Areas of consideration:
- H4 time frame, 1st resistance at 104.648
- H4 time frame, 1st support at 103.418
- H4 time frame, 2nd support at 101.656
EUR/USD:
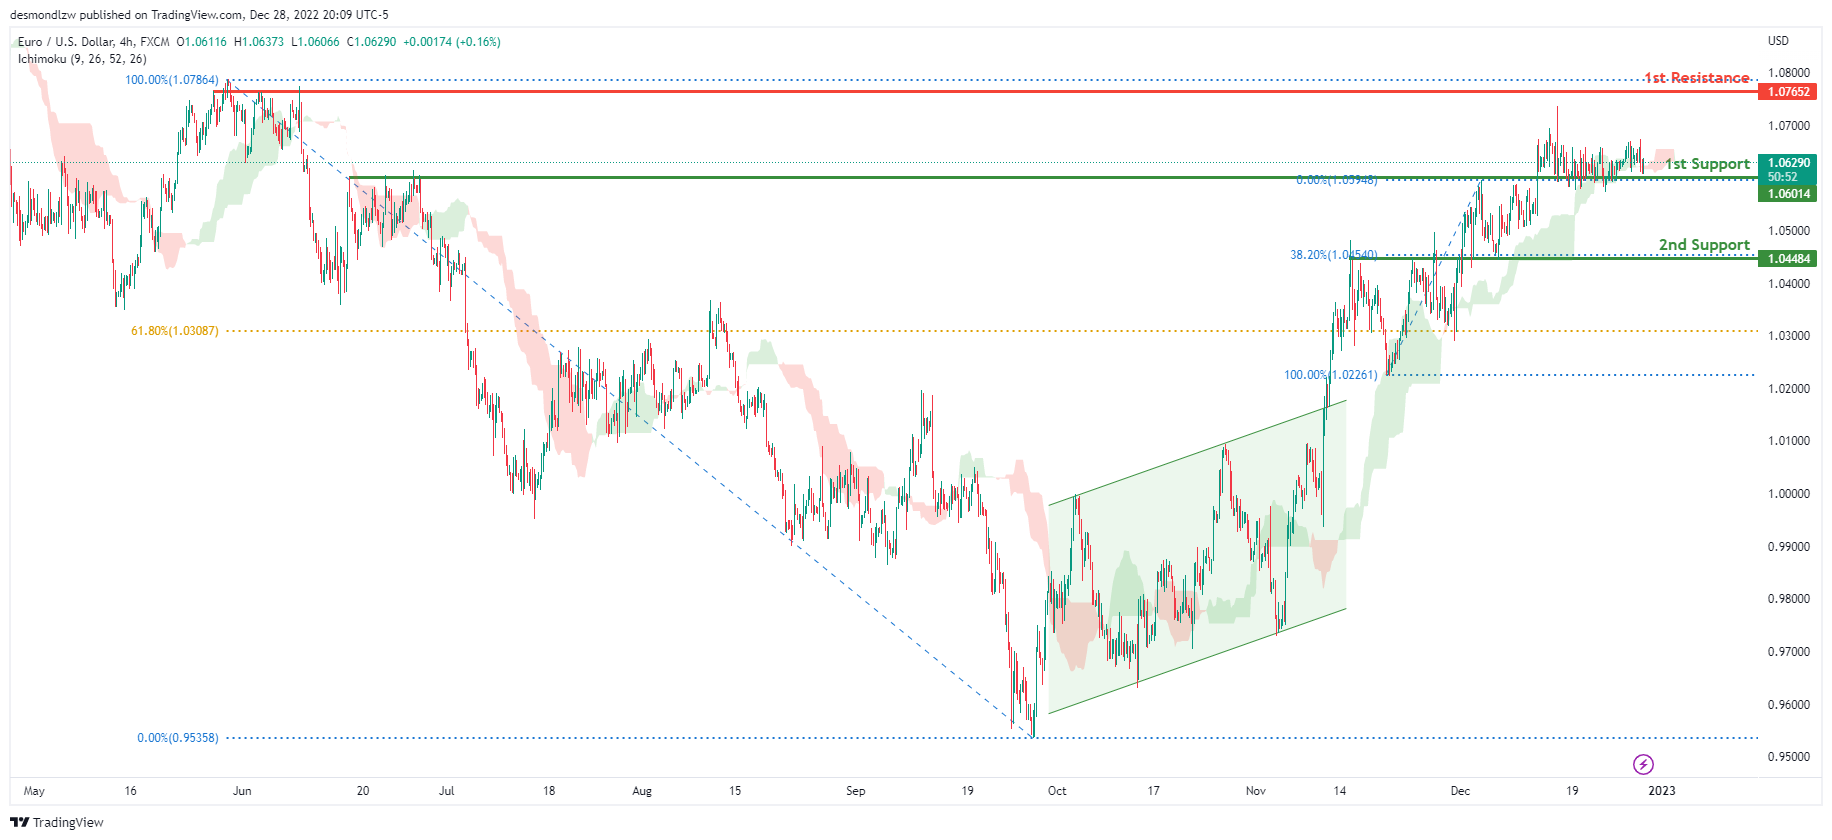
Looking at the H4 chart, my overall bias for EURUSD is bullish due to the current price being above the Ichimoku cloud, indicating a bullish market. To add confluence to this bias, price has also broken above the ascending bullish channel. If this bullish momentum continues, expect the price to possibly head towards the 1st resistance at 1.07652, where the previous swing high is. In an alternate scenario, price could possibly head back down to break the 1st support level at 1.06014, where the previous swing high and 78.6% Fibonacci line are located before heading towards the 2nd support at 1.04484, where the 38.2% Fibonacci line is.
Areas of consideration :
- H4 1st resistance at 1.07652
- H4 1st support at 1.06014
- H4 2nd support at 1.04484
GBP/USD:
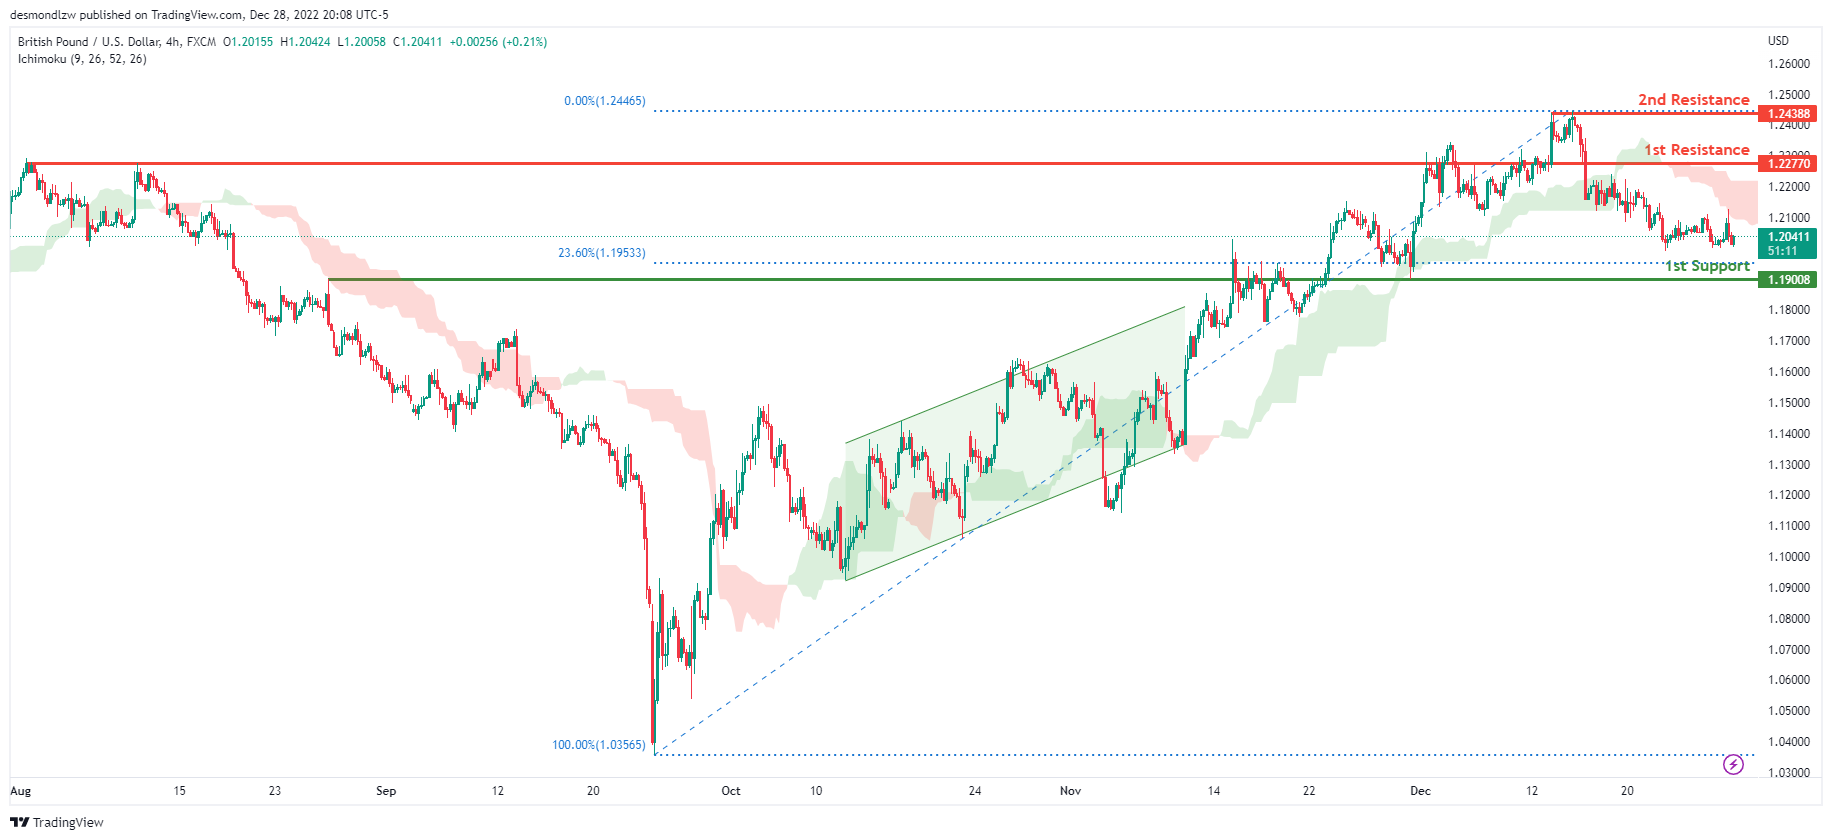
Looking at the H4 chart, my overall bias for GBPUSD is bearish due to the current price being below the Ichimoku cloud, indicating a bearish market. If this bearish momentum continues, expect price to possibly continue heading towards the 1st support at 1.19008, where the 23.6% Fibonacci line is. In an alternate scenario, price could possibly head back up to retest the 1st resistance level at 1.22770, where the previous swing high is.
Areas of consideration:
- H4 1st resistance at 1.22770
- H4 1st support at 1.19008
USD/CHF:
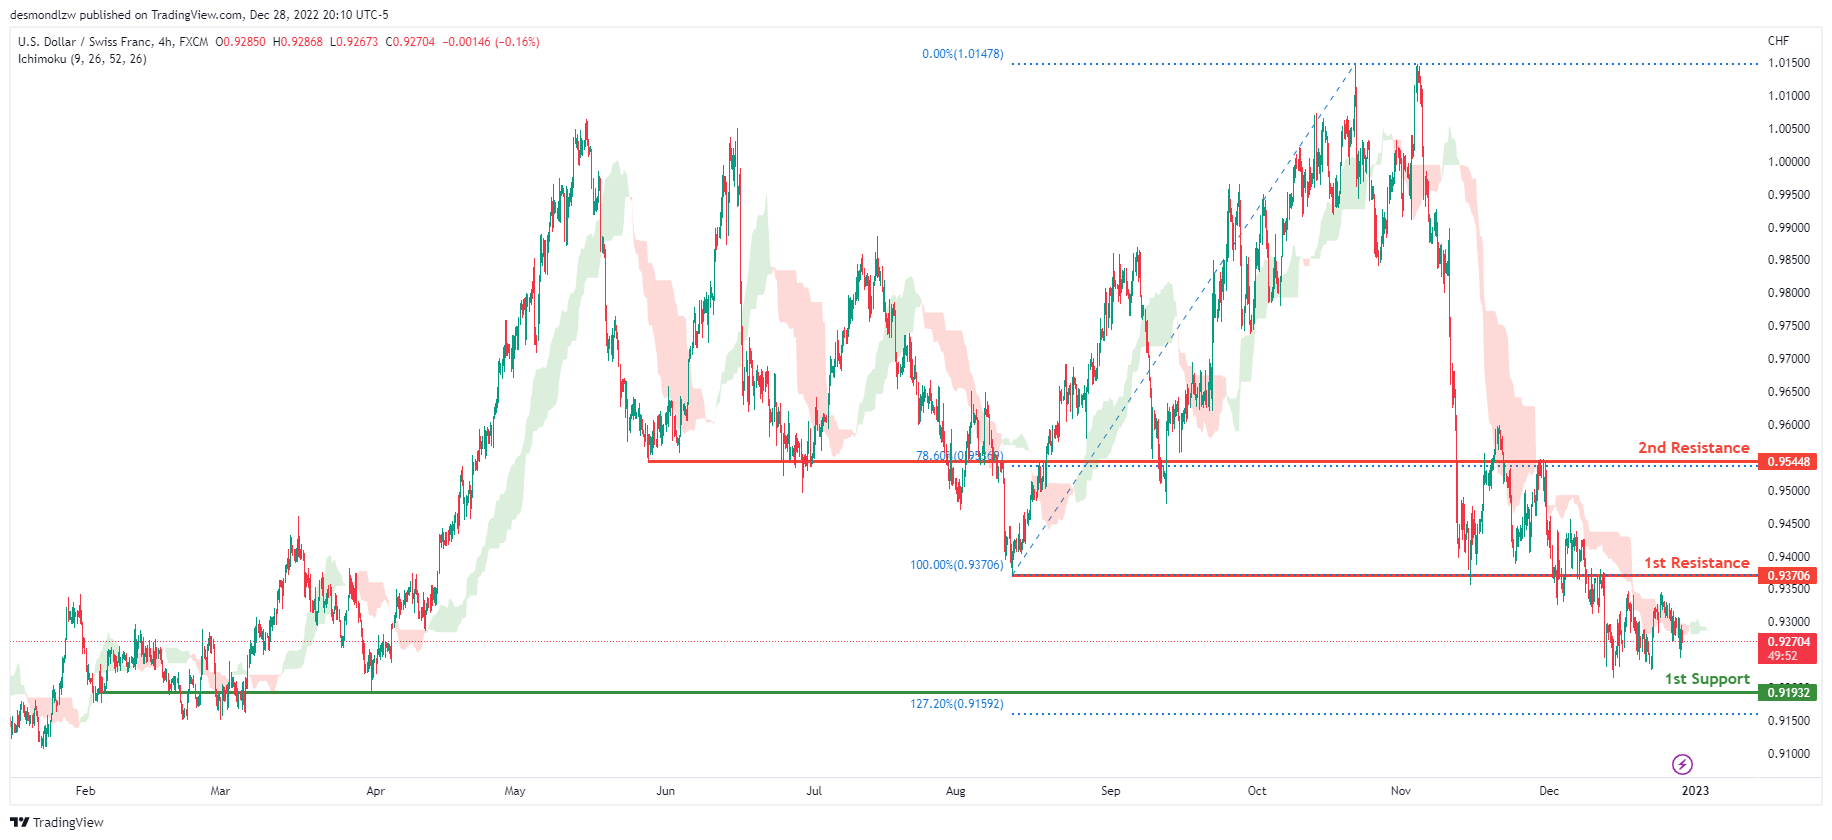
The overall bias for USDCHF on the H4 chart is bearish. In addition, the price is crossing below the Ichimoku cloud, indicating a bearish market. If the current bearish trend continues, expect the price to head back down towards the 1st support line at 0.91932, where the previous swing low and 12.72% Fibonacci extension line is . In an alternative scenario, price could possibly head up towards the 1st resistance at 0.93706, where the previous swing low is .
Areas of consideration
- H4 1st support at 0.91932
- H4 1st resistance at 0.93706
XAU/USD (GOLD):
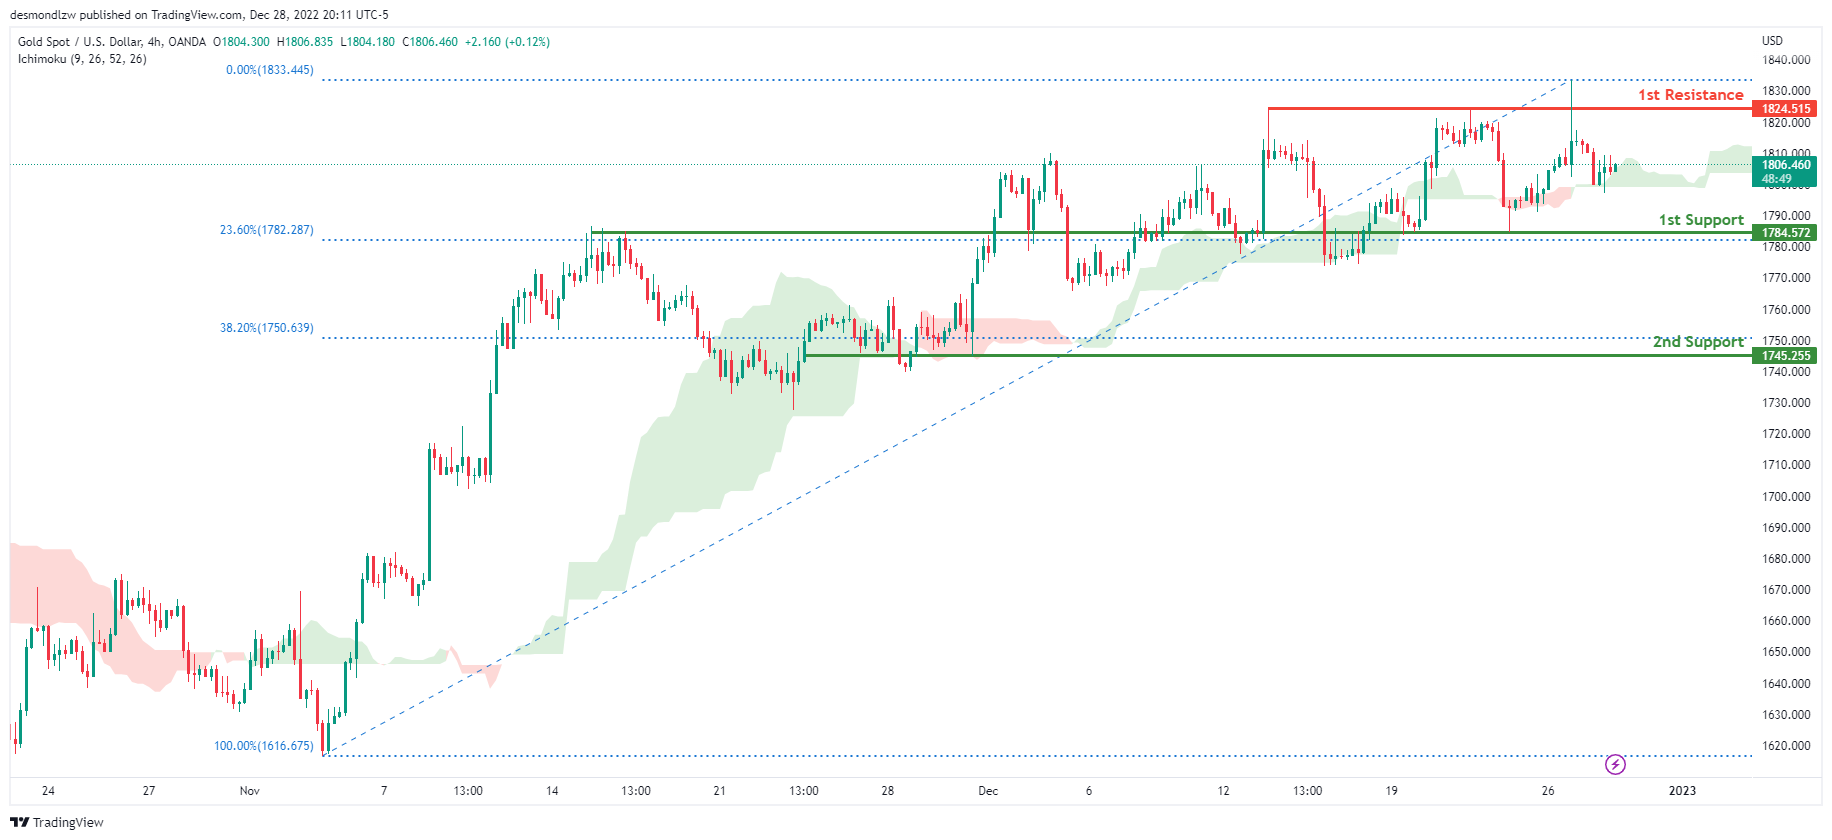
Looking at the H4 chart, my overall bias for XAUUSD is bullish due to the current price crossing above the Ichimoku cloud, indicating a bullish market. If this bullish momentum continues, expect the price to continue heading towards the 1st resistance at 1824.515 where the recent high is. In an alternative scenario, price could possibly head back down to break the 1st support at 1784.572, where the previous high is before heading towards the 2nd support at 1745.255, where the 38.2% Fibonacci line is.
Areas of consideration:
- H4 time frame, 1st resistance at 1824.515
- H4 time frame, 1st support at 1784.572
- H4 time frame, 2nd support at 1745.255
AUD/USD:
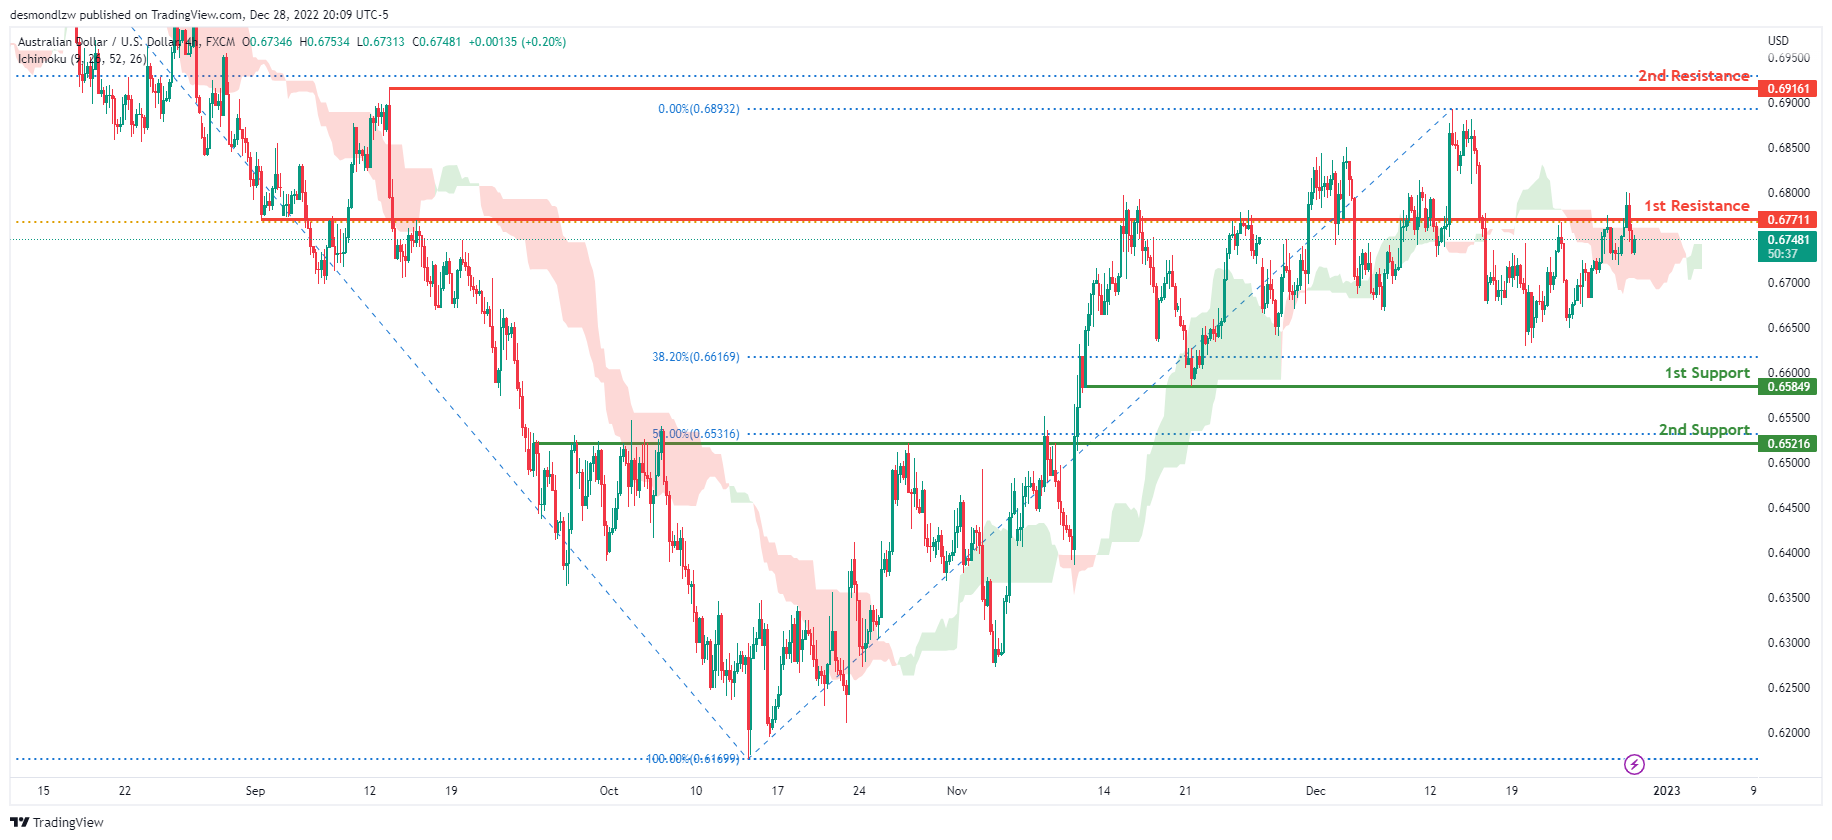
Looking at the H4 chart, my overall bias for AUDUSD is bearish due to the current price crossing below the Ichimoku cloud, indicating a bearish market. If this bearish momentum continues, expect the price to continue heading towards the 1st support at 0.65849, where the 78.6% Fibonacci line is. In an alternative scenario, price could possibly head back up towards the 1st resistance at 0.67711, where the 61.8% Fibonacci line is.
Areas of consideration
- H4, 1st resistance at 0.67711
- H4, 1st support at 0.65849
NZD/USD:
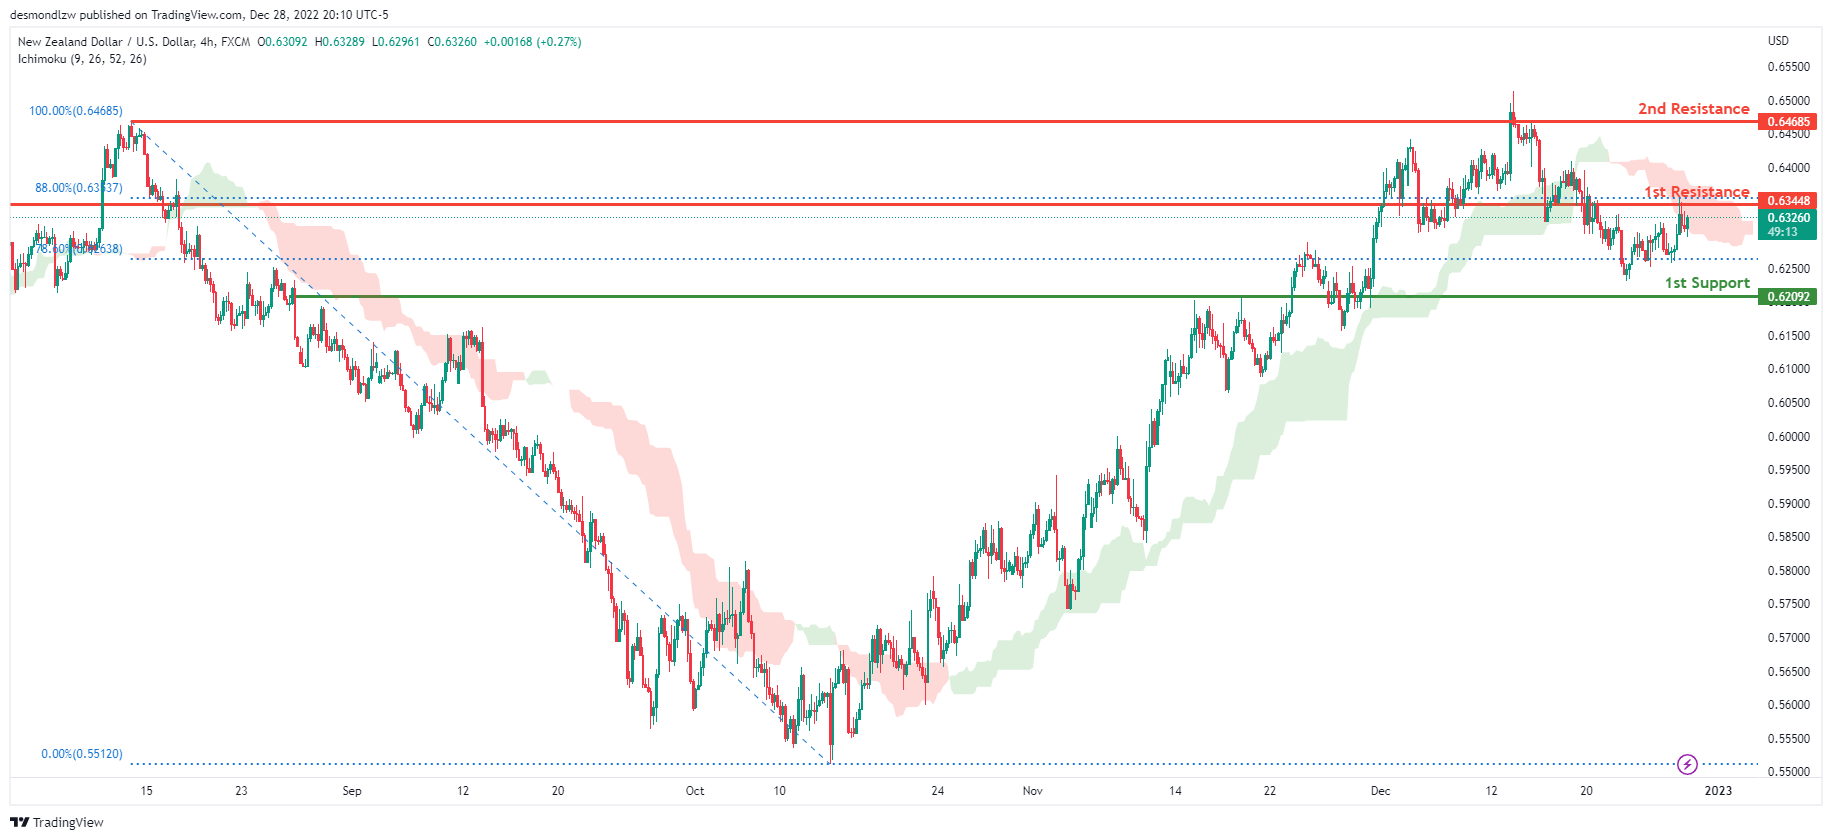
Looking at the H4 chart, my overall bias for NZDUSD is bearish due to the current price being below the Ichimoku cloud, indicating a bearish market. If this bearish momentum continues, expect price to possibly continue heading towards the 1st support at 0.62092, where the 78.6% Fibonacci line is. In an alternate scenario, price could possibly head back up towards the 1st resistance level at 0.63448, where the 88% Fibonacci line is.
Areas of consideration:
- H4 time frame, 1st resistance at 0.63448
- H4 time frame, 1st support at 0.62092
USD/CAD:
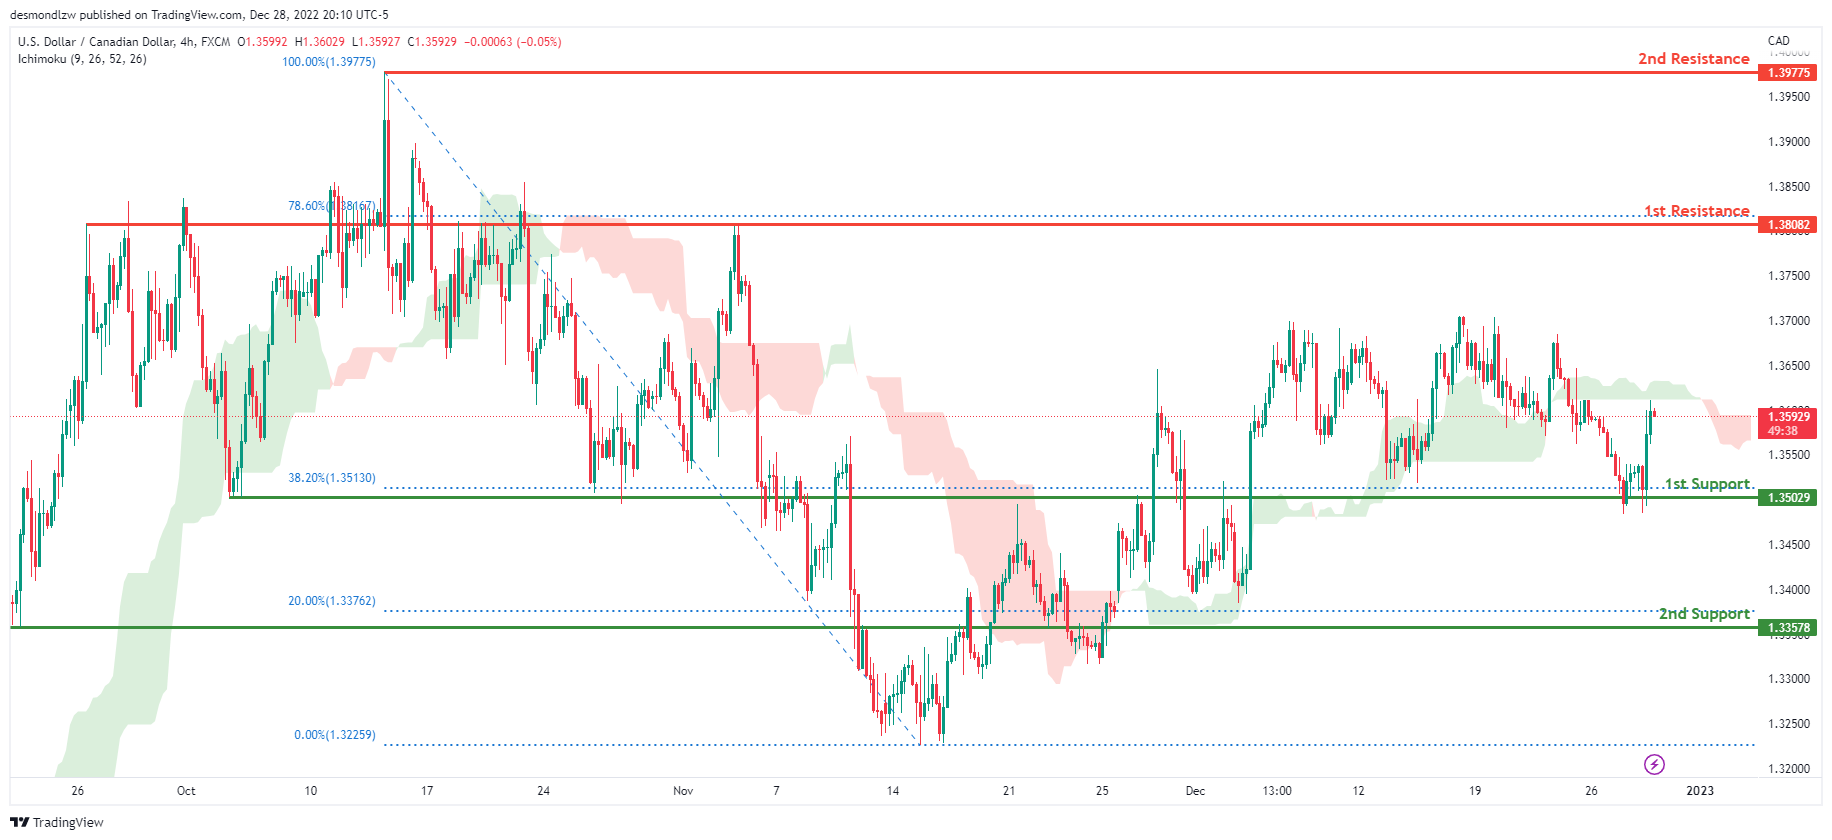
On the H4 chart, the overall bias for USDCAD is bearish. To add confluence to this, the price is below the Ichimoku cloud which indicates a bearish market. If this bearish momentum continues, expect the price to possibly break the 1st support at 1.35029, where the 38.2% Fibonacci line is, before heading towards the 2nd support at 1.33578, where the 20% Fibonacci line is. In an alternative scenario, price could head towards 1st resistance line at 1.38082, where the 78.6% Fibonacci line is.
Areas of consideration:
- H4 time frame, 1st resistance at 1.38082
- H4 time frame, 2nd resistance at 1.39775
- H4 time frame, 1st support at 1.35029
- H4 time frame, 2nd support at 1.33578
OIL:
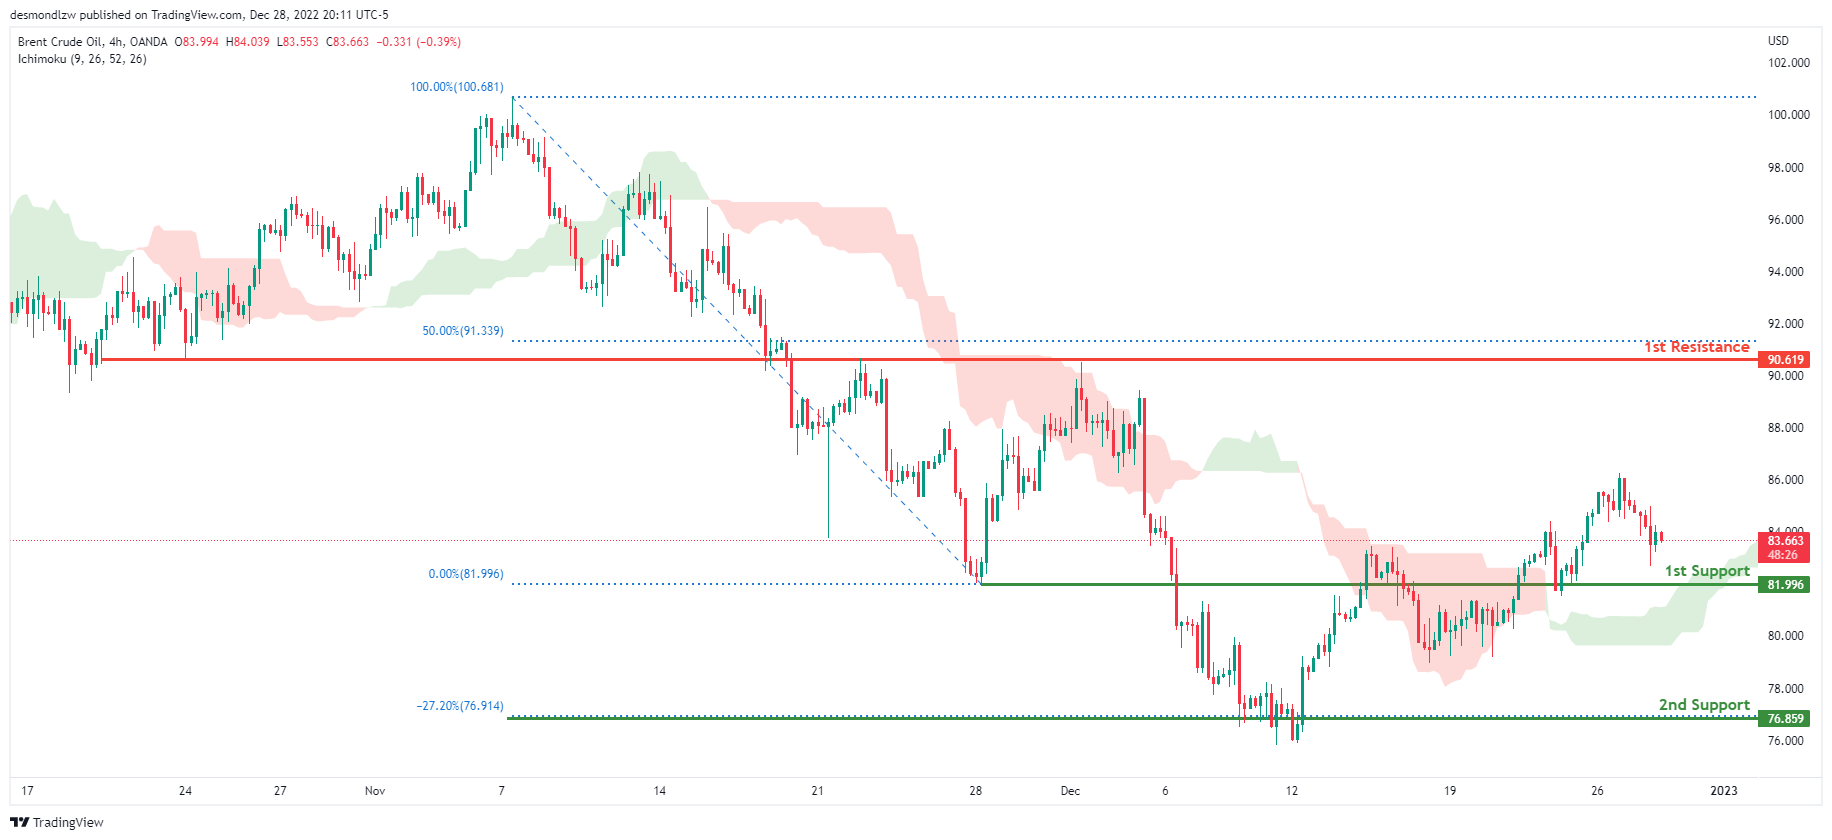
Looking at the H4 chart, my overall bias for BCOUSD is bullish due to the current price being above the Ichimoku cloud, indicating a bullish market. If this bullish momentum continues, expect the price to possibly head towards the 1st resistance at 90.619, where the 50% Fibonacci line is. In an alternate scenario, price could possibly head back down to retest the 1st support level at 81.996, where the previous low is located.
Areas of consideration:
- H4 time frame, 1st resistance at 90.619
- H4 time frame, 1st support at 81.996
Dow Jones Industrial Average:
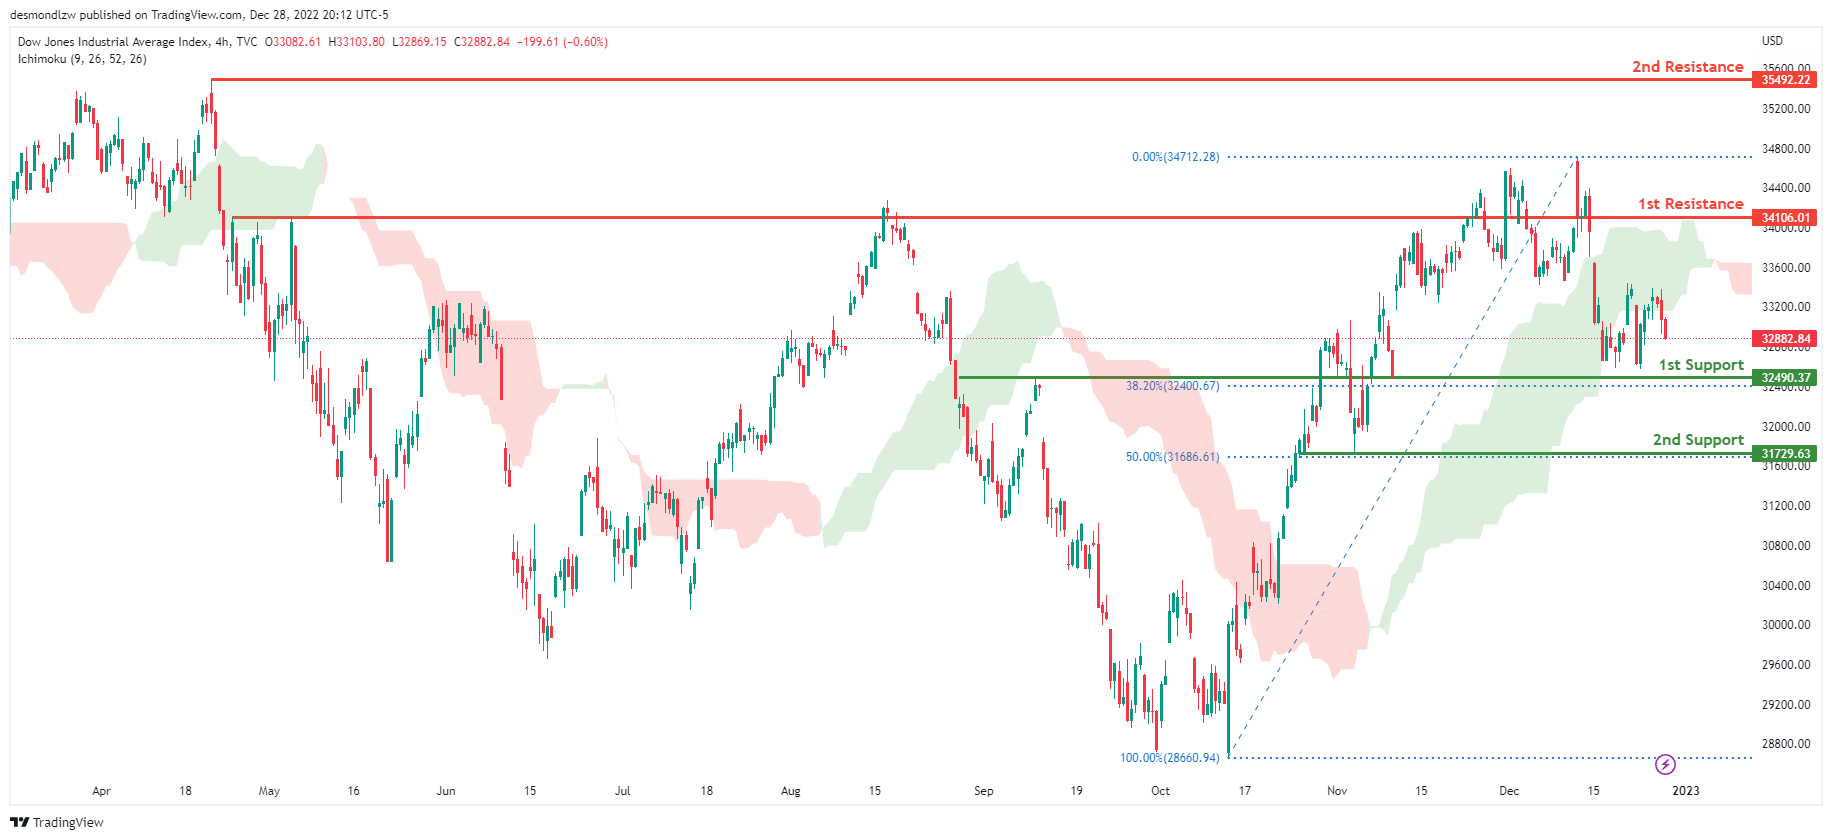
On the H4 chart, the overall bias for DJI is bearish. To add confluence to this, the price is crossing below the Ichimoku cloud which indicates a bearish market. If this bearish momentum continues, expect the price to head back down towards the 1st support at 32490.37, where the 61.8% Fibonacci line is. In an alternative scenario, price could possibly break the 1st resistance line at 34106.01, where the previous swing high is before heading towards the 2nd resistance line at 35492.22, where the previous swing high is.
Areas of consideration:
- H4 time frame, 1st support at 32490.37
- H4 time frame, 1st Resistance at 34106.01
- H4 time frame, 2nd Resistance at 35492.22
DAX:
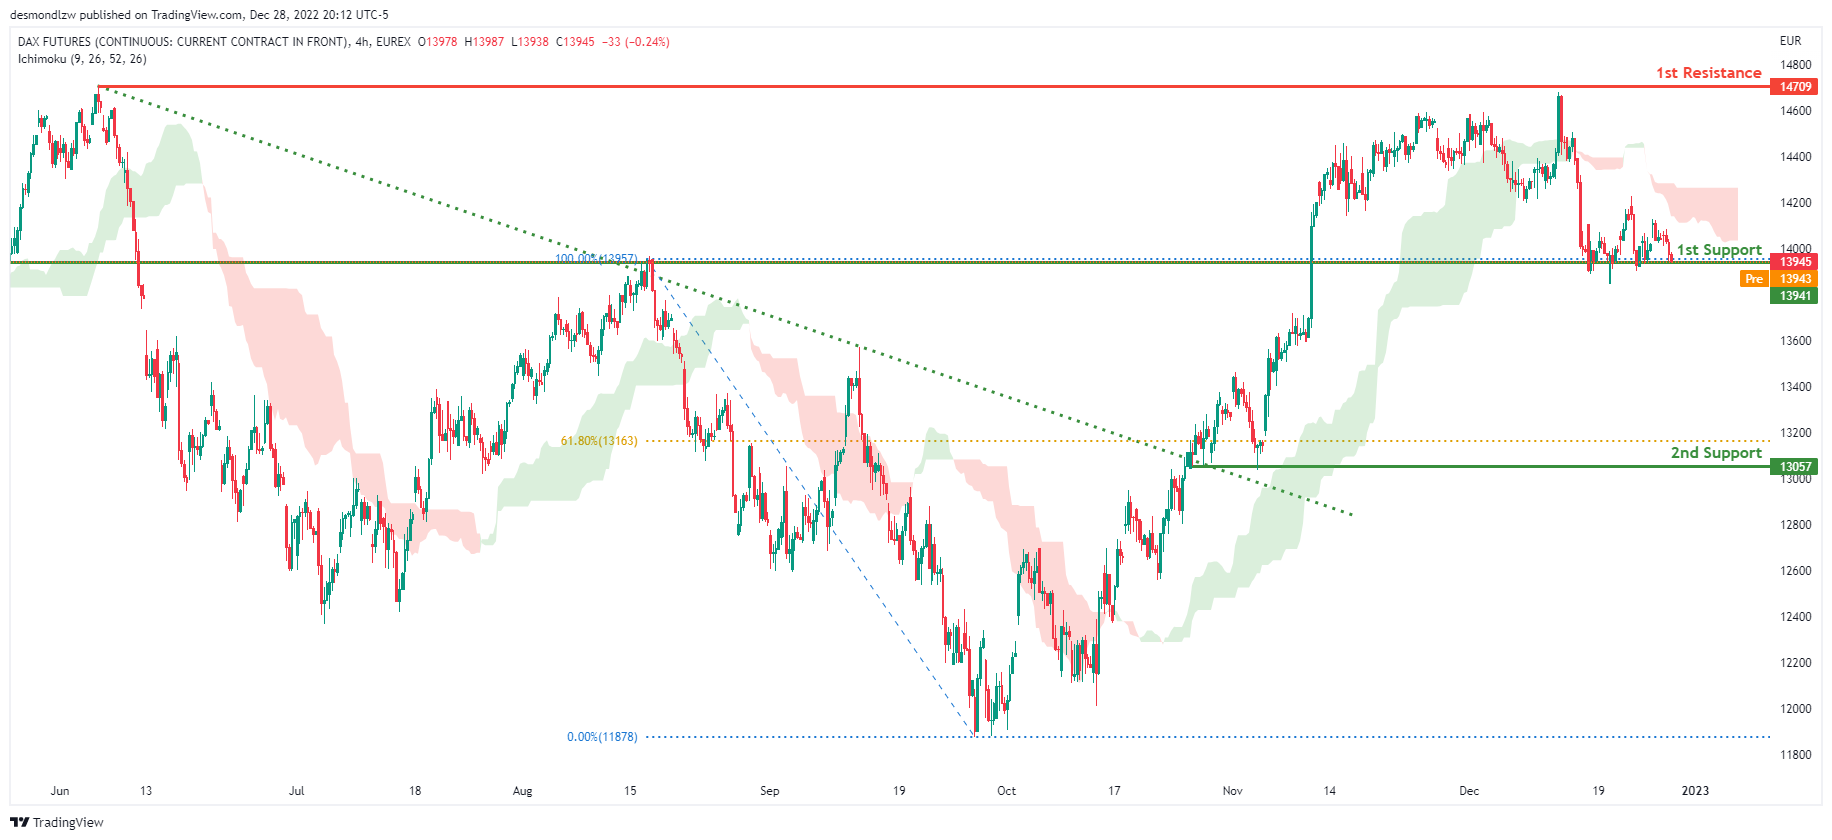
Looking at the H4 chart, my overall bias for DAX is bearish due to the current price being below the Ichimoku cloud, indicating a bearish market. If this bearish momentum continues, expect price to break the 1st support at 13941 where the previous swing high is before heading towards the 2nd support at 13057, where the 61.8% Fibonacci line is. In an alternative scenario, price could possibly head back up to retest the 1st resistance at 14709, where the previous swing high is.
Areas of consideration:
- H4 time frame, 1st resistance is at 14709
- H4 time frame, 1st support is at 13941
- H4 time frame, 2nd support is at 13057
ETHUSD:
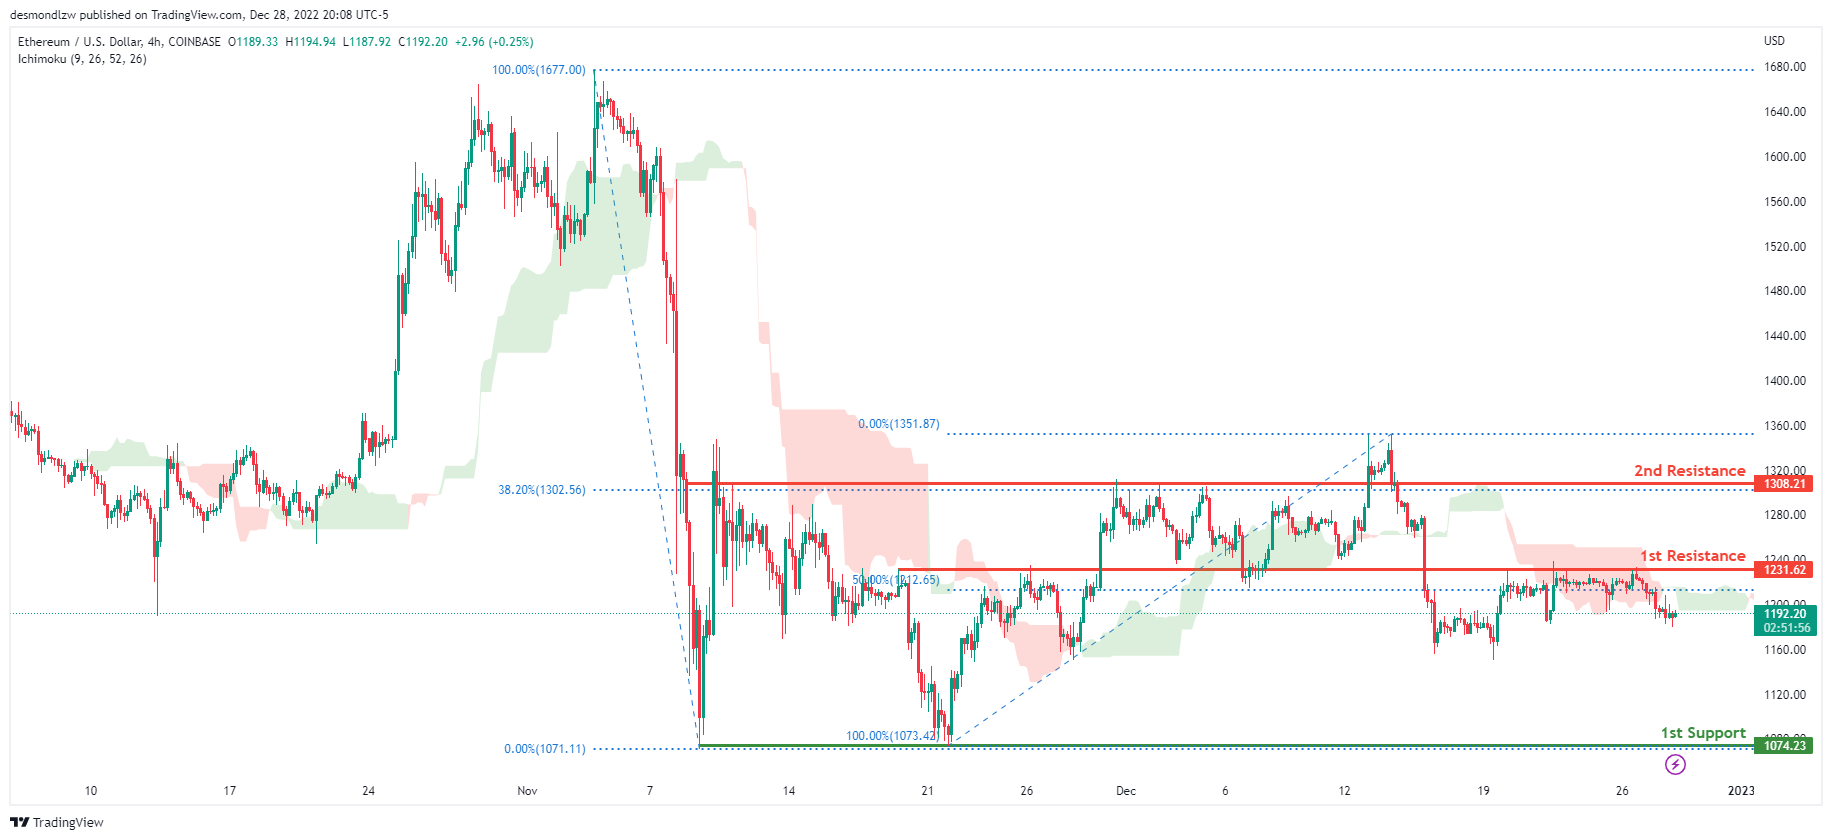
Looking at the H4 chart, my overall bias for ETHUSD is bearish due to the current price crossing below the Ichimoku cloud, indicating a bearish market. If this bearish momentum continues, expect price to head towards the 1st support at 1074.23, where the previous swing low is. In an alternative scenario, price could head back up to break the 1st resistance at 1231.62, where the 50% Fibonacci line is, before heading towards the 2nd resistance at 1308.21, where the 38.2% Fibonacci line is.
Areas of consideration:
- H4 time frame, 1st resistance of 1231.62
- H4 time frame, 2nd resistance of 1308.21
- H4 time frame, 1st support at 1074.23
BTCUSD:
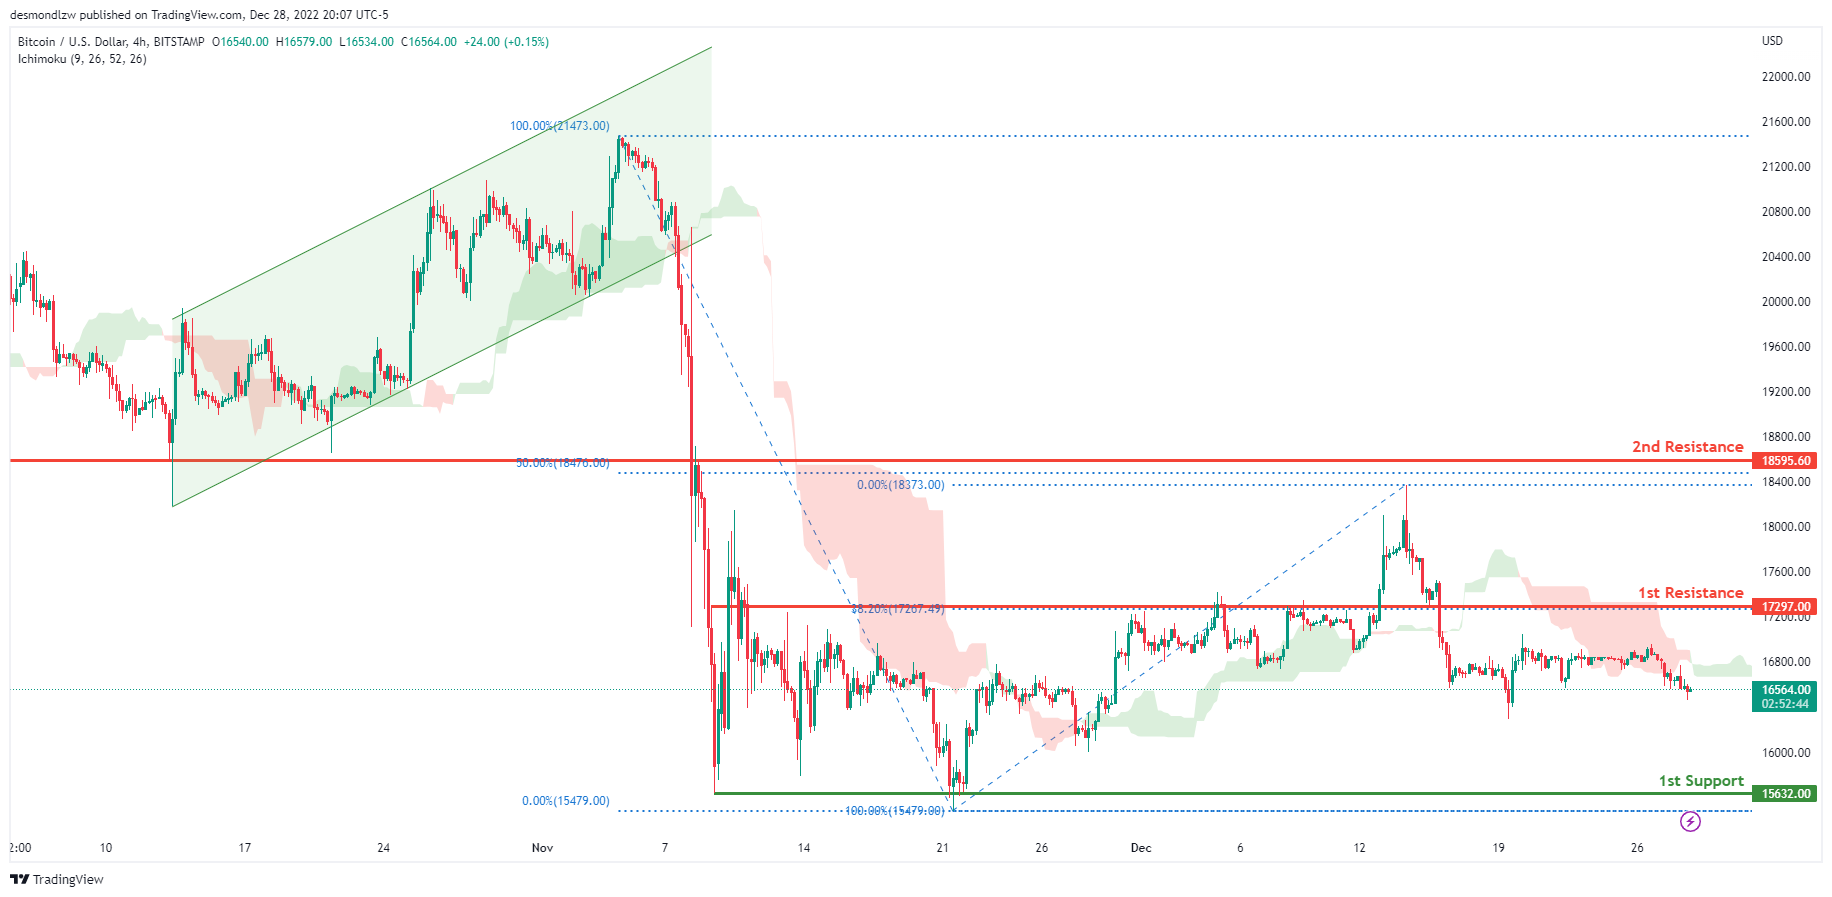
Looking at the H4 chart, my overall bias for BTCUSD is bearish due to the current price crossing below the Ichimoku cloud, indicating a bearish market. If this bearish momentum continues, expect price to possibly continue heading towards the 1st support at 15632.00, where the previous swing low is. In an alternative scenario, price could possibly head up towards the 1st resistance at 17297.00, where the 38.2% Fibonacci line is.
Areas of consideration:
- H4 time frame, 1st resistance 17297.00
- H4 time frame, 1st support at 15632.00
S&P 500:
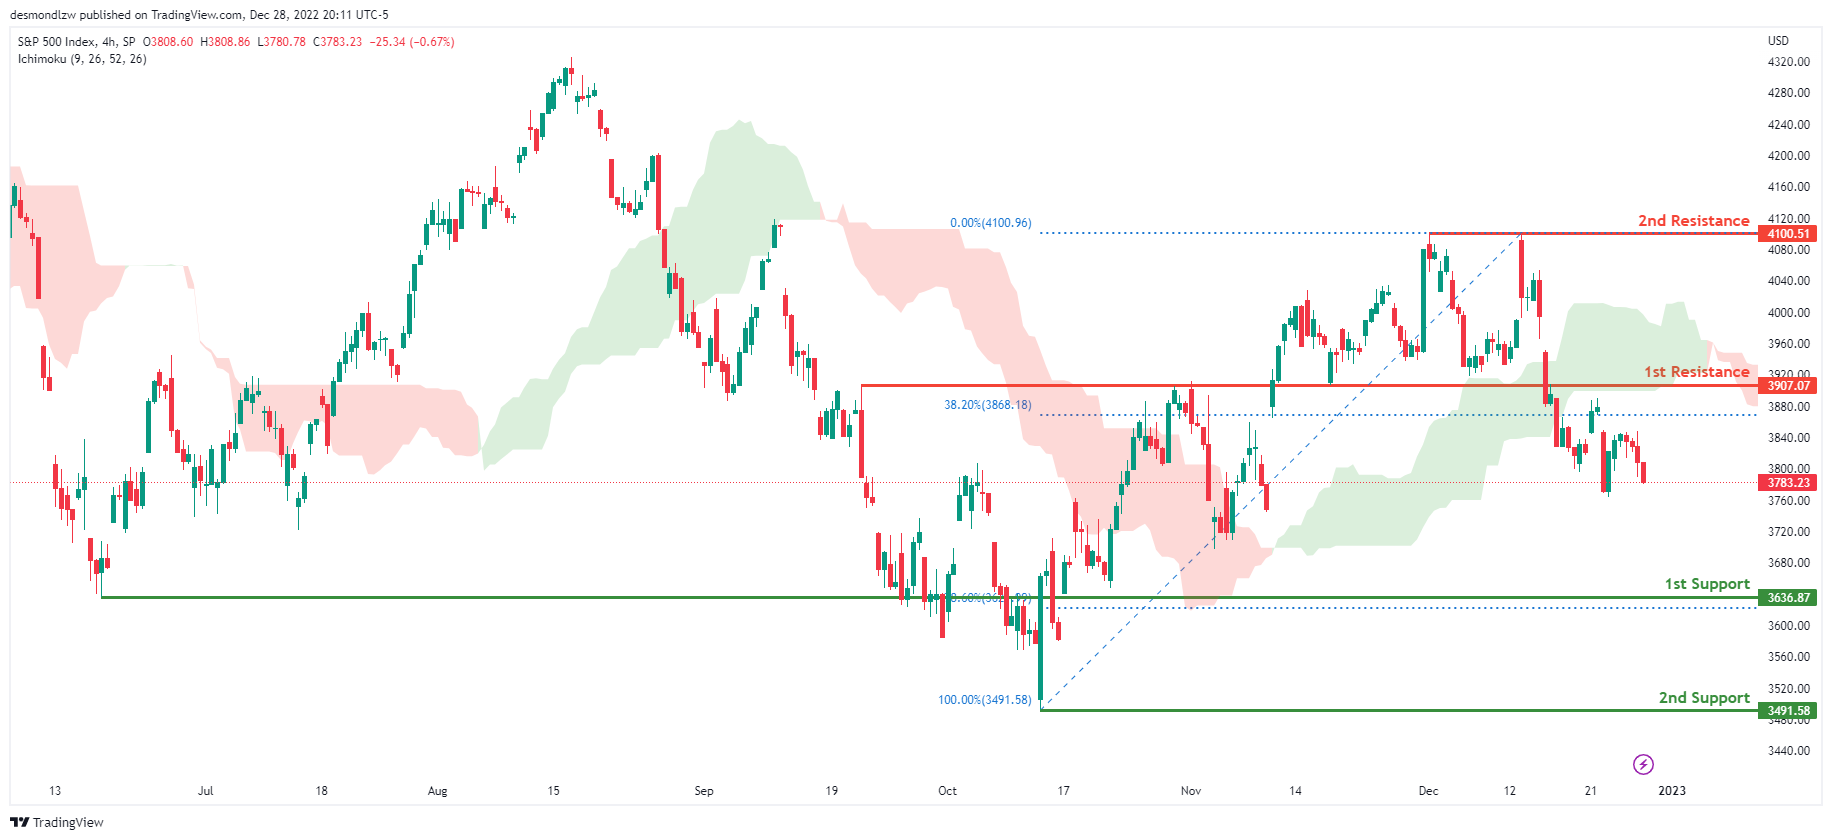
Looking at the H4 chart, my overall bias for S&P500 is bearish due to the current price being below the Ichimoku cloud, indicating a bearish market. If this bearish momentum continues, expect the price to continue heading towards the 1st support at 3636.87, where the 78.6% Fibonacci line is. In an alternative scenario, price could possibly head back up to retest the 1st resistance at 3907.07, where the 38.2% Fibonacci line is.
Areas of consideration:
- H4 time frame, 1st support at 3636.87
- H4 time frame, 1st resistance at 3907.07
AUD/USD Daily Report
Daily Pivots: (S1) 0.6706; (P) 0.6753; (R1) 0.6788; More...
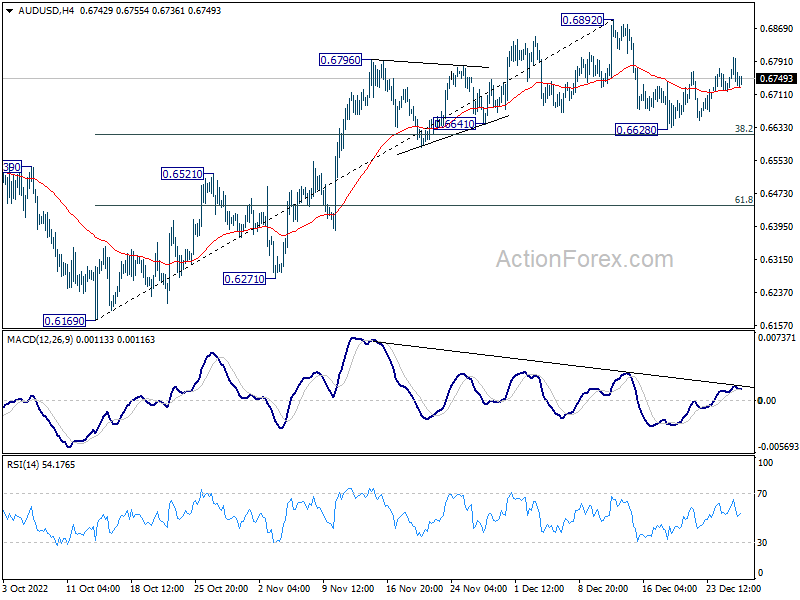
AUD/USD is staying in range of 0.6628/6892 and intraday bias remains neutral first. On the downside, sustained break of 38.2% retracement of 0.6169 to 0.6892 at 0.6616 will indicate rejection by 0.66871 fibonacci level. Deeper fall should then be seen to 61.8% retracement at 0.6445. On the upside, break of 0.6892 will resume the rally from 0.6169.
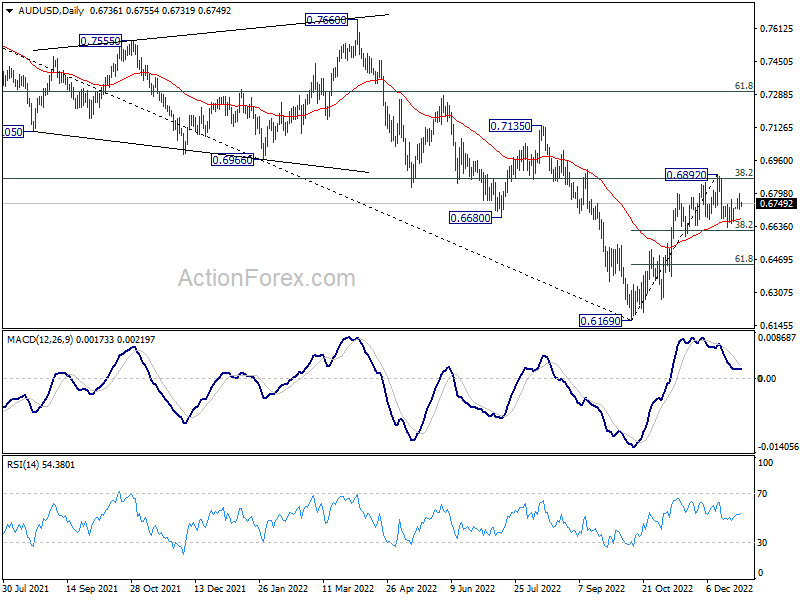
In the bigger picture, it's still unsure if price actions from 0.6169 medium term bottom are developing into a corrective pattern or trend reversal. Rejection by 38.2% retracement of 0.8006 to 0.6169 at 0.6871 will maintain medium term bearishness for another fall through 0.6169 at a later stage. However, firm break of 0.6871, and sustained trading above 55 week EMA (now at 0.6896) will raise the chance of the start of a bullish up trend.
Markets in Risk-Off Mode But Forex Mixed
The financial markets are trading more on the risk-on side as the year-end is approaching. But reactions in the forex markets are relatively mild. Yen continues to be the worst performer for the week but selloff is somewhat slowing. Euro and Sterling are soft with Dollar. Commodity currencies are the relatively stronger ones but have already pared much of the earlier gains. With most traders away, the committed moves might only come next week.
In Asia, at the time of writing, Nikkei is down -1.05%. Hong Kong HSI is down -0.92%. China Shanghai SSE is down -0.29%. Singapore Strait Times is down -0.84%. Japan 10-year JGB yield is down -0.007 at 0.450. Overnight, DOW dropped -1.10%. S&P 500 dropped -1.20%. NASDAQ dropped -1.35%. 10-year yield rose 0.027 to 3.887.
WTI oil down as China boost fades
Oil prices closed lower overnight as the near term rebound appeared to be fading. The optimism over a surge in demand in China was replaced by concerns over infections in the country, as well as its outbound tourists. A regional councillor in Italy confirmed that half of passengers on China flight to Lombardy were tested COVID positive. US also announced to require travelers from China, including Hong Kong, to show negative Covid-19 test result before flights.
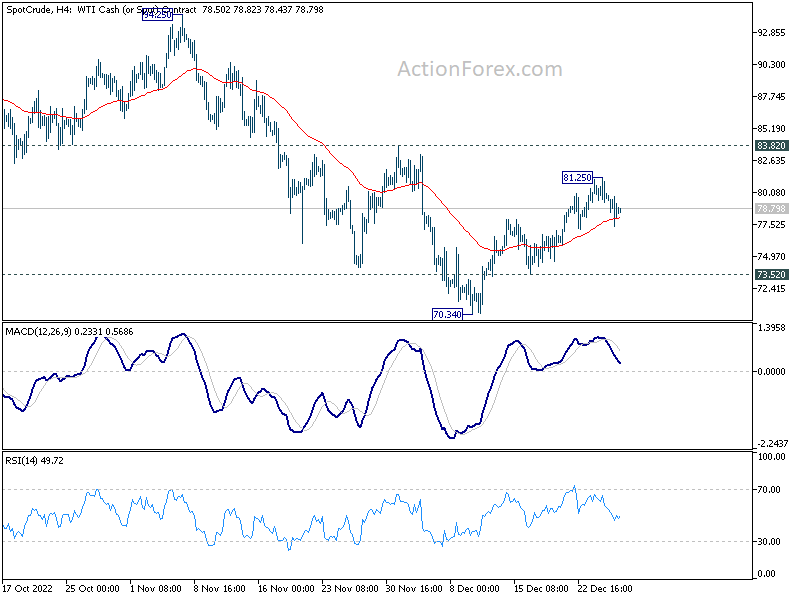
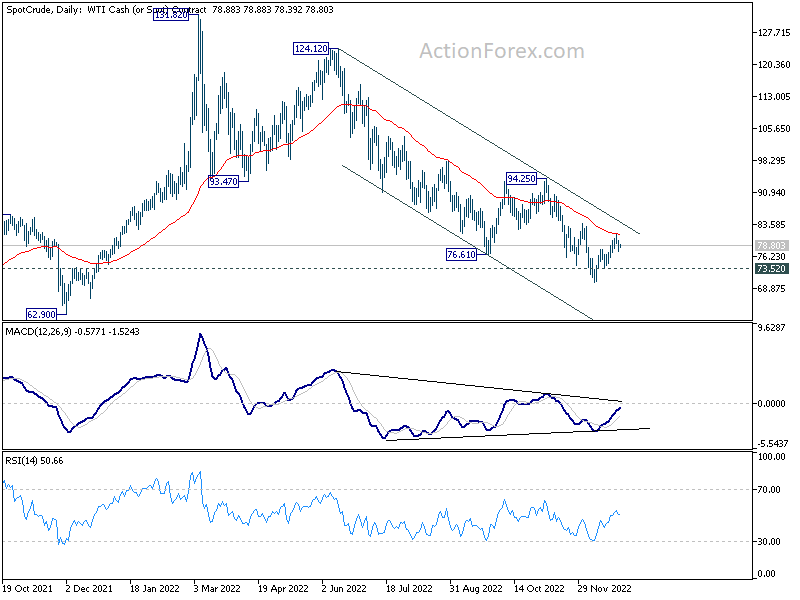
WTI crude oil's rebound from 70.34 stalled after hitting 55 day EMA. It's also kept well inside the medium term falling channel from 124.12. While bullish convergence condition is seen in daily MACD, bearishness is maintained with recent development. Further decline from current level, followed by break of 73.52 support should confirm that the corrective rebound has completed in a three wave structure. Larger down trend should then be ready to resume through 70.34 low, towards next support level at 62.90.
NASDAQ closed at new 2022 low, but a turnaround soon?
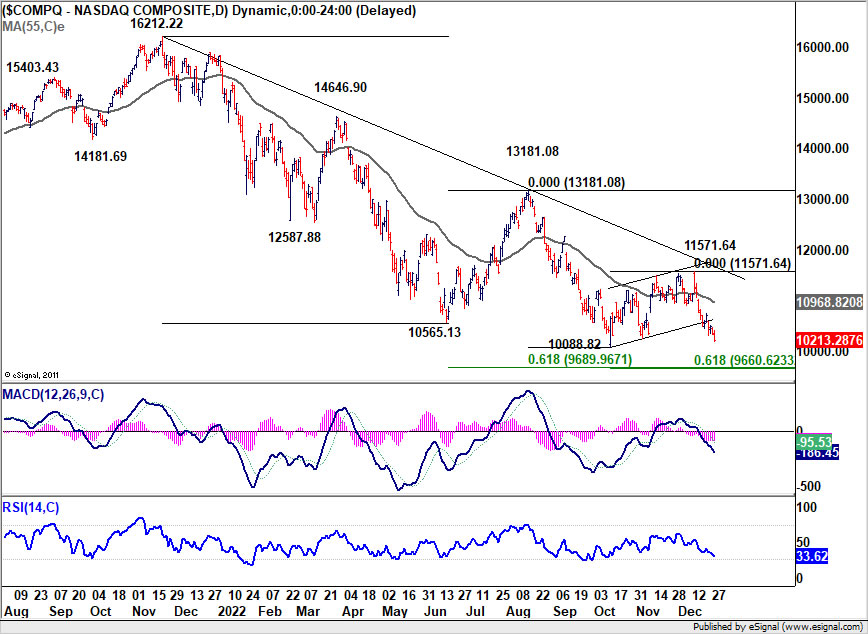
NASDAQ closed at new 2022 low at 10213.28 overnight as investor sentiment turned sour in thin holiday trading. Technically, it's still staying above intraday low at 10088.82, but a break of that level should be seen soon, probably 10000 handle too.
Technically, the key level lies in 9660/89 cluster projection level (61.8% projection of 16212.22 to 10565.13 from 13181.08 at 9689.96, 61.8% projection of 13181.08 to 10088.82 from 11571.64 at 9660.62). Strong support from this cluster level in January could set up the markets for a trend reversal attempt in the first half of 2023. But sustained break there would set up down trend extension for the upcoming period.
We'll soon find out whether a turn in the market is around the corner.
Looking ahead
Eurozone M3 money supply and US jobless claims will be released today.
AUD/USD Daily Report
Daily Pivots: (S1) 0.6706; (P) 0.6753; (R1) 0.6788; More...
AUD/USD is staying in range of 0.6628/6892 and intraday bias remains neutral first. On the downside, sustained break of 38.2% retracement of 0.6169 to 0.6892 at 0.6616 will indicate rejection by 0.66871 fibonacci level. Deeper fall should then be seen to 61.8% retracement at 0.6445. On the upside, break of 0.6892 will resume the rally from 0.6169.
In the bigger picture, it's still unsure if price actions from 0.6169 medium term bottom are developing into a corrective pattern or trend reversal. Rejection by 38.2% retracement of 0.8006 to 0.6169 at 0.6871 will maintain medium term bearishness for another fall through 0.6169 at a later stage. However, firm break of 0.6871, and sustained trading above 55 week EMA (now at 0.6896) will raise the chance of the start of a bullish up trend.
Economic Indicators Update
| GMT | Ccy | Events | Actual | Forecast | Previous | Revised |
|---|---|---|---|---|---|---|
| 09:00 | EUR | Eurozone M3 Money Supply Y/Y Nov | 5.00% | 5.10% | ||
| 13:30 | USD | Initial Jobless Claims (Dec 23) | 225K | 216K | ||
| 15:30 | USD | Natural Gas Storage | -198B | -87B | ||
| 16:00 | USD | Crude Oil Inventories | -1.2M | -5.9M |
NASDAQ closed at new 2022 low, but a turnaround soon?
NASDAQ closed at new 2022 low at 10213.28 overnight as investor sentiment turned sour in thin holiday trading. Technically, it's still staying above intraday low at 10088.82, but a break of that level should be seen soon, probably 10000 handle too.
Technically, the key level lies in 9660/89 cluster projection level (61.8% projection of 16212.22 to 10565.13 from 13181.08 at 9689.96, 61.8% projection of 13181.08 to 10088.82 from 11571.64 at 9660.62). Strong support from this cluster level in January could set up the markets for a trend reversal attempt in the first half of 2023. But sustained break there would set up down trend extension for the upcoming period.
We'll soon find out whether a turn in the market is around the corner.