Sample Category Title
EUR/CHF Daily Outlook
Daily Pivots: (S1) 0.9764; (P) 0.9798; (R1) 0.9831; More....
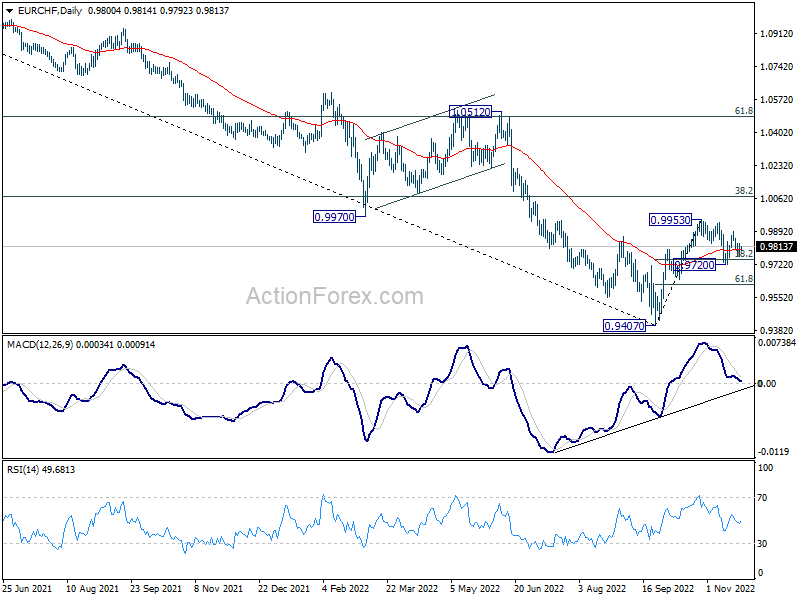
EUR/CHF is staying in consolidation from 0.9953 and intraday bias remains neutral first. On the upside, firm break of 0.9953 resistance will resume larger rally from 0.9407 to 1.0072 fibonacci level. However, break of 0.9720 will extend the decline from 0.9953 to 61.8% retracement of 0.8407 to 0.9953 at 0.9616.
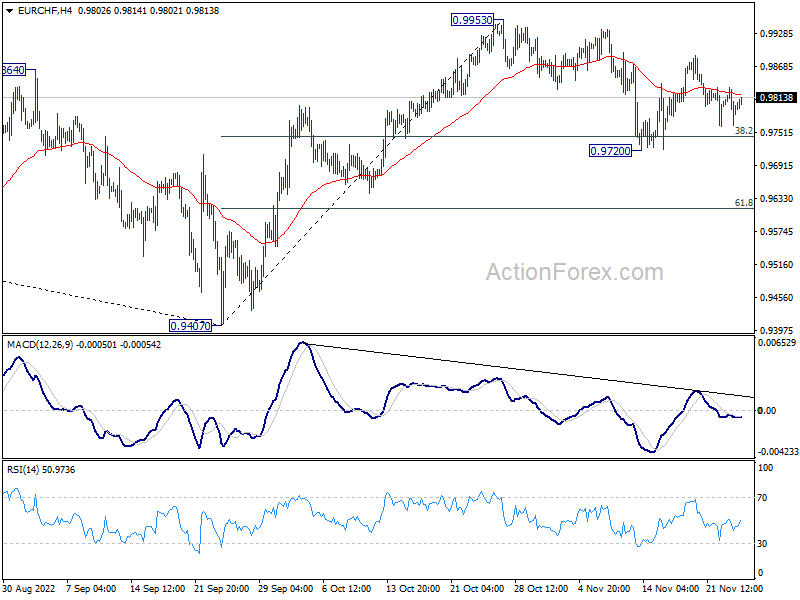
In the bigger picture, rejection by 0.9970 support turned resistance retains medium term bearishness. That is, while 0.9407 is a medium term bottom, price actions from there would develope into a corrective pattern rather than a reversal. Down trend resumption through 0.9407 is mildly favored at a later stage. This will remain the favored case now, as long 38.2% retracement of 1.1149 to 0.9407 at 1.0072 holds.
USD/CAD Daily Outlook
Daily Pivots: (S1) 1.3319; (P) 1.3380; (R1) 1.3414; More....
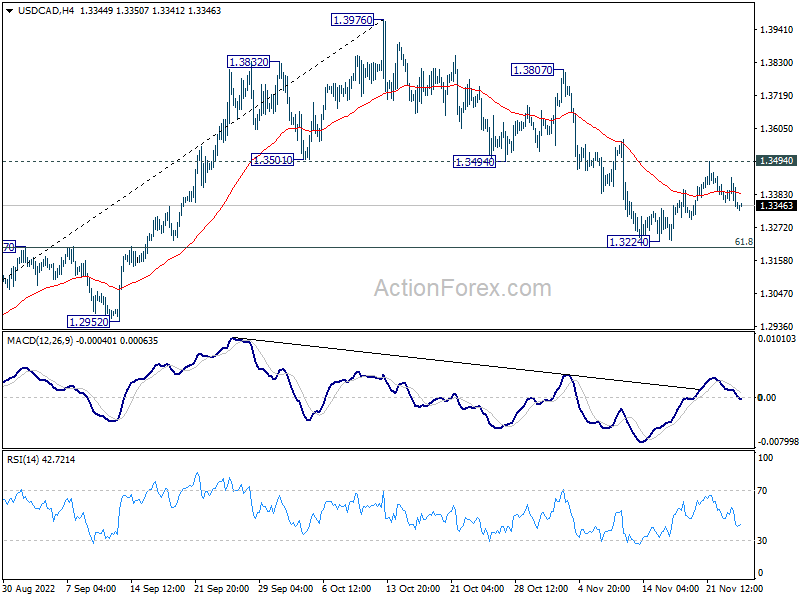
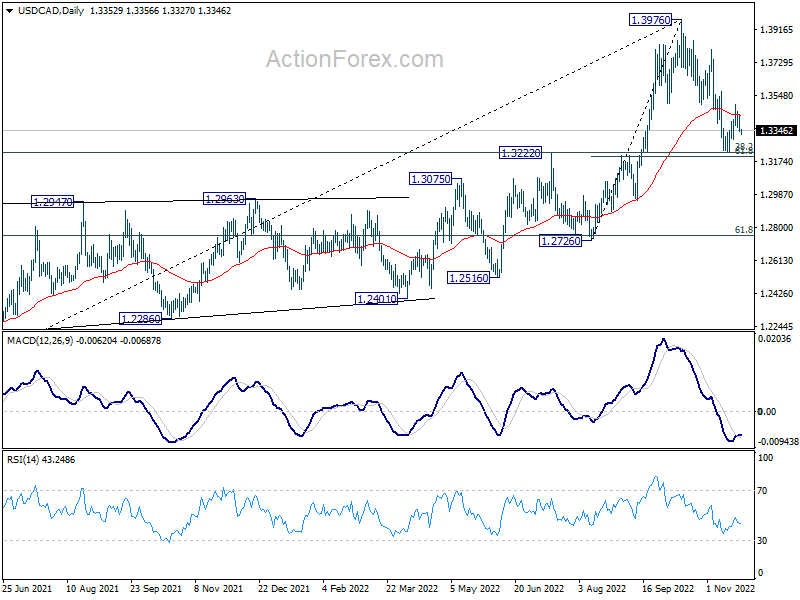
Intrady bias in USD/CAD stays neutral at this point. On the upside, firm break of 1.3494 will indicate that correction from 1.3976 has completed at 1.3224, ahead of 1.3207 cluster support (61.8% retracement of 1.2726 to 1.3976 at 1.3204). Intraday bias will be turned back to the upside for 1.3807/3976 resistance zone. However, on the downside, sustained break of 1.3204/7 will carry larger bearish implication and target 1.2952 support next.
In the bigger picture, as long as 1.3222 cluster support (38.2% retracement of 1.2005 to 1.3976 at 1.3223) holds, larger up trend from 1.2005 (2021 low) is still expected to resume through 1.3976 high at a later stage. . However, firm break of 1.3222/3 will indicate that the trend might have reversed. Deeper fall would be seen to next cluster support at 1.2726 (61.8% retracement at 1.2758).
AUD/USD Daily Report
Daily Pivots: (S1) 0.6665; (P) 0.6702; (R1) 0.6770; More...
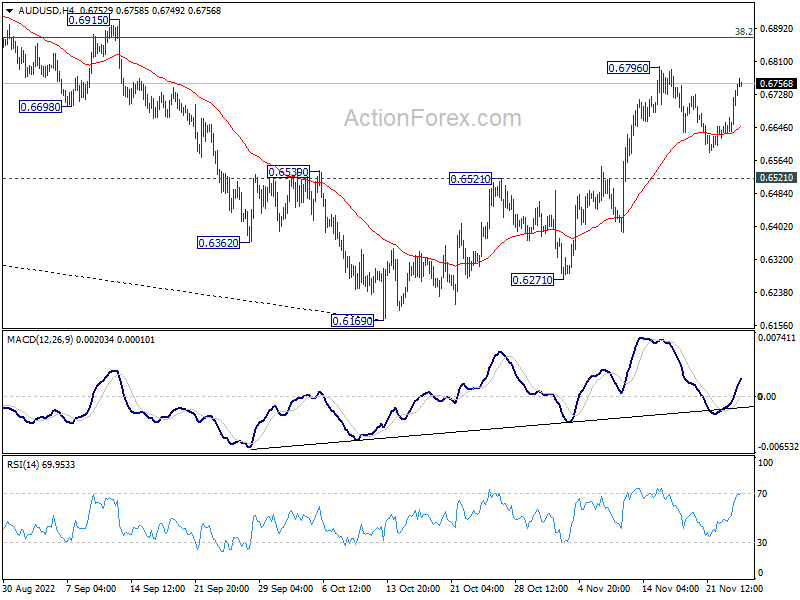
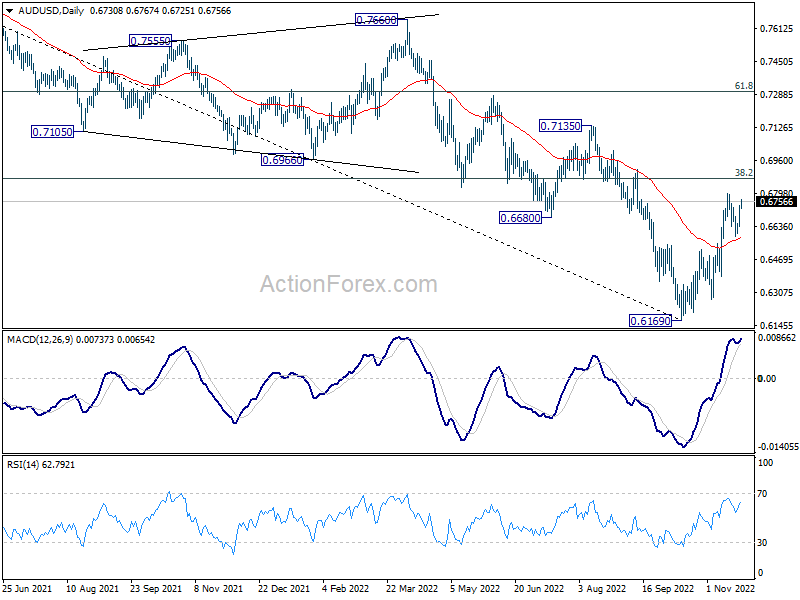
AUD/USD is staying below 0.6796 resistance and intraday bias remains neutral. Further rise is expected as long as 0.6521 resistance turned support holds. On the upside, break of 0.6796 will resume the rise from 0.6169 to 0.6871 fibonacci level. However, sustained break of 0.6521 will argue that whole rebound from 0.6169 is over, and bring deeper fall to retest this low.
In the bigger picture, a medium term bottom is in place at 0.6160 already. But it's too early to call for trend reversal. Nevertheless, even as a corrective move, rise from 0.6169 should target 38.2% retracement of 0.8006 to 0.6169 at 0.6871. Sustained trading above 55 week EMA (now at 0.6923) will raise the chance of the start of a bullish up trend. This week now remain the favored case as long as 0.6521 resistance turned support holds.
USD/JPY Daily Outlook
Daily Pivots: (S1) 138.64; (P) 140.12; (R1) 141.08; More...
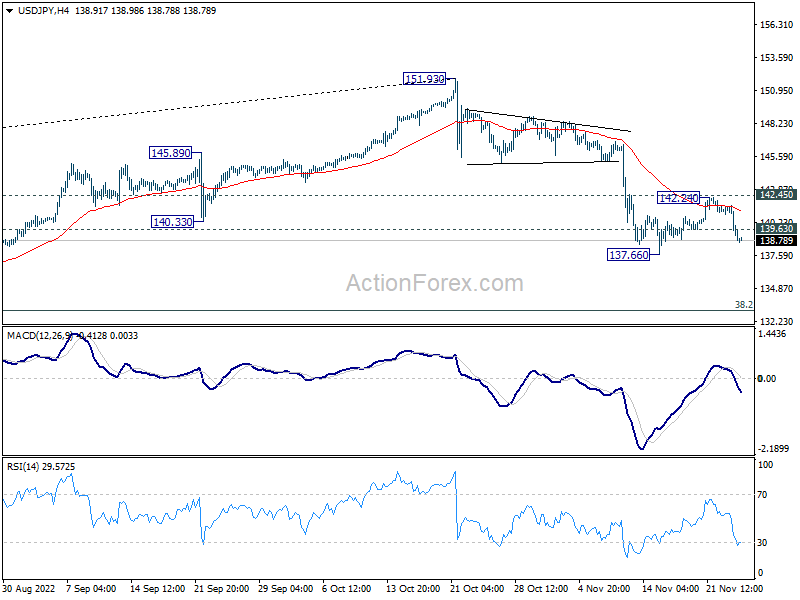
USD/JPY's break of 139.63 minor support suggests that recovery has completed at 142.24. Intraday bias is back on the downside. Break of 137.66 will resume the decline from 151.93 to 133.07 fibonacci level, as a correction to the larger up trend. Outlook will stay bearish as long as 142.45 resistance holds, in case of another recovery.
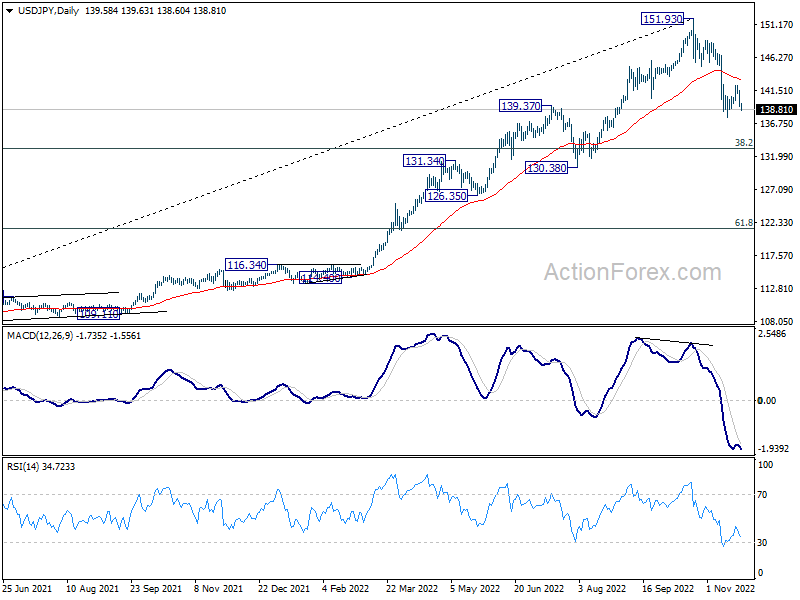
In the bigger picture, a medium term top should be formed at 151.93. Fall from there is correcting larger up trend from 102.58. It's too early to call for bearish trend reversal. But even as a corrective move, such decline should target 38.2% retracement of 102.58 to 151.93 at 133.07, or further to 55 week EMA (now at 130.28).
USD/CHF Daily Outlook
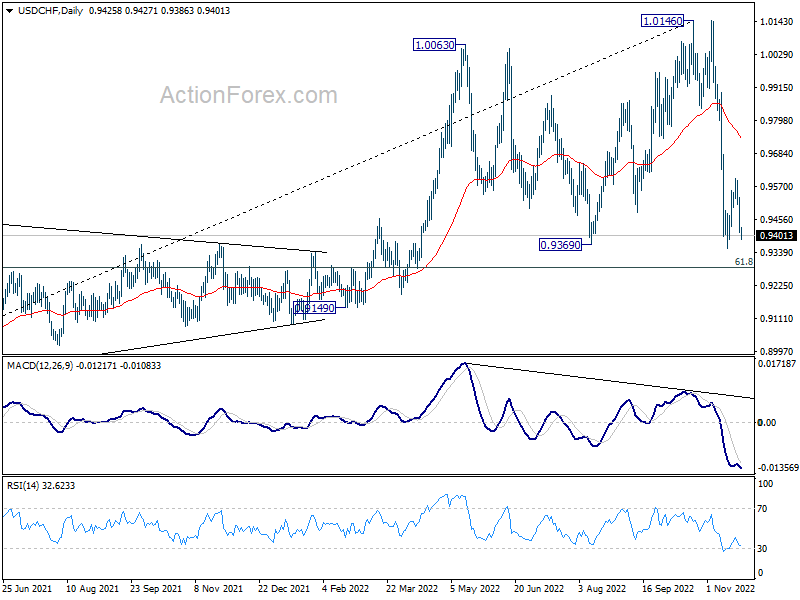
Daily Pivots: (S1) 0.9381; (P) 0.9457; (R1) 0.9502; More...
Break of 0.9474 minor support indicates that USD/CHF's recovery has completed at 0.9597, after rejection by 4 hour 55 EMA. Intraday bias is back on the downside. Break of 0.9355 will resume the decline from 1.0146 to 0.9287 fibonacci level. Near term outlook stays bearish with 0.9680 minor resistance intact, in case of another recovery.
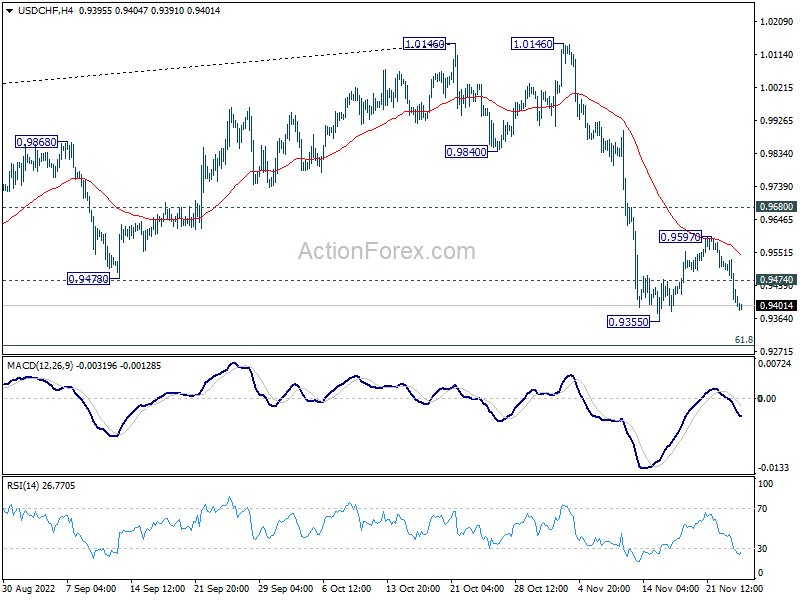
In the bigger picture, rise from 0.8756 (2021 low) has completed at 1.0146, well ahead of 1.0342 long term resistance (2016 high). Based on current downside momentum, fall from 1.0146 might be a medium term down trend itself. Break of 61.8% retracement of 0.8756 to 1.0146 at 0.9287 will pave the way to 0.8756. In any case, risk will stay on the downside as long as 55 day EMA (now at 0.9767) holds.
EUR/USD Daily Outlook
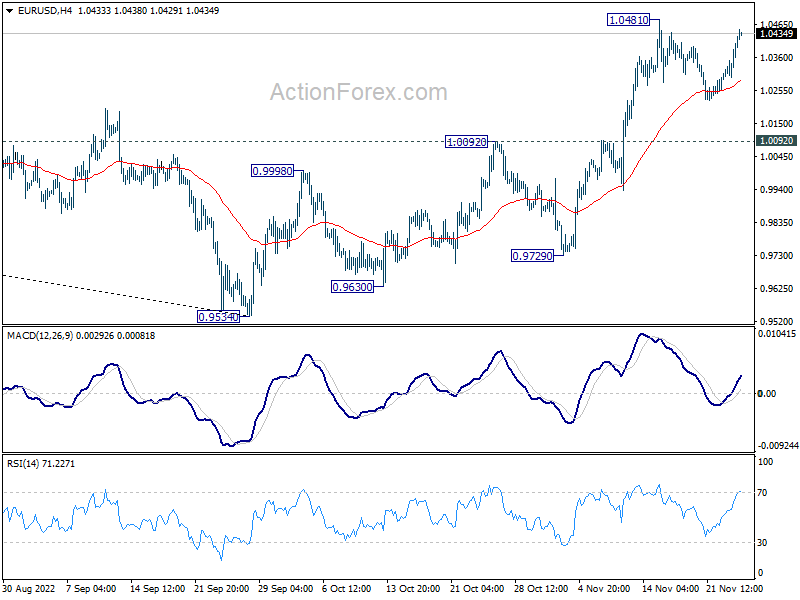
Daily Pivots: (S1) 1.0326; (P) 1.0366; (R1) 1.0434; More...
EUR/USD is still staying below 1.0481 resistance and intraday bias remains neutral. More consolidation could be seen but after all, as long as 1.0092 resistance turned support holds, further rally is still expected. On the upside, break of 1.0481 will resume the rise from 0.9534 and target 1.0609 fibonacci level. However, sustained break of 1.0092 will turn bias to the downside for 55 day EMA (now at 1.0055) and below.
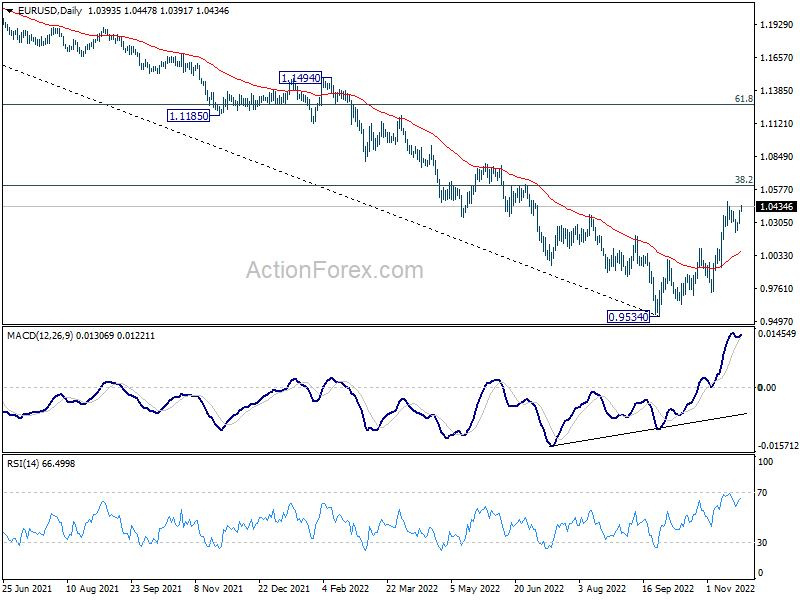
In the bigger picture, a medium term bottom was in place at 0.9534, on bullish convergence condition in daily MACD. Even as a corrective rise, rally from 0.9534 should target 38.2% retracement of 1.2348 (2021 high) to 0.9534 at 1.0609. Sustained trading above 55 week EMA (now at 1.0566) will raise the chance of trend reversal and target 61.8% retracement at 1.1273. This will now remain the favored case as long as 1.0092 resistance turned support holds.
Technical Outlook and Review
USD/JPY:
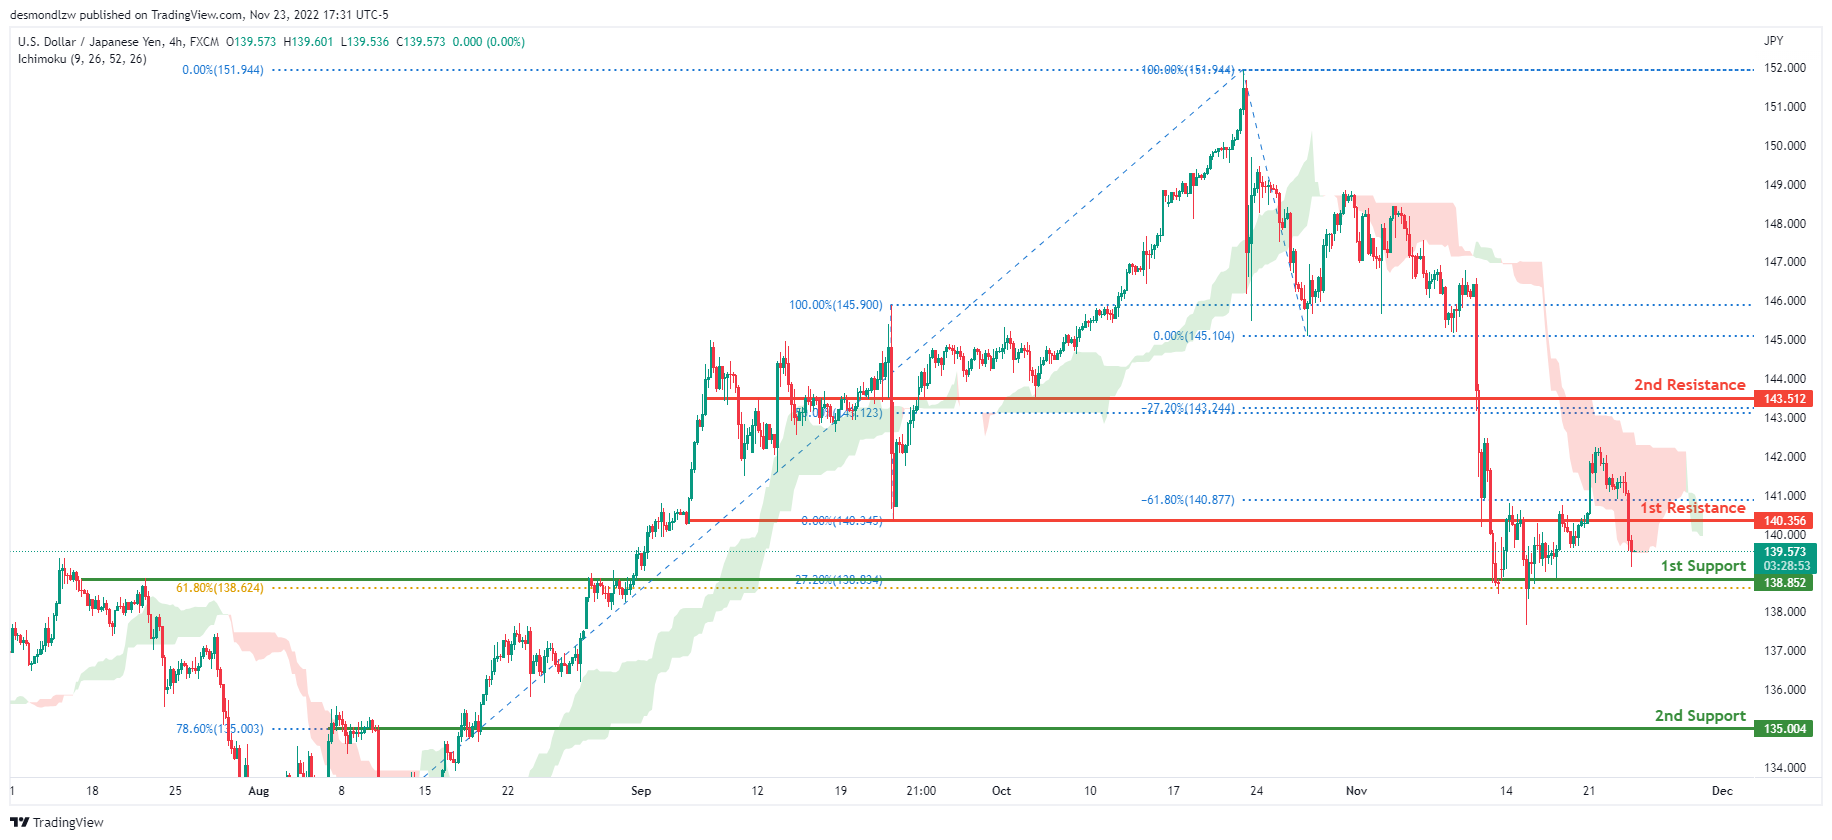
The current general bias for USDJPY on the H4 chart is bearish. To add confluence to this, the price is under the Ichimoku cloud which indicates a bearish market. If the bearish momentum continues, expect USDJPY to head towards the 1st support line at 138.852, where the –27.2% Fibonacci expansion line is located. In an alternative scenario, price could go up to retest the 1st resistance line at 140.356, where the -61.8% Fibonacci expansion line and previous low are located.
Areas of consideration:
- H4 time frame, 1st resistance at 140.356
- H4 time frame, 1st support at 138.852
DXY:
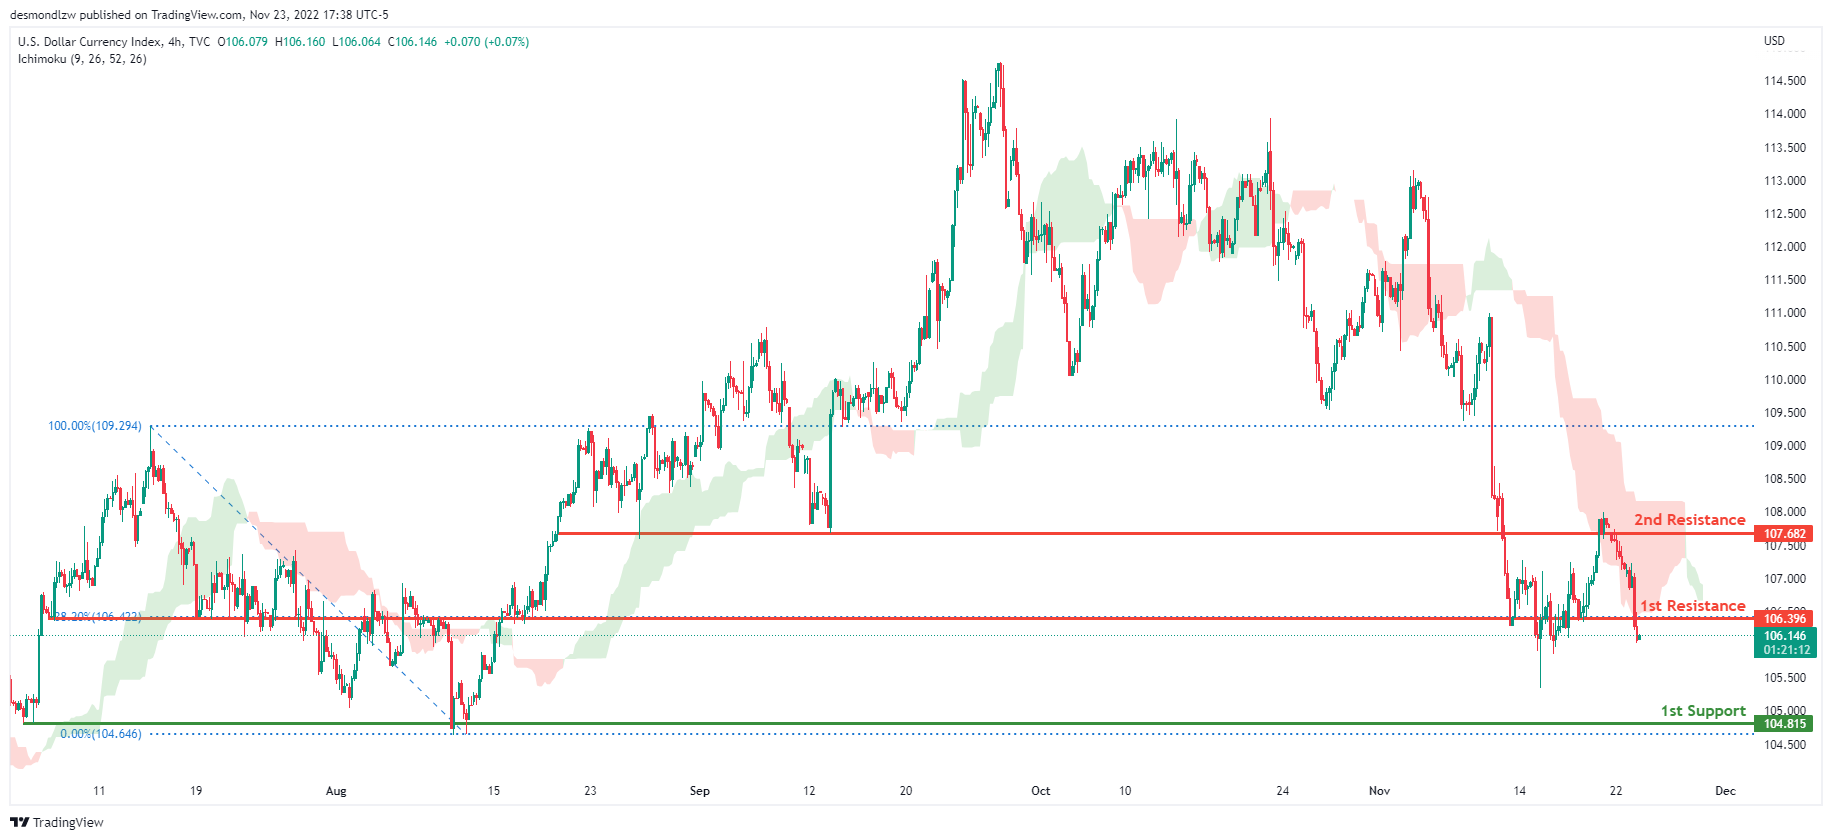
On the H4 chart, the overall bias for DXY is bearish. To add confluence to this, the price is crossing below the Ichimoku cloud which indicates a bearish market. If this bearish momentum continues, expect the price to head towards the 1st support line at 104.815 where the previous low and the 0% Fibonacci line are located. In an alternative scenario, price could head back up and retest the 1st resistance line at 106.396 where the 38.2% fibonacci line is located.
Areas of consideration:
- H4 time frame, 1st resistance at 106.396
- H4 time frame, 1st support at 104.815
EUR/USD:
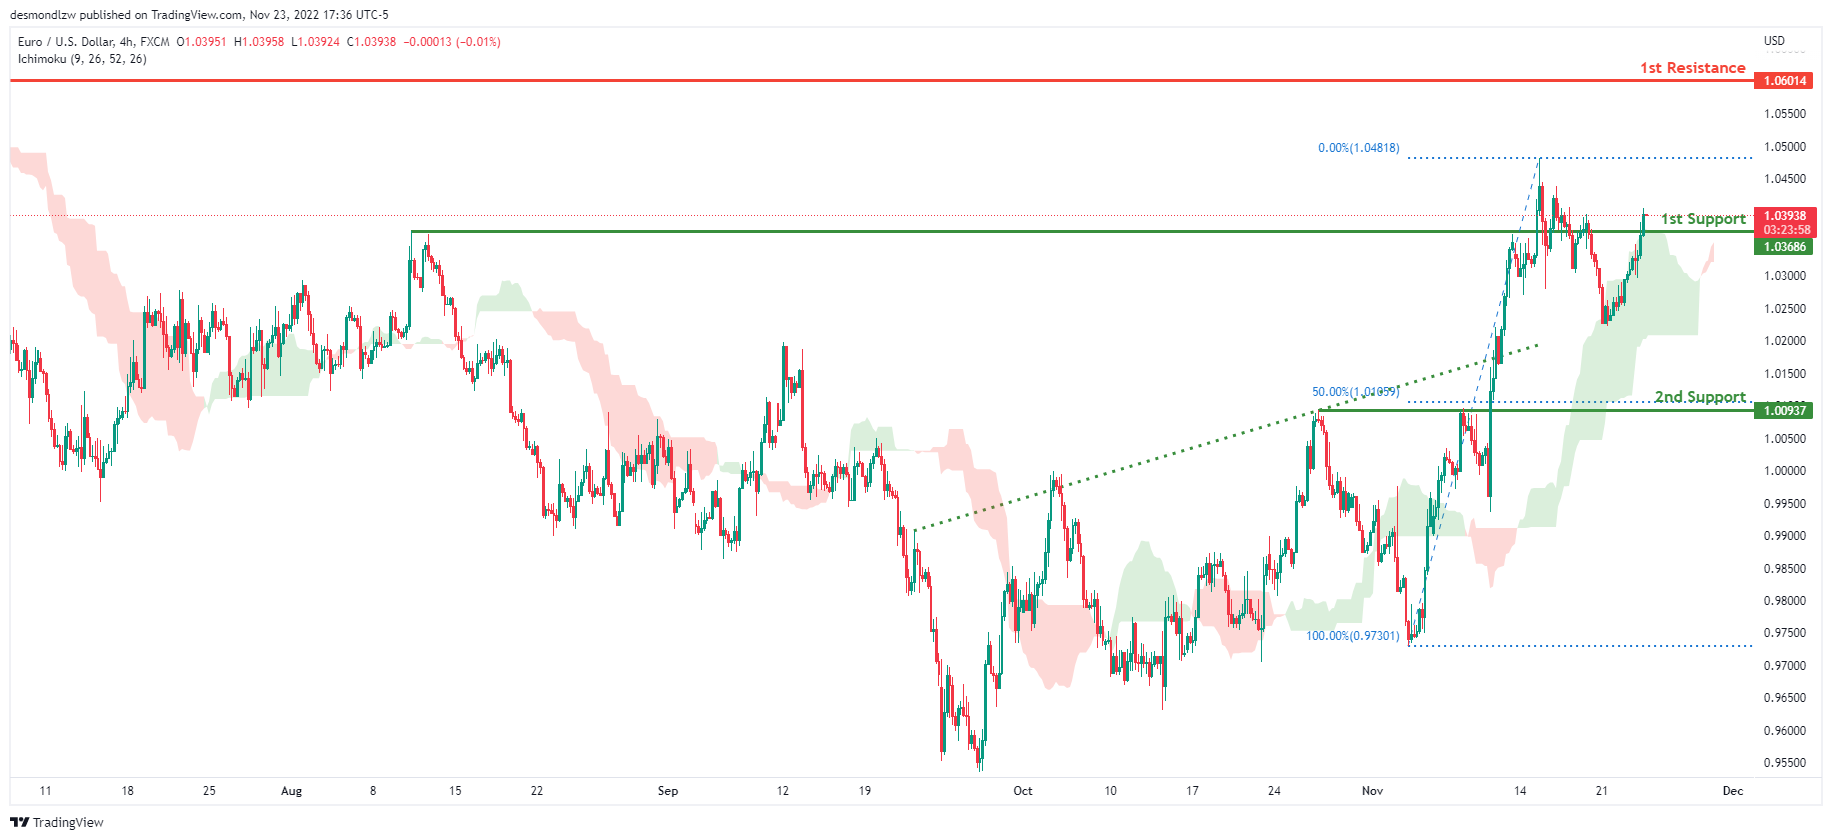
Looking at the H4 chart, my overall bias for EURUSD is bullish due to the current price being above the Ichimoku cloud, indicating a bullish market. To add confluence to this bias, price has also broken above the ascending trend line. If this bullish momentum continues, expect the price to possibly head towards the 1st resistance at 1.06014, where the previous swing high is located. In an alternate scenario, price could possibly head back down towards the 1st support level at 1.03686, where the previous swing high is located.
Areas of consideration :
- H4 1st resistance at 1.06014
- H4 1st support at 1.0368
GBP/USD:
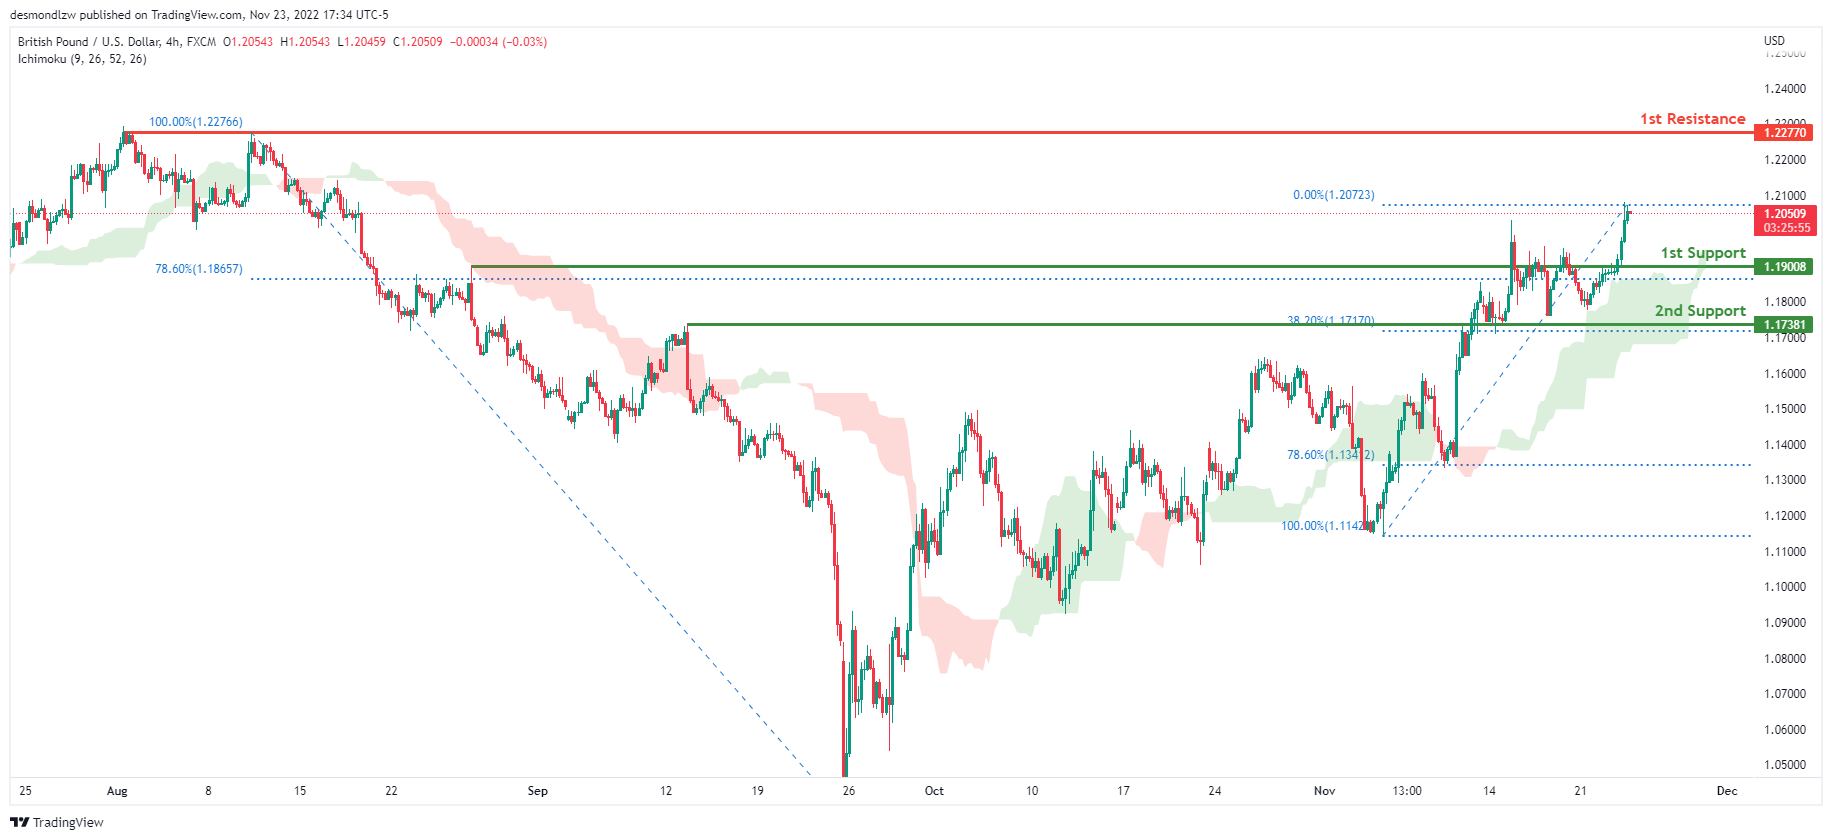
Looking at the H4 chart, my overall bias for GBPUSD is bullish due to the current price being above the Ichimoku cloud, indicating a bullish market. Expecting price to possibly head towards the 1st resistance line at 1.22770, where the previous swing high is. In an alternative scenario, price could possibly head back down to retest the 1st support line at 1.19008, where the 78.6% Fibonacci line is.
Areas of consideration:
- H4 1st resistance at 1.22770
- H4 1st support at 1.19008
USD/CHF:
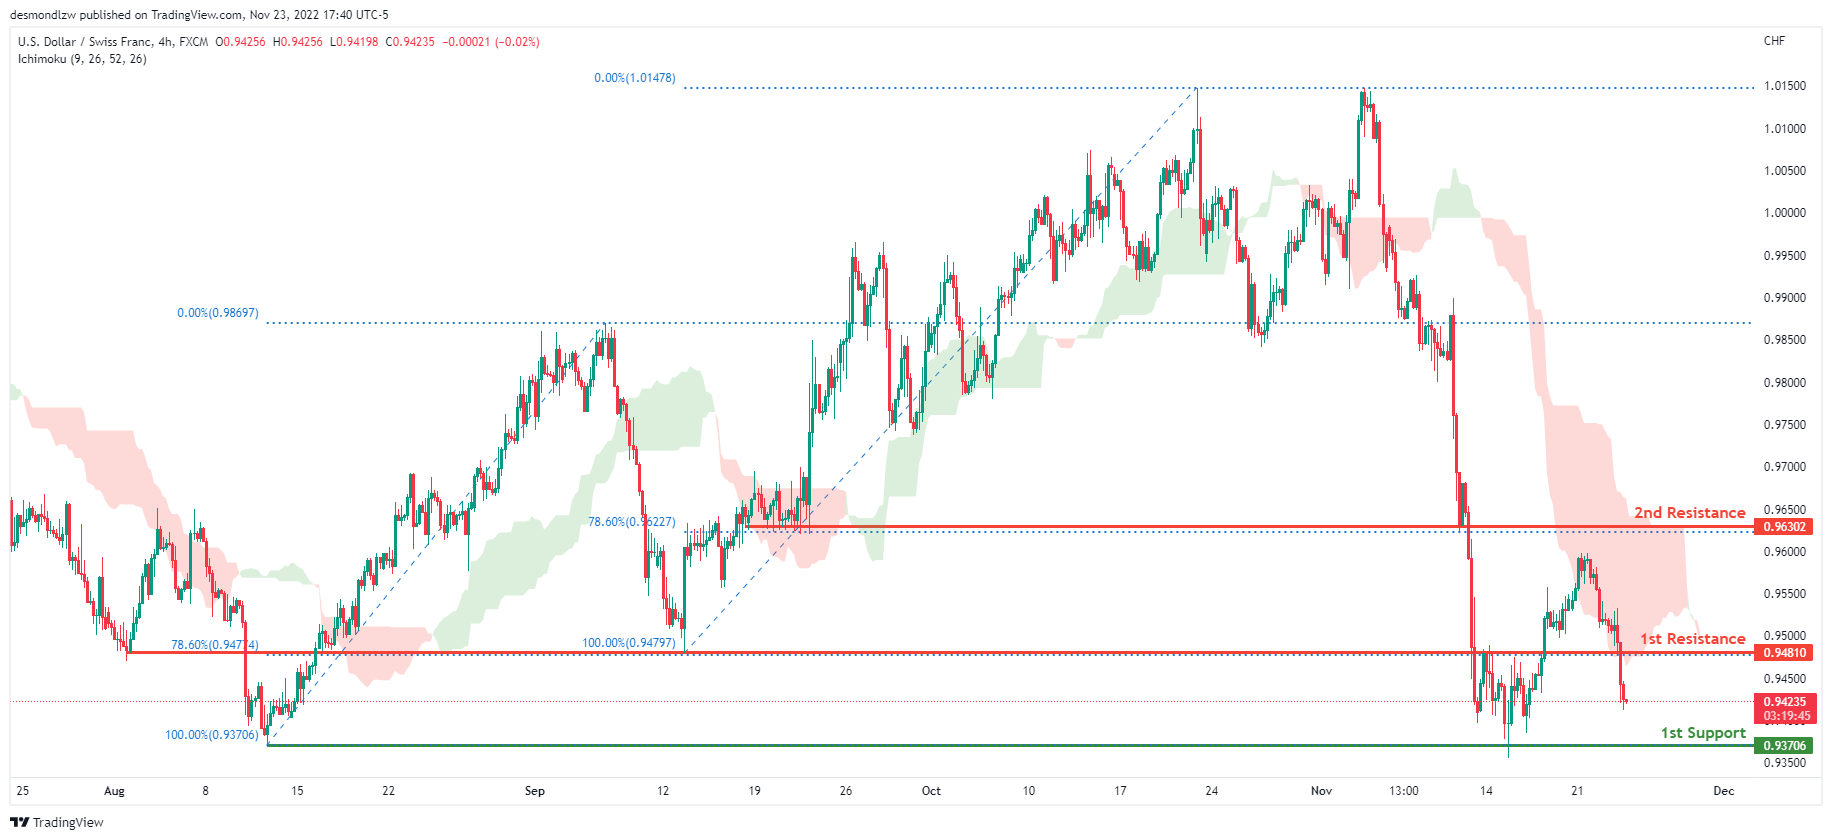
The overall bias for USDCHF on the H4 chart is bearish. In addition, the price is crossing below the Ichimoku cloud, indicating a bearish market. If the current bearish trend continues, expect price to continue heading towards the 1st support line at 0.93706, where the previous swing low is. In an alternate scenario, price could rise towards the 1st resistance line at 0.94810, where the 78.6% Fibonacci line is.
Areas of consideration
- H4 1st support at 0.93706
- H4 1st resistance at 0.94810
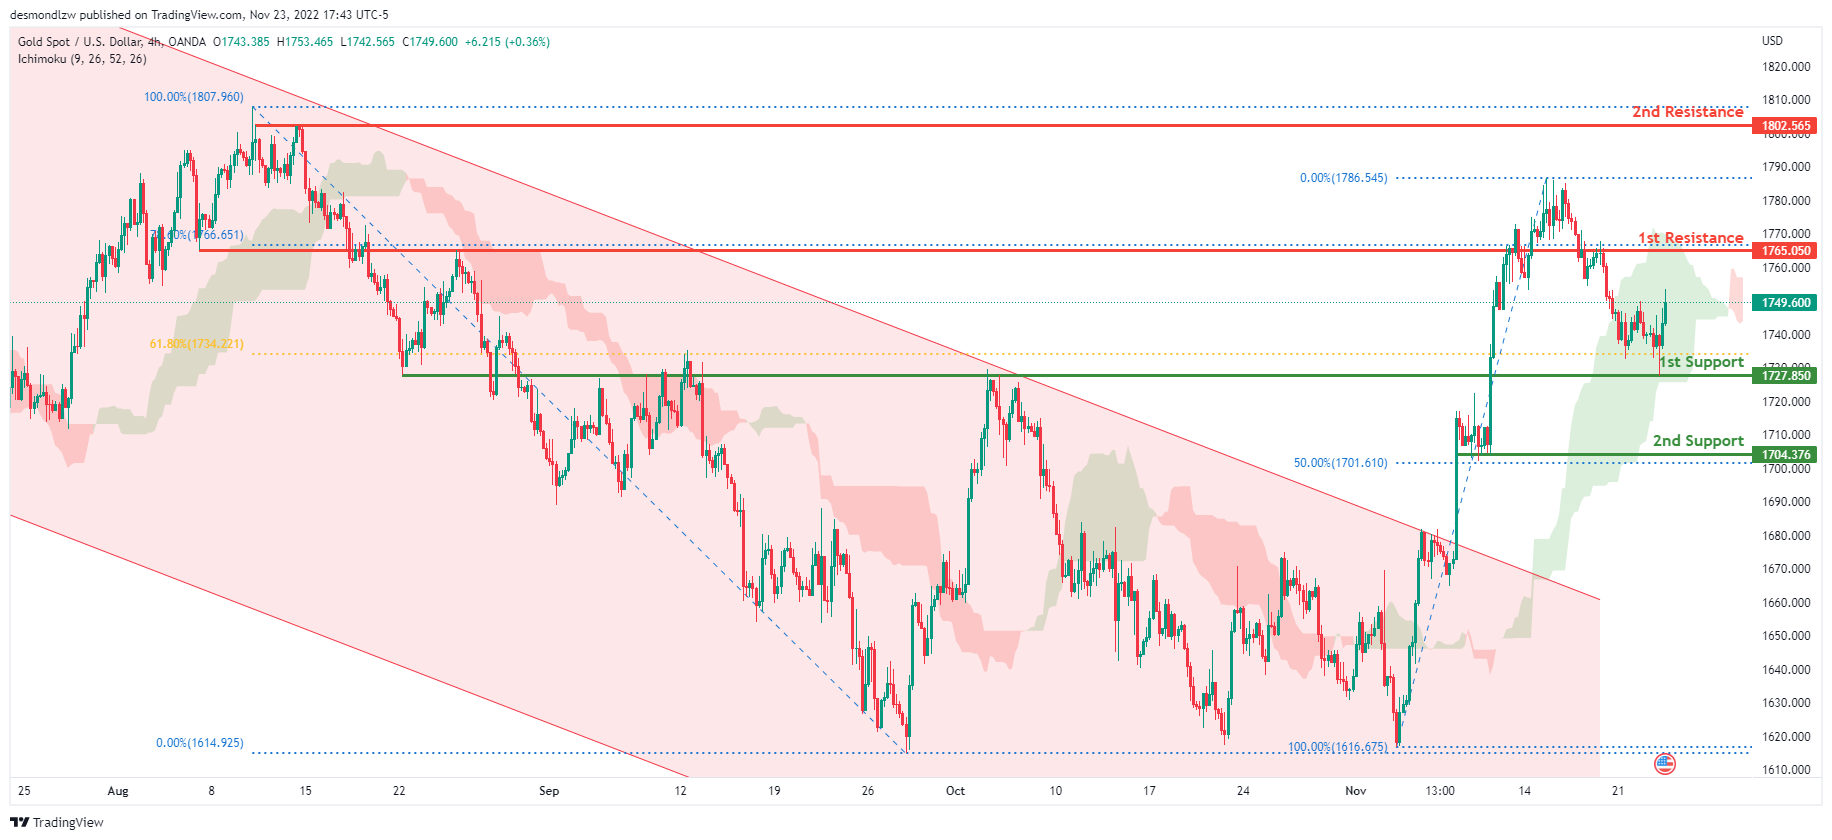
XAU/USD (GOLD):
Looking at the H4 chart, my overall bias for XAUUSD is bearish due to the current price crossing below the Ichimoku cloud, indicating a bearish market. If this bearish momentum continues, expect price to possibly head back down towards the 1st support level at 1727.850, where the 38.2% and 61.8% Fibonacci lines are located.
In an alternate scenario, price could possibly head back up towards the 1st resistance at 1765.050, where the 78.6% Fibonacci line is located.
Areas of consideration:
- H4 time frame, 1st resistance at 1765.483
- H4 time frame, 1st support at 1727.850
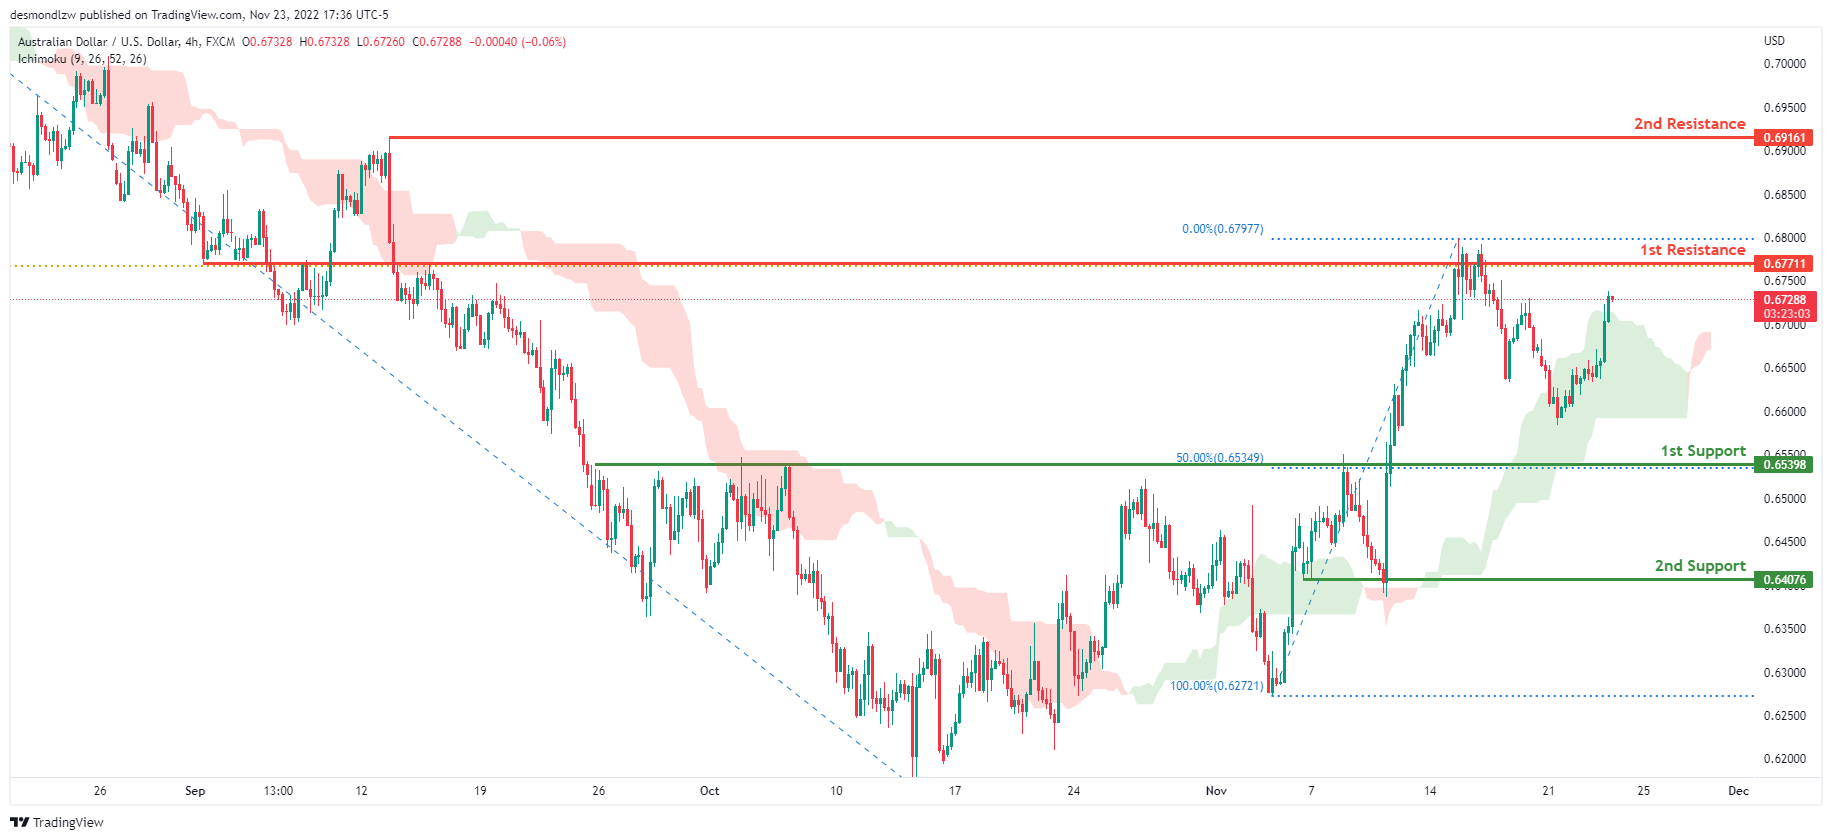
AUD/USD:
Looking at the H4 chart, my overall bias for ADUSD is bullish due to the current price being above the Ichimoku cloud, indicating a bullish market. Expecting price to continue heading towards the 1st resistance at 0.67711 where the 61.8% Fibonacci line is. In an alternative scenario, price could possibly head back down to retest the 1st support line at 0.65398 where the 50% Fibonacci line is.
Areas of consideration
- H4, 1st resistance at 0.67711
- H4, 1st support at 0.65398
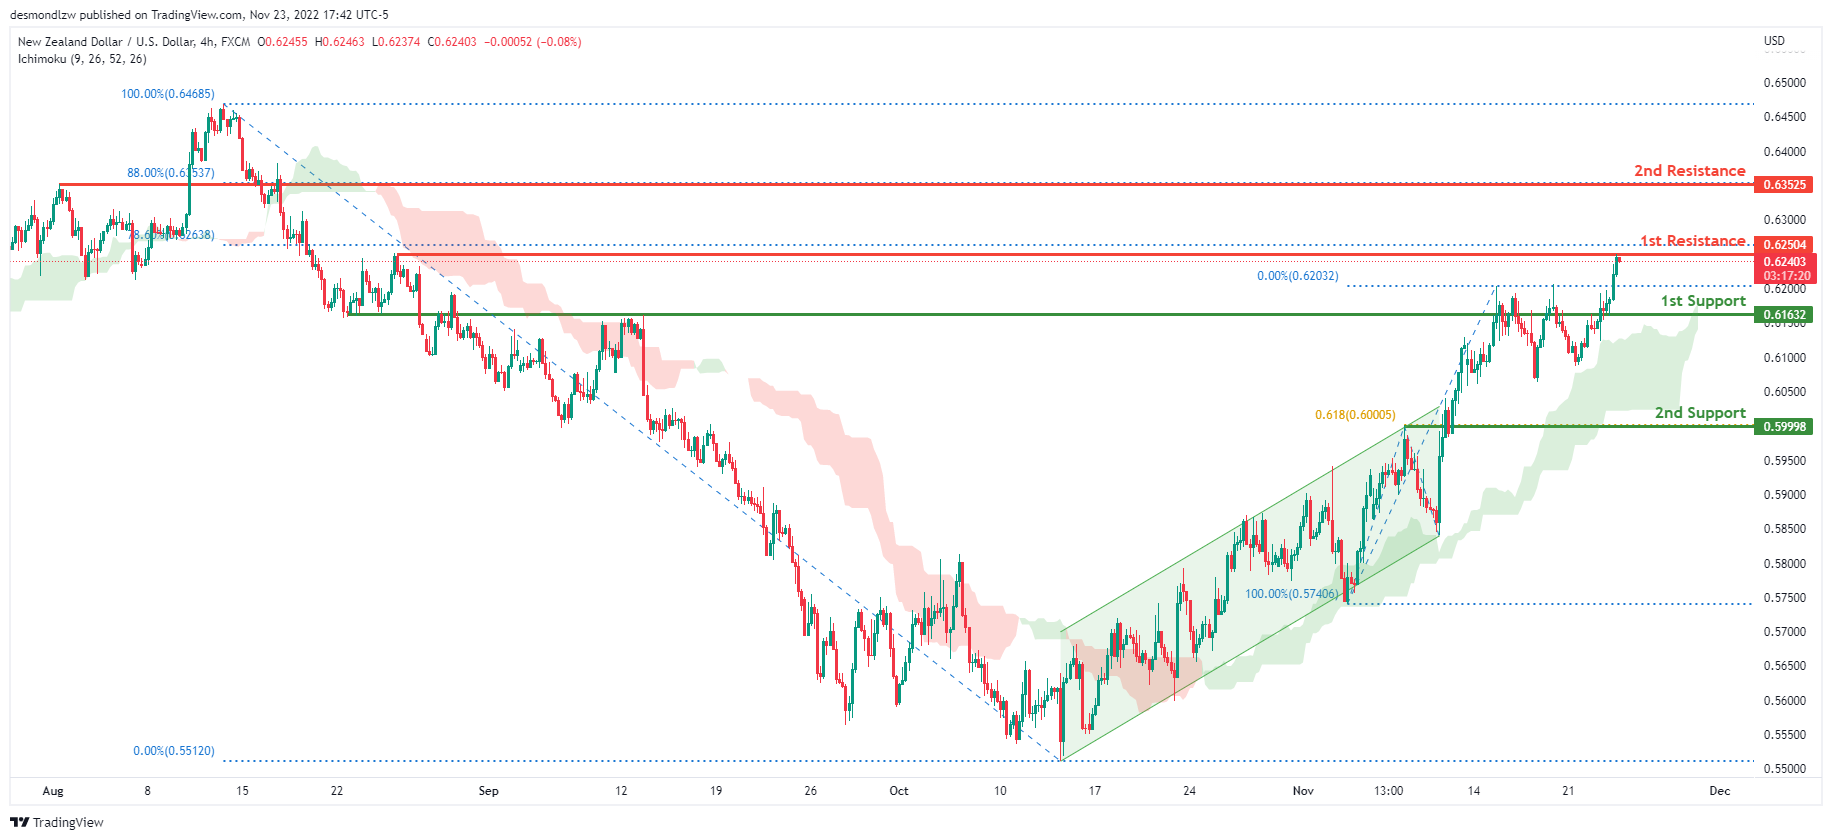
NZD/USD:
On the H4 chart, we have a bullish bias with the price moving above the Ichimoku cloud and has broken out of the ascending channel. If this bullish momentum continues, expect the price to break the 1st resistance line at 0.62504, where the 78.6% Fibonacci line is, before heading towards the 2nd resistance line at 0.63525, where the 88% Fibonacci line is. Alternatively, the price may head back down and break the 1st support at 0.61632, where the previous swing high is located, before heading towards the 2nd support at 0.59998 where the 61.8% Fibonacci line is.
Areas of consideration:
- H4 time frame, 1st resistance at 0.62504
- H4 time frame, 2nd resistance at 0.63525
- H4 time frame, 1st support at 0.61632
- H4 time frame, 2nd support at 0.59998
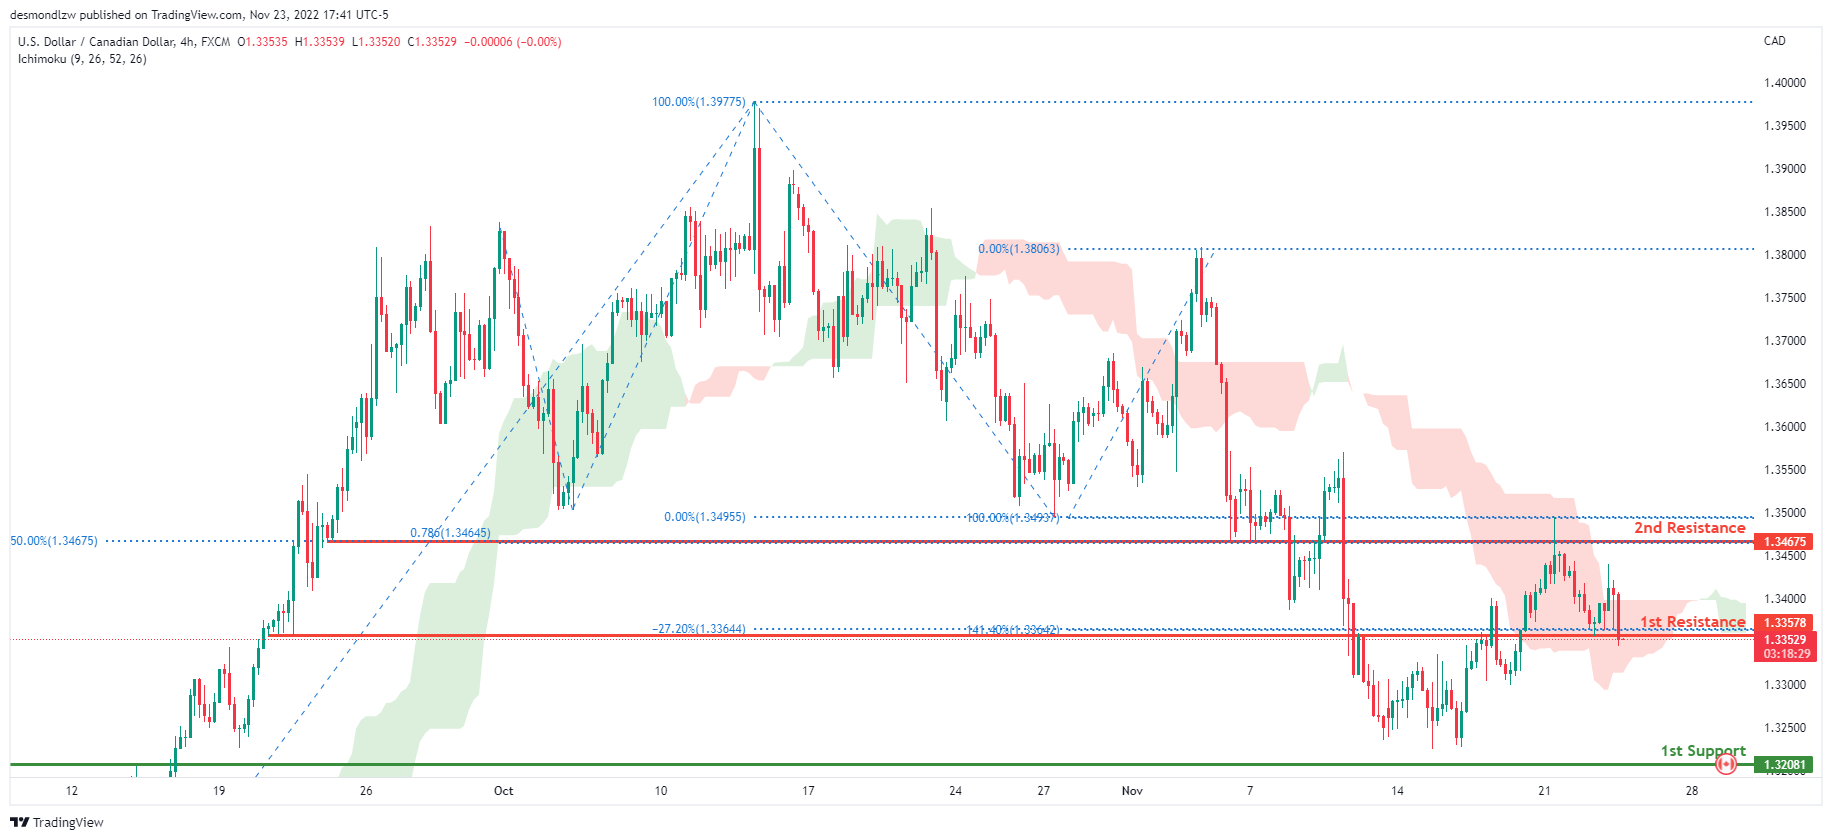
USD/CAD:
On the H4 chart, the overall bias for USDCAD is bearish. To add confluence to this, the price is crossing below the Ichimoku cloud which indicates a bearish market. If this bearish momentum continues, expect the price to continue heading towards the 1st support line at 1.32081 where the 78.6% Fibonacci line is located. In an alternative scenario, price could head back up to retest the 1st resistance line at 1.33578, where the -27.2% Fibonacci expansion line and 141.4% Fibonacci line is.
Areas of consideration:
- H4 time frame, 1st resistance at 1.33578
- H4 time frame, 1st support at 1.32081
OIL:
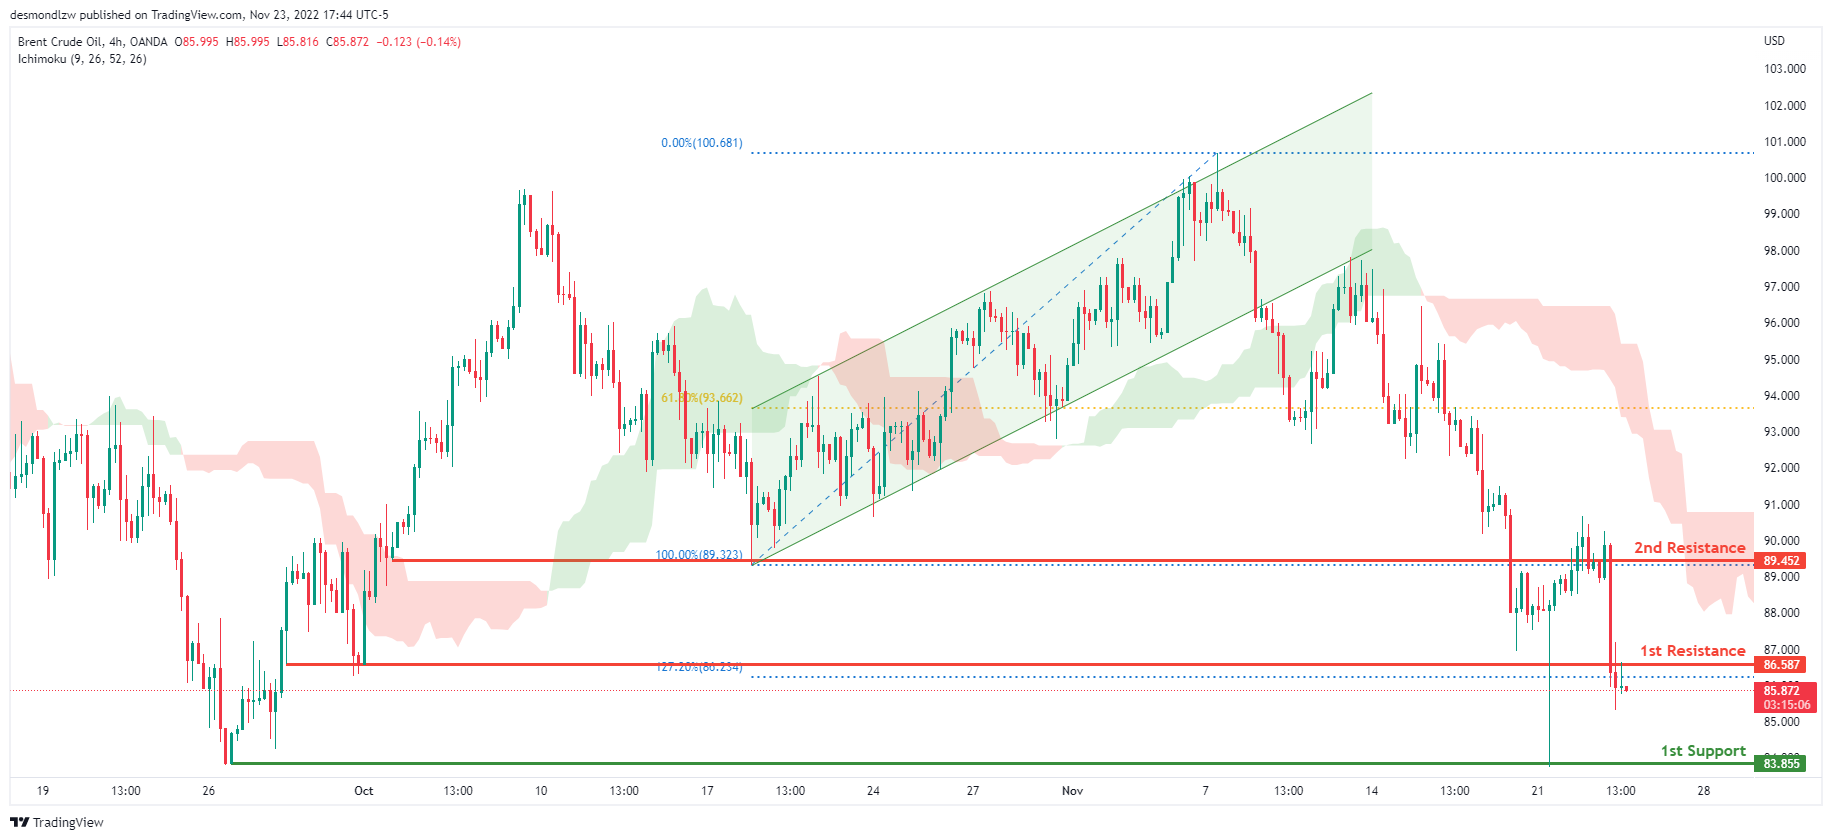
Looking at the H4 chart, my overall bias for BCOUSD is bearish due to the current price being below the Ichimoku cloud, indicating a bearish market. If this bearish momentum continues, expect price to possibly head towards the 1st support at 83.855, where the previous swing low is located. In an alternate scenario, price could possibly head back up to retest the 1st resistance level at 86.587, where the 127.2% Fibonacci extension line is located.
Areas of consideration:
- H4 time frame, 1st resistance at 86.587
- H4 time frame, 1st support at 83.855
- H4 time frame, 2nd support at 89.452
Dow Jones Industrial Average:
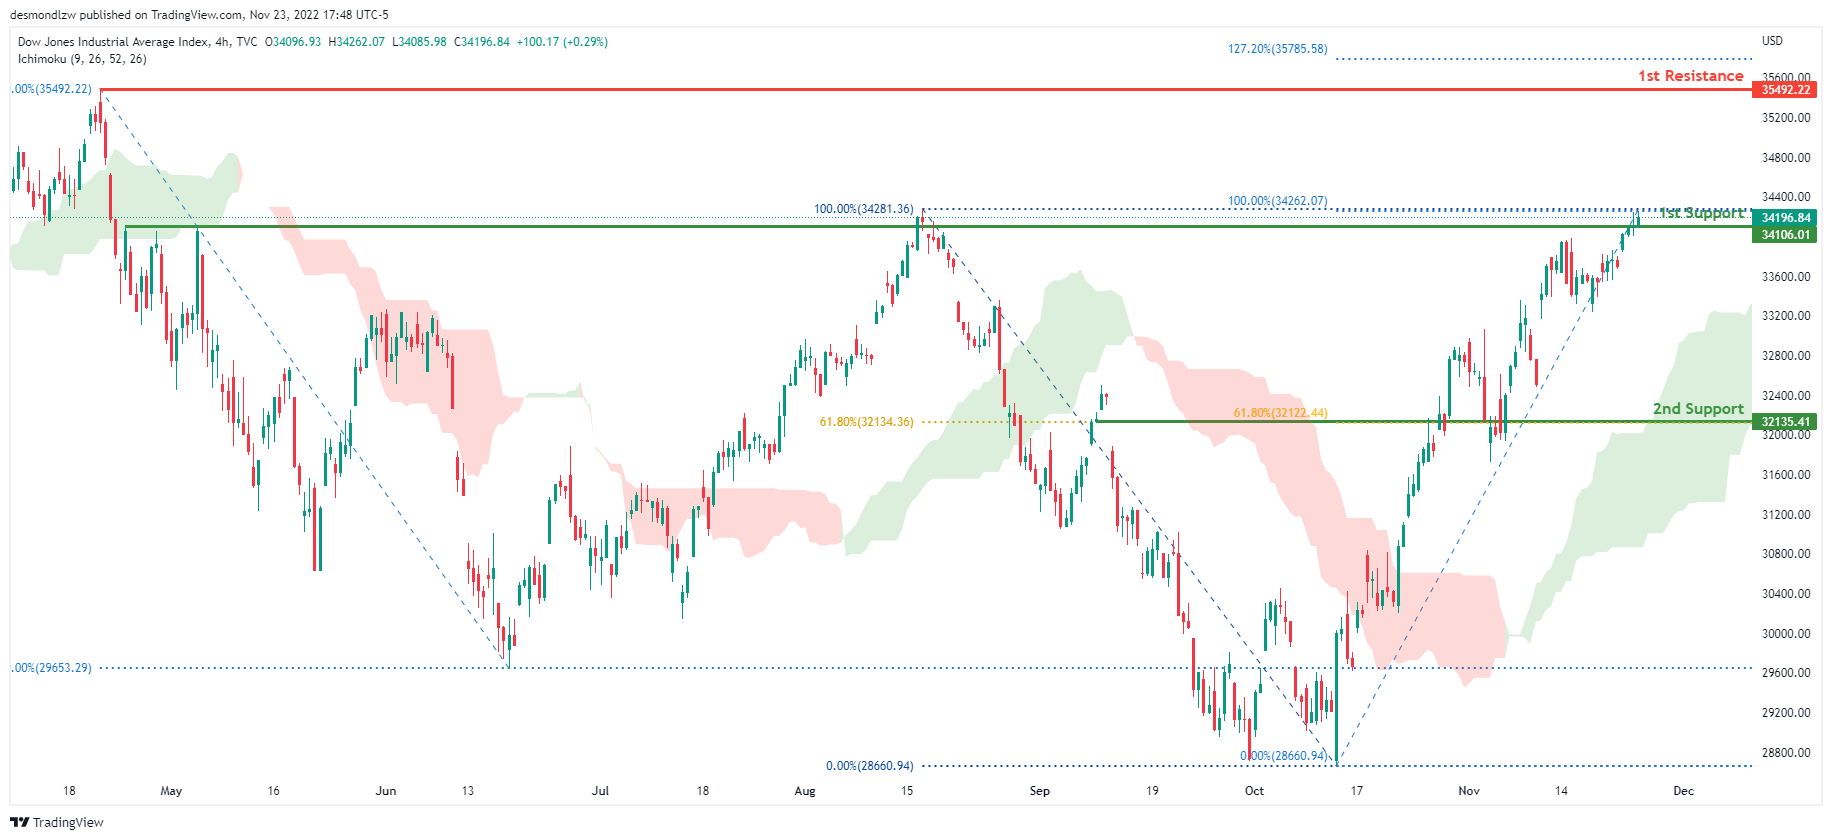
On the H4 chart, the overall bias for DJI is bullish. To add confluence to this, the price is above the Ichimoku cloud which indicates a bullish market. If this bullish momentum continues, expect the price to continue heading towards the 1st resistance line at 35492.22, where the previous swing high and 127.2% Fibonacci extension line is. In an alternative scenario, price could head back down breaking the 1st support line at 34106.01, where the previous swing high is before heading towards the 2nd support at 32135.41, where the 61.8% Fibonacci line is.
Areas of consideration:
- H4 time frame, 1st support at 34106.01
- H4 time frame, 2nd support at 32135.41
- H4 time frame, 1st Resistance at 35492.22
DAX:
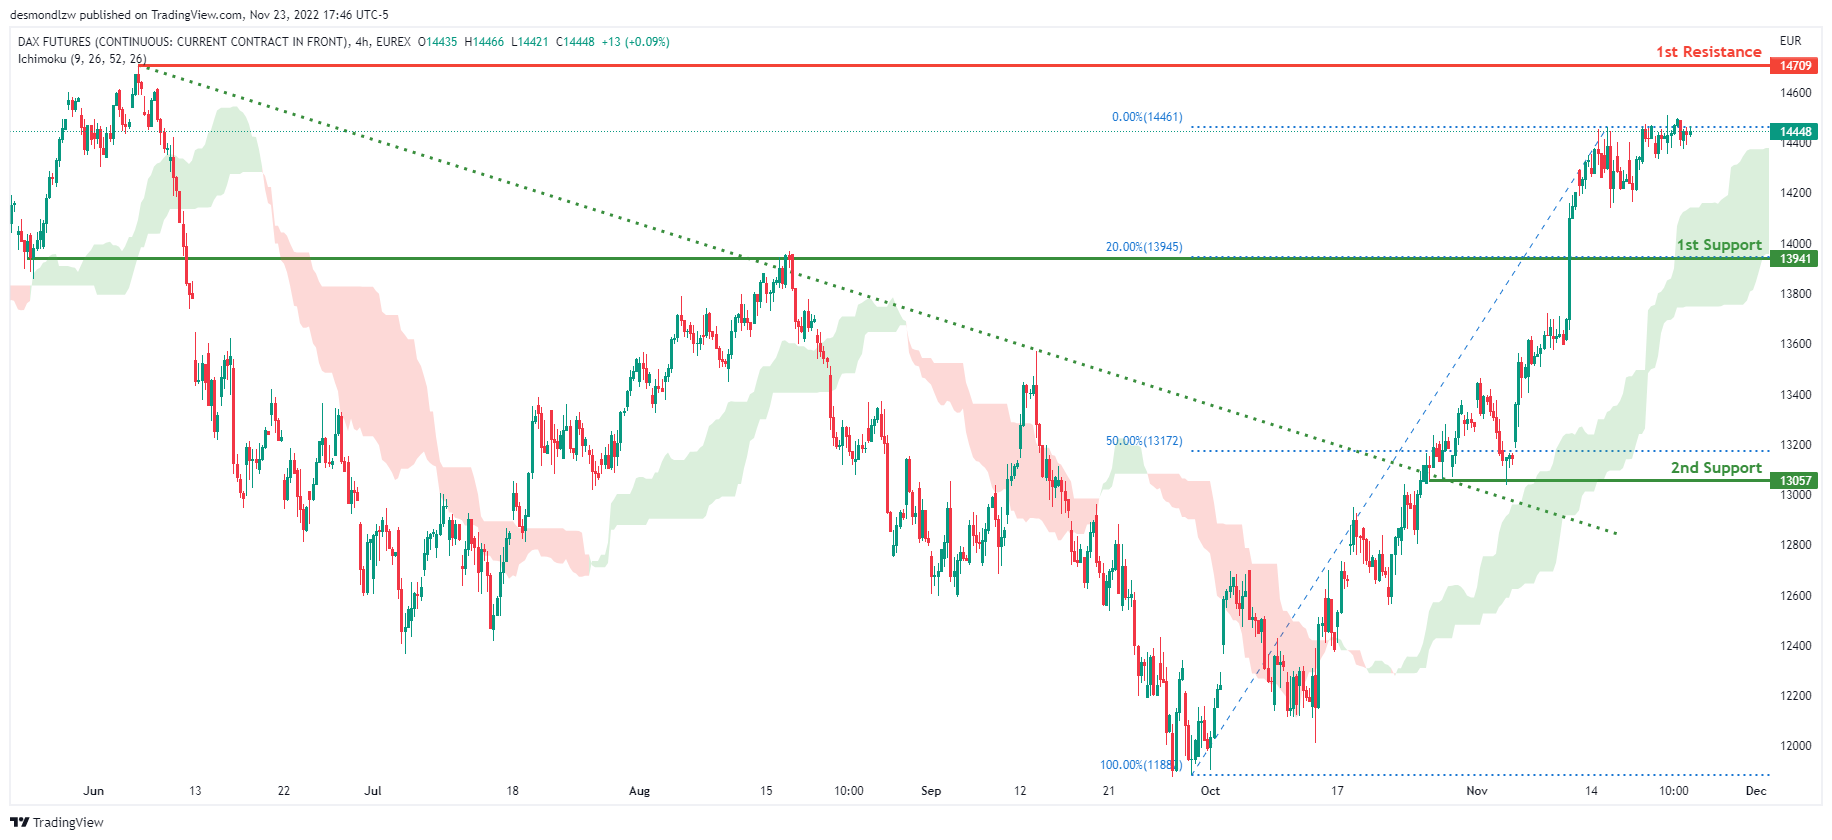
The H4 chart shows a bullish bias, with price breaking through the descending trendline and rising above the Ichimoku cloud. Price is expected to maintain its bullish momentum and rise to the first resistance level at 14709, where the previous swing high is located. Alternatively, the price could fall to the first support level at 13941, which corresponds to the 20% Fibonacci line.
Areas of consideration:
- H4 time frame, 1st resistance is at 14709
- H4 time frame, 1st support is at 13941
ETHUSD:
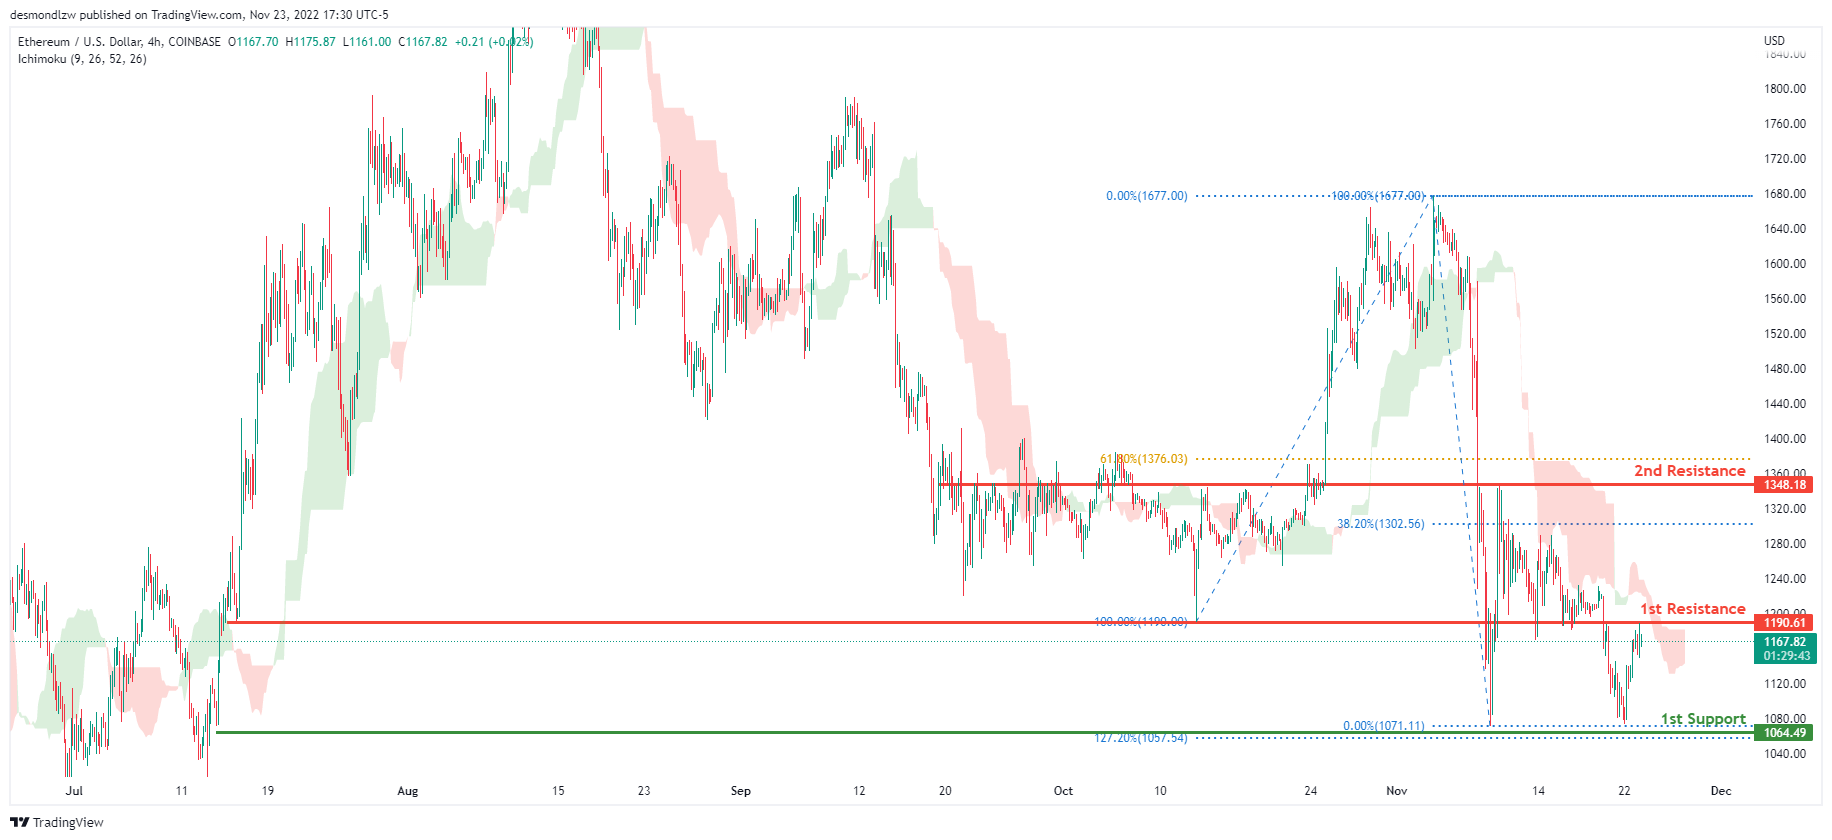
Looking at the H4 chart, my overall bias for ETHUSD is bearish due to the current price being below the Ichimoku cloud, indicating a bearish market .If this bearish momentum continues, expect price to possibly head towards the 1st support at 1064.49, where the -27.2% Fibonacci expansion line and 127.2% Fibonacci extension line are located. In an alternate scenario, price could possibly head back up towards the 1st resistance level at 1190.61, where the previous swing low is located.
Areas of consideration:
- H4 time frame, 1st resistance of 1190.61
- H4 time frame, 1st support at 1064.49
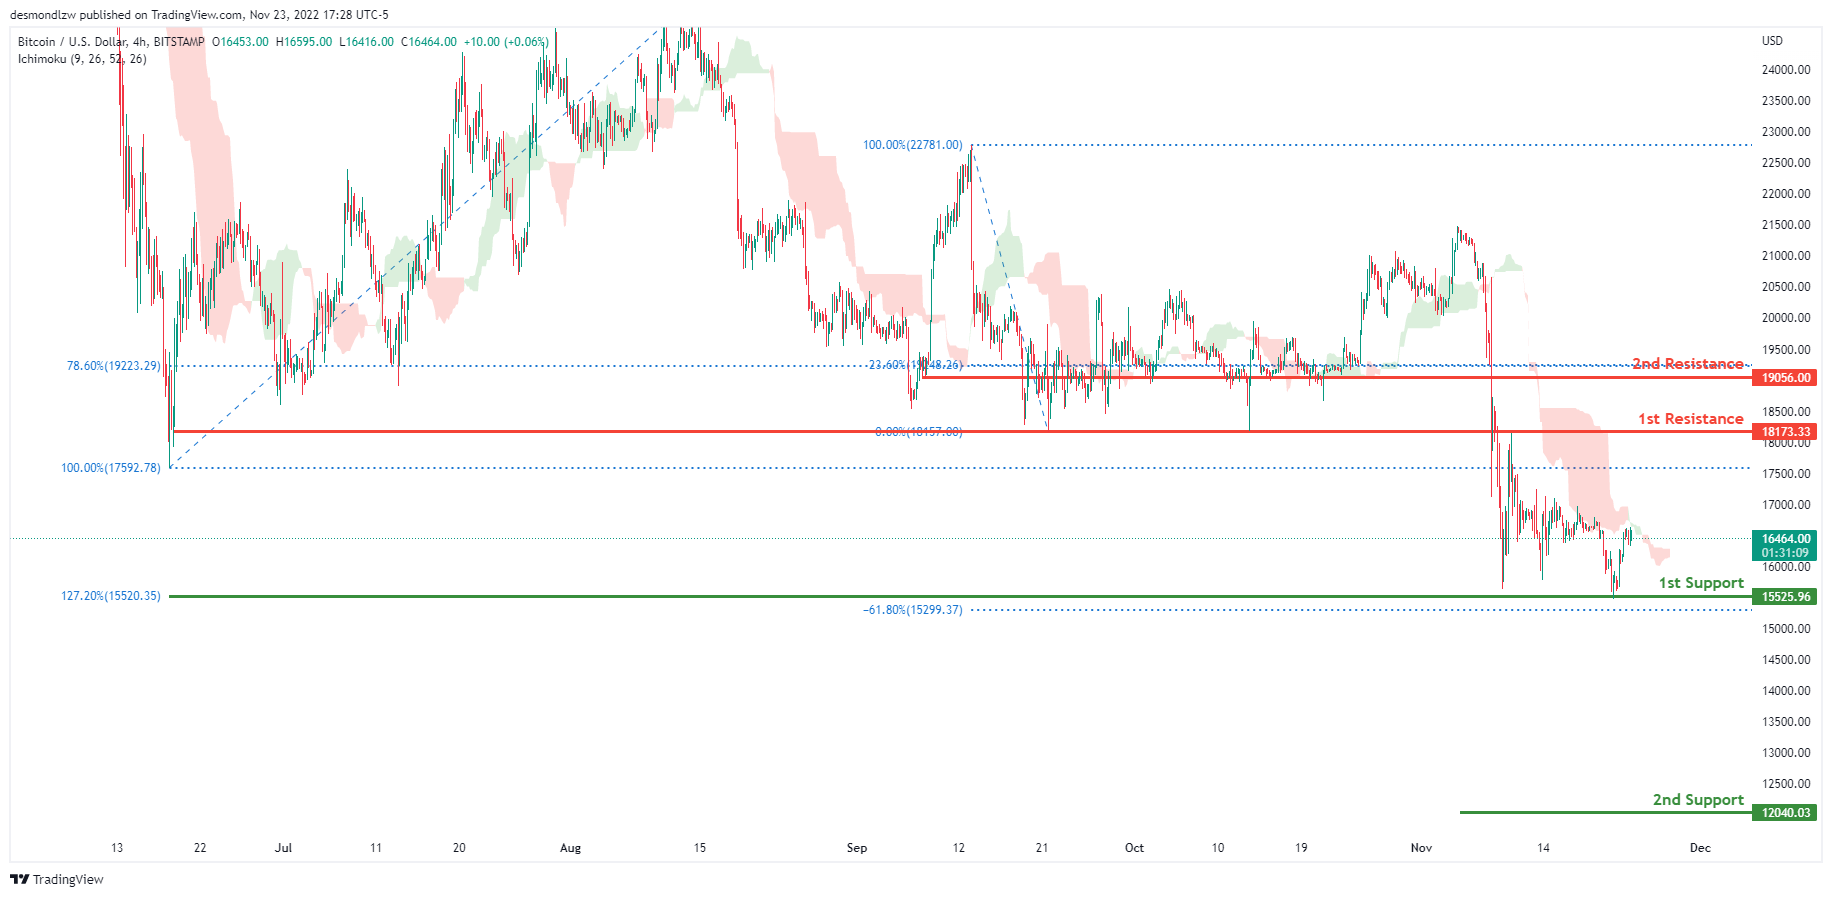
BTCUSD:
On the H4 chart, the overall bias for BTCUSD is bearish. To add confluence to this, the price is below the Ichimoku cloud which indicates a bearish market. If this bearish momentum continues, expect the price to head towards the 1st support line at 15525.96, where the 127.2% Fibonacci extension line and -61.8% Fibonacci expansion line is located. If price breaks the 1st support line, price could possibly head towards the 2nd support line at 12040.03 where the -61.8% Fibonacci expansion line is located. In an alternative scenario, price could head back up to retest the 1st resistance line at 18173.33, where the previous low and 0% Fibonacci line is located.
Areas of consideration:
- H4 time frame, 1st resistance 18173.33
- H4 time frame, 1st support at 15525.96
- H4 time frame, 2nd support at 12040.03
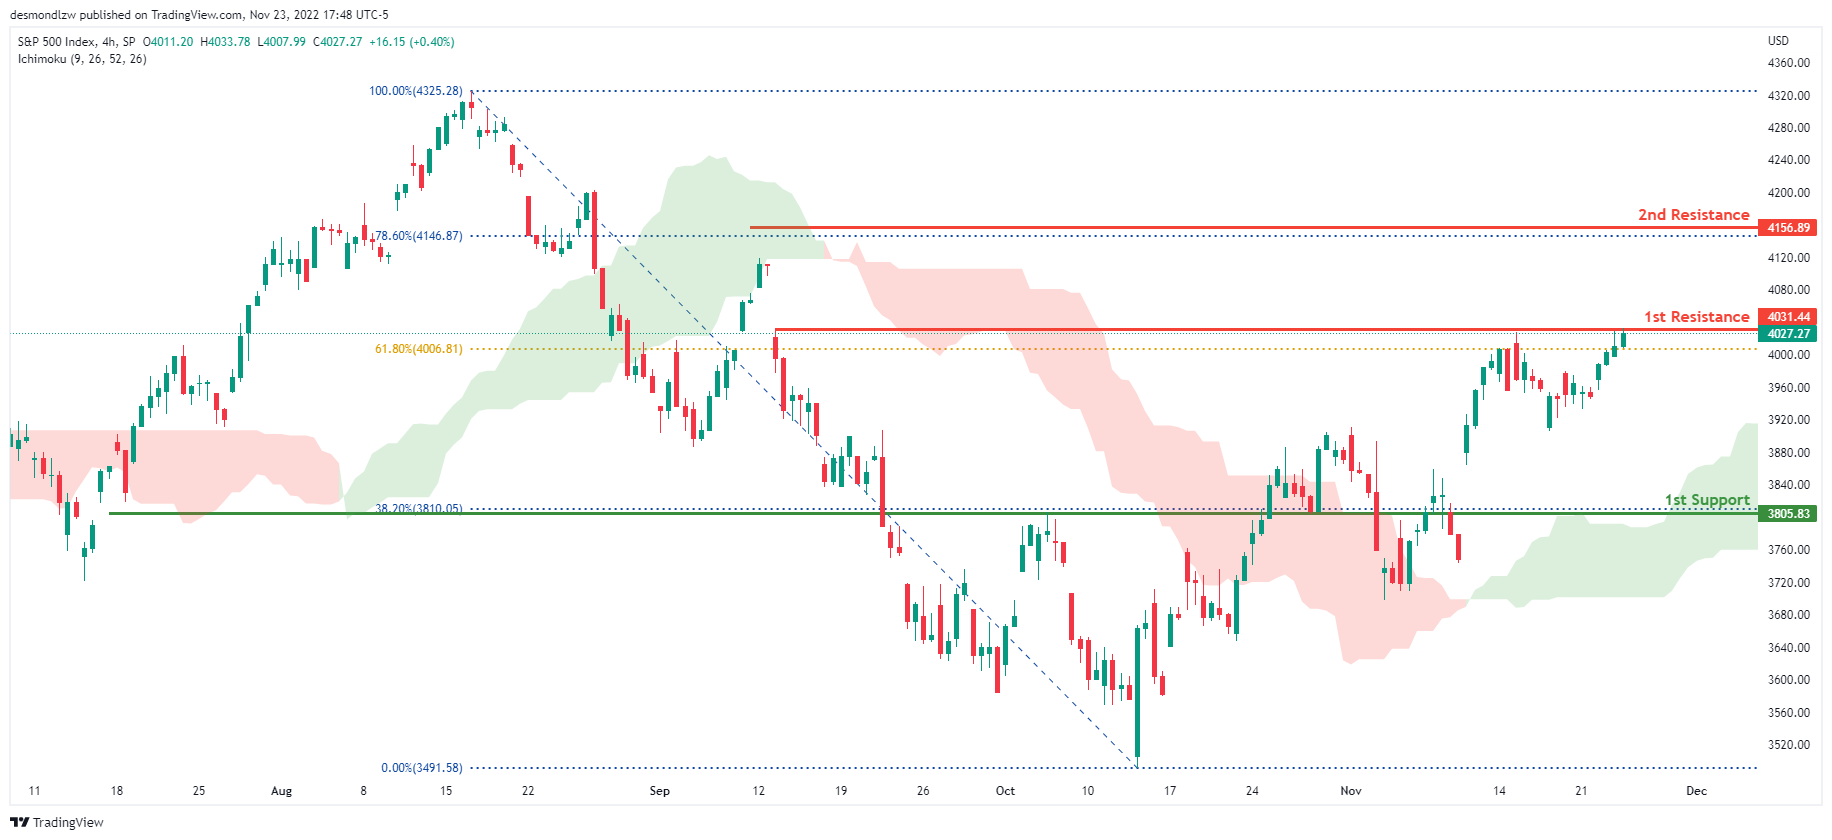
S&P 500:
The overall bias for the S&500 on the H4 chart is bullish, with prices above the Ichimoku cloud. If the bullish momentum continues, the price will rise to the first resistance line at 4011.74, where the 61.8% Fibonacci line is located. If the first resistance line is broken, the second resistance line is at 4119.28, which is the previous swing high and the 78.6% Fibonacci line. In an alternate scenario, price could return to the first support line at 3805.83, where the 38.2% Fibonacci line is located.
Areas of consideration:
- H4 time frame, 1st support at 3805.83
- H4 time frame, 1st resistance at 4011.74
- H4 time frame, 2nd resistance at 4119.28
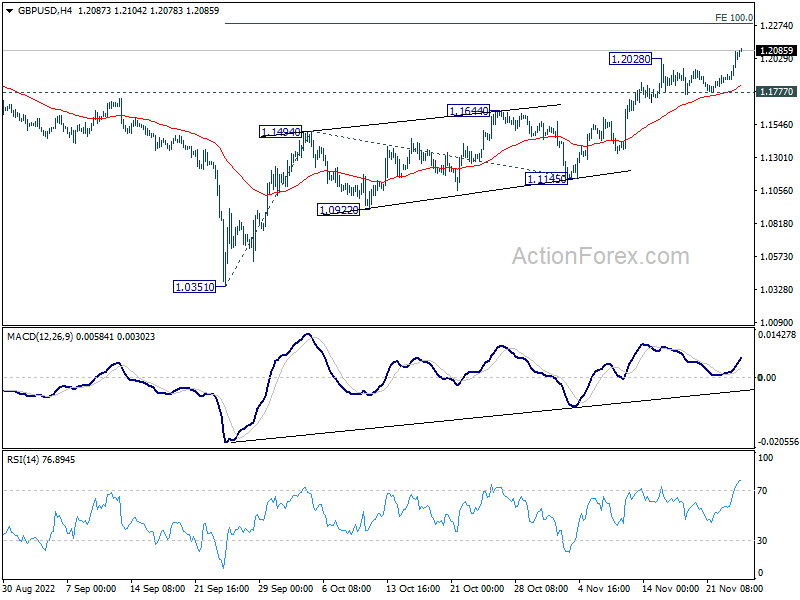
GBP/USD Daily Outlook
Daily Pivots: (S1) 1.1925; (P) 1.2003; (R1) 1.2133; More...
GBP/USD's rally from 1.0351 resumed by breaking through 1.2028 and intraday bias is back on the upside. Further rise should be seen to 100% projection of 1.0351 to 1.1494 from 1.1145 at 1.2288 first. Sustained break there will pave the way to 1.2759 medium term fibonacci level. For now, break of 1.1777 support is needed to indicate short term topping. Otherwise, outlook will remain bullish in case of retreat.
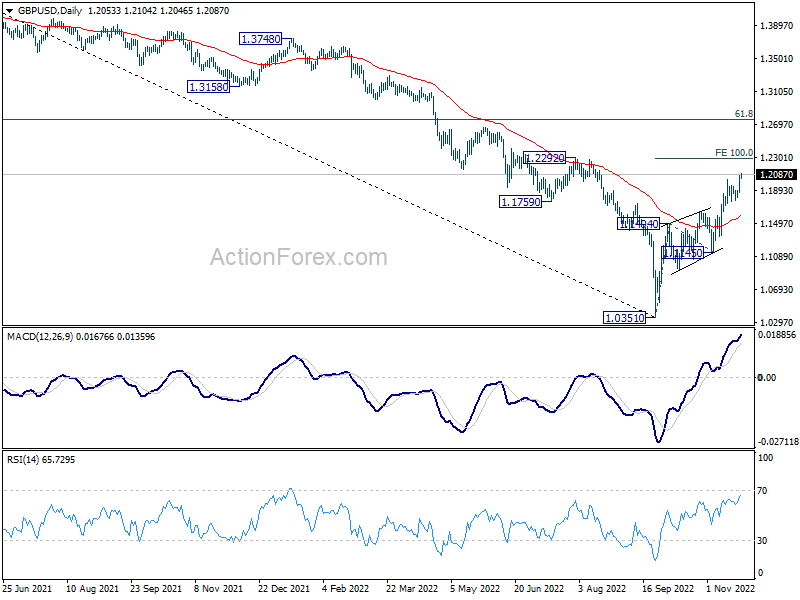
In the bigger picture, rise from 1.0351 medium term bottom is at least correcting whole down trend from 1.4248 (2021 high). Further rise is expected as long as 1.1145 support holds. Next target is 61.8% retracement of 1.4248 to 1.0351 at 1.2759. Sustained break there will pave the way back to 1.4248.
Dollar Down as Substantial Majority of Fed Members Judged Slowing Hike Soon Appropriate
Dollar is sold off broadly after FOMC minutes indicated that a "substantial majority" of policymakers judged that slowing rate hike would "soon be appropriate". For now, New Zealand Dollar is the strongest for the week, supported by RBNZ's big rate hike. It's followed by Sterling, and then Swiss Franc. Canadian Dollar and Yen are lagging behind others in the rally against the greenback. Euro is also mixed only, dragged by selloff against other Europeans.
Technically, GBP/USD's break of 1.2028 resistance confirms resumption of recent rally. Focuses are now on 1.0481 resistance in EUR/USD, 0.6796 resistance in AUD/USD, 0.9355 support in USD/CHF, and 137.66 support in USD/JPY. Break of these levels will confirm that broad-based selloff in Dollar is back.
In Asia, at the time of writing, Nikkei is up 1.08%. Hong Kong HSI is up 0.43%. China Shanghai SSE is down -0.11%. Singapore Strait Times is down -0.13%. Japan 10-yaer JGB yield is up 0.0046 at 0.249. Overnight, DOW rose 0.28%. S&P 500 rose 0.59%. NASDAQ rose 0.99%. 10-year yield dropped -0.052 to 3.706.
FOMC Minutes: A substantial majority judged slowing rate hikes soon appropriate
The minutes of FOMC November 1-2 meeting noted, the considerations that would influence the pace of future rate hikes include "the cumulative tightening of monetary policy to date, the lags between monetary policy actions and the behavior of economic activity and inflation, and economic and financial developments".
"A number of participants" observed that, as monetary policy approached a stance that was "sufficiently restrictive", it would become appropriate to slow the pace of rates increase.
Also, "a substantial majority of participants judged that a slowing in the pace of increase would likely soon be appropriate".
BoC Macklem: We're getting closer on rates, but not there yet
BoC Governor Tiff Macklem told a parliamentary committee yesterday that the central bank is "still far from its goal" of ensuring "low, stable, predictable" inflation.
"Inflation has come down in recent months, but we have yet to see a generalized decline in price pressures," Macklem said. "This tightening phase will draw to a close. We are getting closer, but we are not there yet."
"We anticipate that (inflation) will stay quite high for the rest of this year. It will start to decline next year," he noted.
RBNZ Orr: We are officially contractionary with monetary policy
RBNZ Governor Adrian Orr told a parliamentary committee, "We can all put our hands on our hearts across the committee and say we are officially contractionary with our monetary policy at this point."
"We need to get actual and expected inflation down," Orr said. "The committee agreed that we need to reach a higher level Official Cash Rate sooner than previously anticipated."
"It is the misery of inflation that is the problem here and that is the problem we are working to resolve," Orr said.
"Our biggest surprises since August has been the persistence of global inflation... and domestically we are seeing price pressure everywhere," said Orr.
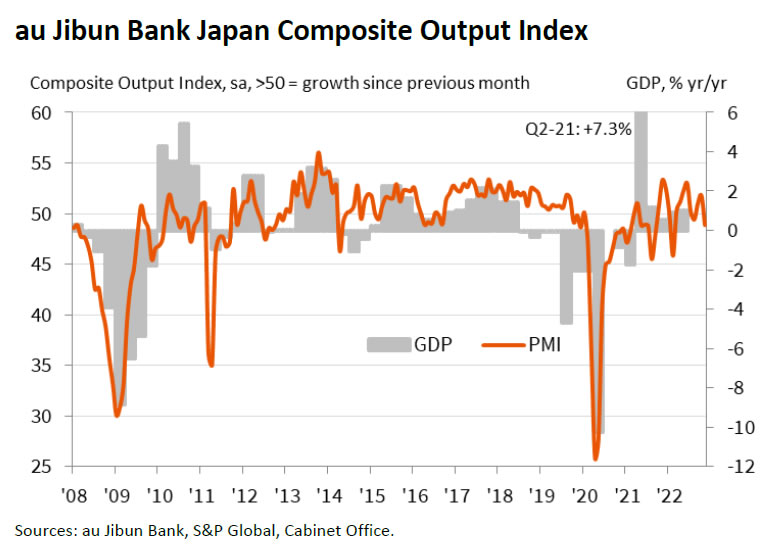
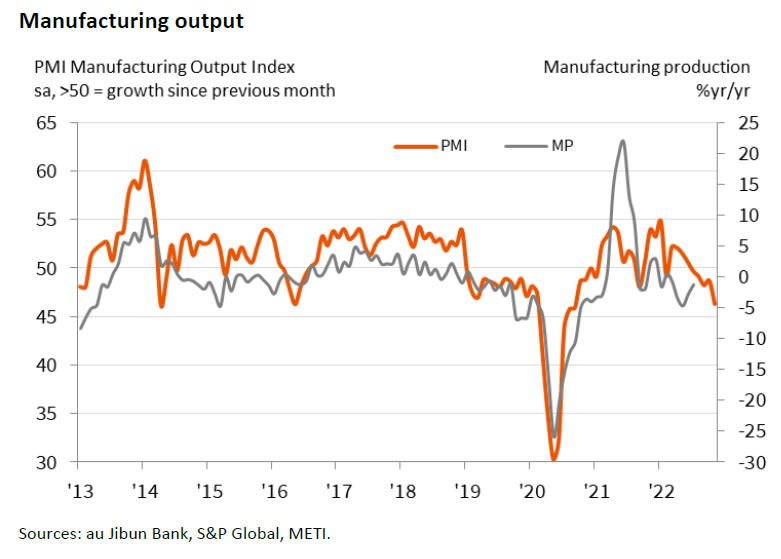
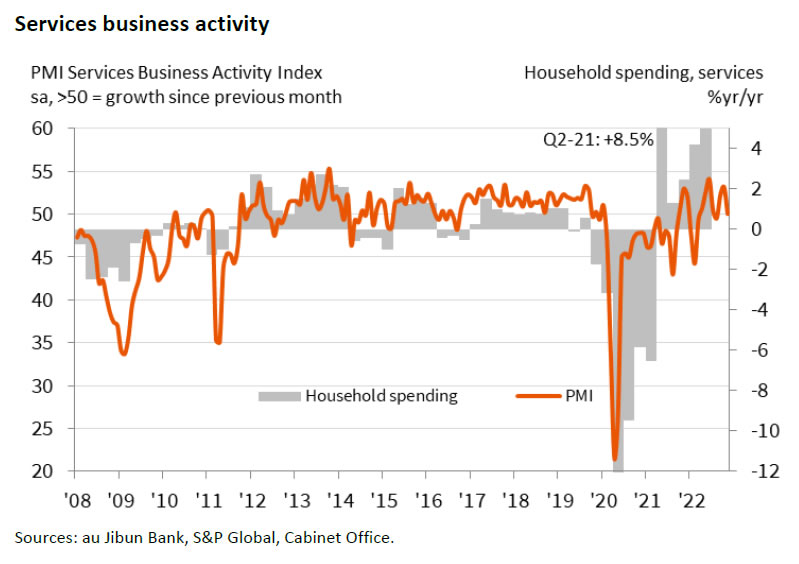
Japan PMI manufacturing dropped to 49.4, services down to 50
Japan PMI Manufacturing dropped from 50.7 to 49.4 in November, below expectation of 50.7. That's the first contraction reading since January 2021. PMI Services dropped from 53.2 to 50.0. PMI Composite dropped from 51.8 to 48.9.
Laura Denman, Economist at S&P Global Market Intelligence, said:
"Activity at Japanese private sector firms declined for the first time in three months, according to November flash PMI data. Central to the latest downturn was a poor performance at Japanese manufacturing firms. Cooling demand conditions and acute inflationary pressures reportedly continued to hamper output and new orders... Meanwhile, services firms signalled no change in activity levels from the month prior."
Looking ahead
Germany Ifo business climate is the main focus in European session. ECB will also publish monetary policy meeting accounts.
GBP/USD Daily Outlook
Daily Pivots: (S1) 1.1925; (P) 1.2003; (R1) 1.2133; More...
GBP/USD's rally from 1.0351 resumed by breaking through 1.2028 and intraday bias is back on the upside. Further rise should be seen to 100% projection of 1.0351 to 1.1494 from 1.1145 at 1.2288 first. Sustained break there will pave the way to 1.2759 medium term fibonacci level. For now, break of 1.1777 support is needed to indicate short term topping. Otherwise, outlook will remain bullish in case of retreat.
In the bigger picture, rise from 1.0351 medium term bottom is at least correcting whole down trend from 1.4248 (2021 high). Further rise is expected as long as 1.1145 support holds. Next target is 61.8% retracement of 1.4248 to 1.0351 at 1.2759. Sustained break there will pave the way back to 1.4248.
Economic Indicators Update
| GMT | Ccy | Events | Actual | Forecast | Previous | Revised |
|---|---|---|---|---|---|---|
| 00:30 | JPY | Manufacturing PMI Nov P | 49.4 | 50.7 | 50.7 | |
| 09:00 | EUR | Germany IFO Business Climate Nov | 85 | 84.3 | ||
| 09:00 | EUR | Germany IFO Current Assessment Nov | 93.6 | 94.1 | ||
| 09:00 | EUR | Germany IFO Expectations Nov | 77 | 75.6 | ||
| 12:30 | EUR | ECB Monetary Policy Meeting Accounts |
Japan PMI manufacturing dropped to 49.4, services down to 50
Japan PMI Manufacturing dropped from 50.7 to 49.4 in November, below expectation of 50.7. That's the first contraction reading since January 2021. PMI Services dropped from 53.2 to 50.0. PMI Composite dropped from 51.8 to 48.9.
Laura Denman, Economist at S&P Global Market Intelligence, said:
"Activity at Japanese private sector firms declined for the first time in three months, according to November flash PMI data. Central to the latest downturn was a poor performance at Japanese manufacturing firms. Cooling demand conditions and acute inflationary pressures reportedly continued to hamper output and new orders... Meanwhile, services firms signalled no change in activity levels from the month prior."