
Sample Category Title
USD/CHF Weekly Outlook
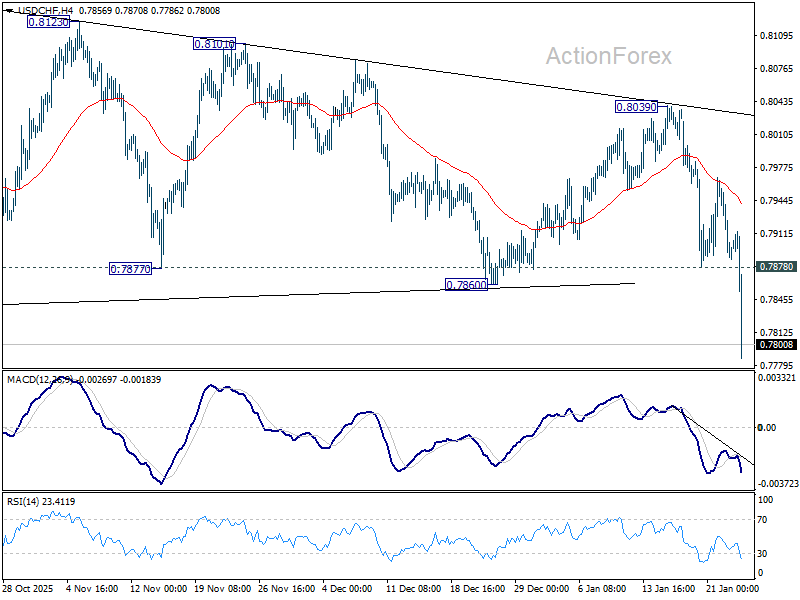
USD/CHF's steep decline and break of 0.7828 low last week confirms long term down trend resumption. Initial bias stays on the downside this week. Next target is 0.7382 projection level. On the upside, above 0.7878 minor resistance will turn intraday bias neutral first. But recovery should be limited well below 0.8039 resistance to bring another fall.
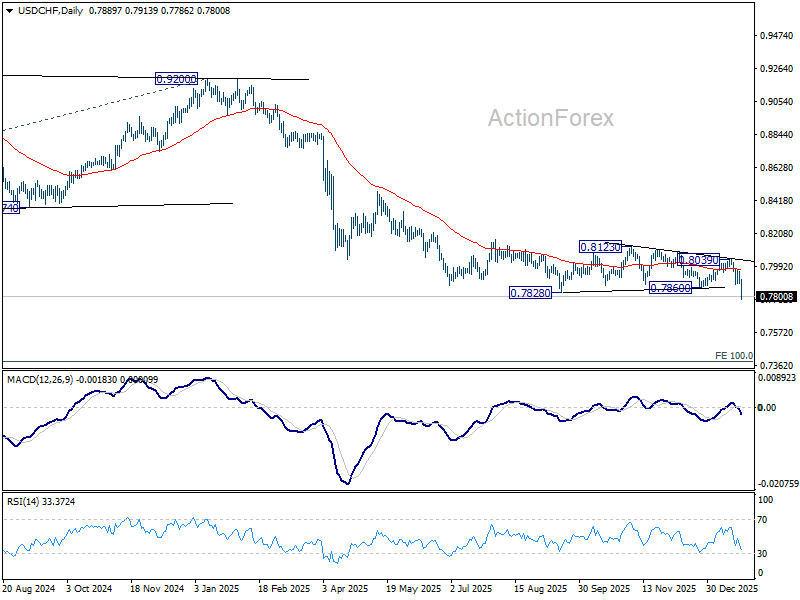
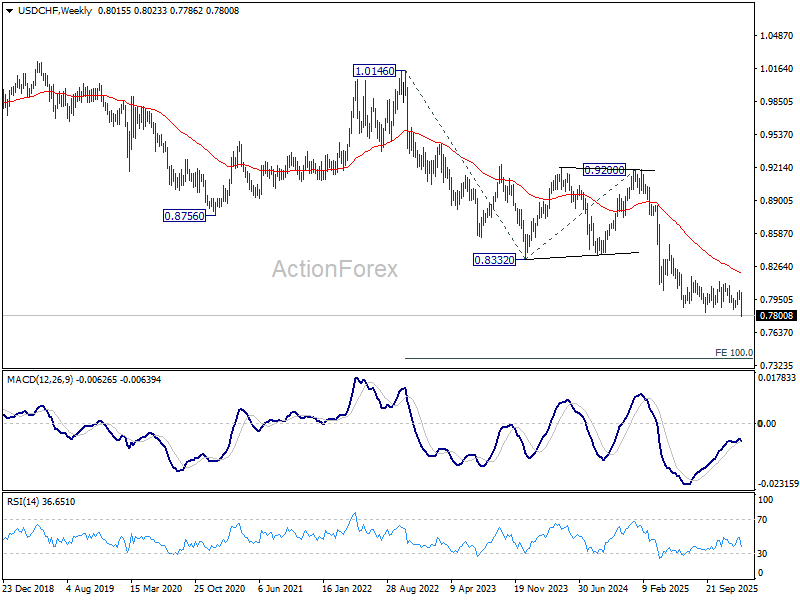
In the bigger picture, larger down trend from 1.0342 (2017 high) is still in progress and resuming. Next target is 100% projection of 1.0146 (2022 high) to 0.8332 from 0.9200 at 0.7382. In any case, outlook will stay bearish as long as 55 W EMA (now at 038199) holds.
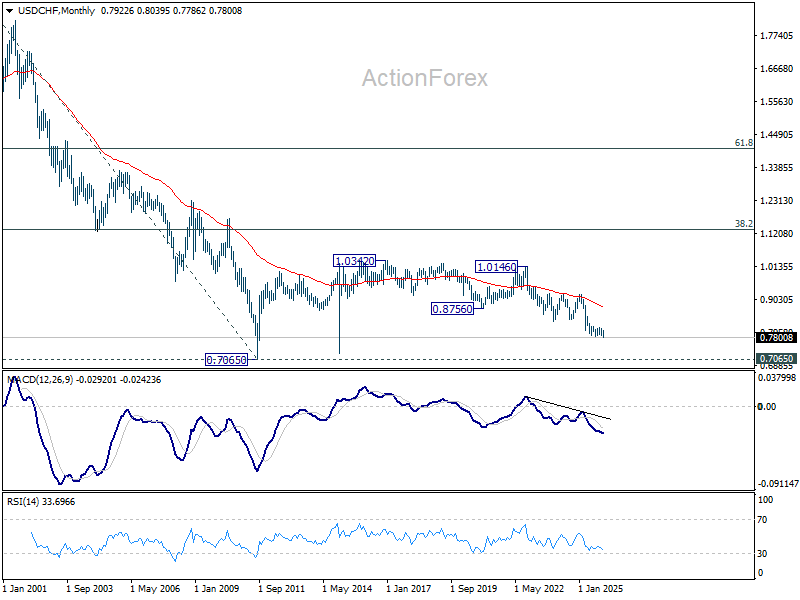
In the long term picture, price action from 0.7065 (2011 low) are seen as a corrective pattern to the multi-decade down trend from 1.8305 (2000 high). It's uncertain if the fall from 1.0342 is the second leg of the pattern, or resumption of the downtrend. But in either case, outlook will stay bearish as long as 0.8756 support turned resistance holds (2021 low). Retest of 0.7065 should be seen next.
AUD/USD Weekly Report
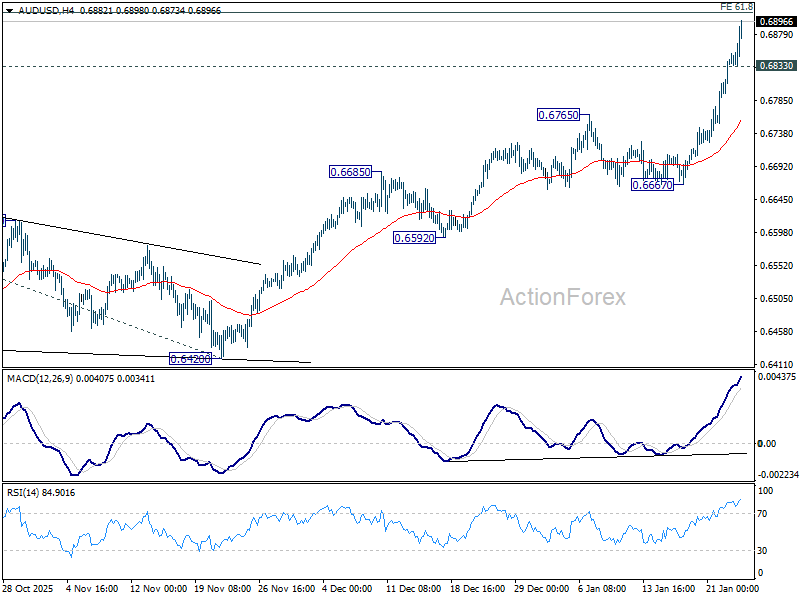
AUD/USD's up trend from 0.5913 resumed last week and accelerated higher. Initial bias stays on the upside this week for 61.8% projection of 0.5913 to 0.6706 from 0.6420 at 0.6910. Firm break there will pave the way to 100% projection at 0.7213. On the downside, below 0.6833 minor support will turn intraday bias neutral and bring consolidations first. But downside of retreat should be contained well above 0.6667 support to bring another rally.
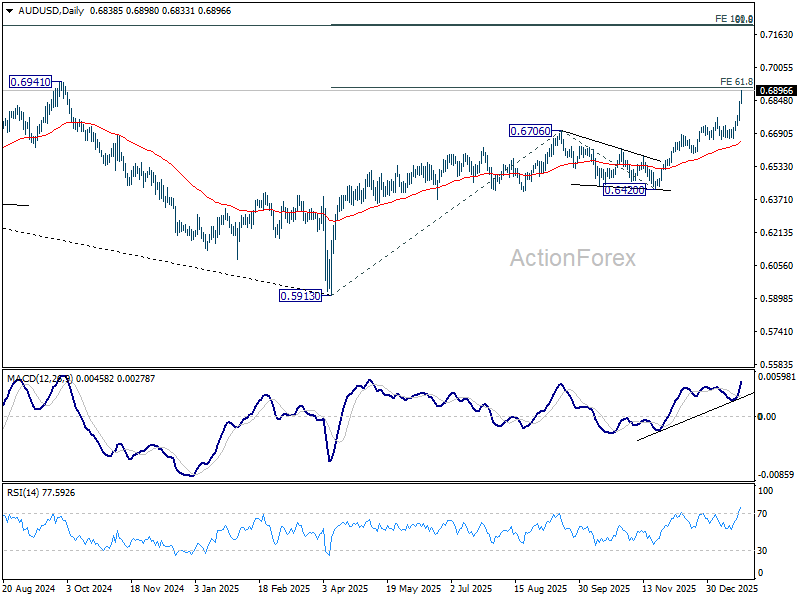
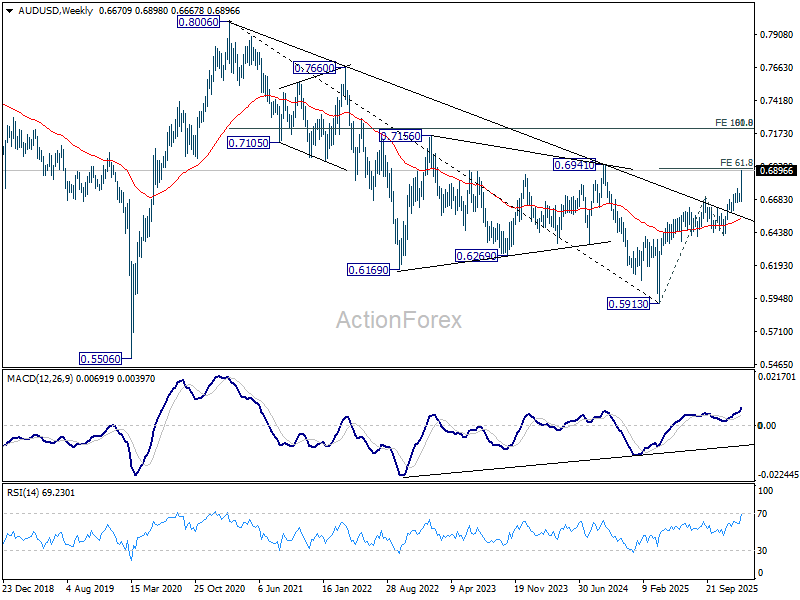
In the bigger picture, current development argues that rise from 0.5913 (2024 low) is reversing whole down trend from 0.8006 (2021 high). Further rally should be seen to 61.8% retracement of 0.8006 to 0.5913 at 0.7206. This will remain the favored case as long as 0.6420 support holds, even in case of deep pullback.
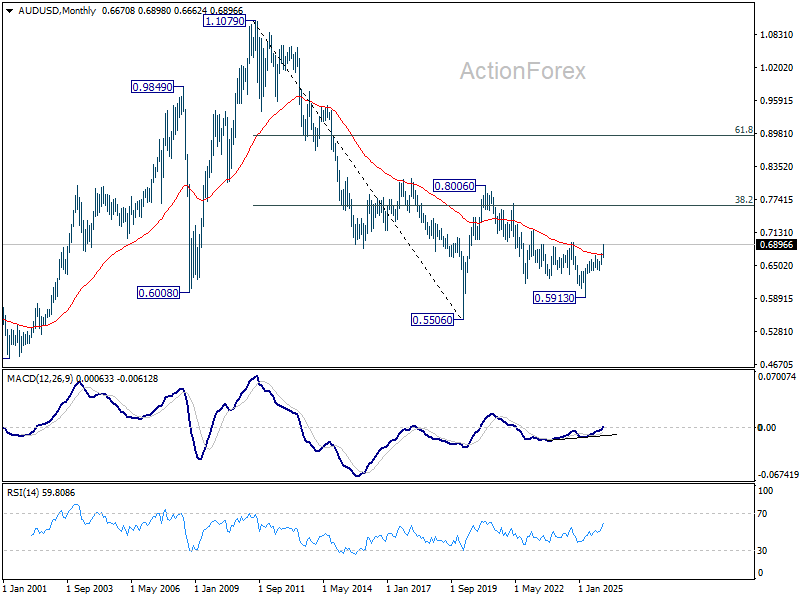
In the long term picture, rise from 0.5913 is tentatively seen as the third leg of the pattern from 0.5506 (2020 low). Sustained trading above 55 M EMA (now at 0.6711) will solidify this medium term bullish case. It's still early to judge if this is an impulsive or corrective pattern. But in either case, firm break of 0.6941 will open up further rise back to 0.8006.
USD/CAD Weekly Outlook
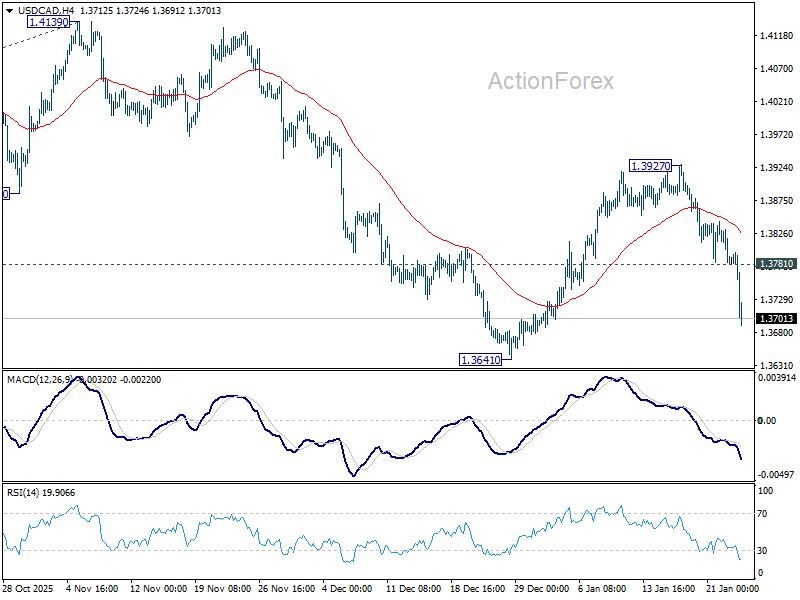
USD/CAD's extended steep decline last week suggests that rebound from 1.3641 has completed at 1.3927 already. Initial bias stays on the downside this week for 1.3641 support first. Firm break there will target 1.3538 low. On the upside, above 1.3781 minor resistance will turn intraday bias neutral.
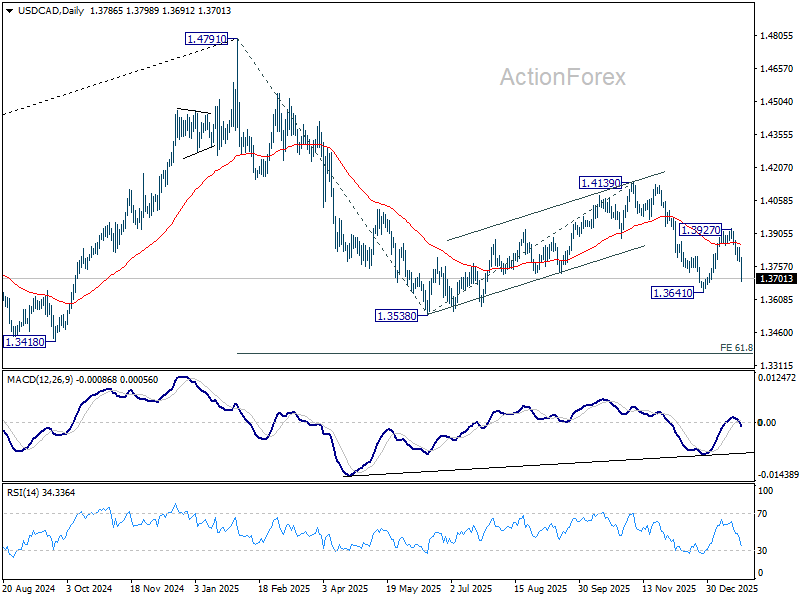
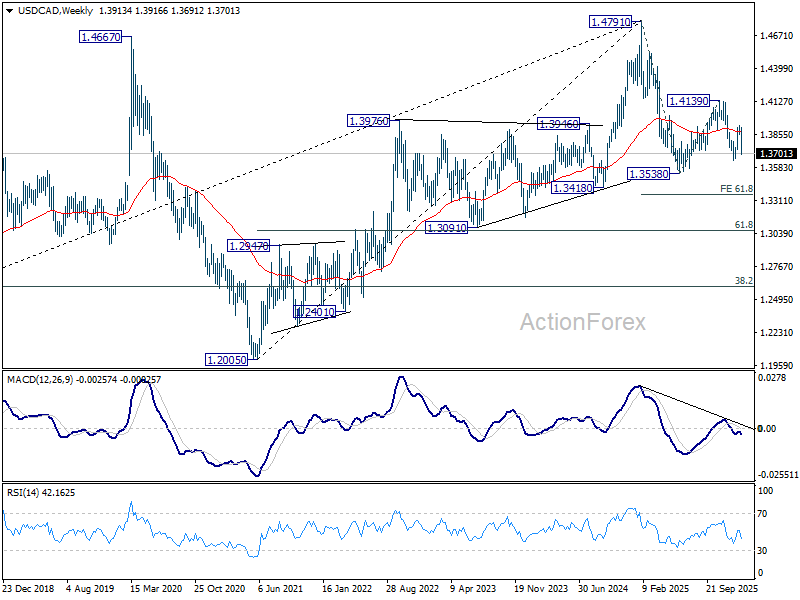
In the bigger picture, price actions from 1.4791 are seen as a corrective pattern to the whole up trend from 1.2005 (2021 low). Deeper fall could be seen as the pattern extends, and break of 1.3538 will target 61.8% retracement of 1.2005 to 1.4791 at 1.3069. For now, medium term outlook will be neutral until there are signs that the correction has completed.
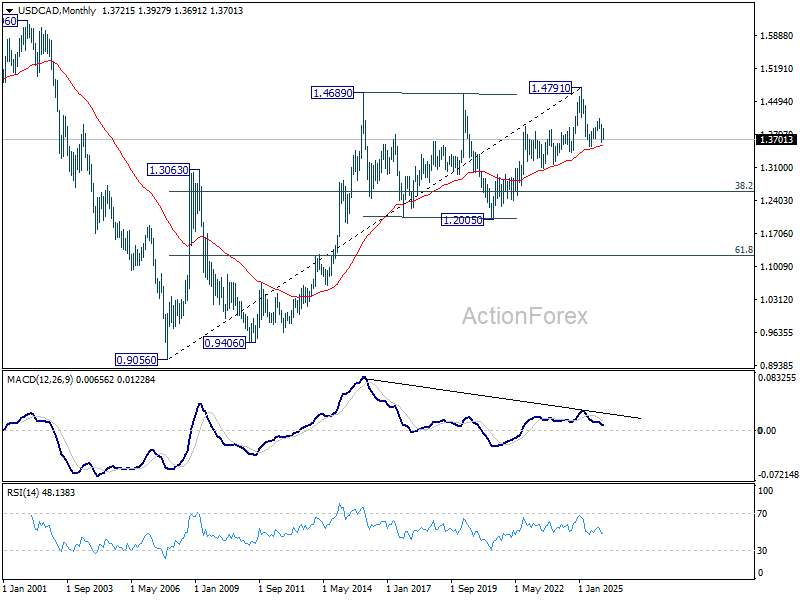
In the long term picture, rising 55 M EMA (now at 1.3576) remains intact. Thus, up trend from 0.9056 (2007 low) should still be in progress. However, considering bearish divergence condition M MACD, sustained trading below 55 M EMA will argue that the up trend has completed with five waves up to 1.4791, and turn medium term outlook bearish for correction to 38.2% retracement of 0.9056 to 1.4791 at 1.2600.
GBP/JPY Weekly Outlook
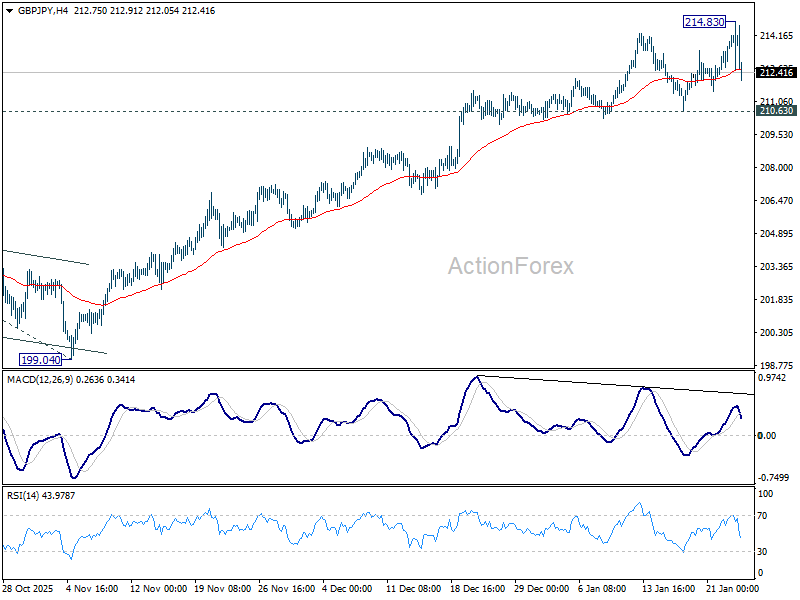
GBP/JPY edged higher to 214.83 last week but retreated since then. Initial bias remains neutral this week and further rally is in favor with 210.63 support intact. Break of 214.83 will resume larger up trend to 100% projection of 184.35 to 205.30 from 199.04 at 219.99 next. Nevertheless, considering bearish divergence condition in 4H MACD, firm break of 210.28 will confirm short term topping, and turn bias to the downside for deeper pullback to 55 D EMA (now at 208.86).
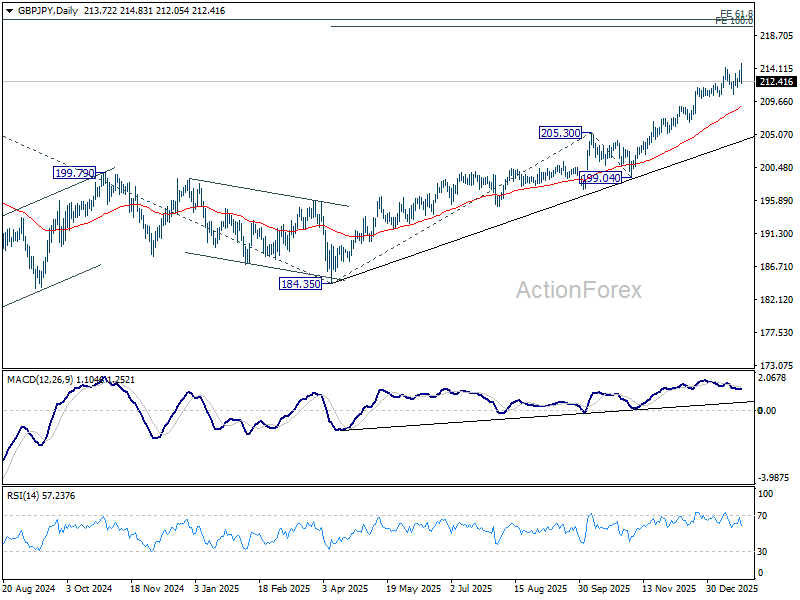
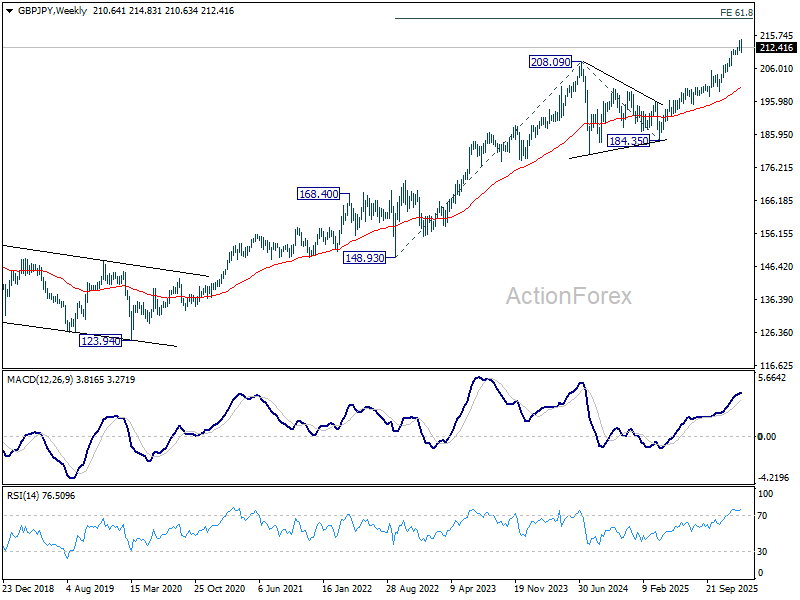
In the bigger picture, up trend from 123.94 (2020 low) is in progress. Next target is 61.8% projection of 148.93 (2022 low) to 208.09 (2024 high) from 184.35 at 220.90. On the downside, break of 205.30 resistance turned support is needed to indicate medium term topping. Otherwise, outlook will stay bullish even in case of deep pullback.
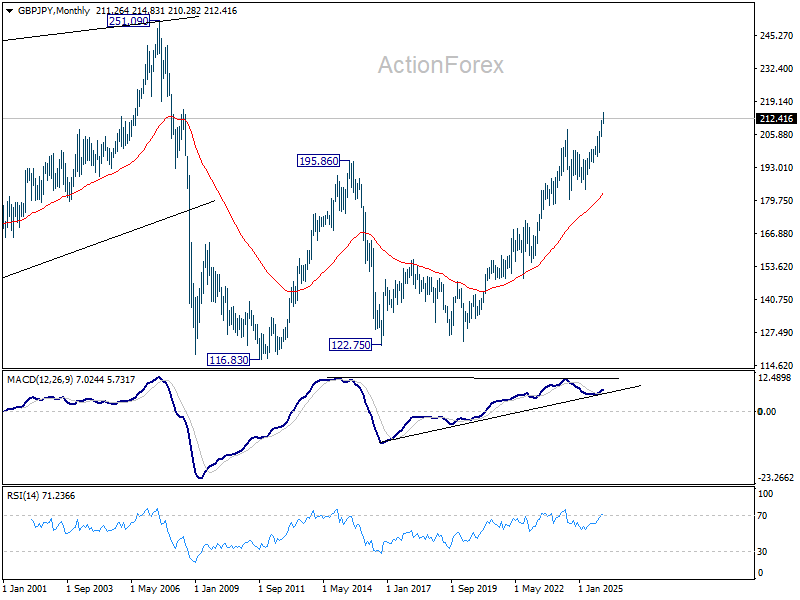
In the long term picture, up trend from 116.83 (2011 low) is resuming. Next target is 251.09 (2007 high). This will remain the favored case as long as 55 M EMA (now at 182.91) holds.
EUR/JPY Weekly Outlook
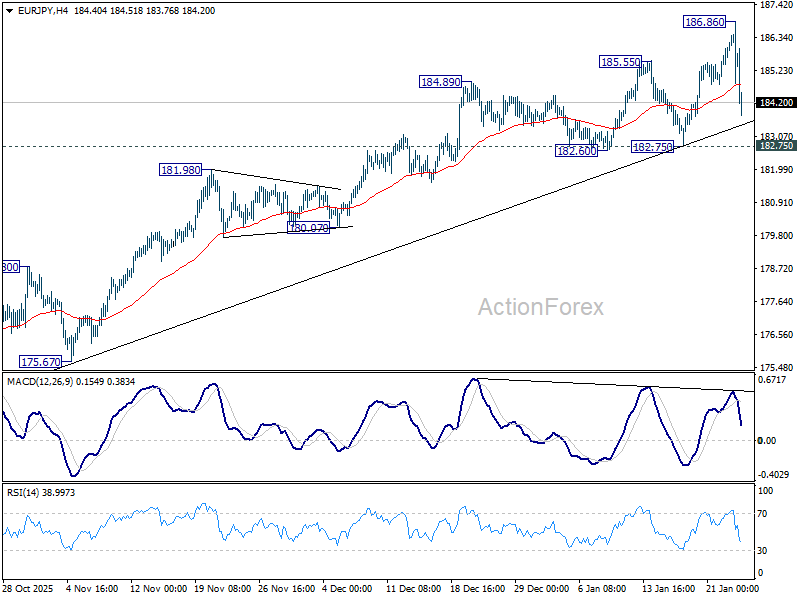
EUR/JPY spiked higher to 186.86 last week but quickly retreated after meeting 186.31 projection level. Initial bias remains neutral this week first. As long as 182.75 support holds, further rally is in favor. Firm break of 186.86 will target 138.2% projection of 151.06 to 173.87 from 172.24 at 189.94. However, considering bearish divergence condition in D MACD, decisive break of 182.75 should indicate medium term topping and bring larger scale correction.
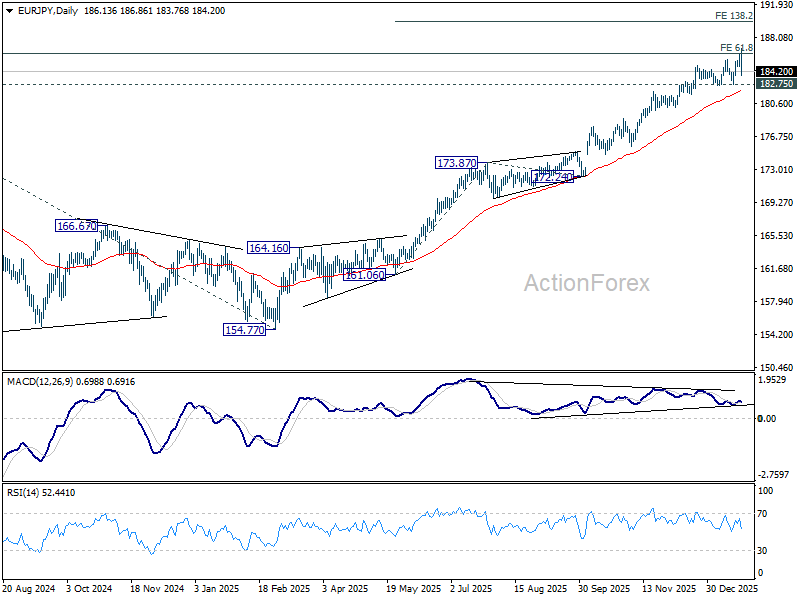
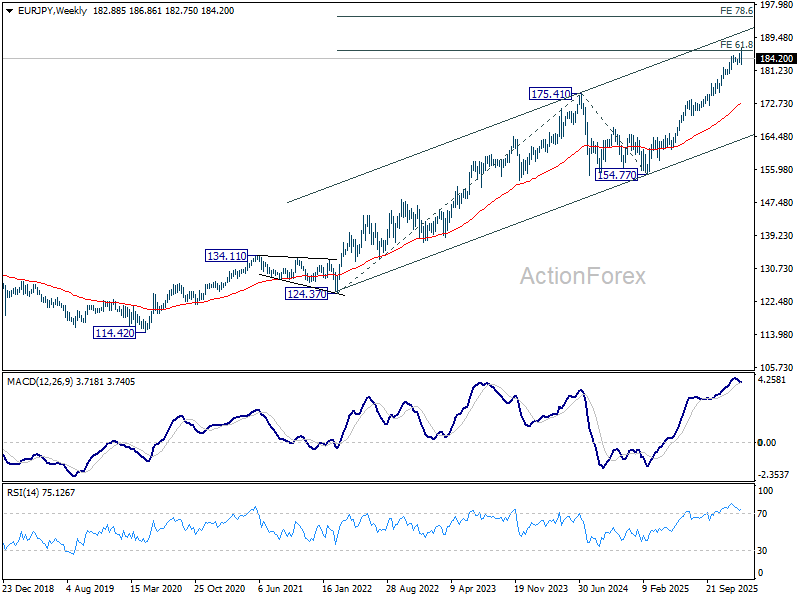
In the bigger picture, up trend from 114.42 (2020 low) is in progress and and met 61.8% projection of 124.37 to 175.41 from 154.77 at 186.31. Considering bearish divergence condition in D MACD, upside could be capped by 186.31 on first attempt. Still, outlook will stay bullish as long as 55 W EMA (now at 172.99) holds, even in case of deep pullback. Sustained break of 186.31 will pave the way to 78.6% projection at 194.88 next.
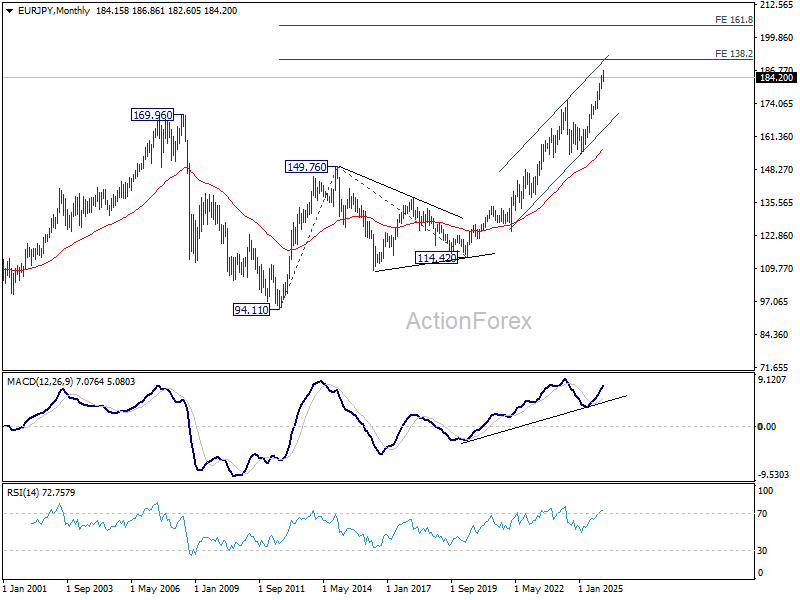
In the long term picture, up trend from 94.11 (2021 low) is in progress. Next target is 138.2% projection of 94.11 to 149.76 (2014 high) from 114.42 (2020 low) at 191.32. This will remain the favored case as long as 154.77 support holds.
EUR/GBP Weekly Outlook
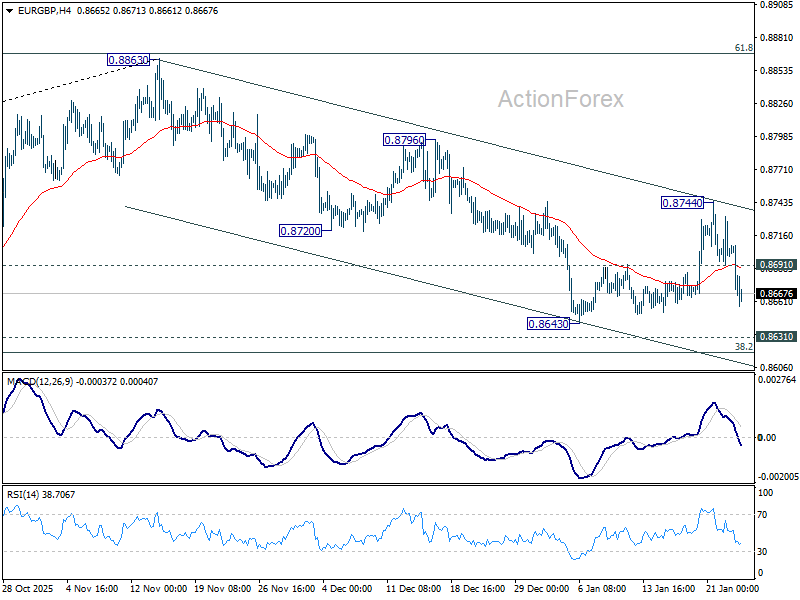
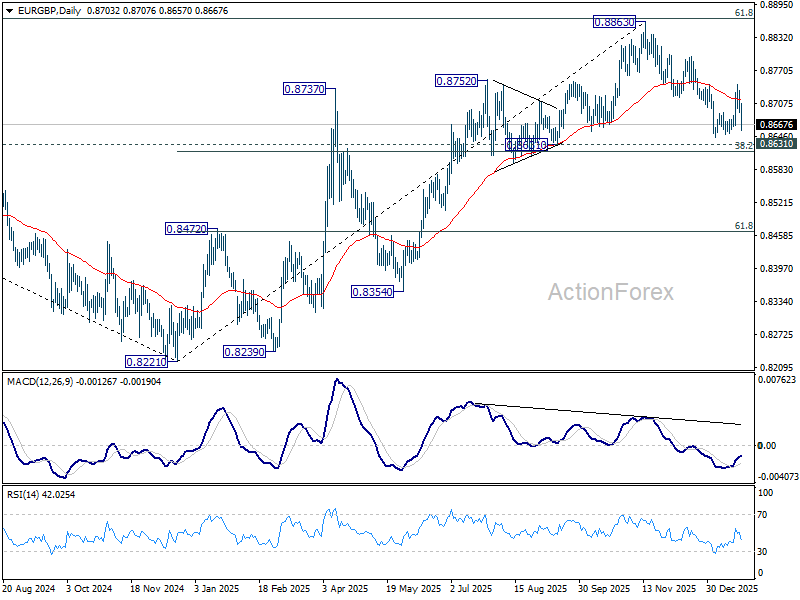
EUR/GBP reversed and fell sharply after recovery to 0.8744 earlier in the week. The rejection by 55 D EMA (now at 0.8715) keeps fall from 0.8863 intact. Initial bias is back on the downside this week for 0.8631 cluster support (38.2% retracement of 0.8221 to 0.8663 at 0.8618). Decisive break there will carry larger bearish implications and pave the way to 61.8% retracement at 0.8466. Risk will now stay on the downside as long as 0.8744 resistance holds, in case of recovery.
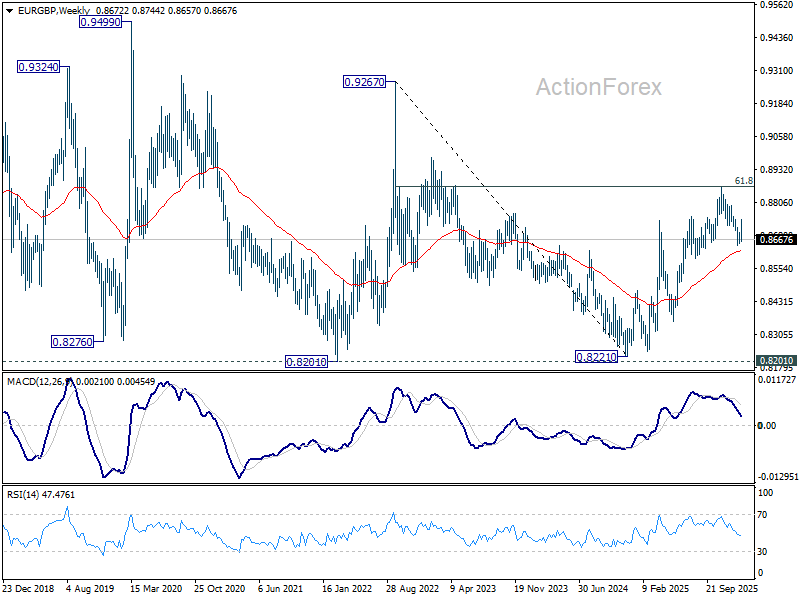
In the bigger picture, rise from 0.8221 medium term bottom (2024 low) is seen as a corrective move. Upside should be limited by 61.8% retracement of 0.9267 to 0.8221 at 0.8867. Sustained trading below 55 W EMA (now at 0.8623) should confirm that this corrective bounce has completed. In this case, deeper fall would be seen back to 0.8201/21 key support zone. However, decisive break of 0.8867 will suggest that EUR/GBP is already reversing whole decline from 0.9267 (2022 high). That should pave the way back to 0.9267.
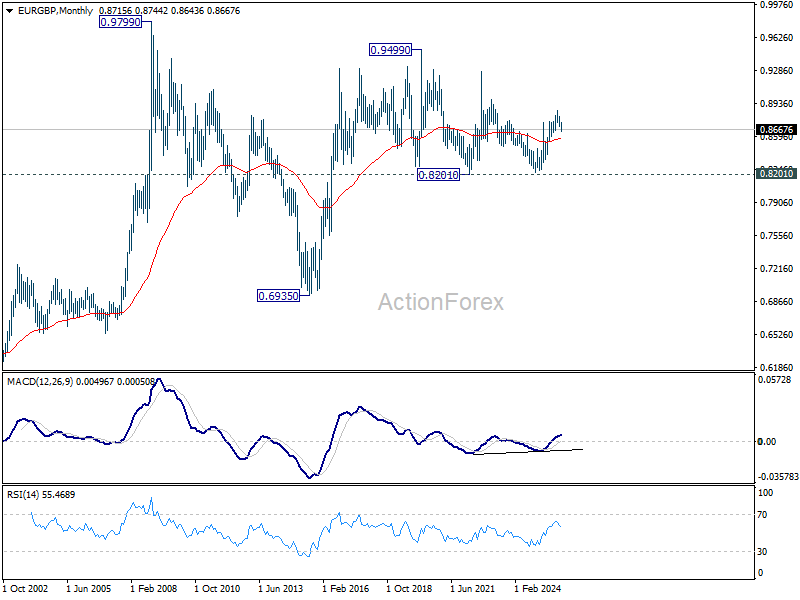
In the long term picture, price action from 0.9499 (2020 high) is seen as part of the long term range pattern from 0.9799 (2008 high). Range trading should continue between 0.8201 and 0.9499, until there is clear signal of imminent breakout.
EUR/AUD Weekly Outlook
EUR/AUD's decline from 1.8160 resumed through 1.7287 support last week. The fall is seen as the third leg of the pattern from 1.8554. Initial bias stays on the downside this week for 100% projection of 1.8554 to 1.7245 from 1.8160 at 1.6851. On the upside, above 1.7287 support turned resistance will turn intraday bias neutral first, and bring consolidations, before staging another decline.
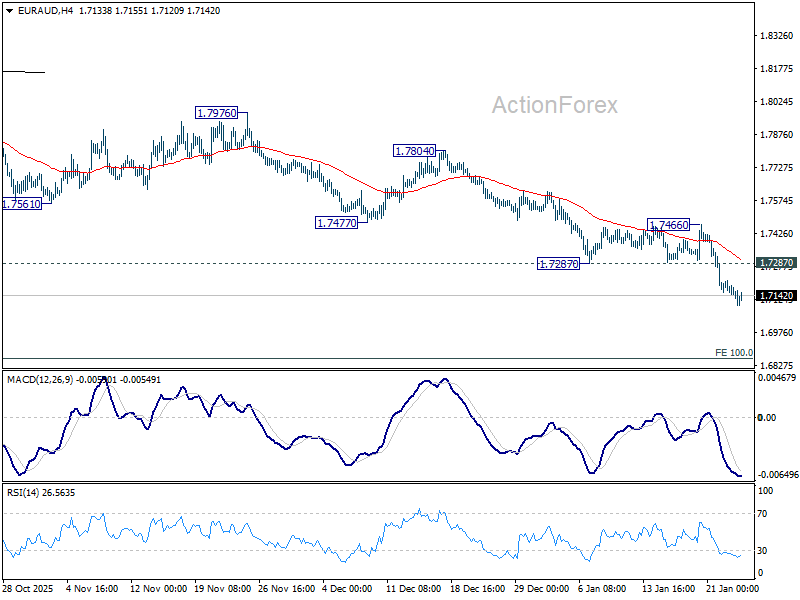
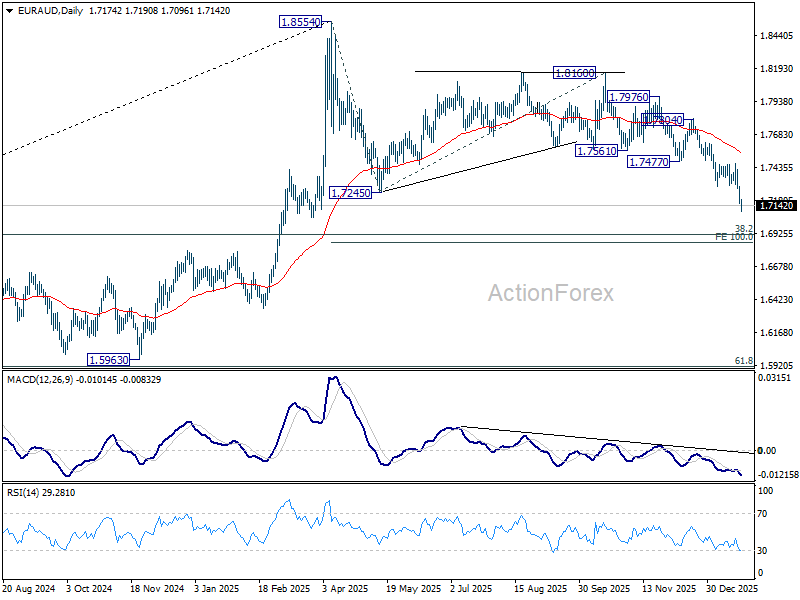
In the bigger picture, the break of 55 W EMA (now at 1.7464) argues that fall from 1.8554 medium term top is correcting whole up trend from 1.4281 (2022 low). Deeper decline is in favor to 38.2% retracement of 1.4281 to 1.8554 at 1.6922, and possibly below. Risk will stay on the downside as long as 55 D EMA (now at 1.7537) holds, in case of strong rebound.
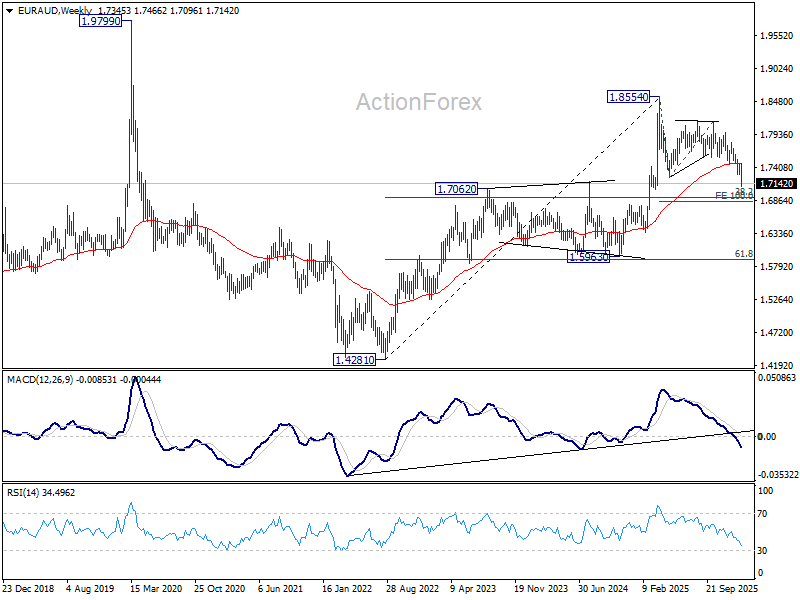
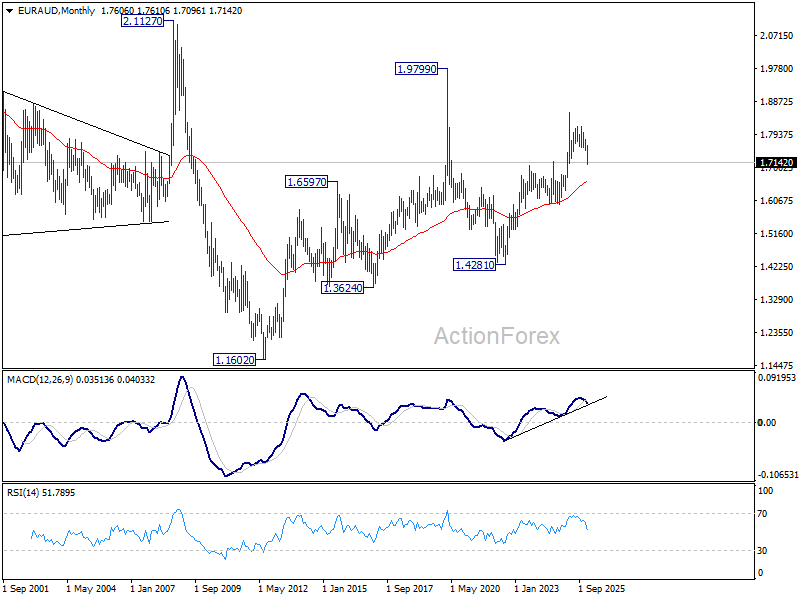
In the longer term picture, rise from 1.4281 is seen as the second leg of the pattern from 1.9799 (2020 high), which is part of the pattern from 2.1127 (2008 high). As long as 55 M EMA (now at 1.6610) holds, this second leg could still extend higher.
EUR/CHF Weekly Outlook
EUR/CHF's fall from 0.9394 extended lower last week. Despite interim recovery, the move accelerated through near term channel support towards the end of the week. The development confirms that whole rebound from 0.9178 has already completed. Initial bias is now on the downside this week for retesting 0.9178 low first. Firm break there will resume larger down trend. On the upside, above 0.9253 support turned resistance will turn intraday bias neutral and bring consolidations, before staging another decline.
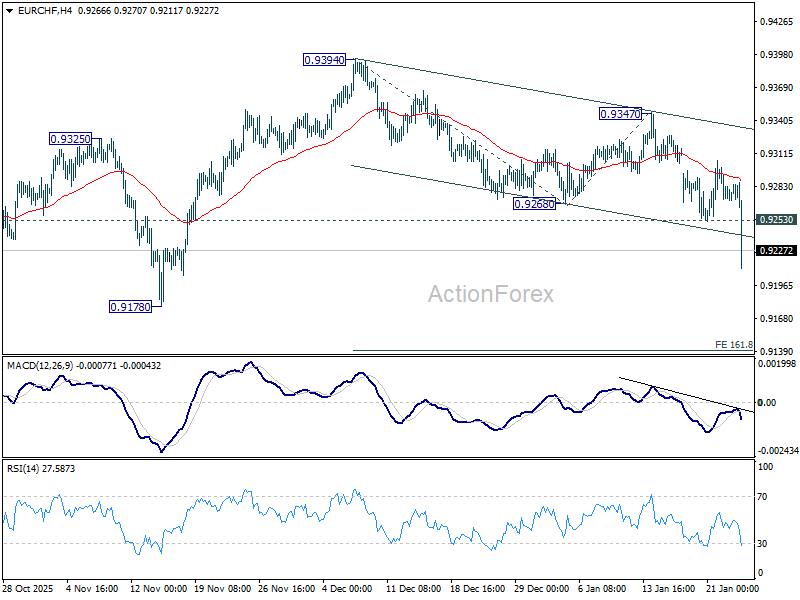
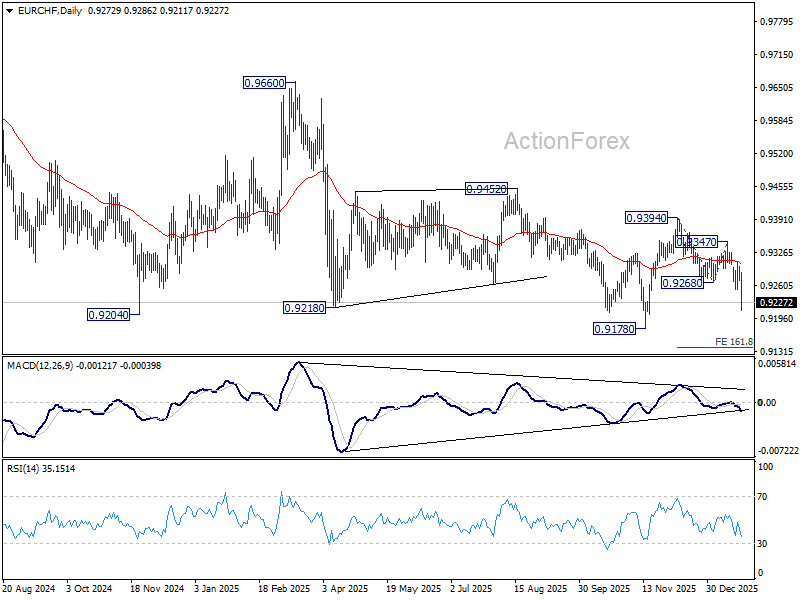
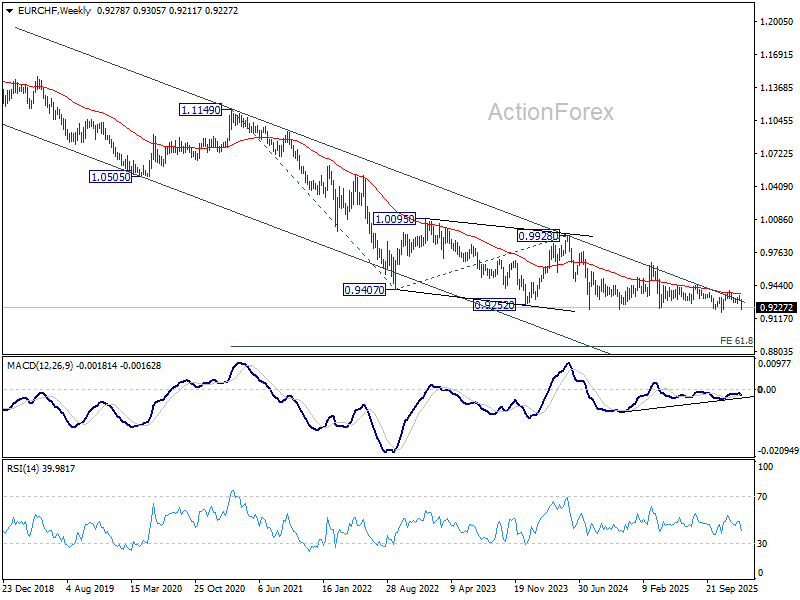
In the bigger picture, another rejection by 55 W EMA (now at 0.9360) keeps outlook bearish. Downtrend from 1.2004 (2018 high) is still in progress. Firm break of 0.9178 will target 61.8% projection of 1.1149 to 0.9407 from 0.9928 0.8851. Outlook will stay bearish as long as 0.9394 resistance holds, in case of recovery.
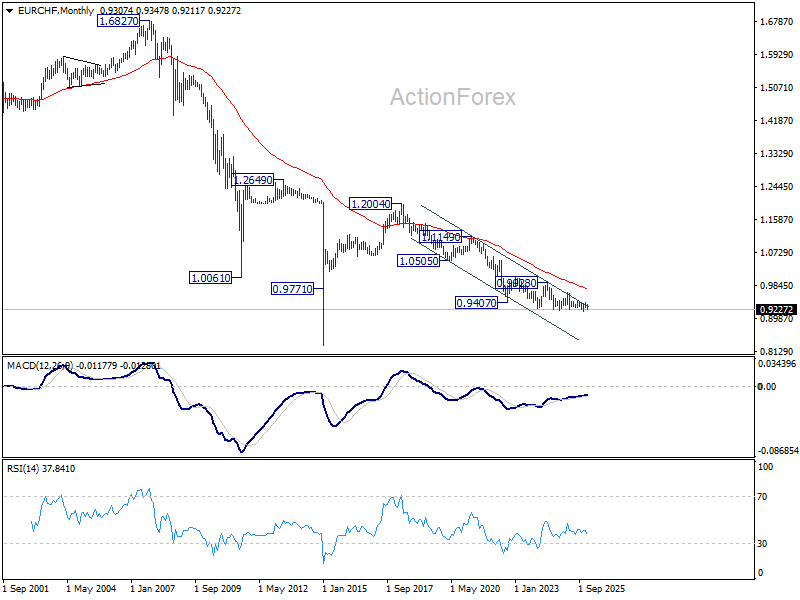
In the long term picture, overall long term down trend from 1.2004 (2018 high) is still in progress. Outlook will continue to stay bearish as long as falling 55 M EMA (now at 0.9763) holds.
Tariffs as Statecraft: Escalation to Retraction on Greenland
Summary
Although the U.S. administration has walked back its proposed tariff package on major European economies, the episode still marks a significant escalation in transatlantic tension. The direct macro impact from this in the immediate term may have been removed, but the strategic fallout is unchanged—the episode exposed deep mistrust, elevated the prominence of the EU’s Anti‑Coercion Instrument (ACI), and brought into deeper focus the fragility of the U.S.–European relationship.
What follows are thoughts around U.S. economic vulnerabilities had the EU deployed the ACI, but also how the Greenland dispute gives new momentum to a world that may be drifting apart. Rather than a simple U.S.–China split, a three‑bloc system where Europe charts more distance from both the U.S. and China could now be more realistic. Our analysis shows that three-bloc fragmentation carries heavier growth costs for Europe if access to U.S. and China‑aligned markets tighten simultaneously. And while the EU is exploring new trade partnerships and an economy less dependent on the U.S., the simple truth is that replacing the U.S. consumer is nearly impossible. So even if the EU charts new trade paths and explores deeper integration into the global marketplace without the U.S., a world where the U.S. and EU are less economically integrated raises new headwinds to global growth.
Europe’s Reaction: The Anti-Coercion Instrument (ACI) Threat
At the center of Europe’s retaliatory response would have been the Anti‑Coercion Instrument (ACI)—the EU’s economic “bazooka,” created to deter and counter foreign coercion. The ACI allows the EU to deploy measures including:
- Foreign investment restrictions
- Public procurement bans
- Suspension of intellectual property rights
- Tariffs, quotas, and service restrictions
Initially conceived during Trump’s first term and formalized after China’s coercion of Lithuania, the ACI has never been used. But President Macron of France has advocated its activation before—including against China—making his push to deploy the ACI well within his established playbook. The urgency for the ACI's use has abated, but had the ACI been deployed, the U.S. economy has vulnerabilities.
Specifically that:
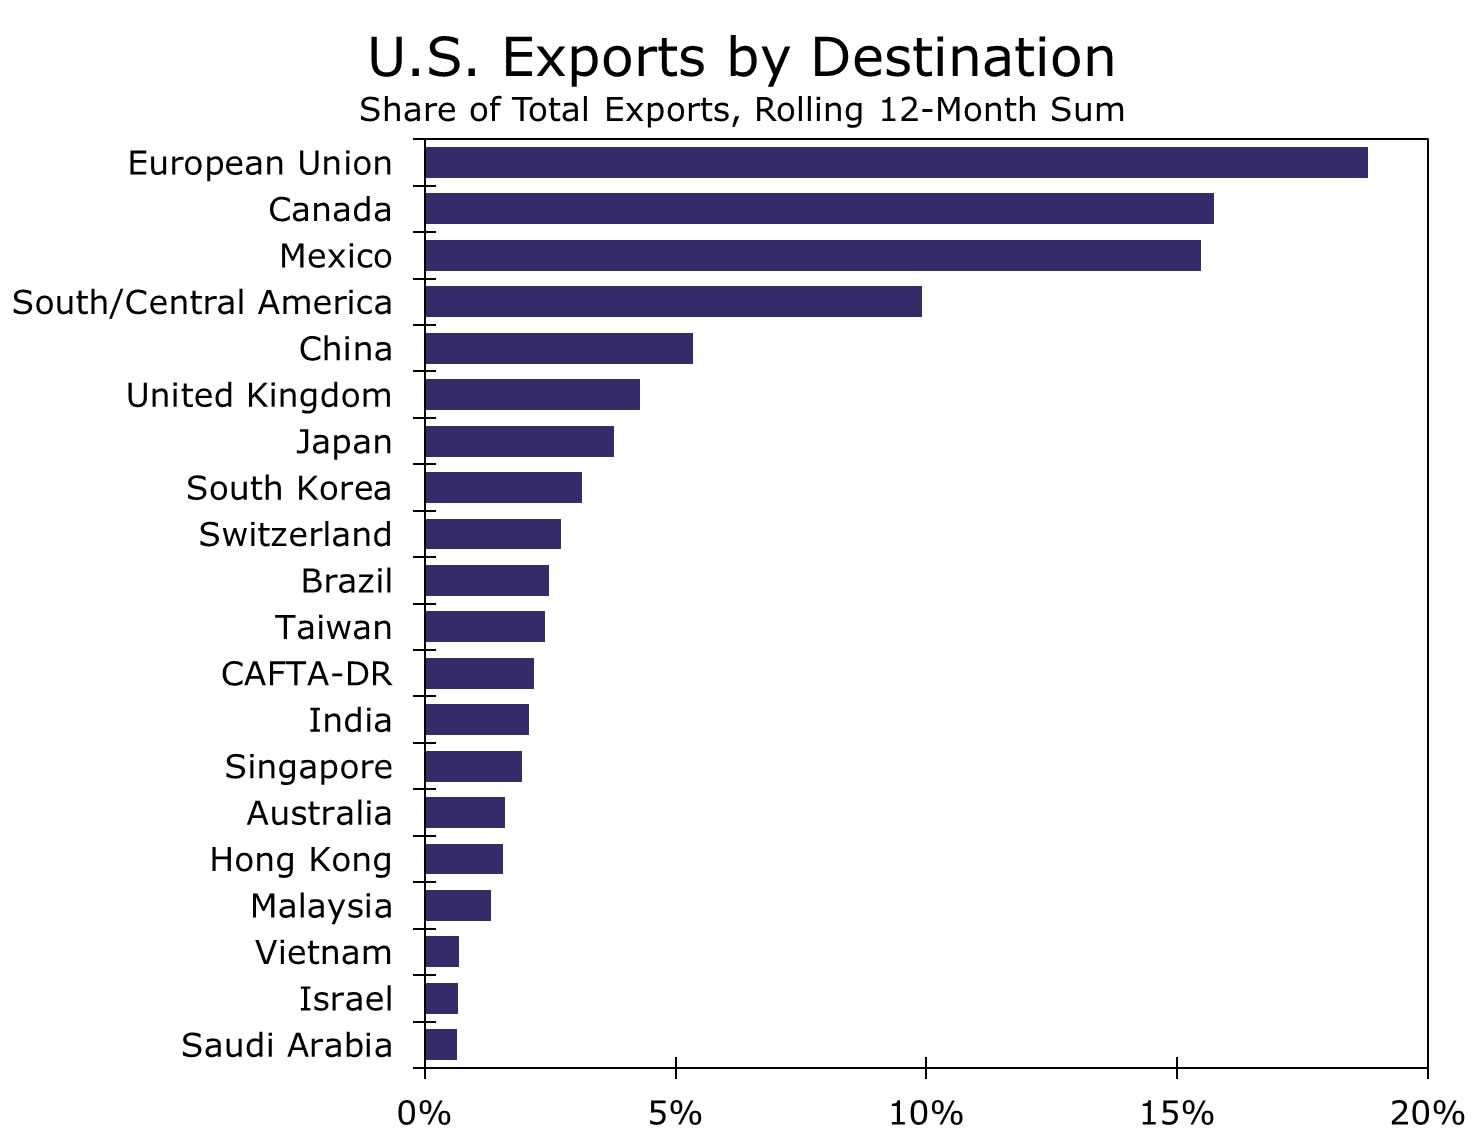
- The EU accounts for ~20% of U.S. goods exports, making the EU America’s largest high‑income market
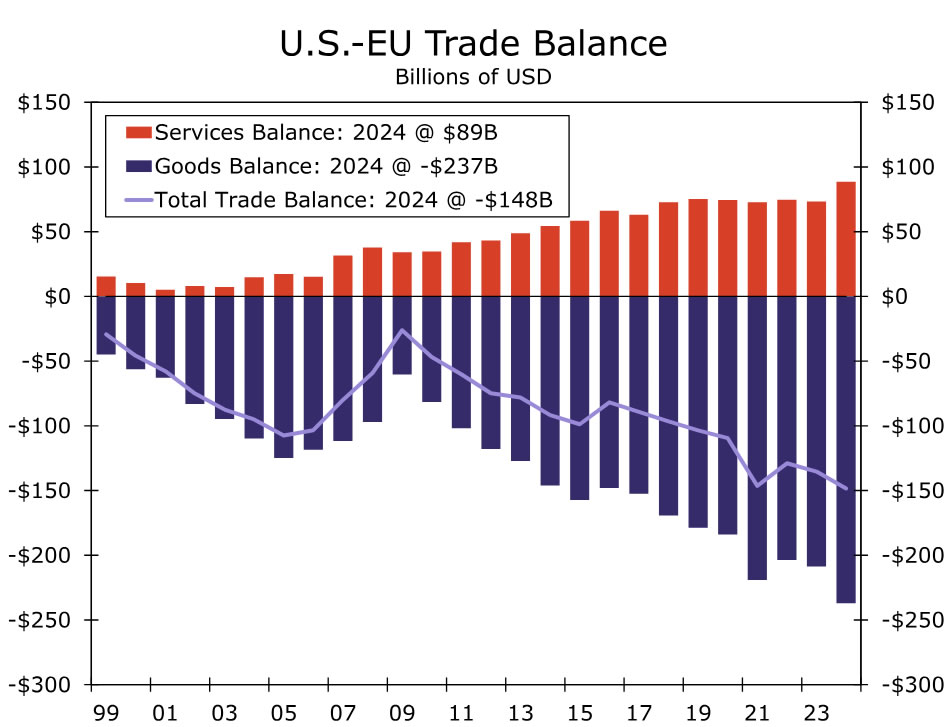
- U.S.–EU goods trade totals ~$970 billion annually, including a $237B U.S. goods deficit
- The U.S. maintains an $89B services surplus with Europe—vulnerable if IP or professional services are targeted
Implementation, however, would have been slow: the ACI requires a multi‑stage process (examination→determination→ engagement→ response measures) that could take months to complete. A slow-moving "bazooza" retaliation option would at least provide a several-month window for cooler heads to prevail and de‑escalation to materialize.
But, focusing solely on trade volumes would understate the more strategic U.S. vulnerability. ACI measures that target intellectual property present risks that macro models do not capture. For AI, biotech, advanced manufacturing, and cloud services—sectors central to U.S. competitive advantage—EU imposed restrictions on U.S. IP could become the true economic impact of the ACI.
Had the EU pulled the ACI trigger a harsher geopolitical question would have loomed: Is the EU prepared to depend less on the U.S. in critical technologies? Before the Greenland episode, the idea was unthinkable. Now, several European officials are openly raising the prospect.
Retrench or Reglobalize? Are Greenland Tensions An Inflection Point For The EU?
The brief escalation—despite its abrupt reversal—serves as a stress test of global alignment. Greenland‑linked tariff threats didn't just raise economic risks in the U.S. as well as Europe—they reopened a broader question we’ve been tracking for years: whether the global economy is drifting toward deeper fragmentation. What looked like a stable U.S.–EU strategic alignment now appears more conditional, and the Greenland episode pulls forward scenarios we once considered tail risks.
De-globalization has been steadily moving from a concept to a reality. The latest U.S.–EU confrontation makes a fractured three bloc world: U.S., China, EU, less abstract. If Europe retrenches from both Washington and Beijing, global growth headwinds steepen. Simulations we’ve run show that fracturing into three insulated blocs inflicts meaningfully more damage on global output than if the world carved into only U.S. and China-led blocs. And the pain is not symmetric: the EU shoulders the largest proportional hit if it loses access to U.S. and China aligned markets simultaneously.
However, another possibility exists. Rather than retrench, Europe uses this episode to deepen integration with the rest of the world, but while still keeping Washington at arm's length. The EU-Mercosur trade agreement, a major free trade deal between the EU and select South American nations, was finally signed in January 2026. While impediments to full ratification remain, EU member states seeking friction-less trade avenues to South America is behavior that demonstrates the EU is seeking greater global economic integration. Combining the Mercosur trade deal with overtures to India and a thaw with China on EV trade shows the EU already widening its aperture.
But even in a world where the EU successfully achieves more global integration, severing trade ties with the U.S. has limits. The U.S. consumer is irreplaceable without leaning into China—something Europe has been reluctant to do. And Europe knows U.S. policy can be episodic. The Trump administration has already demonstrated a transactional approach to setting trade and foreign policy. Not to mention a willingness to tread more softly if financial markets become unsettled due to policy proposals. Pursuing structural divorce from the U.S. over what could prove to be temporary tariff and foreign policy is a heavy lift for the Europeans, and a shift that could wind up causing more economic harm than help for the EU.
Even with the de-escalation, Greenland may not just be a bilateral flare-up. It's a potential catalyst with scope to reveal just how fragile the global architecture is, or whether a willingness to strive for new paths of economic cooperation can gather momentum. Whether the EU doubles down on a break from the U.S. and China or pursues a world where the importance of the U.S. is reduced, the direction of travel is the same: fragmentation. Reducing trade integration with the U.S. is unlikely to be fully offset by new trade relationships, and reduced EU-U.S. trade is a dynamic that places downward pressure on global growth.
Get Ready for An Agitated FOMC Week – Markets Weekly Outlook
- Discover our Weekly Market Outlook, exploring themes and events that forged financial flows throughout the week.
- This week was forged by renewed geopolitical tensions (EU-US, Greenland, Davos) and although it's easing, the tension is not going down.
- Get ready for next week's action by exploring upcoming events across global Markets.
Week in review – Geopolitical turmoil pursues
Another week, another spectacular Trump-related volatility event.
After threats to the Fed Chair Powell and the Capture of the Venezuelan President, President Trump wanted some more spice.
And the spice he gave: Over the weekend, the President threatened many European Nations and leaders with additional tariffs until the US can buy Greenland – a striking demand right as the World Economic Conference was commencing in Davos.
The event featured many references and speeches toward a New World Order, one characterized by greater powers (China, US, Russia) expanding their grip. In contrast, others unite – the end of the Rules-Based order of the past 25 years.
The best speech is easily Canadian PM Mark Carney's, which suits the current geopolitical landscape perfectly—a must-watch.
Luckily for the world as we know it (or at least NATO as we know it), Trump backed off his rhetoric and cancelled tariffs that would have been implemented on February 1 – the tone has largely abated since, even if some worries remain.
The higher tensions did not come without a bit of Market Volatility – Stock Markets across the world suffered losses from 1% to 3% as investor sentiment degraded.
After all, the Venezuela Capture opened possibilities that would scare anybody: Threats are not all threats; they can turn into harsh realities.
Luckily, Trump offered yet another TACO to Wall Street, and they ate at their satiety. Stock Markets are closing the week way closer to their all-time highs.
The late session is offering some profit-taking, but Equity benchmarks have recovered most of the correction.
Weekly Performance across Asset Classes
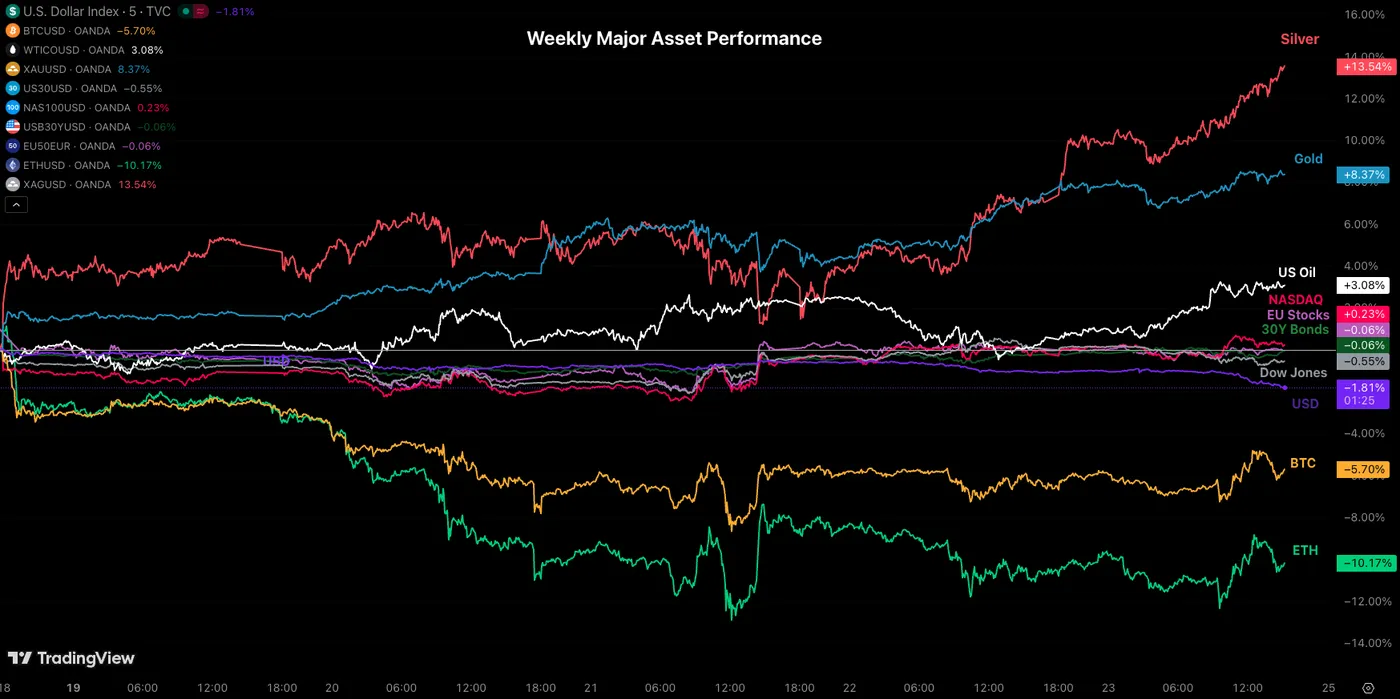
Weekly Asset Performance – January 16, 2026 – Source: TradingView
Metals have shone brightly throughout the week, all gapping higher at the weekly open and extending to continuous record highs as the week progressed.
Even Trump's latest TACO didn't scare Gold and Silver bulls, who have brought the precious metals to, or very close to, their following milestones ($100 for XAG/USD and very close to $5,000 for Gold).
Except for Stocks, which have remained resilient throughout the chaos, the US Dollar took a gigantic hit as Trump's latest show was not well received by participants. The Dollar Index is down 2% on the week and not showing any signs of slowing its descent.
Natural Gas was also a high performer, squeezing amid the Coldest week in North America, supply bottleneck fears over EU-US Beef, and other factors (which I invite you to check in our recent in-depth analysis).
The energy commodity went up by about 70% in the span of a week, in a move that traders haven't seen in a while.
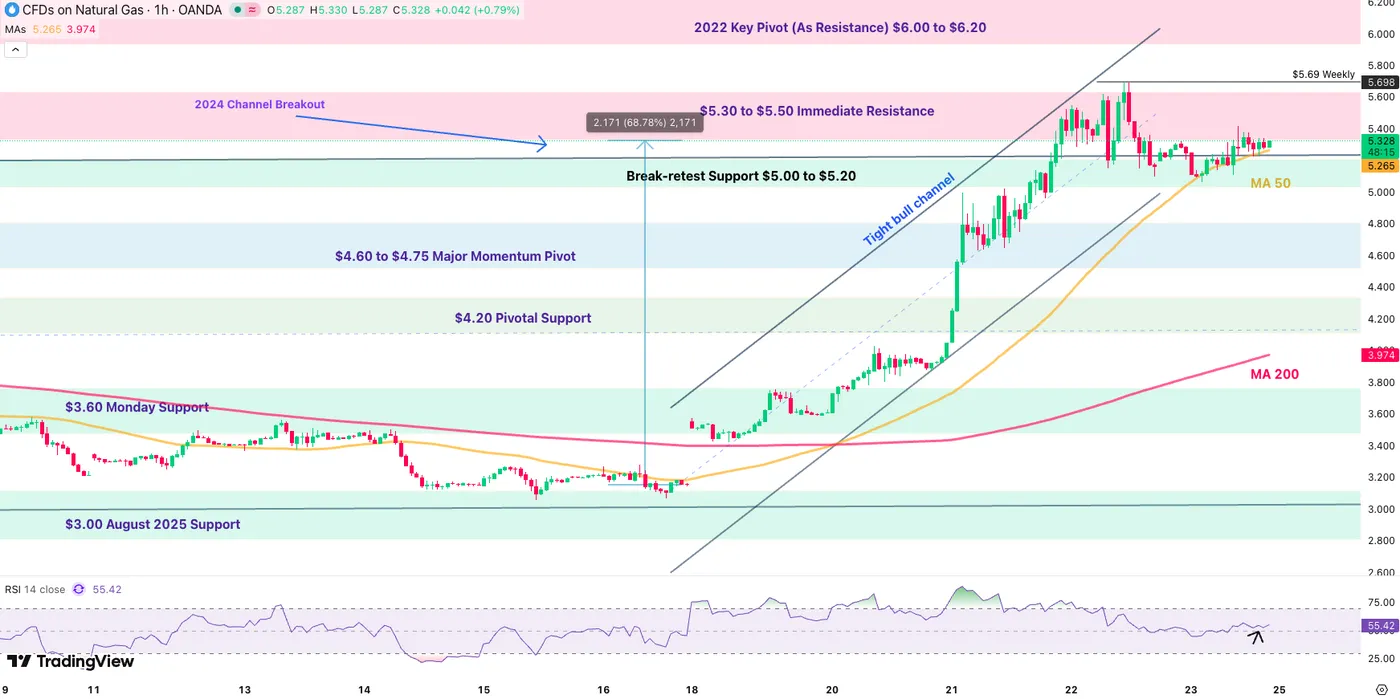
Natural Gas (ETF) 1H Chart – January 23, 2026 – Source: TradingView
Next week shouldn't be much less volatile – Some weekend angst regarding Iran and a general tense atmosphere is raising the temperature. Particularly as the FOMC approaches and Trump prepares to announce the next Federal Reserve Chair.
The Week Ahead – January FOMC/BoC Meetings, the next Fed Chair and more tension
Asia Pacific Markets – Australian and Japanese Inflation
Next week should be (relatively) calmer for APAC traders, nevertheless, one can never be too innocent as assets and currencies fly up and down.
The Aussie Dollar will be in front of the scene, leading G7 FX Currencies in a fast-paced run throughout the week.
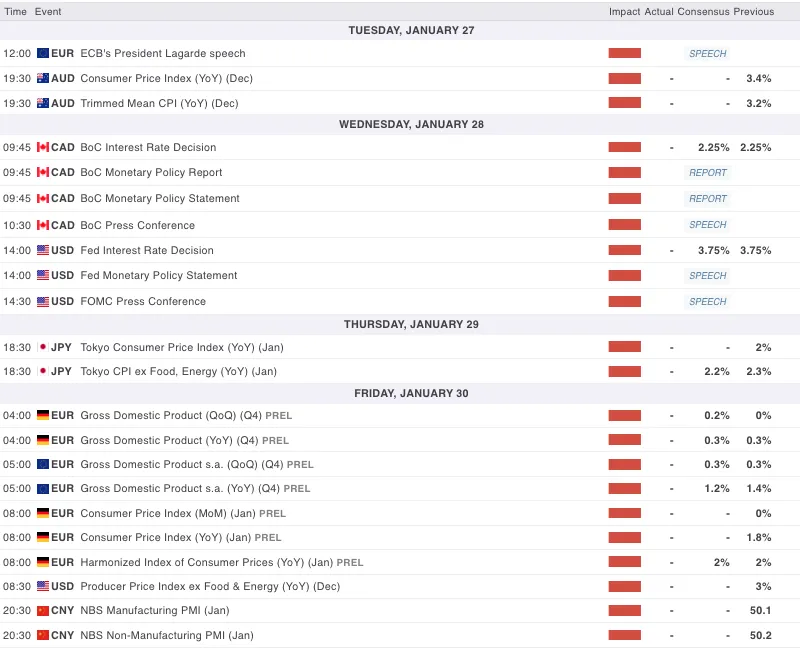
AUD got boosted by a hot-economy, strong jobs and persistent inflation. About the latter, the Australian CPI will be closely monitored on Tuesday evening (19:30 ET).
On the other side of the performance spectrum, the Yen was hurting throughout the entire week before the Ministry of Finance of Japan ran a rate check (Calling banks to know Market rates – a diplomatic move to show that they are watching ongoing developments and usually precede actual interventions.)
USD/JPY quickly took a turn lower, going from 159.20 to the current 155.00 in a stellar drop – this would somewhat help the JPY after a disastrous performance.
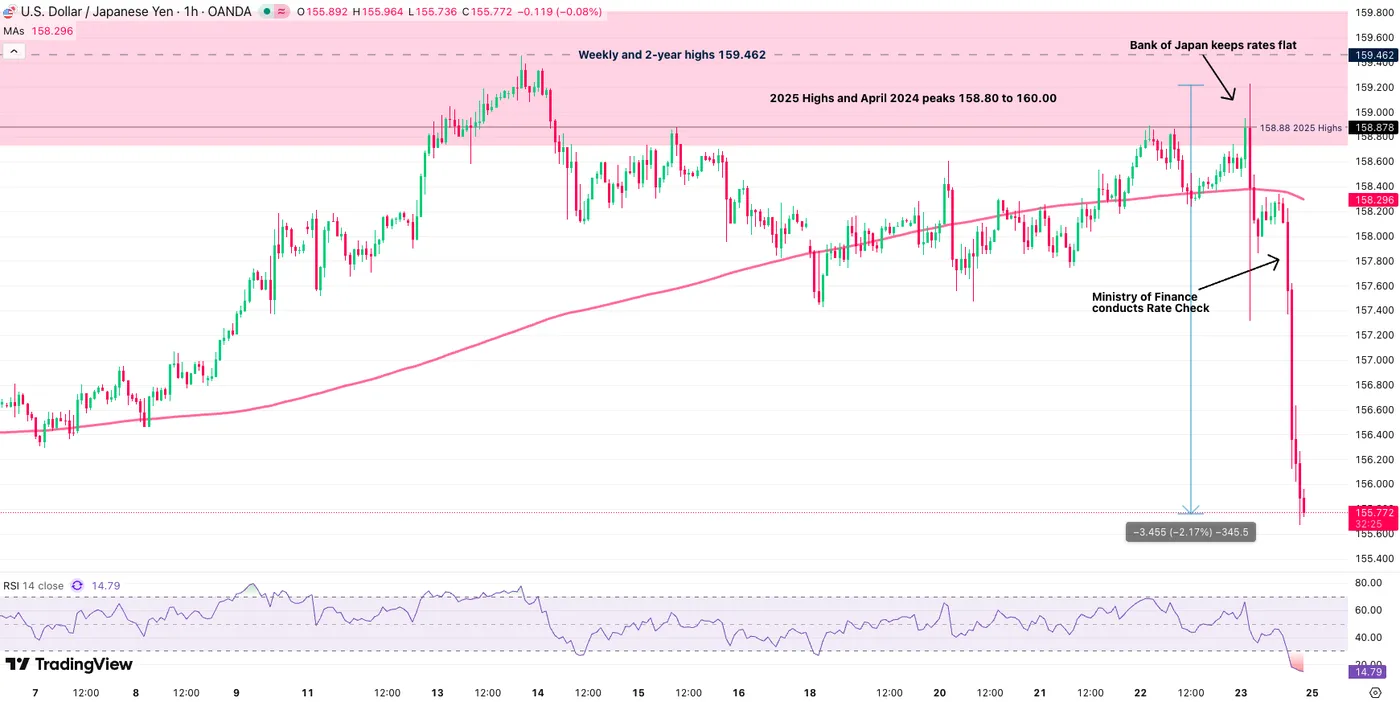
USD/JPY 1H Chart, January 23, 2026 – Source: TradingView
Traders will learn more on inflation trajectory (and rate hike expectations) next week with the Tokyo CPI, releasing on Thursday evening (18:30).
Apart from these key events, keep an eye on NZD trade data on Wednesday and the Chinese NBS PMIs on Friday evening.
Europe and UK Markets – Inflation Expectations, GDP and speeches
Next week will be a calmer one for Europe after a high-intensity WEF.
Inflation and Business expectations will be published throughout the week for Switzerland and the Eurozone.
To accompany the releases, Friday should be quite active with GDP releases for many EU nations including France, Germany, and preliminary GDP data for the Eurozone.
In between GDP releases, keep an eye on Unemployment Rate data and CPI for Germany.
North American Markets – FOMC Meeting and Bank of Canada
Traders attention will be focusing right back to North America, particularly looking at recent Trump rhetoric and upcoming events.
Releases will provide some views on economic data, with B-tier releases spanning from Durable Goods to Housing Price Indexes and more.
Of course, keep a close eye on the PPI data releasing on Friday morning, only high-tier data of the week (8:30 A.M.)
The Bank of Canada will begin the celebrations on Wednesday morning (9:45 A.M.) with their rate decision, which should be a non-event but looking at recent volatility, it will be very interesting to see how Governor Macklem tackles the situation.
Loonie traders should also pay attention to Canadian GDP on Friday morning.
Not much later on Wednesday (14:30), the classic FOMC will be taking Markets by its hands – Waiting for the event could either be a long, slow walk or a high-paced seesaw adventure depending on what happens over the week.
Of course, keep a very close eye on any announcements regarding the Next Fed Chair as the decision could be released anytime and it will be market-moving!
And as always these days, keep news in check – things could be heating up in Iran with the latest ammassing of military assets in the Middle East.
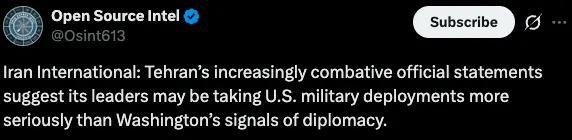
Latest News regarding Iran – Source: X, Iran International
Next Week's High Tier Economic Events
For all market-moving economic releases and events, see the MarketPulse Economic Calendar. (High-tier data only)
Safe Trades and enjoy your weekend!