Sample Category Title
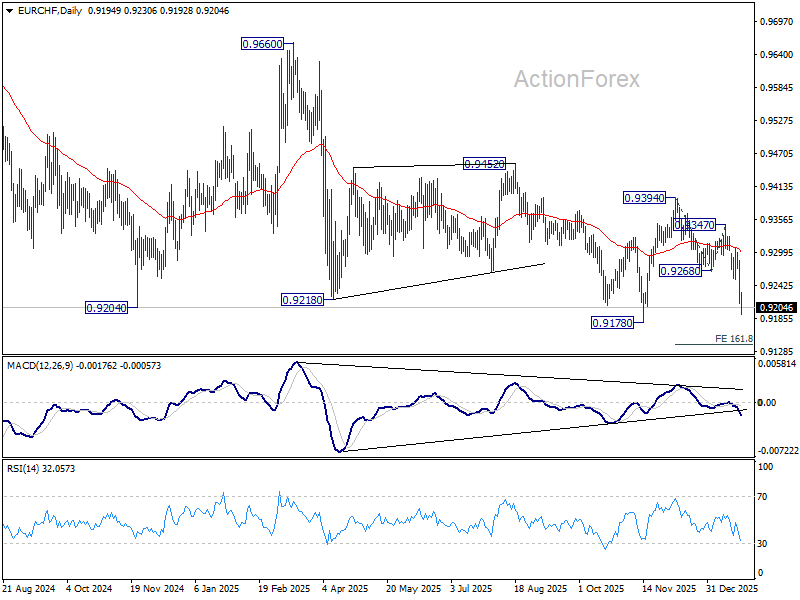
EUR/CHF Daily Outlook
Daily Pivots: (S1) 0.9202; (P) 0.9246; (R1) 0.9276; More....
Intraday bias in EUR/CHF stays on the downside for retesting 0.9178 low. Firm break there will resume larger down trend. On the upside, above 0.9253 support turned resistance will turn intraday bias neutral and bring consolidations, before staging another decline.
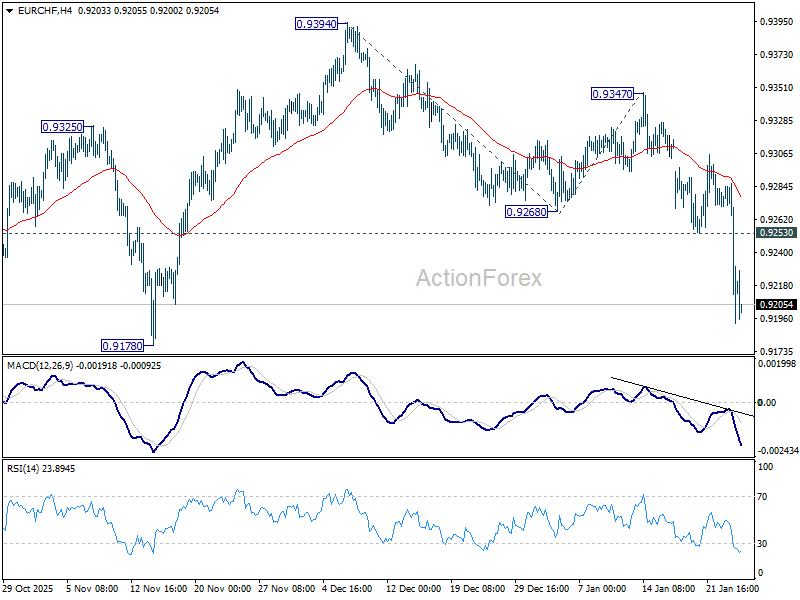
In the bigger picture, another rejection by 55 W EMA (now at 0.9350) keeps outlook bearish. Downtrend from 1.2004 (2018 high) is still in progress. Firm break of 0.9178 will target 61.8% projection of 1.1149 to 0.9407 from 0.9928 0.8851. Outlook will stay bearish as long as 0.9394 resistance holds, in case of recovery.
AUD/USD Daily Report
Daily Pivots: (S1) 0.6853; (P) 0.6876; (R1) 0.6918; More...
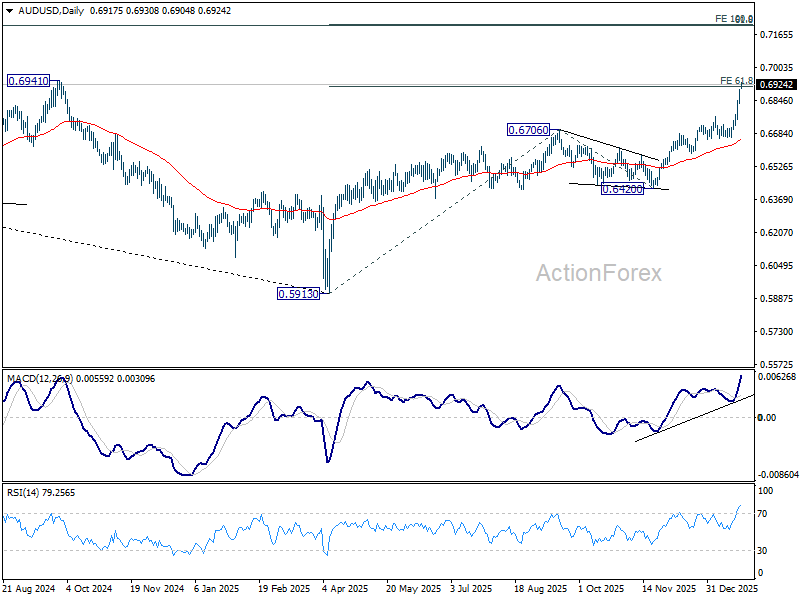
AUD/USD's rally continues today and intraday bias stays on the upside, sustained trading above 61.8% projection of 0.5913 to 0.6706 from 0.6420 at 0.6910 will pave the way to 100% projection at 0.7213. On the downside, below 0.6833 minor support will turn intraday bias neutral and bring consolidations first. But downside of retreat should be contained well above 0.6667 support to bring another rally.
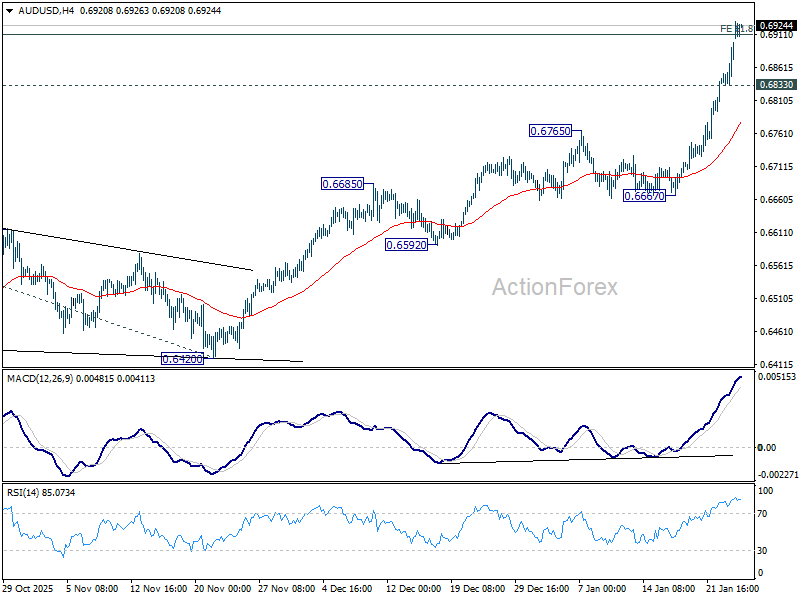
In the bigger picture, current development argues that rise from 0.5913 (2024 low) is reversing whole down trend from 0.8006 (2021 high). Further rally should be seen to 61.8% retracement of 0.8006 to 0.5913 at 0.7206. This will remain the favored case as long as 0.6420 support holds, even in case of deep pullback.
USD/CAD Daily Outlook
Daily Pivots: (S1) 1.3663; (P) 1.3732; (R1) 1.3769; More...
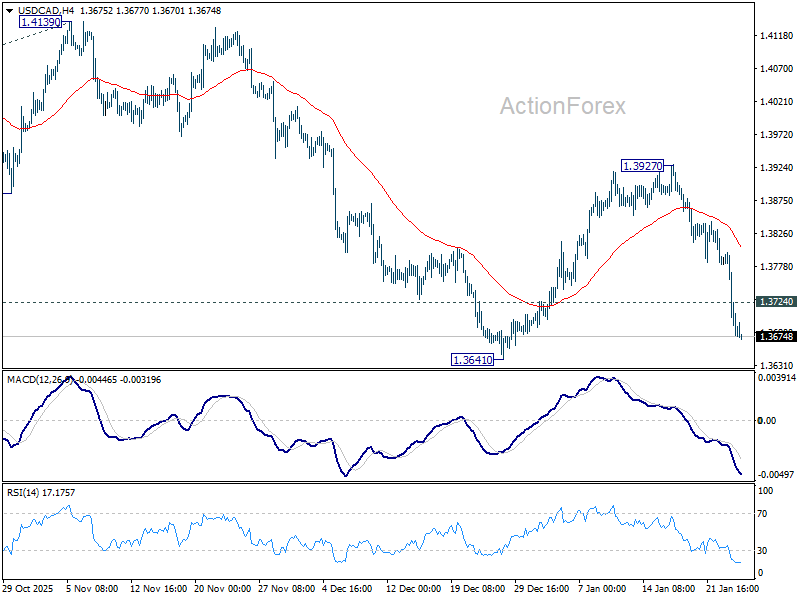
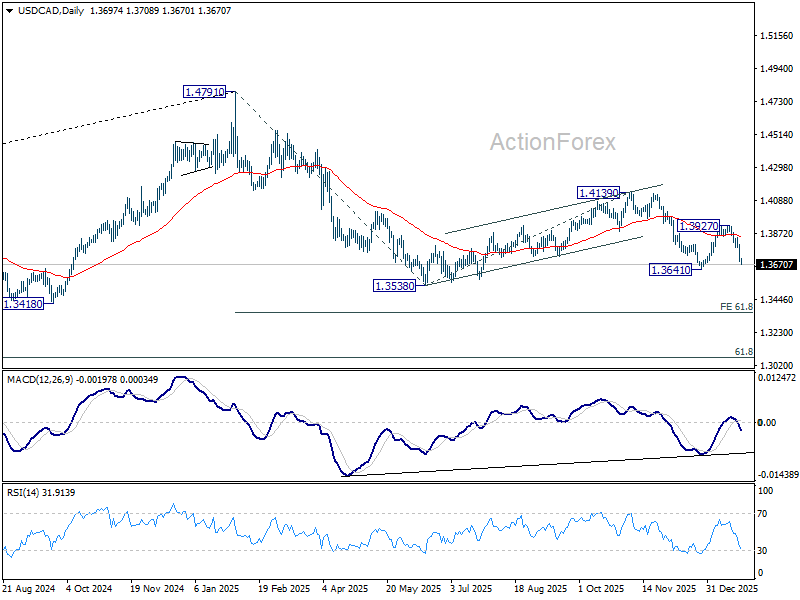
Intraday bias in USD/CAD remains on the downside for 1.3641 support. Firm break there will resume the decline from 1.4139 and target a retest on 1.3538 low. On the upside, above 1.3724 minor resistance will turn intraday bias neutral and bring consolidations first.
In the bigger picture, price actions from 1.4791 are seen as a corrective pattern to the whole up trend from 1.2005 (2021 low). Deeper fall could be seen as the pattern extends, and break of 1.3538 will target 61.8% retracement of 1.2005 to 1.4791 at 1.3069. For now, medium term outlook will be neutral until there are signs that the correction has completed.
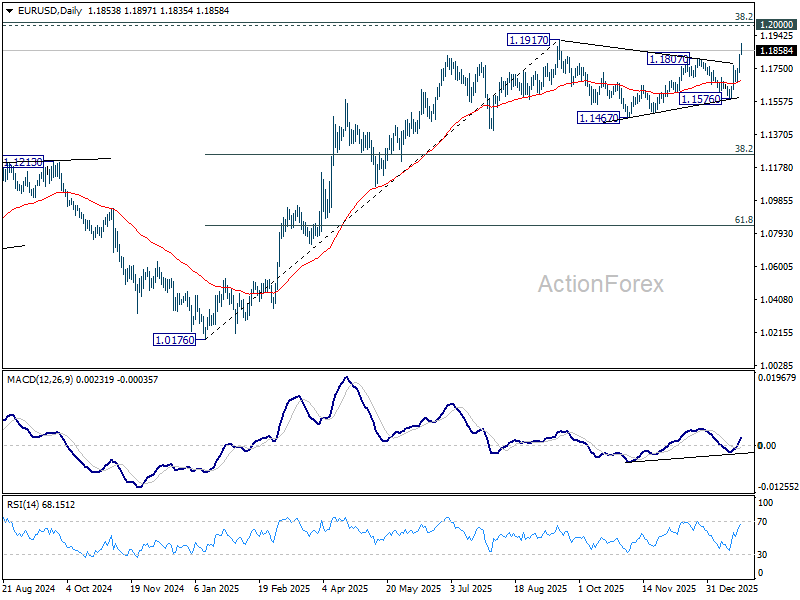
EUR/USD Daily Outlook
Daily Pivots: (S1) 1.1760; (P) 1.1797; (R1) 1.1866; More….
Intraday bias in EUR/USD stays on the upside for retesting 1.1917 key resistance. Firm break there will resume larger up trend. On the downside, below 1.1812 minor support will mix up the outlook and turn intraday bias neutral again.
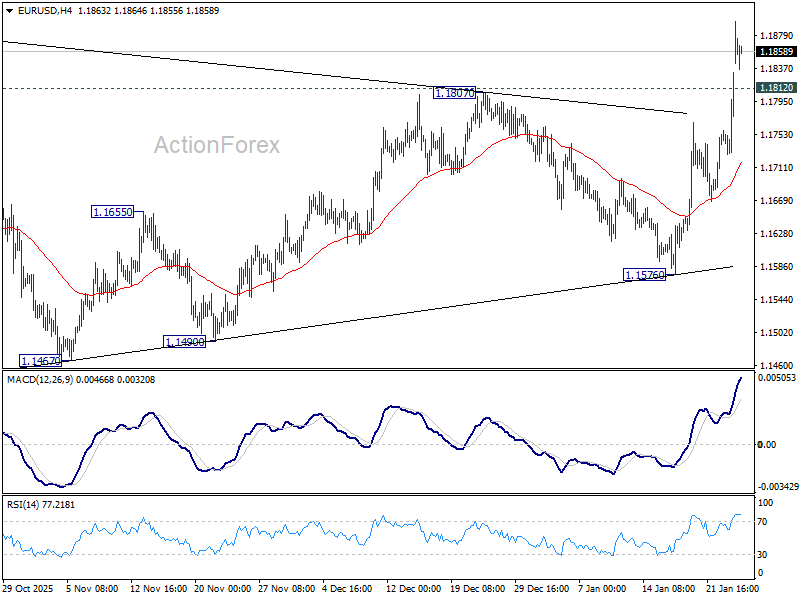
In the bigger picture, as long as 55 W EMA (now at 1.1443) holds, up trend from 0.9534 (2022 low) is still in favor to continue. Decisive break of 1.2 key psychological level will carry larger bullish implication. However, sustained trading below 55 W EMA will argue that rise from 0.9534 has completed as a three wave corrective bounce, and keep long term outlook bearish.
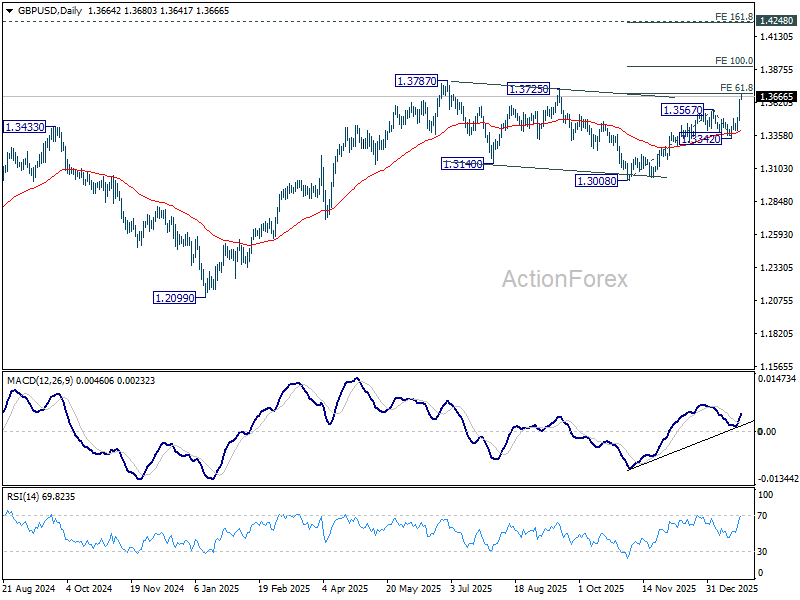
GBP/USD Daily Outlook
Daily Pivots: (S1) 1.3534; (P) 1.3590; (R1) 1.3698; More...
GBP/USD's rally continues today and intraday bias stays on the upside at this point. Firm break of 61.8% projection of 1.3008 to 1.3567 from 1.3342 at 1.3687 should prompt upside acceleration through 1.3787 high to 100% projection at 1.3901. On the downside, below 1.3591 minor support will turn intraday bias neutral. But retreat should be contained well above 1.3342 support to bring another rally.
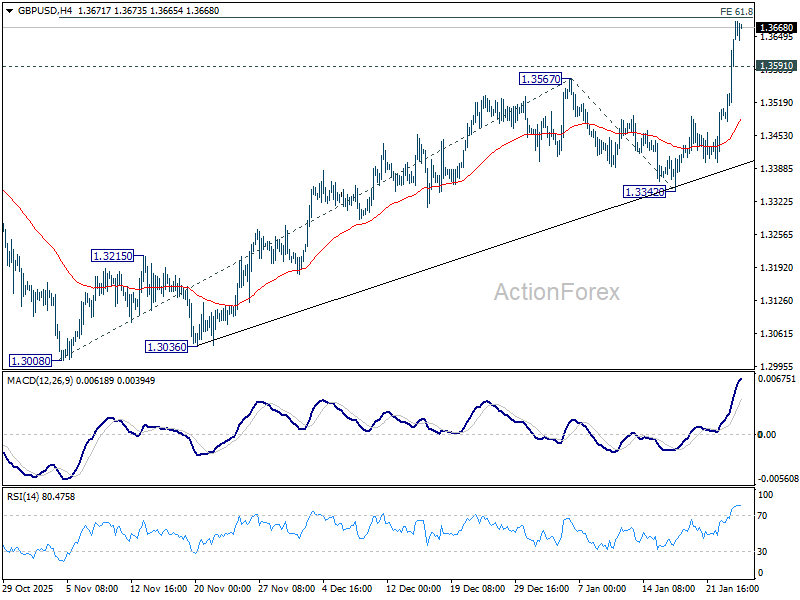
In the bigger picture, price actions from 1.3787 (2025 high) are seen as a correction to the larger up trend from 1.3051 (2022 low). That might have completed at 1.3008 already. Firm break of 1.3787 will confirm up trend resumption. Next target is 1.4284 key resistance (2021 high). This will remain the favored case as long as 1.3008 support holds.
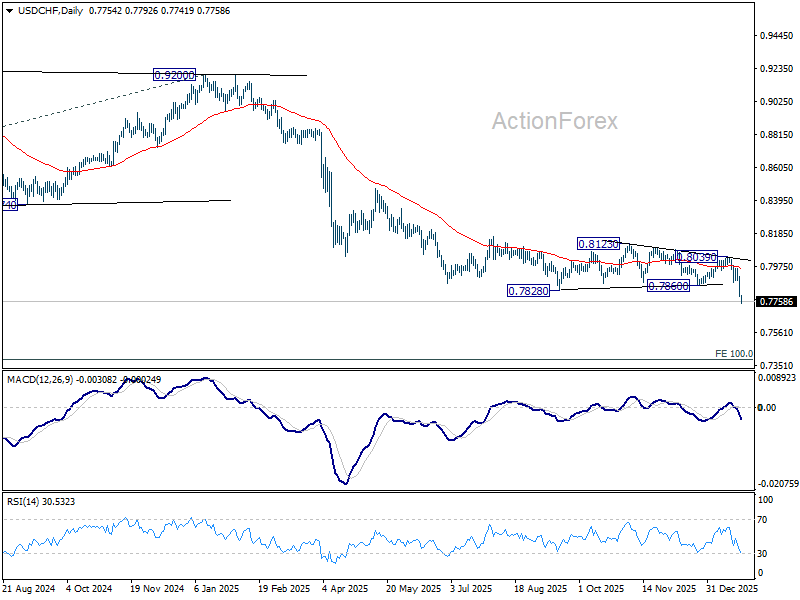
USD/CHF Daily Outlook
Daily Pivots: (S1) 0.7754; (P) 0.7836; (R1) 0.7884; More….
Intraday bias in USD/CHF stays on the downside. Current fall is part of the larger down trend and should target 0.7382 projection level. On the upside, above 0.7828 minor resistance will turn intraday bias neutral first. But recovery should be limited well below 0.8039 resistance to bring another fall.
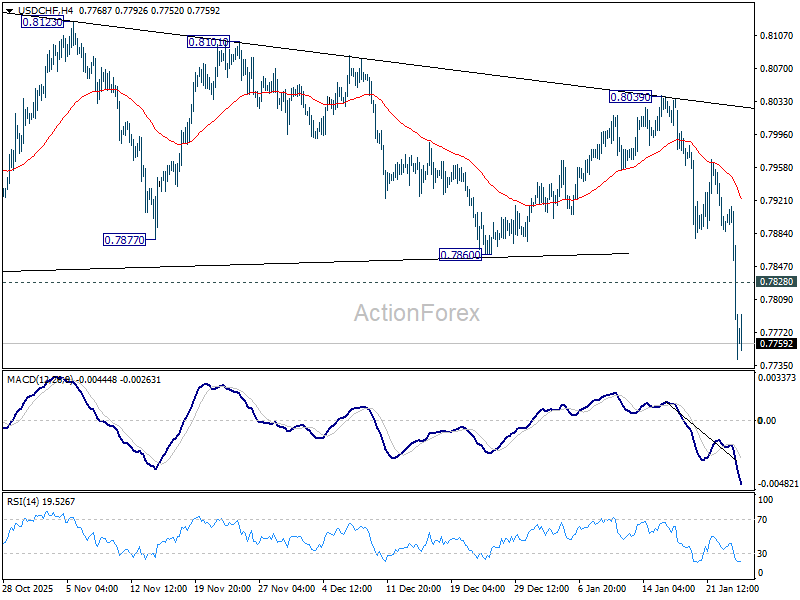
In the bigger picture, larger down trend from 1.0342 (2017 high) is still in progress and resuming. Next target is 100% projection of 1.0146 (2022 high) to 0.8332 from 0.9200 at 0.7382. In any case, outlook will stay bearish as long as 55 W EMA (now at 038199) holds.
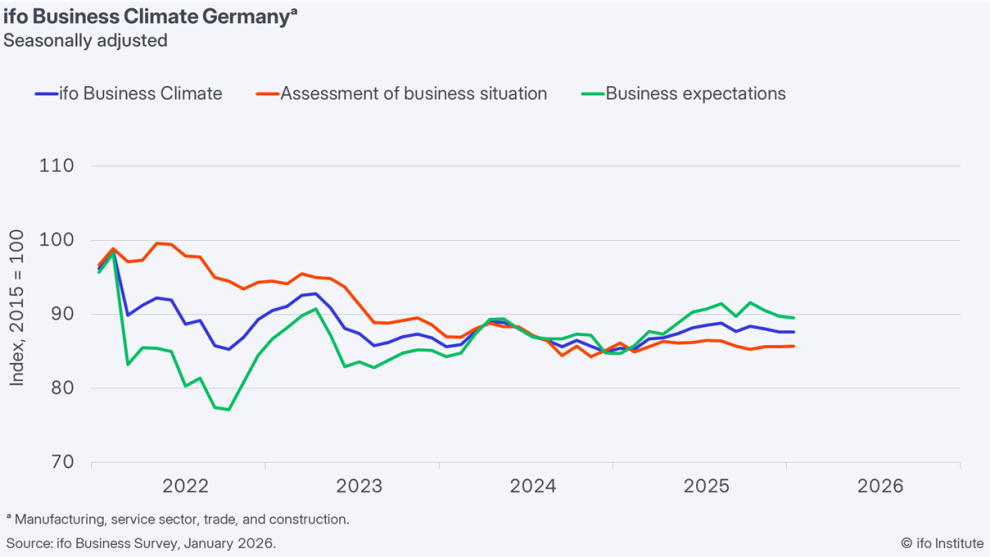
German Ifo stalls at 87.6, as weak momentum carries into new year
Germany’s Ifo Institute Business Climate Index was unchanged at 87.6 in January, undershooting expectations for a modest improvement to 88.3. The stagnant headline reading reinforces the view that Germany’s economy is entering the new year without meaningful traction.
Beneath the surface, the details were mixed. Current Assessment Index edged slightly higher from 85.6 to 85.7, suggesting conditions have stabilized but remain weak. In contrast, Expectations Index slipped from 89.7 to 89.5, indicating that confidence about the months ahead has softened rather than improved.
Sector performance highlighted the uneven picture. Manufacturing showed a notable improvement, rising from -14.6 to -12.2, while trade and construction also edged higher to -21.1 and -14.2 respectively. Services, however, deteriorated from -2.1 to -2.6. Ifo summed up the survey bluntly, saying the German economy is "starting the new year with little momentum".
Gold Surges Above 5,000 USD: Safe-Haven Demand Explodes
Gold has broken through the historic 5,000 USD per troy ounce mark, rising above 5,075 USD for the first time. The metal continues its record rally as investors aggressively shift into defensive assets amid escalating trade and geopolitical uncertainty.
The main catalyst was renewed rhetoric from US President Donald Trump. Over the weekend, he stated that Washington would seek sovereignty over parts of Greenland where US military bases are located. These comments reignited market anxiety, coming just days after a temporary easing of tariff threats against several European countries.
Further pressure on global markets followed Trump’s warning to Canada. He stated that all Canadian exports to the US could face 100% tariffs if Ottawa finalises a trade agreement with China. The statement came a week after Canadian Prime Minister Mark Carney announced a preliminary deal with Beijing, which involves a mutual reduction in tariffs.
Geopolitical risks also remain elevated. Ukraine and Russia held another round of US-mediated talks without reaching an agreement, although both sides signalled readiness to continue negotiations next weekend.
As a result, rising geopolitical tensions and aggressive trade threats have sharply increased capital inflows into gold, further strengthening its role as the primary global safe-haven asset.
Technical Analysis
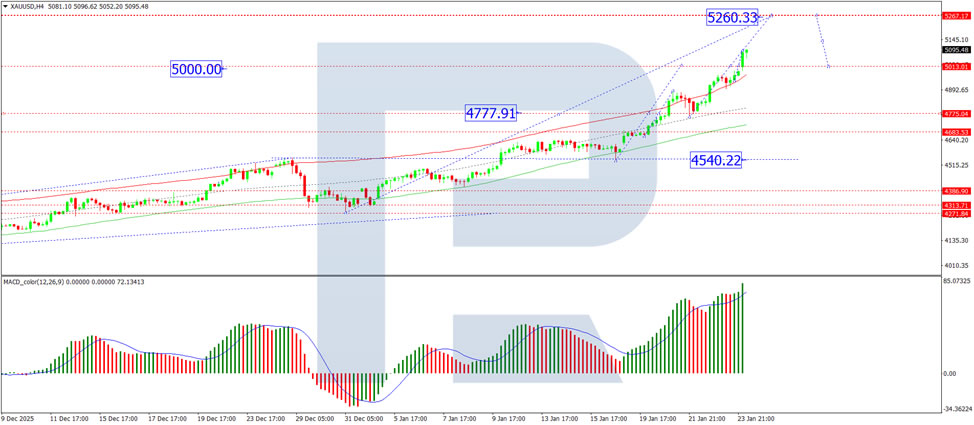
On the H4 XAUUSD chart, gold has confidently broken above 5,000 and is now developing a strong bullish wave towards the 5,215 level. After reaching this area, a corrective pullback towards 5,000 is possible. The MACD confirms strong upside momentum, with the signal line at highs and pointing firmly upwards.
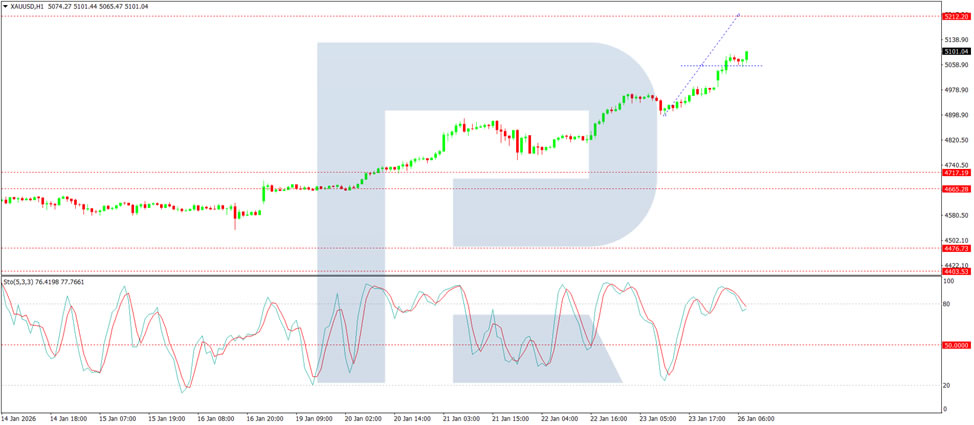
On the H1 chart, the price has broken and consolidated above the 5,050 level, which is acting as support. The trend is expected to extend towards 5,200. The Stochastic oscillator supports this bullish scenario, with the signal line above 50 and continuing to rise.
Conclusion
Gold has entered a new historical phase above 5,000 USD, driven by escalating geopolitical risks and aggressive US trade rhetoric. As long as uncertainty around global politics and trade persists, gold is likely to remain strongly supported, with further upside potential despite the risk of short-term technical corrections.
AUD/USD And NZD/USD Advance As Risk Appetite Accelerates
AUD/USD started a fresh increase above 0.6850 and 0.6880. NZD/USD is also rising and might aim for more gains above 0.6000.
Important Takeaways for AUD USD and NZD USD Analysis Today
- The Aussie Dollar started a decent increase above 0.6850 against the US Dollar.
- There is a short-term bullish trend line forming with support at 0.6880 on the hourly chart of AUD/USD at FXOpen.
- NZD/USD is consolidating gains above the 0.5950 pivot zone.
- There is a key bullish trend line forming with support at 0.5935 on the hourly chart of NZD/USD at FXOpen.
AUD/USD Technical Analysis
On the hourly chart of AUD/USD at FXOpen, the pair started a fresh increase from 0.6725. The Aussie Dollar was able to clear 0.6800 to move into a positive zone against the US Dollar.
There was a close above 0.6880 and the 50-hour simple moving average. Finally, the pair tested 0.6930. A high was formed near 0.6930 and the pair recently started a consolidation phase. There was a minor decline below 0.6920.
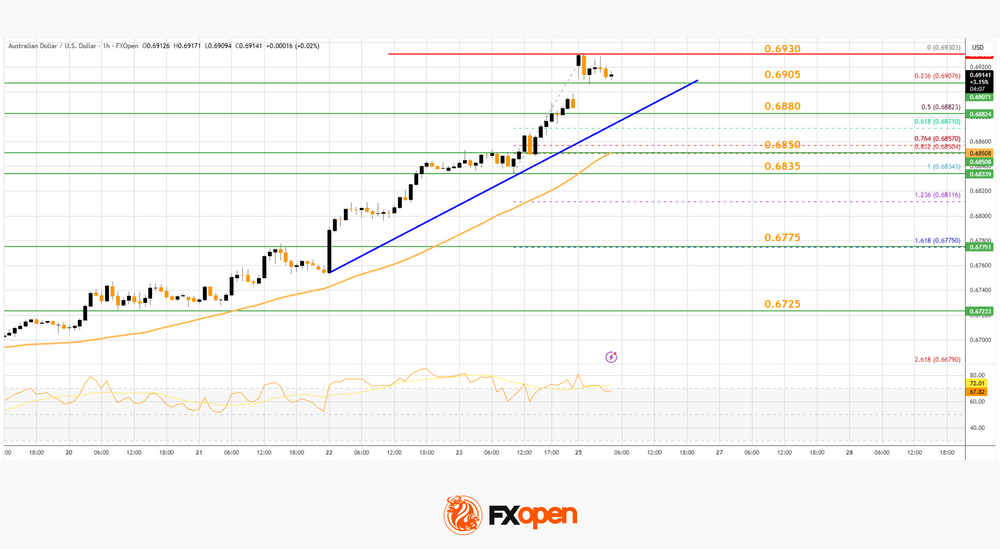
On the downside, initial support is near the 23.6% Fib retracement level of the upward move from the 0.6834 swing low to the 0.6930 high. The next area of interest could be near a short-term bullish trend line at 0.6880 and the 50% Fib retracement.
If there is a downside break below 0.6880, the pair could extend its decline toward the 0.6850 zone and the 50-hour simple moving average. Any more losses might signal a move toward 0.6755.
On the upside, the AUD/USD chart indicates that the pair is now facing resistance near 0.6930. The first major hurdle for the bulls might be 0.6950. An upside break above 0.6950 might send the pair further higher. The next stop is near 0.7000. Any more gains could clear the path for a move toward 0.7085.
NZD/USD Technical Analysis
On the hourly chart of NZD/USD on FXOpen, the pair started a fresh increase from 0.5820. The New Zealand Dollar broke the 0.5900 barrier to start the recent rally against the US Dollar.
The pair settled above 0.5920 and the 50-hour simple moving average. It tested 0.5975 and is currently consolidating gains. There was a minor pullback below 0.5960. The NZD/USD chart suggests that the RSI is now just above 70.
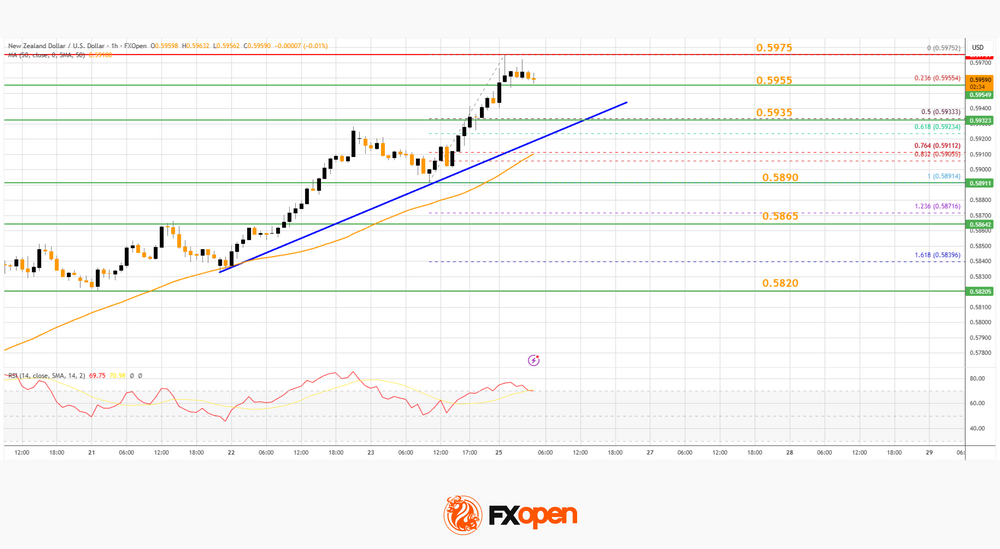
On the downside, immediate support is near the 0.5955 level and the 23.6% Fib retracement level of the upward move from the 0.5891 swing low to the 0.5975 high.
The first key zone for the bulls sits at 0.5935, a key bullish trend line, and the 50% Fib retracement. The next key level is 0.5890. If there is a downside break below 0.5890, the pair might slide toward 0.5865. Any more losses could lead NZD/USD into a bearish zone to 0.5820.
On the upside, the pair might struggle near 0.5975. The next major resistance is near the 0.6000 handle. A clear move above 0.6000 might even push the pair toward 0.6050. Any more gains might clear the path for a move toward the 0.6120 zone in the coming days.
Trade over 50 forex markets 24 hours a day with FXOpen. Take advantage of low commissions, deep liquidity, and spreads from 0.0 pips (additional fees may apply). Open your FXOpen account now or learn more about trading forex with FXOpen.
This article represents the opinion of the Companies operating under the FXOpen brand only. It is not to be construed as an offer, solicitation, or recommendation with respect to products and services provided by the Companies operating under the FXOpen brand, nor is it to be considered financial advice.
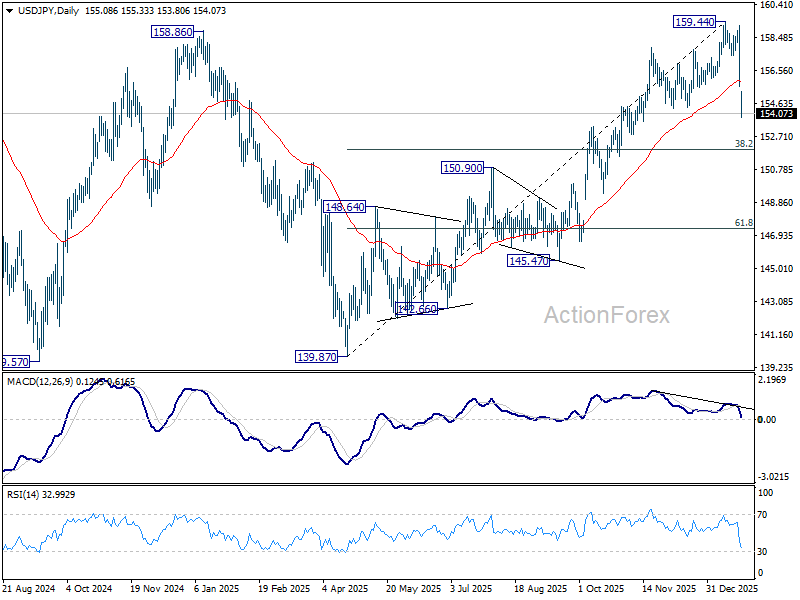
USD/JPY Daily Outlook
Daily Pivots: (S1) 154.48; (P) 156.86; (R1) 158.09; More...
USD/JPY gaps lower today and fall from 159.44 accelerates. Intraday bias stays on the downside for 38.2% retracement of 139.87 to 159.44 at 151.96. Strong support should be seen there to bring rebound, at least on first attempt. On the upside above 155.33 minor resistance will turn intraday bias neutral and bring consolidations first. However, decisive break of 151.96 will argue that fall from 159.44 is not a correction, be reversing whole rise from 139.87. Deeper decline would then be seen to 61.8% retracement at 147.34.
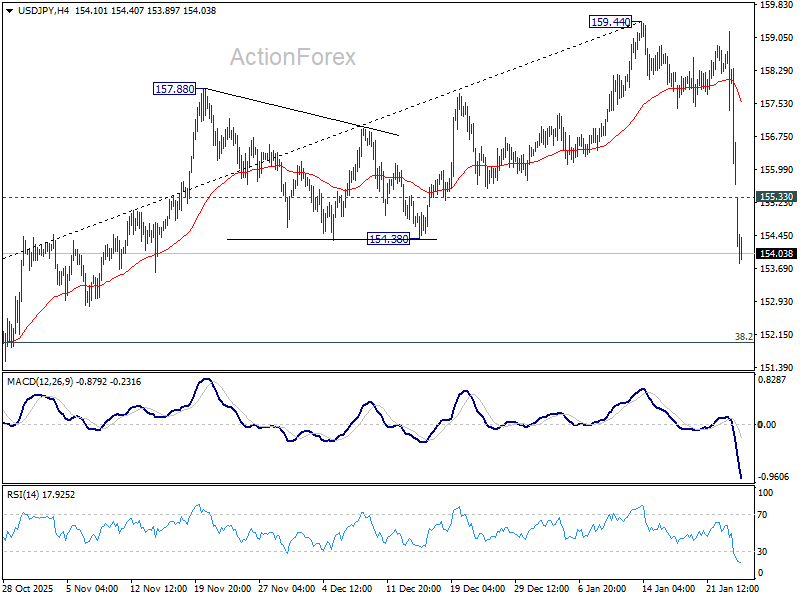
In the bigger picture, outlook is unchanged that corrective pattern from 161.94 (2024 high) should have completed with three waves at 139.87. Larger up trend from 102.58 (2021 low) could be ready to resume through 161.94. This will remain the favored case as long as 55 W EMA (now at 151.35) holds. However, sustained break of 55 W EMA will argue that the pattern from 161.94 is extending with another falling leg.