Sample Category Title
USDCHF: Sellers Reject Fibonacci Extension Zone, Decline Resumes
USDCHF has provided traders with a textbook example of how Fibonacci extension zones can act as powerful resistance. After an extended move higher, price reached the 0.8020–0.8092 extension area, where sellers decisively stepped in. The rejection at this zone not only halted the advance but triggered a fresh wave of decline, reinforcing the importance of monitoring these levels for potential reversals. For traders, this setup highlights how extension zones can sharpen risk management, offer clear invalidation points, and reveal where market sentiment shifts from bullish exhaustion to renewed bearish momentum. The following charts illustrate how price action unfolded around the Fibonacci extension zone, highlighting the rejection and subsequent decline.
USDCHF 4‑Hour Chart (Jan 18): Sellers Emerged at 0.8020–0.8092, Rejecting Resistance and Driving Price Lower
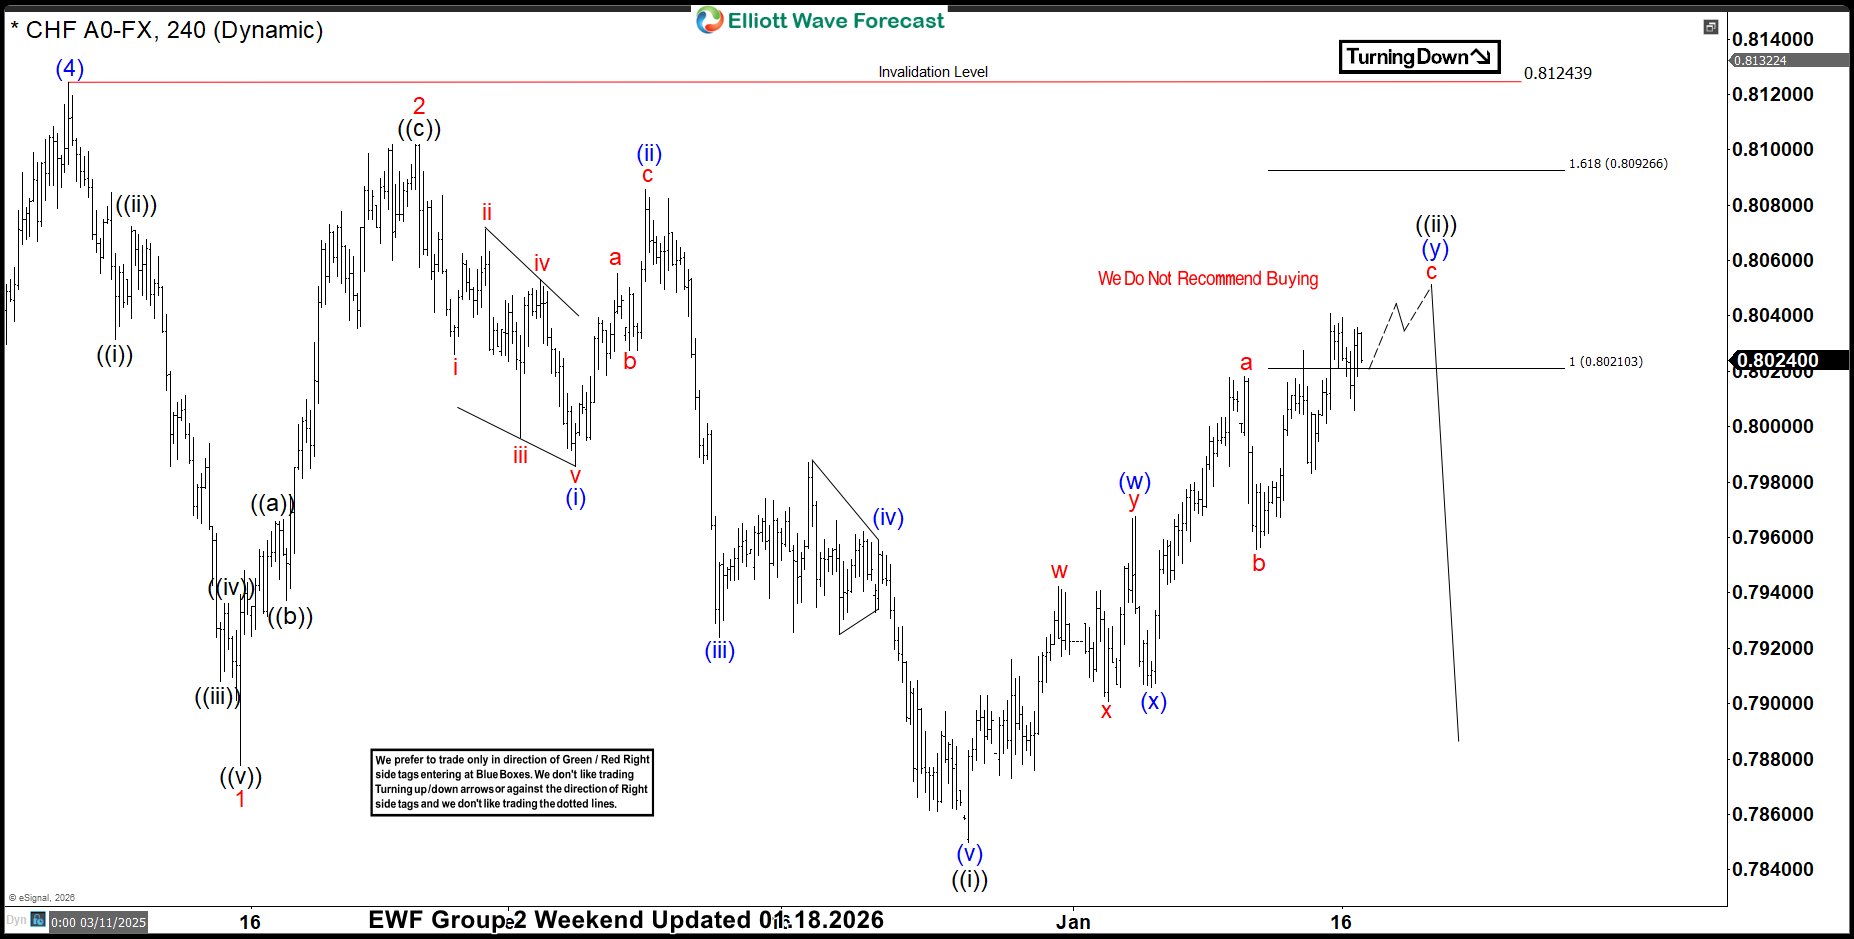
The decline in USDCHF from the November 5 peak unfolded in three waves, suggesting that subsequent bounces were likely to fail in either 3, 7, or 11 swings for an extension lower as far as November 25 high remained intacct. The 4‑hour chart from January 18 captures the advance from the December 25 low, which developed in seven swings and was expected to terminate between 0.8020–0.8092 before the downtrend resumed. The 0.81018 level serves as the key invalidation point—holding below this resistance keeps the bearish view intact and reinforces the expectation of further decline.
USDCHF 4‑Hour Chart (Jan 26): Sellers defended 0.8020–0.8092, breaking September 17 low and driving wave ((iii)) lower.
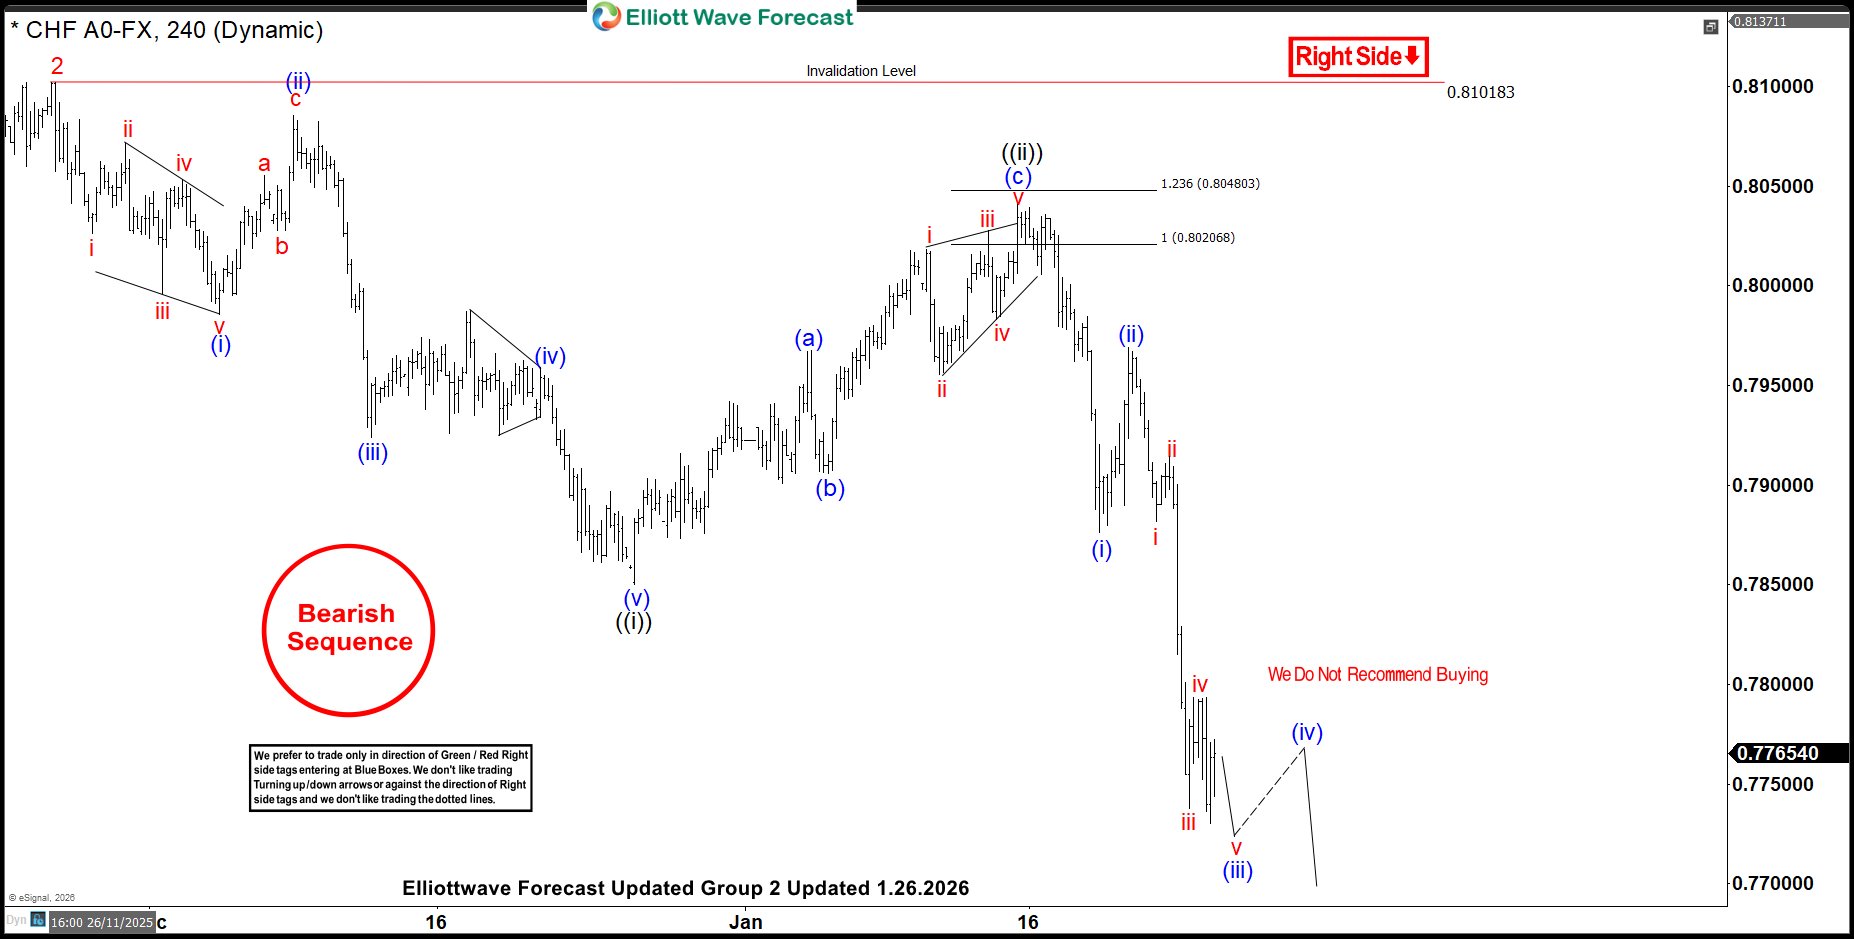
USDCHF Jan 26 4 Hour Elliott Wave ChartUSDCHF found sellers in the 0.8020–0.8092 Fibonacci extension area and resumed its decline. Price has already broken below the September 17 low and is currently unfolding wave ((iii)) of 3 down from the November 5 peak. The pair has reached the 100% Fibonacci extension of wave ((i)) relative to wave ((ii)), but ideally should extend toward 0.7625, which represents the 161.8% extension—a typical level for wave ((iii)) to complete. In the near term, any corrective bounces are expected to fail in 3, 7, or 11 swings, offering traders short‑term selling opportunities for further downside.
The rejection at the 0.8020–0.8092 zone and the unfolding wave ((iii)) decline highlight how Fibonacci extensions and Elliott Wave structures can provide traders with a clear technical roadmap. Staying ahead of these setups requires timely analysis and disciplined execution. By joining our services, traders gain access to real‑time charts, actionable forecasts, and educational insights designed to sharpen decision‑making and keep them ahead of the crowd. If you want to consistently spot opportunities like this USDCHF setup and Blue Box Trade Setups before the market reacts, our community and resources are built to guide you every step of the way!
From Fib Levels to Fireworks: Natural Gas Explodes 146% in 12 Days
Natural Gas has once again reminded traders of its explosive potential. After finding buyers at a key Fibonacci extension area, prices catapulted 146% in just 12 trading days—an extraordinary rally that left skeptics behind and rewarded those who trusted the technical confluence. This surge wasn’t just about numbers on a chart; it was a vivid demonstration of how market psychology, technical precision, and momentum can align to produce breathtaking moves. For traders and analysts alike, the rally offers a textbook case study in how Fibonacci levels can act as springboards for powerful trends. Charts often speak louder than words, so let’s turn to the charts to see how this remarkable move unfolded…
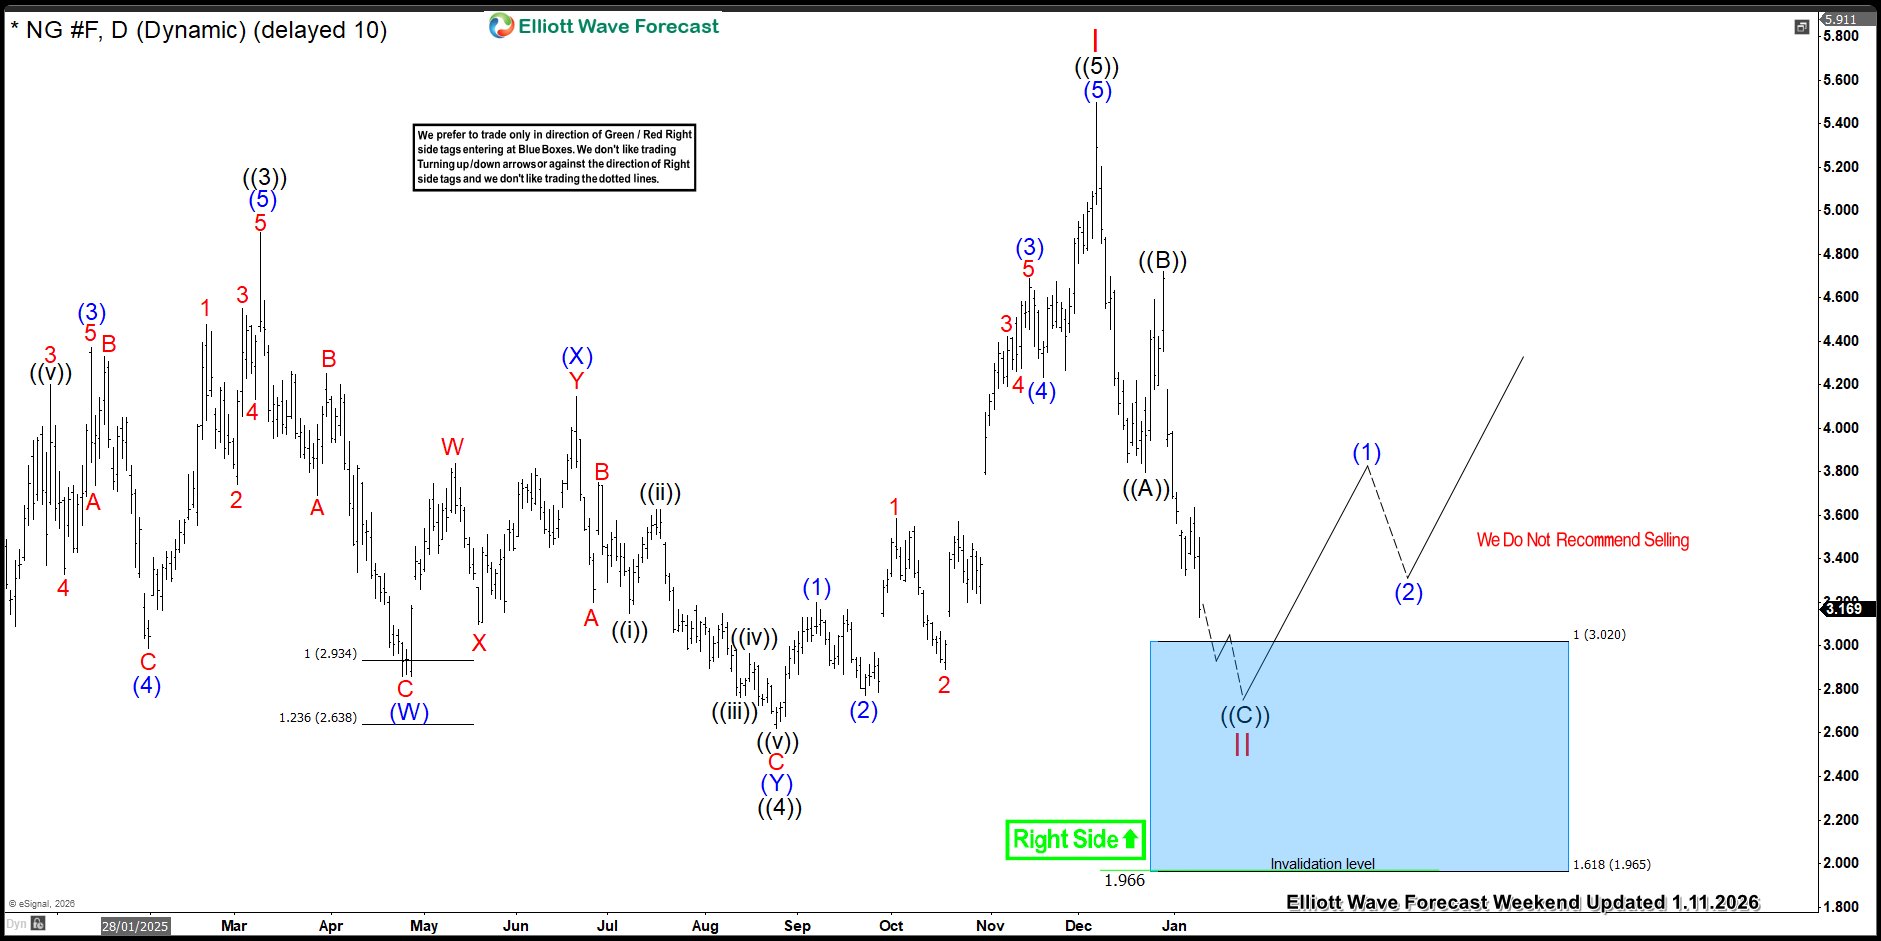
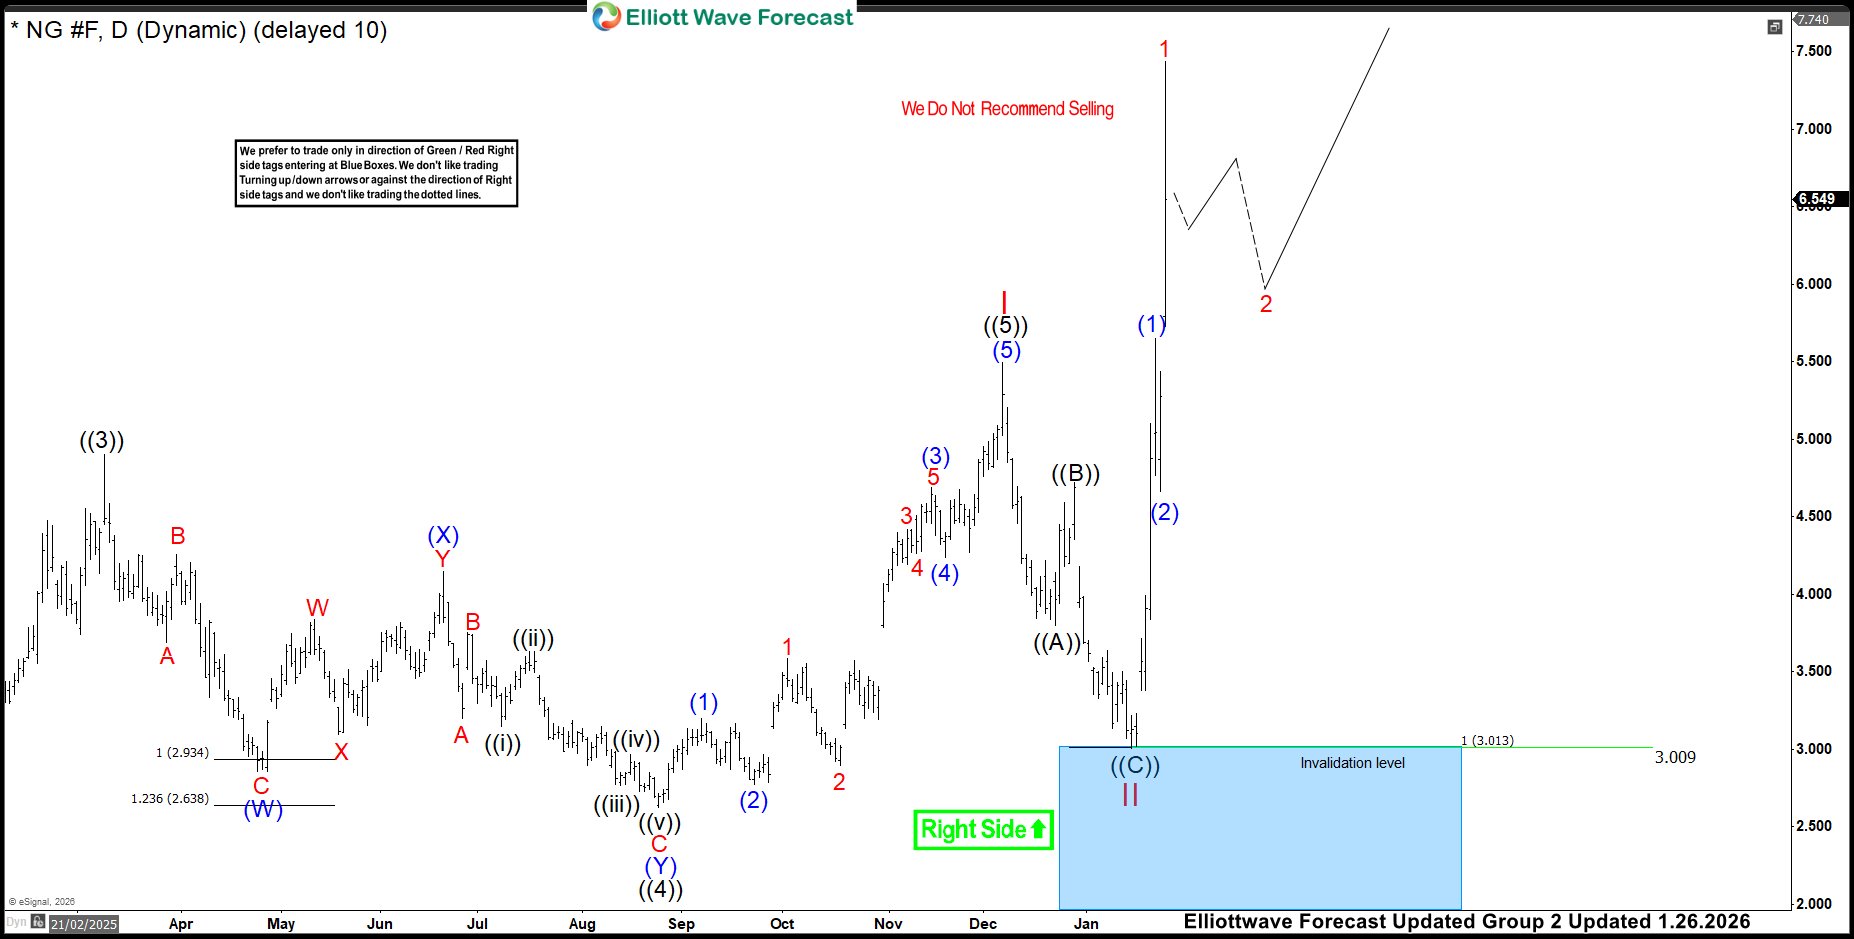
Natural Gas Daily Chart (Jan 14): Price approaches the 3.022 – 1.965 Fibonacci extension zone
Natural Gas 11 Jan Daily Elliott Wave ChartOn the daily chart from January 11, Natural Gas was approaching the 3.022 – 1.965 blue box zone—a critical Fibonacci extension area we had been watching closely. This region carried the potential to attract buyers and set the stage for the next leg of the rally. Going to a smaller time frame, within wave (( C )), we saw wave (3) unfolded shorter than wave (1). This gave us a precise invalidation level for wave (5) of ((C)) at 3.008. A break below that level would have opened the door for a deeper pullback toward the 2.620 – 1.965 area. However, buyers stepped in just before this threshold was tested, defending the structure and reigniting the rally.
Natural Gas Daily Chart (Jan 26): Fibonacci extension zone drives a powerful 146% rally in 12 days
“Daily chart from January 26 above captures the explosive rally that followed. After price respected the Blue box zone, buyers stepped in with conviction, driving Natural Gas sharply higher reaching a high of $7.439. The move unfolded with textbook momentum, surging 146% in less than two weeks and confirming the strength of the technical setup. The Natural Gas rally underscores a simple truth: Blue box zones mark decisive turning points. Recognizing these areas early can sharpen your edge, helping you anticipate momentum shifts and position yourselves in the market with confidence.
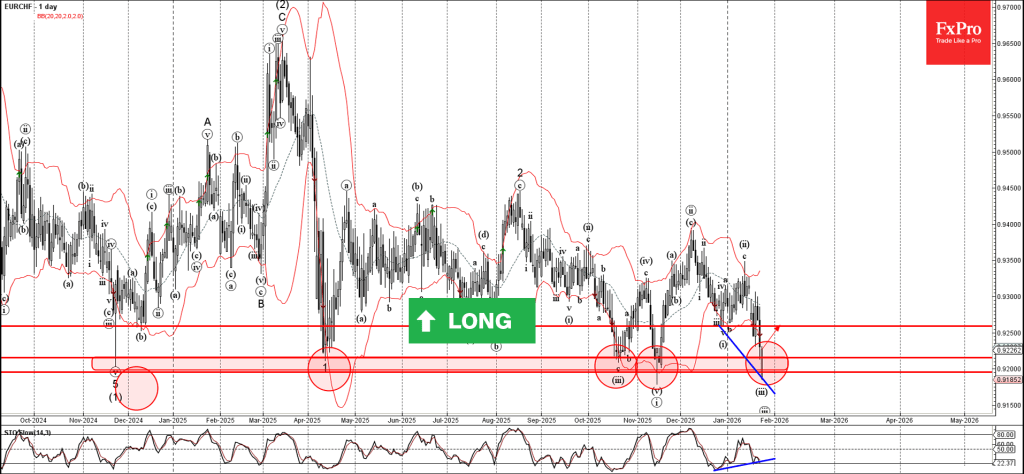
EURCHF Wave Analysis
EURCHF: ⬆️ Buy
- EURCHF reversed from support zone
- Likely to rise to resistance level 0.9260
EURCHF currency pair recently reversed up from the strong support area between the support levels 0.9195 and 0.9215 (which has been reversing the price from the end of 2024) and the lower daily Bollinger Band.
The upward reversal from this support zone stopped the previous minor impulse wave iii from the start of January.
Given the strength of the aforementioned support area and the bullish divergence on the daily Stochastic, EURCHF currency pair can be expected to rise to the next resistance level 0.9260 (former monthly low from December).
Eco Data 1/27/26
| GMT | Ccy | Events | Act | Cons | Prev | Rev |
|---|---|---|---|---|---|---|
| 23:50 | JPY | Corporate Service Price Index Y/Y Dec | 2.60% | 2.50% | 2.70% | |
| 00:30 | AUD | NAB Business Conditions Dec | 9 | 7 | ||
| 00:30 | AUD | NAB Business Confidence Dec | 3 | 1 | 2 | |
| 14:00 | USD | S&P/CS Composite-20 HPI Y/Y Nov | 1.40% | 1.20% | 1.30% | |
| 14:00 | USD | Housing Price Index M/M Nov | 0.60% | 0.30% | 0.40% | |
| 15:00 | USD | Consumer Confidence Jan | 84.5 | 90.1 | 89.1 | 94.2 |
| 23:50 | JPY |
| Corporate Service Price Index Y/Y Dec | |
| Actual | 2.60% |
| Consensus | 2.50% |
| Previous | 2.70% |
| 00:30 | AUD |
| NAB Business Conditions Dec | |
| Actual | 9 |
| Consensus | |
| Previous | 7 |
| 00:30 | AUD |
| NAB Business Confidence Dec | |
| Actual | 3 |
| Consensus | |
| Previous | 1 |
| Revised | 2 |
| 14:00 | USD |
| S&P/CS Composite-20 HPI Y/Y Nov | |
| Actual | 1.40% |
| Consensus | 1.20% |
| Previous | 1.30% |
| 14:00 | USD |
| Housing Price Index M/M Nov | |
| Actual | 0.60% |
| Consensus | 0.30% |
| Previous | 0.40% |
| 15:00 | USD |
| Consumer Confidence Jan | |
| Actual | 84.5 |
| Consensus | 90.1 |
| Previous | 89.1 |
| Revised | 94.2 |
US Government Shutdown Watch: Shutdown Odds Rising
Summary
- The odds of a government shutdown starting on January 31 have risen sharply. The deal that was struck in November to end the record 43-day shutdown resulted in a continuing resolution extending government funding for most federal agencies (accounting for ~90% of annual discretionary spending) through January 30. That bill provided full-year appropriations for three of the 12 annual appropriation bills (Agriculture, Military Construction and Veteran Affairs and the Legislative branch) accounting for the remaining ~10% of the annual discretionary budget.
- Over the past few weeks, the House of Representatives passed the nine remaining fiscal year (FY) 2026 appropriations bills on a bipartisan basis, and the Senate was widely expected to package them into one bill and pass it into law before the January 31 deadline. If enacted, this bill would keep federal discretionary spending roughly flat compared to FY 2025, and it would take another shutdown off the table until October 1 at the earliest.
- As recently as Friday, a shutdown seemed quite unlikely. Prediction markets such as Polymarket pegged the odds of a shutdown at roughly 10% as of Friday evening.
- The shooting by federal agents that occurred in Minneapolis on Saturday has changed the outlook. Importantly, one of the nine annual appropriations bills passed by the House is Homeland Security, which houses Customs and Border Protection (CBP) and Immigration and Customs Enforcement (ICE). In the wake of the incident, some Senate Democrats who were widely expected to support the budget bill have pulled their support until there have been some policy and process reforms to CBP/ICE.
- Even if all 53 Republicans vote for the bill, it would take at least seven Democrats to clear the de facto 60 vote threshold in the Senate, leaving the process at a stalemate. As of this writing, Polymarket traders priced the odds of a shutdown starting Saturday at roughly 80%, which strikes us as reasonable based on what we know now.
- The situation is still highly fluid, and anything can happen, but the deadline for action is imminent. It will be difficult to get a new bill through both chambers in less than a week as the House is scheduled to be on recess this week and the Senate is just coming back into town on Monday/Tuesday. Bad weather throughout much of the country further compounds the time crunch.
- If a short shutdown occurs, this would delay but not cancel the BLS/BEA produced economic data that are slated to be released in the coming weeks, such as the January employment report (scheduled for Feb. 6) and the January CPI report (Feb. 11). That said, if the shutdown was much longer, like the one that occurred last fall, there once again could be severe disruptions that result in lower quality and/or missing data.
- As was the case last fall, a shutdown starting Saturday would not impact the debt ceiling. The U.S. Treasury's borrowing capacity would not be exhausted, and Treasury security auction and interest payments would continue as scheduled.
- Should another extended shutdown occur, it would leave the FOMC in a tricky spot. The lack of visibility that arises from receiving limited economic data could thrust an already divided FOMC into a period of stasis. Fed officials lamented the lack of clarity on inflation during the last shutdown. We expect they would again use this argument to delay additional cuts. We have maintained that the window is closing for the Fed to cut rates again under Chair Powell, and another extended shutdown would not help.
FOMC Meeting Preview: Fed To Keep Rates on Hold, Implications for DXY and Gold
The meeting of the Federal Open Market Committee (FOMC) on January 28, 2026 will be an intriguing one.
The current economic data is showing a strange pattern that doesn't follow the usual rules: the US economy is growing very fast with estimates suggesting a massive 5.4% growth rate for Q4 but at the same time, the job market is slowing down.
Meanwhile, inflation is stuck at 3.0%, which is higher than what the central bank wants to see.
Usually, fast growth leads to higher inflation and a hot job market, but that isn't happening right now. This split could mean that businesses are becoming much more efficient and productive.
However, it could also be a warning sign that the economy is starting to "overheat" (growing too fast to be sustainable), even if it doesn't look like it yet due to temporary factors.
Heading into the meeting and market participants are pricing in around a 97% probability of a rate hold at Wednesdays meeting.
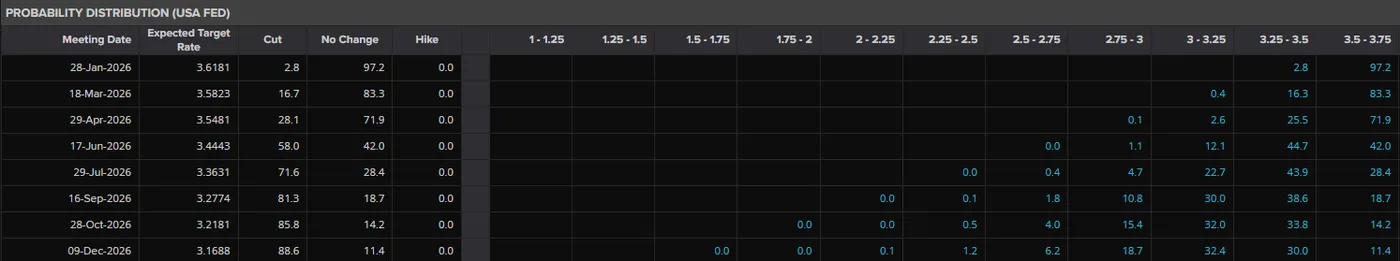
Source: LSEG
The Political Economy of 2026
The January 2026 meeting cannot be analyzed in a vacuum of economic data. It occurs within a "storm" of political pressure that threatens the institutional integrity of the Federal Reserve.
The "Eye of the Storm"
The Rabobank report characterizes the current environment as "In the Eye of the Storm". This metaphor is apt. The "storm" is the friction between President Trump’s administration and the Federal Reserve.
- Executive Pressure: President Trump has increasingly tightened his "grip" on the Fed. His administration explicitly favors lower interest rates to boost growth and reduce the cost of servicing the national debt.
- The "Quartermaster": The report mentions a "quartermaster" named Miran—likely a key economic aide or shadow advisor—who advocated for a 50 basis point cut in December. This reveals the delta between the Fed’s action (25 bps) and the Administration’s desire (50 bps). The pressure is for more easing, faster.
The Powell Subpoena and Exit
Chair Jerome Powell is under siege. He faces a subpoena and a Department of Justice investigation.
- Unprecedented Legal Pressure: Never in modern history has a sitting Fed Chair been subject to such overt legal pressure from the executive branch. This is designed to weaken his standing and force compliance with the low-rate agenda.
- Powell's Response: Powell is expected to be defiant in the press conference, likely stating he has "said all he has to say". However, the psychological toll and the distraction are undeniable.
- The May Transition: Powell’s term as Chair ends on May 15, 2026. This date is the event horizon for monetary policy.
- Scenario A: Powell leaves quietly. Trump appoints a loyalist.
- Scenario B: Powell fights to stay on the Board of Governors (his term as Governor lasts until 2028). Trump has warned that Powell’s life "won't be very happy" if he does this. If Powell stays, he denies Trump a vacancy on the Board, preventing the appointment of a crucial swing vote.
The June Pivot
The forecast for a rate cut in June 2026 is heavily predicated on this political transition. Rabobank explicitly states they have "higher confidence" in a June cut because "this will be the first meeting led by the new Fed Chair".
Implication: The market is pricing in a political reaction function. The expectation is that the new Chair will be appointed with a mandate to cut rates, regardless of whether inflation is 3.0% or GDP is 5.4%. This expectation of a "politicized pivot" is a key driver of the Gold rally and Dollar weakness.
Market Implications for FX
The relationship between US politics and money is changing how the world views different currencies. Right now, the US dollar is on a downward trend for a few key reasons:
Why the Dollar is Weakening
The "Bearish" Case: The U.S. Dollar Index (an indicator of the dollar's strength) has dropped to around 97.00.
Falling Interest Rates: Even though the Federal Reserve (the US central bank) has paused some moves, investors know that interest rates are likely headed lower, potentially down to around 3.0%–3.25% by the end of the year. When interest rates in the US fall while other countries stay steady, the dollar becomes less attractive to market participants..
The "Governance Discount": Market participants are becoming worried about political friction in Washington. Specifically, public disagreements between the White House and the Federal Reserve make people feel the central bank might lose its independence. This makes the dollar seem like a riskier place to keep money.
How Other Currencies Are Reacting
The Euro (EUR/USD): The Euro has climbed to around $1.19. Experts believe it will continue to rise throughout 2026 because European interest rates are becoming more competitive compared to US rates.
The British Pound (GBP/USD): The Pound has reached its highest level in four months, hitting nearly $1.37. This is happening because the global economy seems to be heading for a "soft landing" (slowing down without a major crash), which usually helps the Pound.
The Future of the Dollar
The outlook for the dollar is shaky. If the Federal Reserve appoints a new leader who prefers lower interest rates, the dollar index could fall even further. Currently, the dollar's only real "lifelines" would be a sudden spike in US inflation (which would force rates back up) or a major global crisis that makes people run back to the dollar for safety.
However, with Gold reaching record highs above $5,100, it appears that many investors are now choosing "hard assets" like gold instead of the US dollar when they want to play it safe.
Monetary Policy Outlook
The path for the rest of 2026 is the subject of intense debate among market participants.
The consensus among analysts and market participants (2-3 cuts) is more dovish than the Fed (1 cut). This discrepancy is the source of market volatility. If the Fed sticks to its guns (1 cut), yields will rise, and equities/gold could correct.
If the Fed capitulates (3 cuts), the "melt-up" continues.
There is also the possibility that the Fed may stick to its guns of 1 cut while market participants hold their expectations steady at 2-3 cuts. In such a scenario, the immediate market reaction may be rather muted.
US Dollar Index (DXY) Chart, January 26, 2026
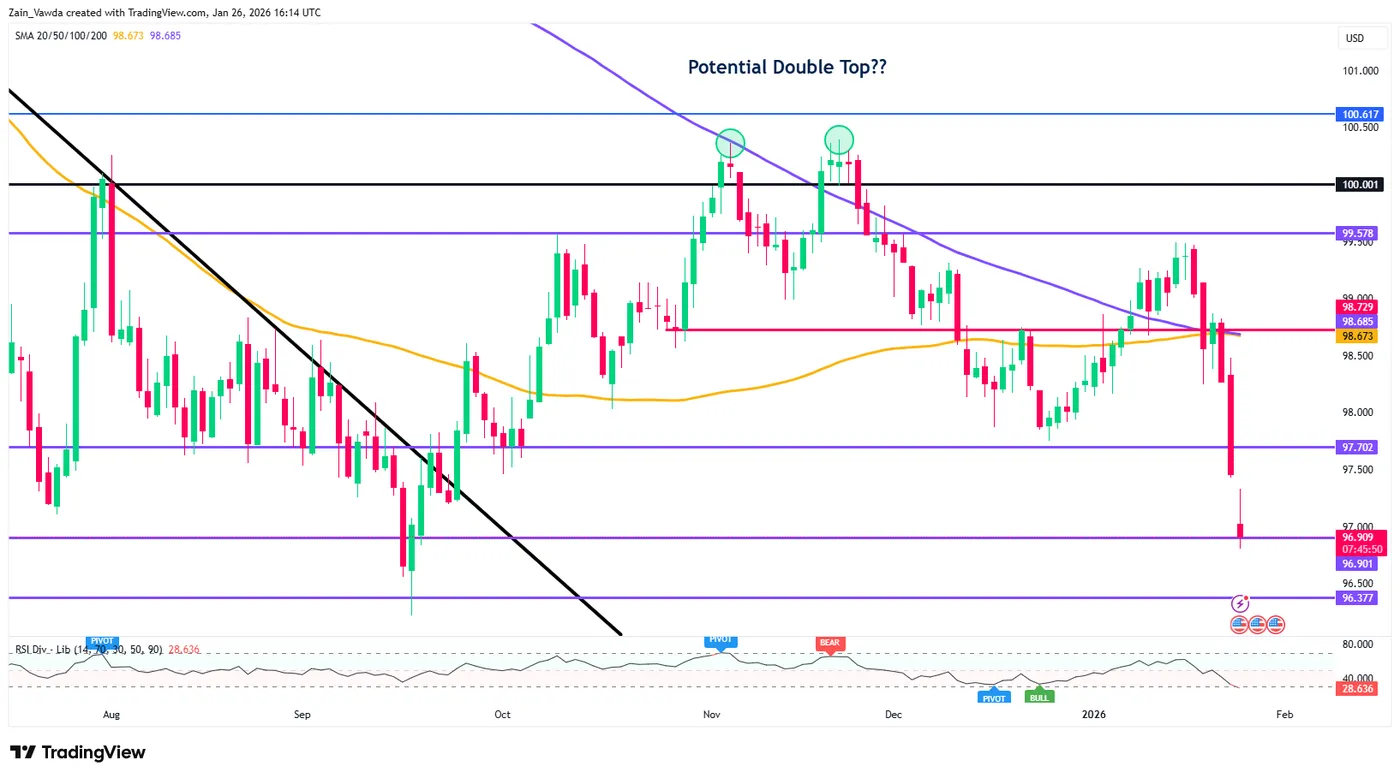
Source: TradingView.Com (click image to enlarge).
Key Levels to Focus On
Support:
- 96.37
- 95.00
- 94.50
Resistance:
- 97.70
- 98.67
- 100.00
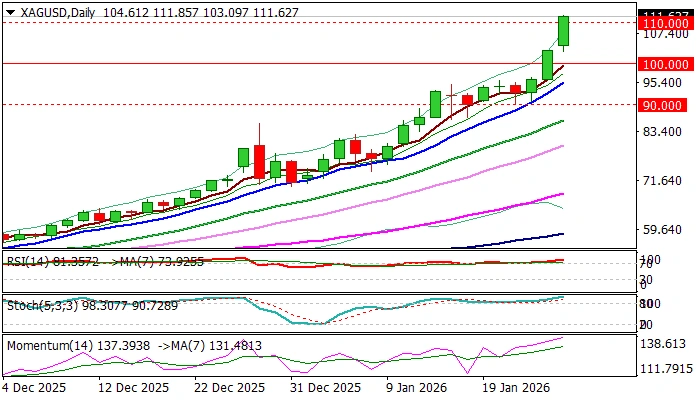
XAG/USD: Silver Accelerates Higher After Friday’s Break of Psychological $100 Level
Silver extends gains above psychological $100 level that was broken on Friday (market closed at $103.23) and hit new all-time high well above $111 on Monday.
Silver was strongly boosted by sharply rising demand for precious metals, strong industrial demand, which faces growing disbalance between demand and supply and weakening dollar, in which the price of metal is expressed.
Silver continues to track gold but has strongly outperformed the yellow metal with its 145% advance in 2025, compared to gold’s 66% gain.
The gold – silver ratio which indicates how many ounces of silver is needed to buy one ounce of gold, currently stands at around 46 (the lowest since Sep 2011) and signals that possession of silver should be converted to gold, although many say that the ratio is not relevant in today’s markets.
Silver made an impressive rally in January by advancing 53% until today (record rise), which adds to firmly bullish structure, but also warns of potential correction, due to overstretched studies on all larger timeframes, but also to the fact that the metal stays in steep and uninterrupted rally for nine consecutive months, which continued to accelerate and showed better performance each month compared to the previous month.
Strong bullish structure eyes sustained break above $110 to remain in play for acceleration towards targets at $115 (round-figure) and $116 (Fibo 138.2% expansion) guarding psychological $120 barrier.
Immediate support lays at $110, followed by 108.40 (hourly higher base), 105.40 (daily Kijun-sen) and 103.09 (daily low) and $100 (broken psychological resistance reverted to strong support, which should contain potential deeper dips and keep larger bulls in play for further gains.
Res: 112.00; 115.00; 116.00; 120.00.
Sup: 110.00; 108.40; 105.40; 103.09.
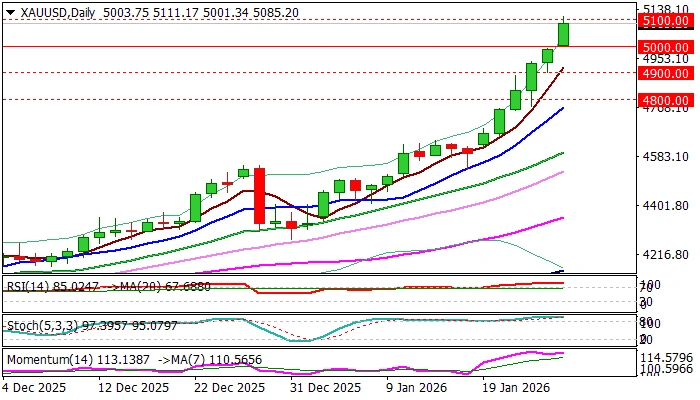
XAU/USD: Gold Surges Through Key $5,000 Barrier and Cracks $5,100
Gold took out $5000 barrier in one single step on Monday, in a widely expected post-weekend action, but made a small surprise to traders by extension to $5100, which happened in just few hours of early Monday’s trading.
The yellow metal started trading with a gap higher and opened slightly above $5K following news over the weekend that added to strong bullish stance.
Growing signals about potential US attack on Iran contributed to strong migration into safety, also fueled by overall geopolitical situation being close to boiling point, weakening economic outlook with signs of deeper crisis on horizon, growing political and economic tensions between the US and EU (Greenland, tariffs) deteriorating situation in Ukraine (no big hopes from current peace talks), fragile situation in the Middle East region and strong demand for gold from investors and central banks.
This leaves very little space for any significant correction despite strongly overbought studies (daily / weekly / monthly) as traders do not dare to take profits on rallying market.
Overall picture remains firmly bullish from both technical and fundamental aspects, though fundamentals remain key driver, suggesting that the price could rise much more if current conditions deteriorate or at least stay unchanged.
Today’s close above $5000 is a minimum requirement to keep bulls intact for further advance, with clear break of $5100 to confirm bullish continuation.
The price is riding on an extended third wave of five-wave cycle from $3997 (Nov 18 higher low), with cracked round figure $5100 and session high / new all-time high at $5111, marking immediate resistances, followed by $5172 (Fibo 161.8% expansion), $5200 (round-figure) and $5253 (Fibo 176.4% expansion).
Minor support lays at $5050 (intraday low) followed by $5039 (20HMA) and the most significant psychological $5000 level (broken key resistance, reverted to strong support, also daily low) where extended dips should find firm ground.
Current structure favors very limited profit taking, with limited dips to mark consolidation and positioning for further upside.
Res: 5111; 5172; 5200; 5253.
Sup: 5040; 5000; 4965; 4937.
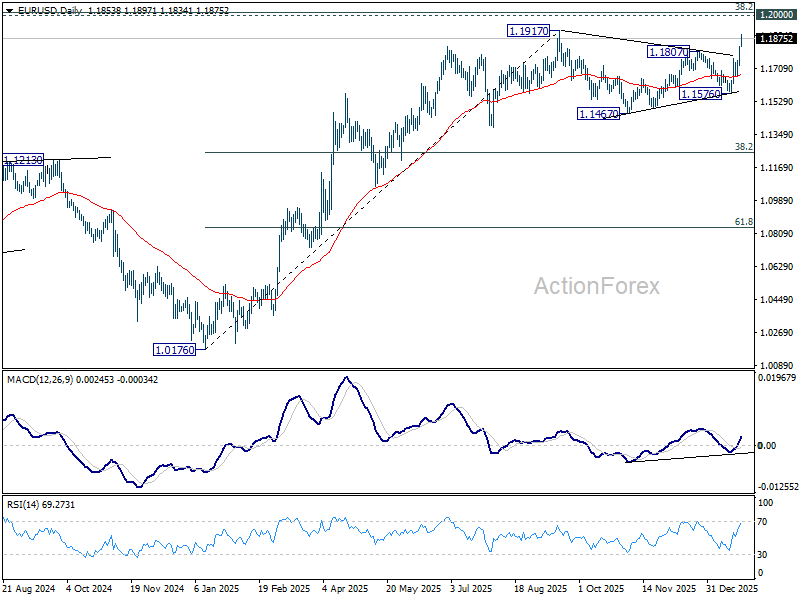
EUR/USD Mid-Day Outlook
Daily Pivots: (S1) 1.1760; (P) 1.1797; (R1) 1.1866; More….
EUR/USD's rally continues today and intraday bias stays on the upside for 1.1917 key resistance. Firm break there will resume larger up trend. On the downside, below 1.1812 minor support will mix up the outlook and turn intraday bias neutral again.
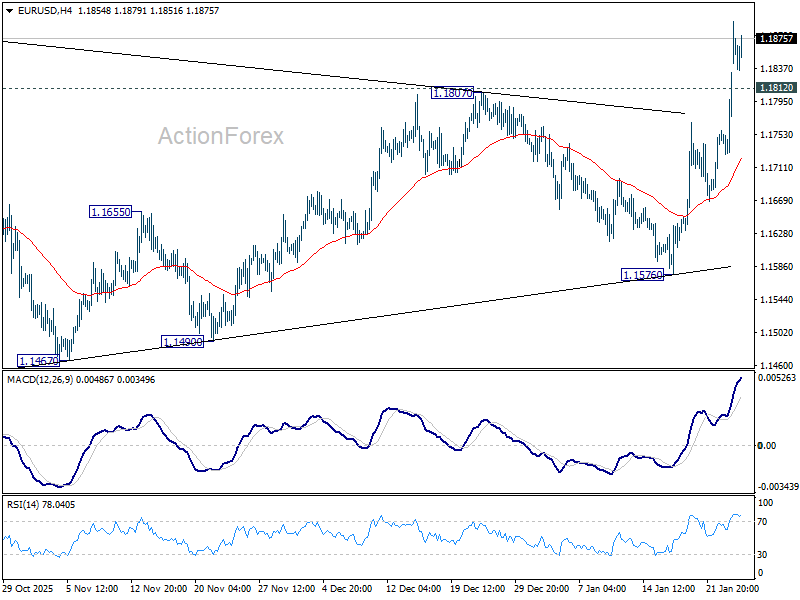
In the bigger picture, as long as 55 W EMA (now at 1.1443) holds, up trend from 0.9534 (2022 low) is still in favor to continue. Decisive break of 1.2 key psychological level will carry larger bullish implication. However, sustained trading below 55 W EMA will argue that rise from 0.9534 has completed as a three wave corrective bounce, and keep long term outlook bearish.
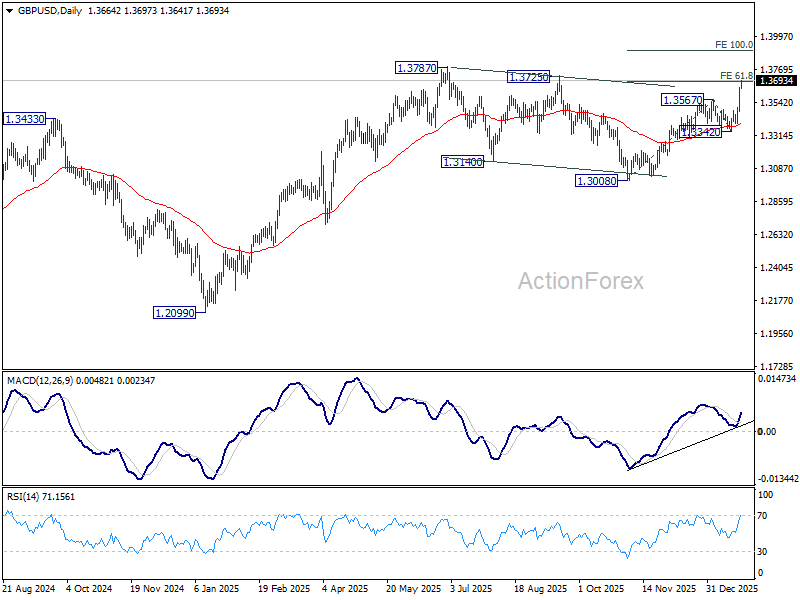
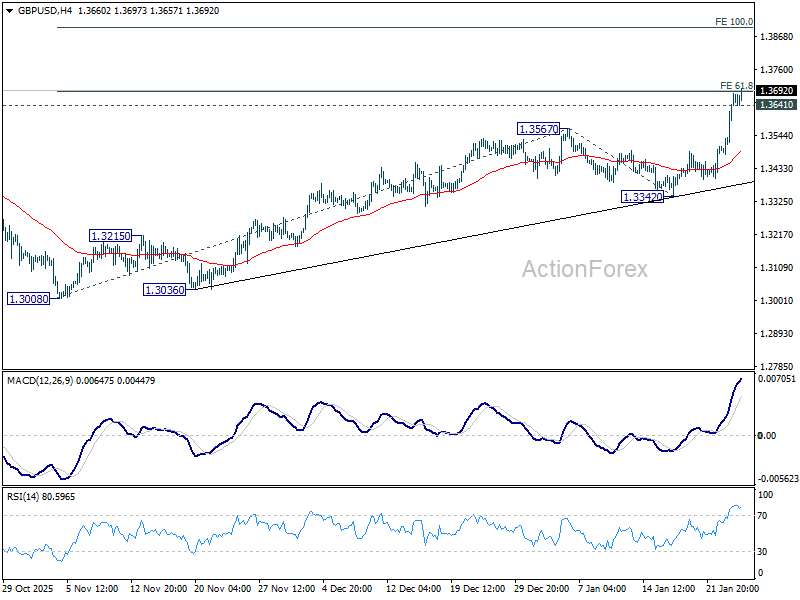
GBP/USD Mid-Day Outlook
Daily Pivots: (S1) 1.3534; (P) 1.3590; (R1) 1.3698; More...
Intraday bias in GBP/USD remains on the upside for the moment. Sustained trading above 61.8% projection of 1.3008 to 1.3567 from 1.3342 at 1.3687 should prompt upside acceleration through 1.3787 high to 100% projection at 1.3901. On the downside, below 1.3641 minor support will turn intraday bias neutral. But retreat should be contained well above 1.3342 support to bring another rally.
In the bigger picture, price actions from 1.3787 (2025 high) are seen as a correction to the larger up trend from 1.3051 (2022 low). That might have completed at 1.3008 already. Firm break of 1.3787 will confirm up trend resumption. Next target is 1.4284 key resistance (2021 high). This will remain the favored case as long as 1.3008 support holds.